100,000+ A workplace effectiveness report - Leesman...
32
Lmi 59.9 100,000+ A workplace effectiveness report New York | London | Amsterdam | Stockholm | Melbourne | Sydney
Transcript of 100,000+ A workplace effectiveness report - Leesman...

Lmi 59.9
100,000+ A workplace effectiveness report
New York | London | Amsterdam | Stockholm | Melbourne | Sydney
2
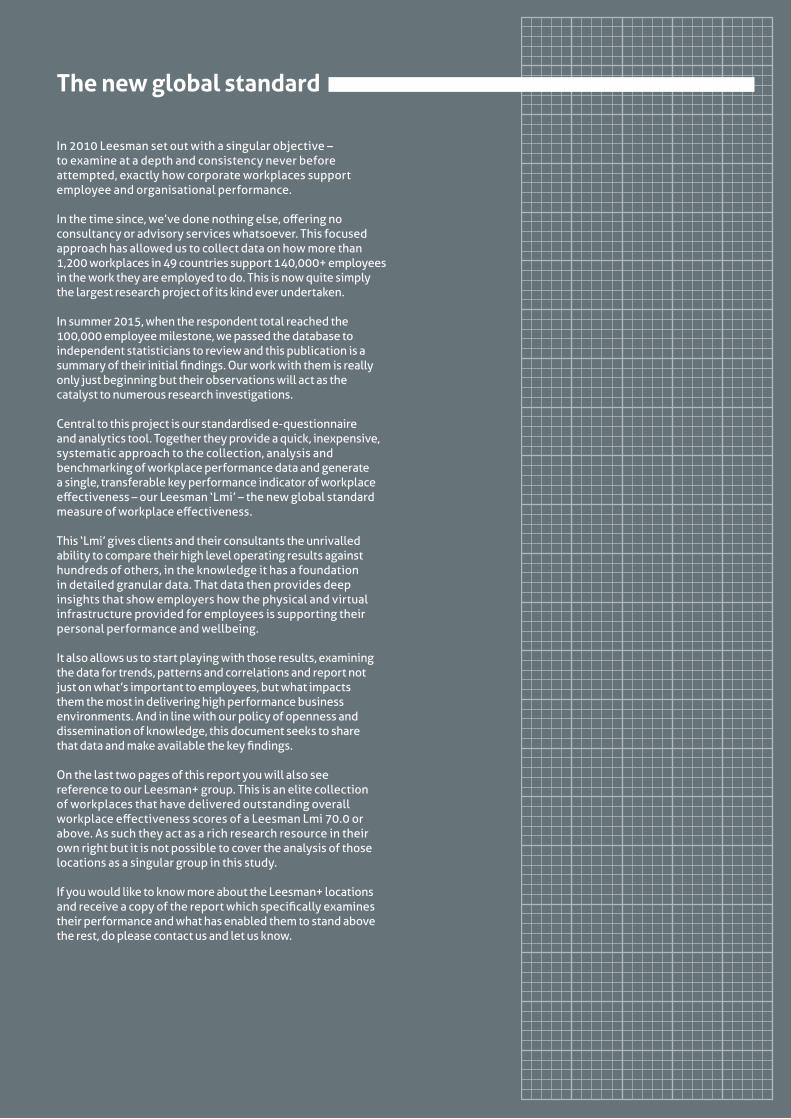
In 2010 Leesman set out with a singular objective – to examine at a depth and consistency never before attempted, exactly how corporate workplaces support employee and organisational performance.
In the time since, we’ve done nothing else, offering no consultancy or advisory services whatsoever. This focused approach has allowed us to collect data on how more than 1,200 workplaces in 49 countries support 140,000+ employees in the work they are employed to do. This is now quite simply the largest research project of its kind ever undertaken.
In summer 2015, when the respondent total reached the 100,000 employee milestone, we passed the database to independent statisticians to review and this publication is a summary of their initial findings. Our work with them is really only just beginning but their observations will act as the catalyst to numerous research investigations.
Central to this project is our standardised e-questionnaire and analytics tool. Together they provide a quick, inexpensive, systematic approach to the collection, analysis and benchmarking of workplace performance data and generate a single, transferable key performance indicator of workplace effectiveness – our Leesman ‘Lmi’ – the new global standard measure of workplace effectiveness.
This ‘Lmi’ gives clients and their consultants the unrivalled ability to compare their high level operating results against hundreds of others, in the knowledge it has a foundation in detailed granular data. That data then provides deep insights that show employers how the physical and virtual infrastructure provided for employees is supporting their personal performance and wellbeing.
It also allows us to start playing with those results, examining the data for trends, patterns and correlations and report not just on what’s important to employees, but what impacts them the most in delivering high performance business environments. And in line with our policy of openness and dissemination of knowledge, this document seeks to share that data and make available the key findings.
On the last two pages of this report you will also see reference to our Leesman+ group. This is an elite collection of workplaces that have delivered outstanding overall workplace effectiveness scores of a Leesman Lmi 70.0 or above. As such they act as a rich research resource in their own right but it is not possible to cover the analysis of those locations as a singular group in this study.
If you would like to know more about the Leesman+ locations and receive a copy of the report which specifically examines their performance and what has enabled them to stand above the rest, do please contact us and let us know.
The new global standard

3
Foreword 4
Within the Leesman data is the opportunity to change the way organisations look at workplace
The Leesman Index model 5
A brief overview of the methodology used to collect employee workplace effectiveness data
Research 6
Summarising the research and highlighting the key findings from each section
Data diversity 8
Looking at the depth and diversity of the data collected since the deployment of the first survey in 2010
Impact of age 10
Reviewing the impact of employee age on workplace experience and effectiveness
Impact of time 14
Reviewing the impact of employee length of service on workplace experience and effectiveness
Impact of work setting 18
Reviewing the impact of employee work setting on workplace experience and effectiveness
Impact of activities undertaken 22
Reviewing the impact of employee activity profile on workplace experience and effectiveness
Impact code 28
A review of the data across the entire database, with importance, satisfaction and impact coding
Table of contents
4
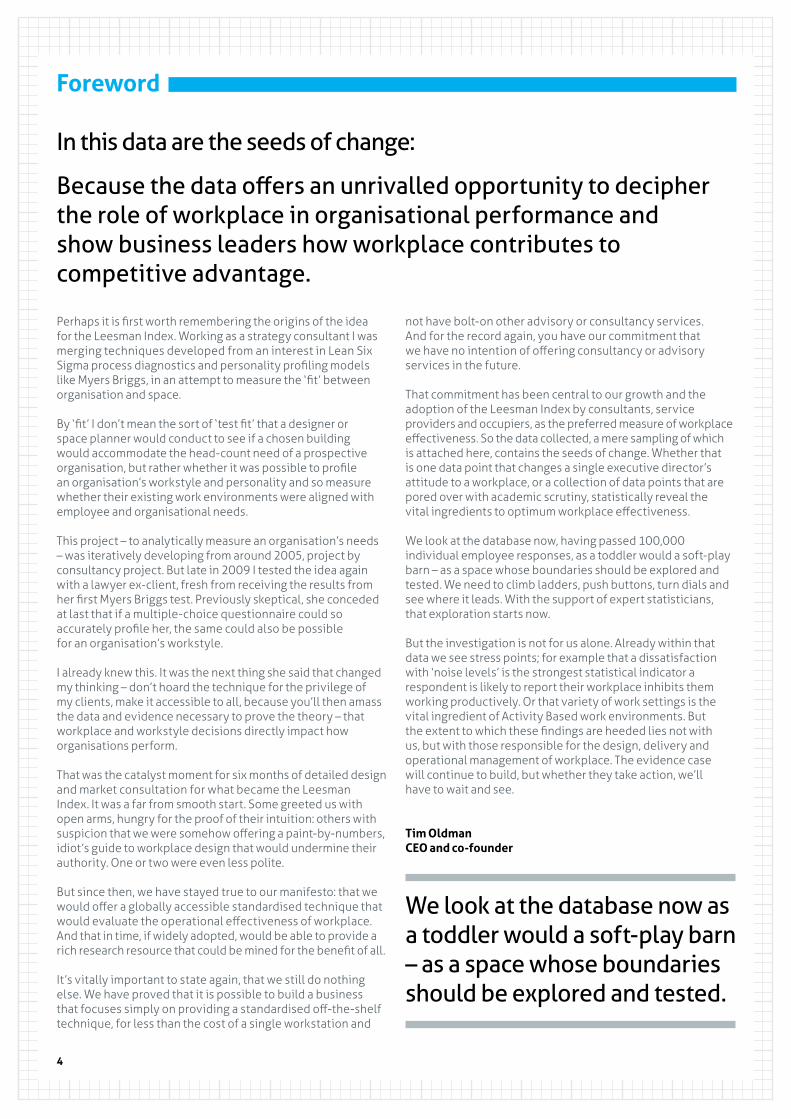
Foreword
Perhaps it is first worth remembering the origins of the idea for the Leesman Index. Working as a strategy consultant I was merging techniques developed from an interest in Lean Six Sigma process diagnostics and personality profiling models like Myers Briggs, in an attempt to measure the ‘fit’ between organisation and space.
By ‘fit’ I don’t mean the sort of ‘test fit’ that a designer or space planner would conduct to see if a chosen building would accommodate the head-count need of a prospective organisation, but rather whether it was possible to profile an organisation’s workstyle and personality and so measure whether their existing work environments were aligned with employee and organisational needs.
This project – to analytically measure an organisation’s needs – was iteratively developing from around 2005, project by consultancy project. But late in 2009 I tested the idea again with a lawyer ex-client, fresh from receiving the results from her first Myers Briggs test. Previously skeptical, she conceded at last that if a multiple-choice questionnaire could so accurately profile her, the same could also be possible for an organisation’s workstyle.
I already knew this. It was the next thing she said that changed my thinking – don’t hoard the technique for the privilege of my clients, make it accessible to all, because you’ll then amass the data and evidence necessary to prove the theory – that workplace and workstyle decisions directly impact how organisations perform.
That was the catalyst moment for six months of detailed design and market consultation for what became the Leesman Index. It was a far from smooth start. Some greeted us with open arms, hungry for the proof of their intuition: others with suspicion that we were somehow offering a paint-by-numbers, idiot’s guide to workplace design that would undermine their authority. One or two were even less polite.
But since then, we have stayed true to our manifesto: that we would offer a globally accessible standardised technique that would evaluate the operational effectiveness of workplace. And that in time, if widely adopted, would be able to provide a rich research resource that could be mined for the benefit of all.
It’s vitally important to state again, that we still do nothing else. We have proved that it is possible to build a business that focuses simply on providing a standardised off-the-shelf technique, for less than the cost of a single workstation and
not have bolt-on other advisory or consultancy services. And for the record again, you have our commitment that we have no intention of offering consultancy or advisory services in the future.
That commitment has been central to our growth and the adoption of the Leesman Index by consultants, service providers and occupiers, as the preferred measure of workplace effectiveness. So the data collected, a mere sampling of which is attached here, contains the seeds of change. Whether that is one data point that changes a single executive director’s attitude to a workplace, or a collection of data points that are pored over with academic scrutiny, statistically reveal the vital ingredients to optimum workplace effectiveness.
We look at the database now, having passed 100,000 individual employee responses, as a toddler would a soft-play barn – as a space whose boundaries should be explored and tested. We need to climb ladders, push buttons, turn dials and see where it leads. With the support of expert statisticians, that exploration starts now.
But the investigation is not for us alone. Already within that data we see stress points; for example that a dissatisfaction with ‘noise levels’ is the strongest statistical indicator a respondent is likely to report their workplace inhibits them working productively. Or that variety of work settings is the vital ingredient of Activity Based work environments. But the extent to which these findings are heeded lies not with us, but with those responsible for the design, delivery and operational management of workplace. The evidence case will continue to build, but whether they take action, we’ll have to wait and see.
Tim OldmanCEO and co-founder
In this data are the seeds of change:
Because the data offers an unrivalled opportunity to decipher the role of workplace in organisational performance and show business leaders how workplace contributes to competitive advantage.
We look at the database now as a toddler would a soft-play barn – as a space whose boundaries should be explored and tested.

5
The Leesman Index model
The Leesman Index survey has been deployed now across 1,200+ workplaces in over 50 countries and 29 languages. The diversity of the data collected gets wider by the week as we work with leading global organisations as part of major capital projects, on estate-wide baseline evaluations, or for ongoing healthchecks of property performance.
Central to that technique is a standardised e-questionnaire that examines what employees are doing and how the physical and virtual infrastructure supports them doing it. The Leesman Lmi key performance indicator is calculated from the Design Impact and the Activities Analysis questions and should therefore be seen as a test of the ability of a workplace to support the needs of employees – its operational effectiveness or fitness for purpose.
Design Impact Analysis – how much do you agree or disagree with the following statements about the overall design of your organisation’s current workspace?
Activity Analysis – which activities are important to you in your work and how well is each supported?
Physical Features Analysis – which physical features do you consider to be an important part of an effective workspace and how satisfied are you with each?
Service Features Analysis – which service features do you consider to be an important part of an effective workspace and how satisfied are you with each?
This publication aims to offer an initial examination of that data and provide key statistics and findings for your review.
Responses analysed 140,000+
Workplaces surveyed 1,200+
LeesmanLmi
Activities
Physicalfeatures
Servicesfeatures
Designimpact
11 minuteemployee
questionnaire
+ =
Research
The analysis was undertaken by Stockholm-based independent statisticians Formulate with a brief from us to find areas within the data where statistically relevant differences were occurring. Our aim? To help identify the subjects or topics where those responsible for the design and management of workplaces can have the greatest impact on an employee’s ability to work effectively. In doing so we believe that we can dramatically increase the understanding of the role of workplace environment in organisational performance. Key areas of this initial investigation included;
• Gender• Age • Time with organisation• Employee work setting• Employee activity profile
Gender – Overwhelmingly, we find the overall effectiveness score (Leesman Lmi) of employee work environments for male and female employees to be almost exactly equal. Even within the work environments of industries or businesses where one might more readily expect there to be marked disparities – say in industrial manufacturing – it is rare to find statistically relevant differences. This is counter to much popular-press hypothesis but points increasingly to organisational culture as opposed to the physical environment as the presenting the greater influence on any gender inequality.
Age range – When it comes to age range, we do start to see greater differences – not in terms of the overall effectiveness of their work environments, but in relation to the profile (including volume) of activities undertaken and the importance attached to specific physical and service features used. However, it is important not to confuse or miss-label age related differences as generational differences. These variances are most often explained by accumulated responsibility, experience, seniority or life stage of the individual, and not the generation he or she is born into.
Time with organisation – As with Age, Time with organisation shows greater differences. There is a consistent lowering of overall effectiveness score of employee work environments (Leesman Lmi) as length of services increases. However, the profile of activities undertaken and the importance attached to specific physical and service features used is less divergent than the differences seen related to age.
Employee work setting – When considering the impact of work setting on employee effectiveness it is interesting to see how employee priorities change (the importance attached to different activities and to individual physical / service features). But what is of greatest interest is if we consider the impact of “variety” on those employees who are not working at a designated work setting. The analysis shows overwhelmingly the positive impact of providing employees with a high variety of different work settings.
Employee activity profile – This is the area within the database where we see the greatest statistical differences. As mentioned prior, Age Range does have a bearing here, with the number of activities undertaken by an employee typically increasing with age. But what is dramatically different, is the likelihood of selecting certain physical or service features as important, based on an increase in the complexity of activities undertaken.
These latter findings associated with “activity profile complexity” have major implications for any organisation considering an “Activity Based Working” programme. The data shows that 46% of employees select 11 or more activities (out of a possible 21) as important to them in their roles and as that number increases, so too dramatically does their likelihood of selecting “variety of different types of workspace” as an important physical feature within the workplace.
This reliance on variety increases dramatically for those with the most complex work activity profiles (those selecting 16 or more activities as important in their work from a possible 21). This group represent 22% of the sample so forms a significant proportion of the working population.
It is worth stating, though perhaps more predictably, that “meeting rooms” (large and small) and “accessibility of colleagues” attract similar levels of increased importance as activity profile complexity increases. But less obviously perhaps, worth considering how the importance attached to workplace basics like a desk, chair, toilet facilities or restaurant and canteen facilities are almost unaffected by activity complexity.
However, in a time when more and more organisations focus on the organisational performance value of collaboration, it is also worth highlighting how space away from the desk becomes mission critical in increasing employee interaction, with “accessibility of colleagues”, “small meeting rooms”, “informal work areas and breakout zones” and once again “variety of different types of workspace” statistically prominent in their importance.
Findings in brief:
In the following pages you will see the first independent statistical analysis of the largest employee workplace effectiveness dataset of its kind, reviewing the experience of 100,000+ employees.
6
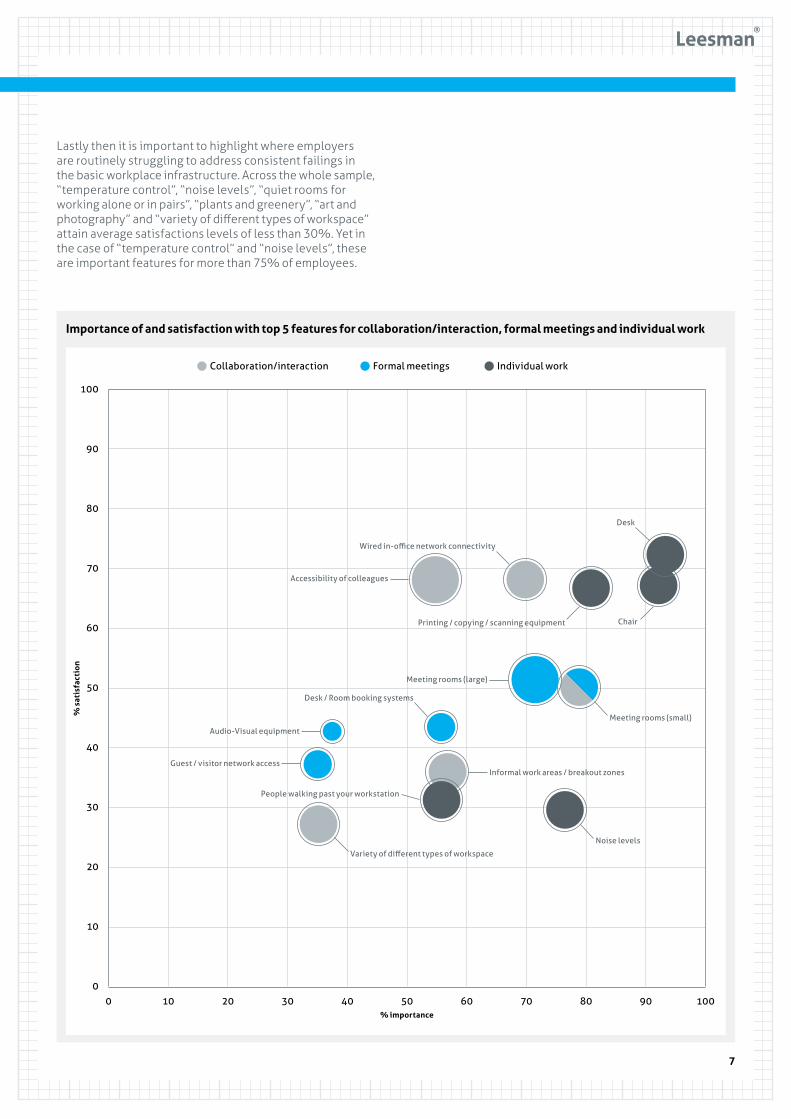
Lastly then it is important to highlight where employers are routinely struggling to address consistent failings in the basic workplace infrastructure. Across the whole sample, “temperature control”, “noise levels”, “quiet rooms for working alone or in pairs”, “plants and greenery”, “art and photography” and “variety of different types of workspace” attain average satisfactions levels of less than 30%. Yet in the case of “temperature control” and “noise levels”, these are important features for more than 75% of employees.
7
Importance of and satisfaction with top 5 features for collaboration/interaction, formal meetings and individual work
% importance
90
80
70
60
50
40
30
20
10
100 20 30 40 50 60 70 80 90 1000
% s
atis
fact
ion
Informal work areas / breakout zones
Wired in-office network connectivity
Meeting rooms (small)
Chair
Noise levels
Variety of different types of workspace
Meeting rooms (large)
Desk / Room booking systems
People walking past your workstation
Audio-Visual equipment
Guest / visitor network access
Printing / copying / scanning equipment
Collaboration/interaction Formal meetings Individual work
100
Accessibility of colleagues
Desk
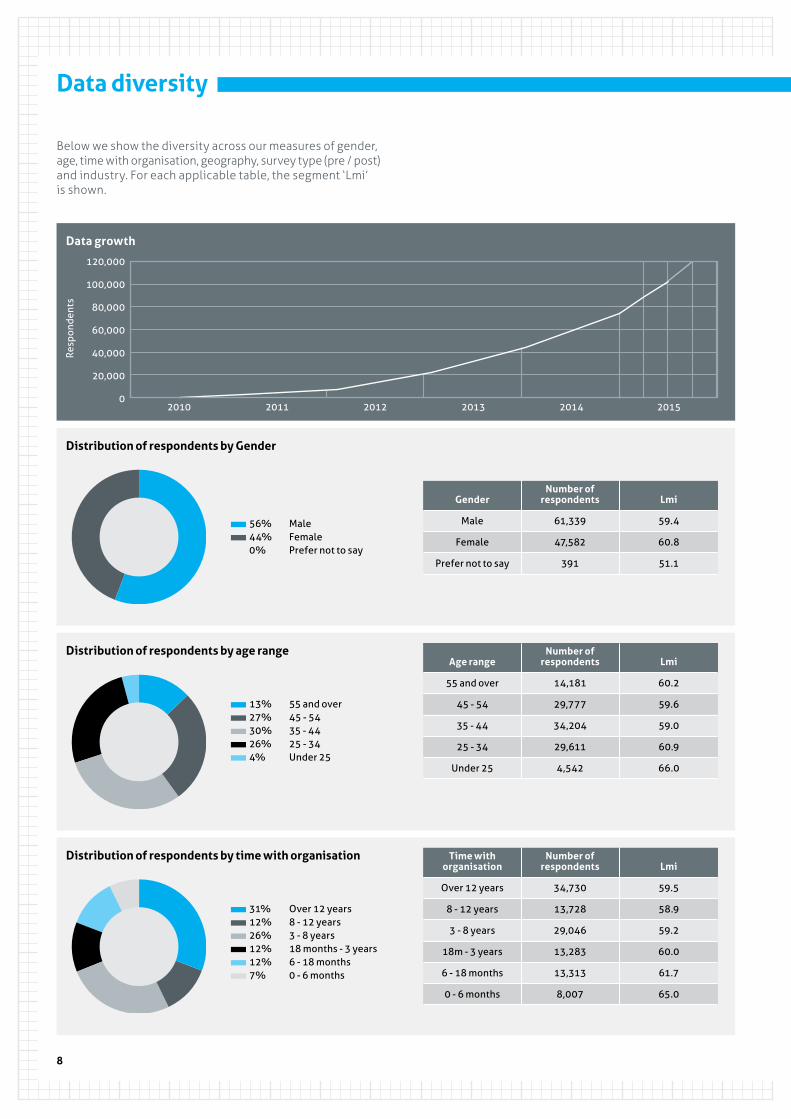
Data diversity
Below we show the diversity across our measures of gender, age, time with organisation, geography, survey type (pre / post) and industry. For each applicable table, the segment ‘Lmi’ is shown.
Distribution of respondents by Gender
56% Male44% Female0% Prefer not to say
Gender
Male
Female
Prefer not to say
Number of respondents
61,339
47,582
391
Lmi
59.4
60.8
51.1
Data growth
Resp
onde
nts
2010 20122011 2013 2014 2015
20,000
100,000
80,000
60,000
40,000
120,000
0
Distribution of respondents by age range
13% 55 and over27% 45 - 5430% 35 - 4426% 25 - 344% Under 25
Age range
55 and over
45 - 54
35 - 44
25 - 34
Under 25
Number of respondents
14,181
29,777
34,204
29,611
4,542
Lmi
60.2
59.6
59.0
60.9
66.0
Distribution of respondents by time with organisation
31% Over 12 years12% 8 - 12 years26% 3 - 8 years12% 18 months - 3 years12% 6 - 18 months7% 0 - 6 months
Time with organisation
Over 12 years
8 - 12 years
3 - 8 years
18m - 3 years
6 - 18 months
0 - 6 months
Number of respondents
34,730
13,728
29,046
13,283
13,313
8,007
Lmi
59.5
58.9
59.2
60.0
61.7
65.0
8
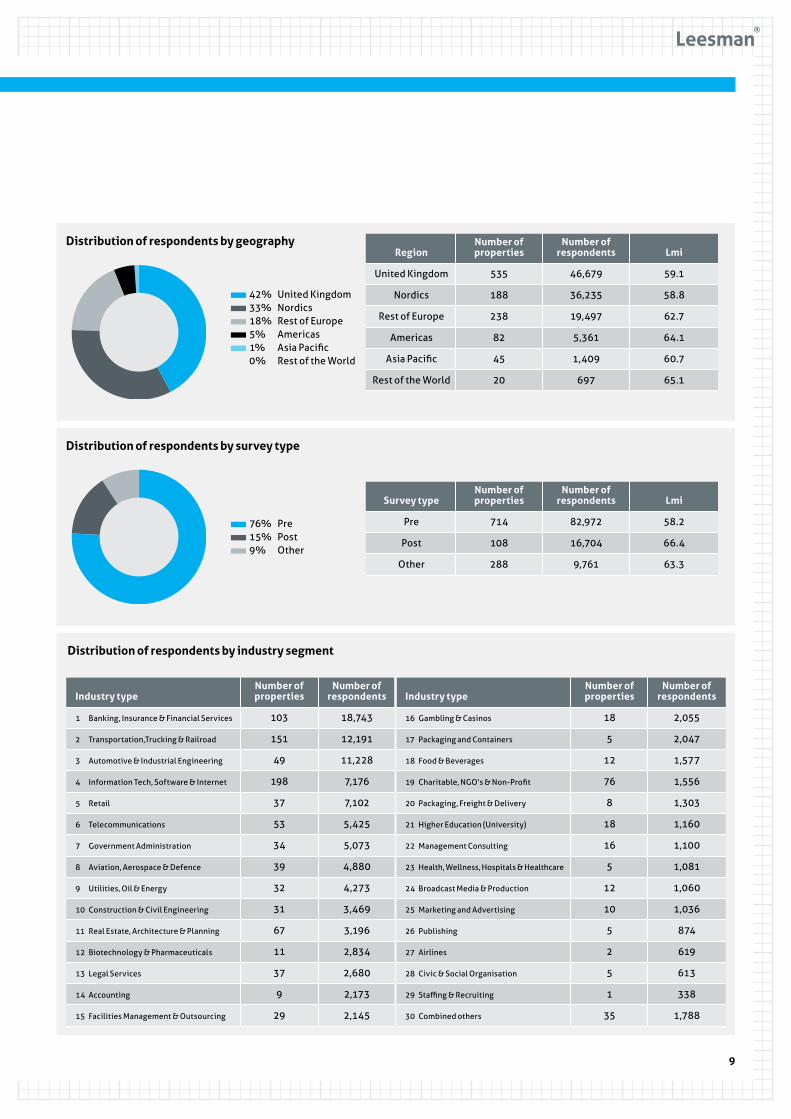
Distribution of respondents by geography
42% United Kingdom33% Nordics18% Rest of Europe5% Americas1% Asia Pacific0% Rest of the World
Number of properties
535
188
238
82
45
20
Region
United Kingdom
Nordics
Rest of Europe
Americas
Asia Pacific
Rest of the World
Number of respondents
46,679
36,235
19,497
5,361
1,409
697
Lmi
59.1
58.8
62.7
64.1
60.7
65.1
Distribution of respondents by industry segment
Industry type
1 Banking, Insurance & Financial Services
2 Transportation,Trucking & Railroad
3 Automotive & Industrial Engineering
4 Information Tech, Software & Internet
5 Retail
6 Telecommunications
7 Government Administration
8 Aviation, Aerospace & Defence
9 Utilities, Oil & Energy
10 Construction & Civil Engineering
11 Real Estate, Architecture & Planning
12 Biotechnology & Pharmaceuticals
13 Legal Services
14 Accounting
15 Facilities Management & Outsourcing
Industry type
16 Gambling & Casinos
17 Packaging and Containers
18 Food & Beverages
19 Charitable, NGO’s & Non-Profit
20 Packaging, Freight & Delivery
21 Higher Education (University)
22 Management Consulting
23 Health, Wellness, Hospitals & Healthcare
24 Broadcast Media & Production
25 Marketing and Advertising
26 Publishing
27 Airlines
28 Civic & Social Organisation
29 Staffing & Recruiting
30 Combined others
Number of respondents
18,743
12,191
11,228
7,176
7,102
5,425
5,073
4,880
4,273
3,469
3,196
2,834
2,680
2,173
2,145
Number of properties
103
151
49
198
37
53
34
39
32
31
67
11
37
9
29
Number of properties
18
5
12
76
8
18
16
5
12
10
5
2
5
1
35
Distribution of respondents by survey type
76% Pre15% Post9% Other
Number of properties
714
108
288
Survey type
Pre
Post
Other
Number of respondents
82,972
16,704
9,761
Lmi
58.2
66.4
63.3
Number of respondents
2,055
2,047
1,577
1,556
1,303
1,160
1,100
1,081
1,060
1,036
874
619
613
338
1,788
9
10
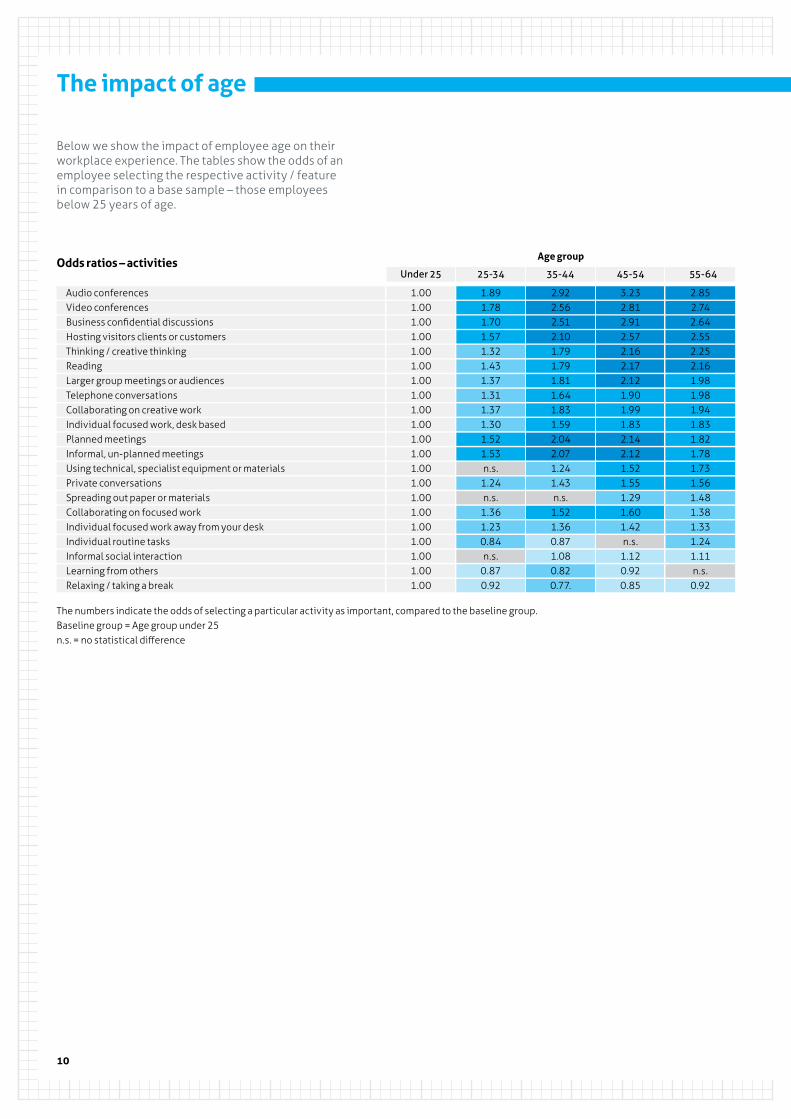
The impact of age
Below we show the impact of employee age on their workplace experience. The tables show the odds of an employee selecting the respective activity / feature in comparison to a base sample – those employees below 25 years of age.
Audio conferencesVideo conferencesBusiness confidential discussionsHosting visitors clients or customersThinking / creative thinkingReadingLarger group meetings or audiencesTelephone conversationsCollaborating on creative workIndividual focused work, desk basedPlanned meetingsInformal, un-planned meetingsUsing technical, specialist equipment or materialsPrivate conversationsSpreading out paper or materialsCollaborating on focused workIndividual focused work away from your deskIndividual routine tasksInformal social interactionLearning from othersRelaxing / taking a break
2.852.742.642.552.252.161.981.981.941.831.821.781.731.561.481.381.331.241.11n.s.0.92
2.922.562.512.101.791.791.811.641.831.592.042.071.241.43n.s.1.521.360.871.080.820.77.
3.232.812.912.572.162.172.121.901.991.832.142.121.521.551.291.601.42n.s.
1.120.920.85
1.891.781.701.571.321.431.371.311.371.301.521.53n.s.
1.24n.s.
1.361.230.84n.s.
0.870.92
1.001.001.001.001.001.001.001.001.001.001.001.001.001.001.001.001.001.001.001.001.00
Odds ratios – activities
The numbers indicate the odds of selecting a particular activity as important, compared to the baseline group. Baseline group = Age group under 25n.s. = no statistical difference
55-64
Age group
35-44 45-5425-34
Under 25

11
Noise levelsToilets / W.C.Air qualityOffice lightingInternal signageAccessibility of colleagues Dividers (between desks areas)Health and safety provisions Tea, coffee and other refreshment facilitiesArchive storage Printing / copying / scanning equipmentAccess (e.g. lifts, stairways, ramps etc.)General cleanlinessPeople walking past your workstationWired in-office network connectivityGeneral tidinessQuiet rooms for working alone or in pairsParking (car, motorbike or bicycle) Computing equipment, mobile (laptop, tablet etc.)Space between work settingsTelephone equipmentMeeting rooms (small)Guest visitor network accessAudio-Visual equipmentDeskPersonal storagePlants & GreeneryAtriums and Communal AreasHospitality servicesSecurity Art & PhotographyGeneral DécorNatural lightMail & post room servicesRemote access to work files or networkTemperature controlReception areas Meeting rooms (large)ChairComputing equipment (fixed desktop)Restaurant / canteenVariety of different types of workspaceLeisure facilities onsite or nearbyShower facilitiesShared storageDesk Room / booking systemsWiFi network connectivity in the officeIT Service / Help deskAbility to personalise my workstationInformal work areas / breakout zones
2.422.212.202.102.001.981.771.741.731.671.671.581.551.501.501.461.431.411.391.371.361.351.291.271.261.261.251.251.221.201.191.181.181.161.161.151.141.11n.s.n.s.n.s.n.s.n.s.n.s.n.s.n.s.n.s.n.s.
0.830.76
1.531.451.431.171.281.261.41n.s.
1.29n.s.n.s.
0.89n.s.
1.271.38n.s.
1.411.481.331.19n.s.
1.261.201.30n.s.0.921.081.11n.s.
0.81n.s.0.92n.s.0.781.480.88n.s.n.s.n.s.
0.89n.s.n.s.
1.09n.s.0.931.10n.s.n.s.0.72n.s.
2.111.781.821.641.621.661.611.441.441.291.221.151.241.431.501.221.491.571.351.271.241.341.311.31n.s.n.s.
1.141.221.10n.s.n.s.n.s.
1.13n.s.
1.37n.s.
1.121.16n.s.n.s.n.s.n.s.n.s.n.s.n.s.
1.15n.s.n.s.0.750.91
1.221.141.16n.s.
1.08n.s.
1.250.931.12n.s.
0.880.89n.s.
1.141.160.881.211.071.121.12n.s.1.10n.s.
1.14n.s.n.s.
1.08n.s.n.s.0.79n.s.
0.87n.s.
0.861.310.87n.s.n.s.n.s.n.s.n.s.n.s.1.11n.s.n.s.
1.08n.s.n.s.
0.81n.s.
1.001.001.001.001.001.001.001.001.001.001.001.001.001.001.001.001.001.001.001.001.001.001.001.001.001.001.001.001.001.001.001.001.001.001.001.001.001.001.001.001.001.001.001.001.001.001.001.001.001.00
Odds ratios – features
The numbers indicate the odds of selecting a particular feature as important, compared to the baseline group. Baseline group = Age group under 25n.s. = no statistical difference
Age group
55-6435-44 45-5425-34
Under 25

12
The impact of age
Below we again show the impact of employee age on their workplace experience. These charts report on the raw ‘agreement’ and ‘importance’ percentages and graphically illustrate the differences between the five demographic groups.
Design impact by age
The design of my workspace is important to me
It creates an enjoyable environment to work in
It enables me to work productively
It contributes to a sense of community at work
It’s a place I’m proud to bring visitors to
100
90
80
70
60
50
40
30
20
10
0
Under 25 45-5425-34 55 or over35-44
% a
gree
men
t
Importance of activities by age
Indi
vidu
al fo
cuse
d w
ork,
de
sk b
ased
Indi
vidu
al ro
utin
e ta
sks
Col
labo
rati
ng o
n fo
cuse
d w
ork
Busi
ness
con
fiden
tial
di
scus
sion
s
Priv
ate
conv
ersa
tion
s
Tele
phon
e co
nver
sati
ons
Lear
ning
from
oth
ers
Rela
/ ta
king
a b
reak
Spre
adin
g ou
t pap
er o
r mat
eria
ls
Indi
vidu
al fo
cuse
d w
ork
away
fr
om y
our d
esk
Plan
ned
mee
ting
s
Info
rmal
soc
ial i
nter
acti
on
Read
ing
Hos
ting
vis
itor
s, c
lient
s or
cus
tom
ers
Larg
er g
roup
mee
ting
s or
aud
ienc
es
Info
rmal
, un-
plan
ned
mee
ting
s
Audi
o co
nfer
ence
s
Thin
king
/ cr
eati
ve th
inki
ng
Col
labo
rati
ng o
n cr
eati
ve w
ork
Vid
eo c
onfe
renc
es
Usi
ng te
chni
cal /
spe
cial
ist
equi
pmen
t or m
ater
ials
100
90
80
70
60
50
40
30
20
10
0
Under 25 45-5425-34 55 or over35-44
% im
por
tanc
e
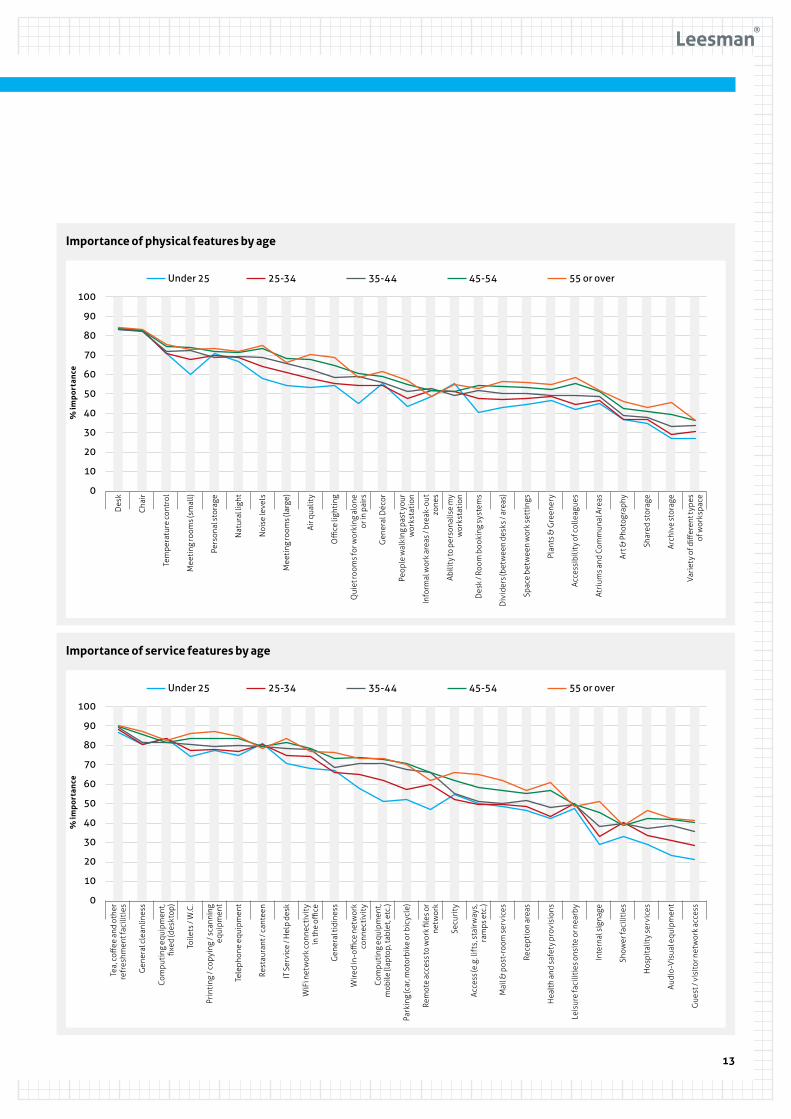
13
Importance of physical features by age
Des
k
Cha
ir
Tem
pera
ture
con
trol
Mee
ting
room
s (sm
all)
Pers
onal
sto
rage
Nat
ural
ligh
t
Noi
se le
vels
Mee
ting
room
s (la
rge)
Air q
ualit
y
Offi
ce li
ghti
ng
Qui
et ro
oms f
or w
orki
ng a
lone
or
in p
airs
Gen
eral
Déc
or
Peop
le w
alki
ng p
ast y
our
wor
ksta
tion
Info
rmal
wor
k ar
eas /
bre
ak-o
ut
zone
s
Abi
lity
to p
erso
nalis
e m
y w
orks
tati
on
Des
k / R
oom
boo
king
sys
tem
s
Div
ider
s (be
twee
n de
sks /
are
as)
Spac
e be
twee
n w
ork
sett
ings
Plan
ts &
Gre
ener
y
Acce
ssib
ility
of c
olle
ague
s
Atri
ums a
nd C
omm
unal
Are
as
Art
& P
hoto
grap
hy
Shar
ed s
tora
ge
Arc
hive
sto
rage
Vari
ety
of d
iffer
ent t
ypes
of
wor
kspa
ce
100
90
80
70
60
50
40
30
20
10
0
Importance of service features by age
Tea,
coff
ee a
nd o
ther
re
fres
hmen
t fac
iliti
es
Gen
eral
cle
anlin
ess
Com
puti
ng e
quip
men
t, fix
ed (d
eskt
op)
Toile
ts /
W.C
.
Prin
ting
/ co
pyin
g / s
cann
ing
equi
pmen
t
Tele
phon
e eq
uipm
ent
Rest
aura
nt /
cant
een
IT S
ervi
ce /
Hel
p de
sk
WiF
i net
wor
k co
nnec
tivi
ty
in th
e offi
ce
Gen
eral
tidi
ness
Wir
ed in
-offi
ce n
etw
ork
conn
ecti
vity
Com
puti
ng e
quip
men
t, m
obile
(lap
top,
tabl
et, e
tc.)
Park
ing
(car
, mot
orbi
ke o
r bic
ycle
)
Rem
ote
acce
ss to
wor
k fil
es o
r ne
twor
k
Secu
rity
Acce
ss (e
.g. l
ifts
, sta
irw
ays,
ra
mps
etc
.)
Mai
l & p
ost-
room
ser
vice
s
Rece
ptio
n ar
eas
Hea
lth
and
safe
ty p
rovi
sion
s
Leis
ure
faci
litie
s ons
ite
or n
earb
y
Inte
rnal
sig
nage
Show
er fa
cilit
ies
Hos
pita
lity
serv
ices
Audi
o-V
isua
l equ
ipm
ent
Gue
st /
visi
tor n
etw
ork
acce
ss
100
90
80
70
60
50
40
30
20
10
0
% im
por
tanc
e%
imp
orta
nce
Under 25 45-5425-34 55 or over35-44
Under 25 45-5425-34 55 or over35-44
14
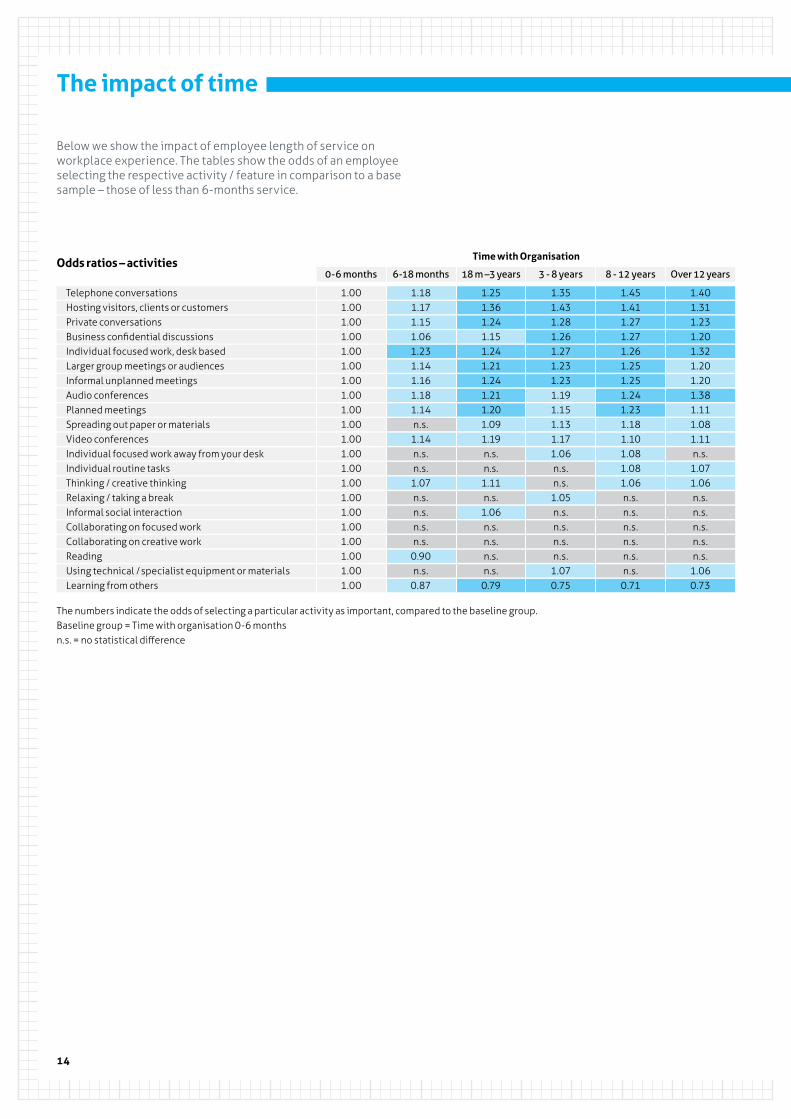
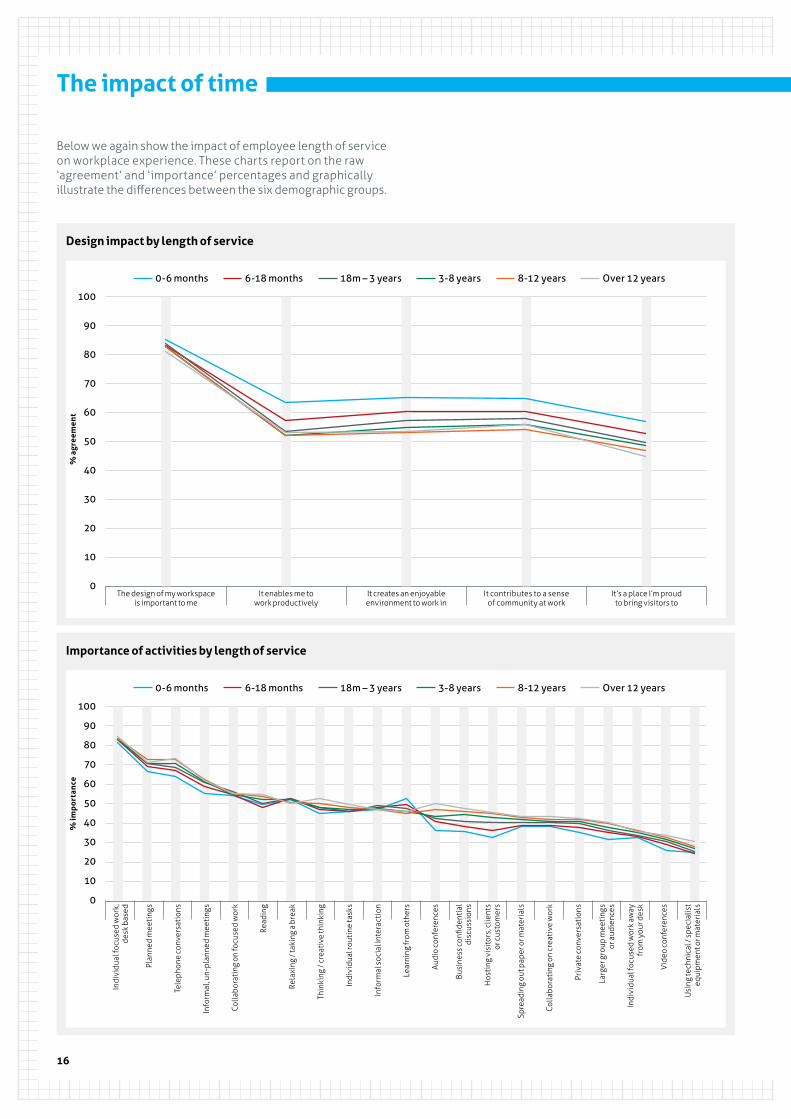
The impact of time
Below we show the impact of employee length of service on workplace experience. The tables show the odds of an employee selecting the respective activity / feature in comparison to a base sample – those of less than 6-months service.
Telephone conversationsHosting visitors, clients or customersPrivate conversationsBusiness confidential discussionsIndividual focused work, desk basedLarger group meetings or audiencesInformal unplanned meetingsAudio conferencesPlanned meetingsSpreading out paper or materialsVideo conferencesIndividual focused work away from your deskIndividual routine tasksThinking / creative thinkingRelaxing / taking a breakInformal social interactionCollaborating on focused workCollaborating on creative workReadingUsing technical / specialist equipment or materialsLearning from others
1.401.311.231.201.321.201.201.381.111.081.11n.s.
1.071.06n.s.n.s.n.s.n.s.n.s.
1.060.73
Over 12 years
1.451.411.271.271.261.251.251.241.231.181.101.081.081.06n.s.n.s.n.s.n.s.n.s.n.s.0.71
8 - 12 years
1.251.361.241.151.241.211.241.211.201.091.19n.s.n.s.1.11n.s.
1.06n.s.n.s.n.s.n.s.0.79
18 m –3 years
1.351.431.281.261.271.231.231.191.151.131.171.06n.s.n.s.
1.05n.s.n.s.n.s.n.s.
1.070.75
3 - 8 years
1.181.171.151.061.231.141.161.181.14n.s.
1.14n.s.n.s.
1.07n.s.n.s.n.s.n.s.
0.90n.s.
0.87
6-18 months
1.001.001.001.001.001.001.001.001.001.001.001.001.001.001.001.001.001.001.001.001.00
0-6 months
Odds ratios – activities
The numbers indicate the odds of selecting a particular activity as important, compared to the baseline group. Baseline group = Time with organisation 0-6 monthsn.s. = no statistical difference
Time with Organisation
15
Archive storage Mail & post room servicesTemperature controlShower facilitiesShared storageParking (car, motorbike or bicycle) Air qualityDesk / Room booking systemsHealth and safety provisions Telephone equipmentGuest / visitor network accessNoise levelsMeeting rooms (large)WiFi network connectivity in the officeIT Service / Help deskSecurity People walking past your workstationGeneral cleanlinessRemote access to work files or networkPrinting / copying / scanning equipmentComputing equipment, mobile (laptop, tablet etc.)Meeting rooms (small)Quiet rooms for working alone or in pairsOffice lightingWired in-office network connectivityAccess (e.g. lifts, stairways, ramps etc.)ChairComputing equipment, fixed (desktop)Restaurant / canteenVariety of different types of workspaceLeisure facilities onsite or nearbyToilets / W.C.Internal signageAccessibility of colleagues Dividers (between desks / areas)General tidinessSpace between work settingsAudio-Visual equipmentDeskPersonal storagePlants & GreeneryHospitality servicesGeneral DécorNatural lightAbility to personalise my workstationInformal work areas / break-out zones Art & PhotographyReception areas Atriums and Communal AreasTea, coffee and other refreshment facilities
Over 12 years
8 - 12 years
1.511.411.411.791.231.321.301.211.201.131.221.271.211.701.681.141.141.13n.s.n.s.
1.541.191.09n.s.n.s.1.100.800.661.21n.s.n.s.n.s.n.s.n.s.
1.080.881.11n.s.n.s.n.s.
1.071.070.92n.s.n.s.
0.850.940.770.890.73
1.511.431.421.321.311.261.241.241.191.191.191.181.181.181.181.161.151.141.141.101.091.091.081.081.071.07n.s.n.s.n.s.n.s.n.s.n.s.n.s.n.s.n.s.n.s.n.s.n.s.n.s.n.s.n.s.n.s.n.s.n.s.n.s.n.s.0.930.900.880.82
18 m –3 years
1.261.201.16n.s.1.111.071.131.16n.s.n.s.
1.141.111.17n.s.n.s.n.s.
1.12n.s.
1.14n.s.0.911.151.13n.s.
1.12n.s.n.s.n.s.n.s.n.s.
1.07n.s.
0.89n.s.
1.080.88n.s.n.s.n.s.n.s.n.s.n.s.0.940.92n.s.n.s.n.s.
0.850.920.88
3 - 8 years
6-18 months
0-6 months
1.191.121.10n.s.
1.09n.s.
1.081.19n.s.n.s.
1.121.111.17n.s.n.s.n.s.1.10n.s.1.16n.s.n.s.1.161.15n.s.
1.08n.s.n.s.n.s.n.s.
1.08n.s.n.s.0.91n.s.
1.070.91n.s.n.s.n.s.n.s.n.s.0.93n.s.n.s.n.s.n.s.n.s.0.92n.s.n.s.
1.001.001.001.001.001.001.001.001.001.001.001.001.001.001.001.001.001.001.001.001.001.001.001.001.001.001.001.001.001.001.001.001.001.001.001.001.001.001.001.001.001.001.001.001.001.001.001.001.001.00
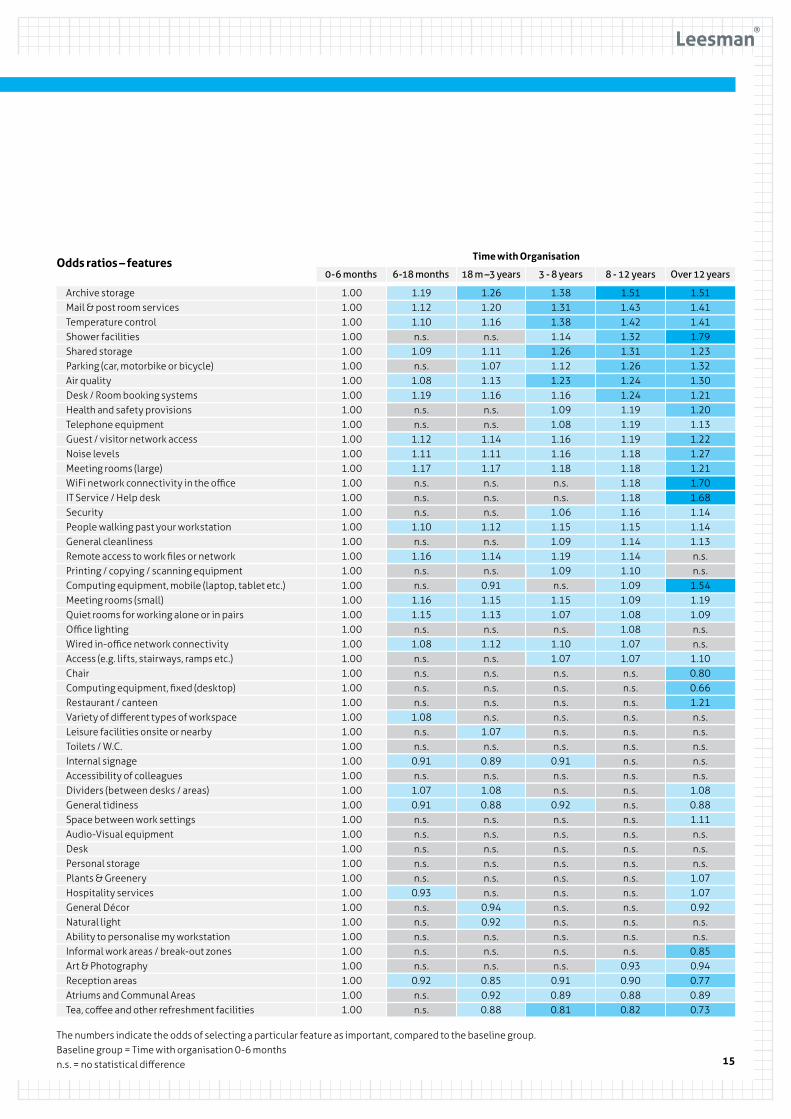
Odds ratios – features
1.381.311.381.141.261.121.231.161.091.081.161.161.18n.s.n.s.
1.061.151.091.191.09n.s.
1.151.07n.s.1.101.07n.s.n.s.n.s.n.s.n.s.n.s.0.91n.s.n.s.0.92n.s.n.s.n.s.n.s.n.s.n.s.n.s.n.s.n.s.n.s.n.s.0.910.890.81
The numbers indicate the odds of selecting a particular feature as important, compared to the baseline group. Baseline group = Time with organisation 0-6 monthsn.s. = no statistical difference
Time with Organisation
16
The impact of time
Below we again show the impact of employee length of service on workplace experience. These charts report on the raw ‘agreement’ and ‘importance’ percentages and graphically illustrate the differences between the six demographic groups.
Design impact by length of service
Importance of activities by length of service
The design of my workspace is important to me
It creates an enjoyable environment to work in
It enables me to work productively
It contributes to a sense of community at work
It’s a place I’m proud to bring visitors to
100
90
80
70
60
50
40
30
20
10
0
% a
gree
men
t
Indi
vidu
al fo
cuse
d w
ork,
de
sk b
ased
Indi
vidu
al ro
utin
e ta
sks
Col
labo
rati
ng o
n fo
cuse
d w
ork
Busi
ness
con
fiden
tial
di
scus
sion
s
Priv
ate
conv
ersa
tion
s
Tele
phon
e co
nver
sati
ons
Lear
ning
from
oth
ers
Rela
/ ta
king
a b
reak
Spre
adin
g ou
t pap
er o
r mat
eria
ls
Indi
vidu
al fo
cuse
d w
ork
away
fr
om y
our d
esk
Plan
ned
mee
ting
s
Info
rmal
soc
ial i
nter
acti
on
Read
ing
Hos
ting
vis
itor
s, c
lient
s or
cus
tom
ers
Larg
er g
roup
mee
ting
s or
aud
ienc
es
Info
rmal
, un-
plan
ned
mee
ting
s
Audi
o co
nfer
ence
s
Thin
king
/ cr
eati
ve th
inki
ng
Col
labo
rati
ng o
n cr
eati
ve w
ork
Vid
eo c
onfe
renc
es
Usi
ng te
chni
cal /
spe
cial
ist
equi
pmen
t or m
ater
ials
100
90
80
70
60
50
40
30
20
10
0
% im
por
tanc
e
0-6 months 8-12 years3-8 years6-18 months Over 12 years18m – 3 years
0-6 months 8-12 years3-8 years6-18 months Over 12 years18m – 3 years

17
Importance of physical features by time with organisation
Importance of service features by time with organisation
Des
k
Cha
ir
Tem
pera
ture
con
trol
Mee
ting
room
s (sm
all)
Pers
onal
sto
rage
Nat
ural
ligh
t
Noi
se le
vels
Mee
ting
room
s (la
rge)
Air q
ualit
y
Offi
ce li
ghti
ng
Qui
et ro
oms f
or w
orki
ng a
lone
or
in p
airs
Gen
eral
Déc
or
Peop
le w
alki
ng p
ast y
our
wor
ksta
tion
Info
rmal
wor
k ar
eas /
bre
ak-o
ut
zone
s
Abi
lity
to p
erso
nalis
e m
y w
orks
tati
on
Des
k / R
oom
boo
king
sys
tem
s
Div
ider
s (be
twee
n de
sks /
are
as)
Spac
e be
twee
n w
ork
sett
ings
Plan
ts &
Gre
ener
y
Acce
ssib
ility
of c
olle
ague
s
Atri
ums a
nd C
omm
unal
Are
as
Art
& P
hoto
grap
hy
Shar
ed s
tora
ge
Arc
hive
sto
rage
Vari
ety
of d
iffer
ent t
ypes
of
wor
kspa
ce
100
90
80
70
60
50
40
30
20
10
0
Tea,
coff
ee a
nd o
ther
re
fres
hmen
t fac
iliti
es
Gen
eral
cle
anlin
ess
Com
puti
ng e
quip
men
t, fix
ed (d
eskt
op)
Toile
ts /
W.C
.
Prin
ting
/ co
pyin
g / s
cann
ing
equi
pmen
t
Tele
phon
e eq
uipm
ent
Rest
aura
nt /
cant
een
IT S
ervi
ce /
Hel
p de
sk
WiF
i net
wor
k co
nnec
tivi
ty
in th
e offi
ce
Gen
eral
tidi
ness
Wir
ed in
-offi
ce n
etw
ork
conn
ecti
vity
Com
puti
ng e
quip
men
t, m
obile
(lap
top,
tabl
et, e
tc.)
Park
ing
(car
, mot
orbi
ke o
r bic
ycle
)
Rem
ote
acce
ss to
wor
k fil
es o
r ne
twor
k
Secu
rity
Acce
ss (e
.g. l
ifts
, sta
irw
ays,
ra
mps
etc
.)
Mai
l & p
ost-
room
ser
vice
s
Rece
ptio
n ar
eas
Hea
lth
and
safe
ty p
rovi
sion
s
Leis
ure
faci
litie
s ons
ite
or n
earb
y
Inte
rnal
sig
nage
Show
er fa
cilit
ies
Hos
pita
lity
serv
ices
Audi
o-V
isua
l equ
ipm
ent
Gue
st /
visi
tor n
etw
ork
acce
ss
100
90
80
70
60
50
40
30
20
10
0
% im
por
tanc
e%
imp
orta
nce
0-6 months 8-12 years3-8 years6-18 months Over 12 years18m – 3 years
0-6 months 8-12 years3-8 years6-18 months Over 12 years18m – 3 years

18
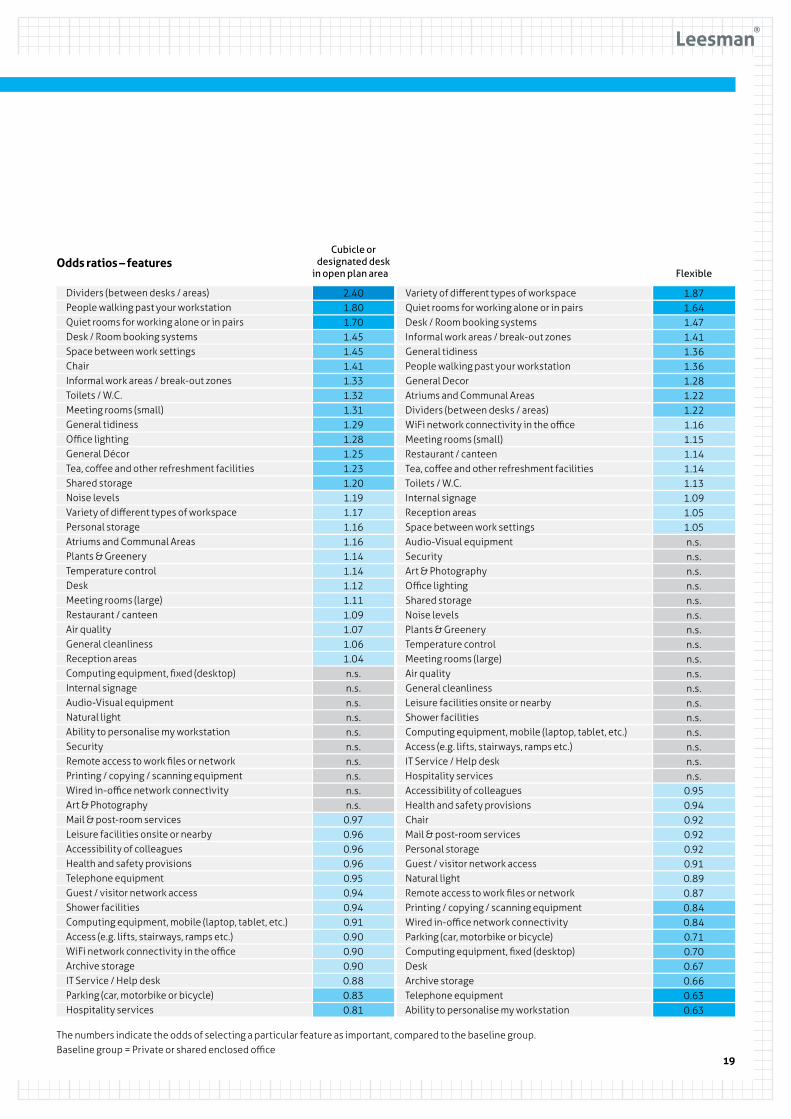
The impact of work setting
Below we show the impact of employee work setting on workplace experience. The tables show the odds of an employee selecting the respective activity / feature in comparison to a base sample – those based in a private office.
Informal, un-planned meetingsPlanned meetingsRelaxing / taking a breakCollaborating on creative workLearning from othersLarger group meetings or audiencesInformal social interactionCollaborating on focused workVideo conferencesTelephone conversationsIndividual focused work, desk basedPrivate conversationsIndividual focused work away from your deskIndividual routine tasksSpreading out paper or materialsAudio conferencesReadingThinking / creative thinkingUsing technical / specialist equipment or materialsBusiness confidential discussionsHosting visitors, clients or customers
Collaborating on creative workInformal unplanned meetingsPlanned meetingsRelaxing taking a breakInformal social interactionCollaborating on focused workPrivate conversationsLearning from othersIndividual focused work away from your deskLarger group meetings or audiencesIndividual routine tasksBusiness confidential discussionsAudio conferencesTelephone conversationsReadingThinking creative thinkingVideo conferencesUsing technical specialist equipment or materialsSpreading out paper or materialsHosting visitors clients or customersIndividual focused work desk based
1.261.221.111.091.081.071.061.05n.s.n.s.n.s.n.s.n.s.n.s.0.970.960.940.930.880.880.82
1.081.07n.s.n.s.n.s.n.s.0.950.930.910.900.840.840.830.820.780.760.750.730.720.680.56
Cubicle or designated desk
in open plan area FlexibleOdds ratios – activities
The numbers indicate the odds of selecting a particular activity as important, compared to the baseline group. Baseline group = Private or shared enclosed office
19
Dividers (between desks / areas)People walking past your workstationQuiet rooms for working alone or in pairsDesk / Room booking systemsSpace between work settingsChairInformal work areas / break-out zones Toilets / W.C.Meeting rooms (small)General tidinessOffice lightingGeneral DécorTea, coffee and other refreshment facilitiesShared storageNoise levelsVariety of different types of workspacePersonal storageAtriums and Communal AreasPlants & GreeneryTemperature controlDeskMeeting rooms (large)Restaurant / canteenAir qualityGeneral cleanlinessReception areas Computing equipment, fixed (desktop)Internal signageAudio-Visual equipmentNatural lightAbility to personalise my workstationSecurity Remote access to work files or networkPrinting / copying / scanning equipmentWired in-office network connectivityArt & PhotographyMail & post-room servicesLeisure facilities onsite or nearbyAccessibility of colleagues Health and safety provisions Telephone equipmentGuest / visitor network accessShower facilitiesComputing equipment, mobile (laptop, tablet, etc.)Access (e.g. lifts, stairways, ramps etc.)WiFi network connectivity in the officeArchive storage IT Service / Help deskParking (car, motorbike or bicycle) Hospitality services
Variety of different types of workspaceQuiet rooms for working alone or in pairsDesk / Room booking systemsInformal work areas / break-out zones General tidinessPeople walking past your workstationGeneral DecorAtriums and Communal AreasDividers (between desks / areas)WiFi network connectivity in the officeMeeting rooms (small)Restaurant / canteenTea, coffee and other refreshment facilitiesToilets / W.C.Internal signageReception areas Space between work settingsAudio-Visual equipmentSecurity Art & PhotographyOffice lightingShared storageNoise levelsPlants & GreeneryTemperature controlMeeting rooms (large)Air qualityGeneral cleanlinessLeisure facilities onsite or nearbyShower facilitiesComputing equipment, mobile (laptop, tablet, etc.)Access (e.g. lifts, stairways, ramps etc.)IT Service / Help deskHospitality servicesAccessibility of colleagues Health and safety provisions ChairMail & post-room servicesPersonal storageGuest / visitor network accessNatural lightRemote access to work files or networkPrinting / copying / scanning equipmentWired in-office network connectivityParking (car, motorbike or bicycle) Computing equipment, fixed (desktop)DeskArchive storage Telephone equipmentAbility to personalise my workstation
2.401.801.701.451.451.411.331.321.311.291.281.251.231.201.191.171.161.161.141.141.121.111.091.071.061.04n.s.n.s.n.s.n.s.n.s.n.s.n.s.n.s.n.s.n.s.0.970.960.960.960.950.940.940.910.900.900.900.880.830.81
1.871.641.471.411.361.361.281.221.221.161.151.141.141.131.091.051.05n.s.n.s.n.s.n.s.n.s.n.s.n.s.n.s.n.s.n.s.n.s.n.s.n.s.n.s.n.s.n.s.n.s.0.950.940.920.920.920.910.890.870.840.840.710.700.670.660.630.63
Cubicle or designated desk
in open plan area FlexibleOdds ratios – features
The numbers indicate the odds of selecting a particular feature as important, compared to the baseline group. Baseline group = Private or shared enclosed office

20
The impact of work setting
Below we again show the impact of employee work setting on workplace experience. These charts report on the raw ‘agreement’ and ‘satisfaction’ percentages and graphically illustrate the differences between the four work setting groups. The tables opposite show the distribution of respondent and resultant Lmi.
Design impact by work setting
The design of my workspace is important to me
It creates an enjoyable environment to work in
It enables me to work productively
It contributes to a sense of community at work
It’s a place I’m proud to bring visitors to
100
90
80
70
60
50
40
30
20
10
0
Private or sharedenclosed office
Cubicle or designated desk in open plan area
Flexible with low choice
Flexible with high choice
Perceived support for activities by work setting
% a
gree
men
t
Private or sharedenclosed office
Cubicle or designated desk in open plan area
Flexible with low choice
Flexible with high choice
Indi
vidu
al fo
cuse
d w
ork,
de
sk b
ased
Indi
vidu
al ro
utin
e ta
sks
Col
labo
rati
ng o
n fo
cuse
d w
ork
Busi
ness
con
fiden
tial
di
scus
sion
s
Priv
ate
conv
ersa
tion
s
Tele
phon
e co
nver
sati
ons
Lear
ning
from
oth
ers
Rela
/ ta
king
a b
reak
Spre
adin
g ou
t pap
er o
r mat
eria
ls
Indi
vidu
al fo
cuse
d w
ork
away
fr
om y
our d
esk
Plan
ned
mee
ting
s
Info
rmal
soc
ial i
nter
acti
on
Read
ing
Hos
ting
vis
itor
s, c
lient
s or
cus
tom
ers
Larg
er g
roup
mee
ting
s or
aud
ienc
es
Info
rmal
, un-
plan
ned
mee
ting
s
Audi
o co
nfer
ence
s
Thin
king
/ cr
eati
ve th
inki
ng
Col
labo
rati
ng o
n cr
eati
ve w
ork
Vid
eo c
onfe
renc
es
Usi
ng te
chni
cal /
spe
cial
ist
equi
pmen
t or m
ater
ials
100
90
80
70
60
50
40
30
20
10
0
% s
atis
fact
ion
21
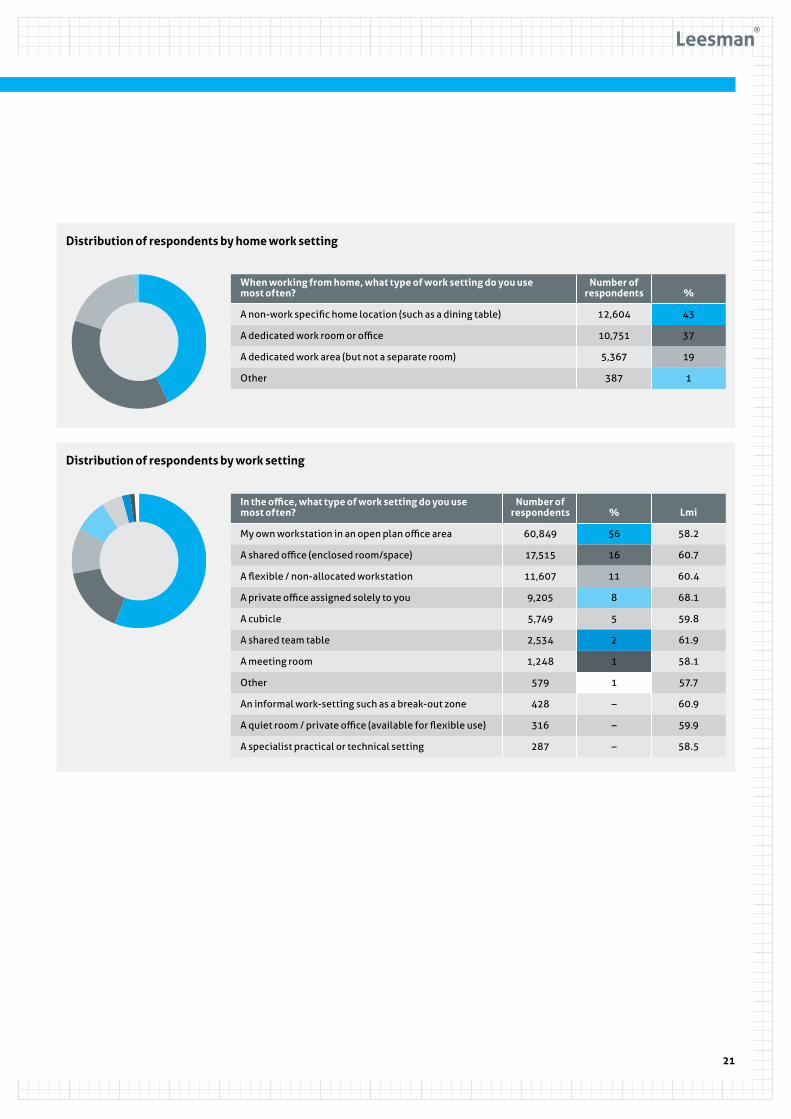
Distribution of respondents by home work setting
Distribution of respondents by work setting
Number of respondents
60,849
17,515
11,607
9,205
5,749
2,534
1,248
579
428
316
287
In the office, what type of work setting do you use most often?
My own workstation in an open plan office area
A shared office (enclosed room/space)
A flexible / non-allocated workstation
A private office assigned solely to you
A cubicle
A shared team table
A meeting room
Other
An informal work-setting such as a break-out zone
A quiet room / private office (available for flexible use)
A specialist practical or technical setting
%
56
16
11
8
5
2
1
1
–
–
–
Lmi
58.2
60.7
60.4
68.1
59.8
61.9
58.1
57.7
60.9
59.9
58.5
When working from home, what type of work setting do you use most often?
A non-work specific home location (such as a dining table)
A dedicated work room or office
A dedicated work area (but not a separate room)
Other
Number of respondents
12,604
10,751
5,367
387
%
43
37
19
1

22
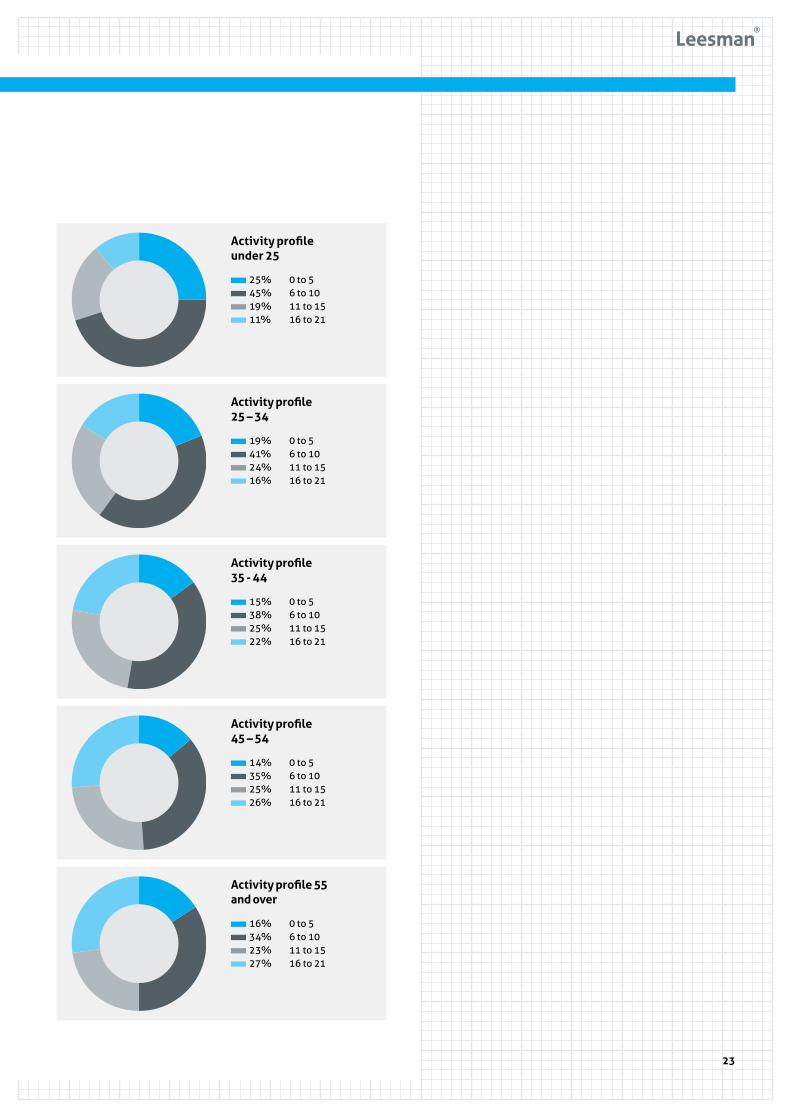
The impact of activities undertaken
Below we show the number of workplace activities selected as “important” in a respondent’s work from 21 possible options, reflecting the complexity of work profile. Opposite we assess how this differs across the various age demographics.
Number of activities selected by all respondents
16% 0 to 538% 6 to 10 24% 11 to 1522% 16 to 21
Activities
10 95 13 183 117 15 202 106 14 194 12 178 16 21
10
9
8
7
6
5
% o
f res
pond
ents
4
3
2
1
0
16% 38% 24% 22%
Number of activities selected as important
23
Activity profile under 25
Activity profile 25 – 34
Activity profile 35 - 44
Activity profile 45 – 54
Activity profile 55 and over
25% 0 to 545% 6 to 10 19% 11 to 1511% 16 to 21
19% 0 to 541% 6 to 10 24% 11 to 1516% 16 to 21
15% 0 to 538% 6 to 10 25% 11 to 1522% 16 to 21
14% 0 to 535% 6 to 10 25% 11 to 1526% 16 to 21
16% 0 to 534% 6 to 10 23% 11 to 1527% 16 to 21
24
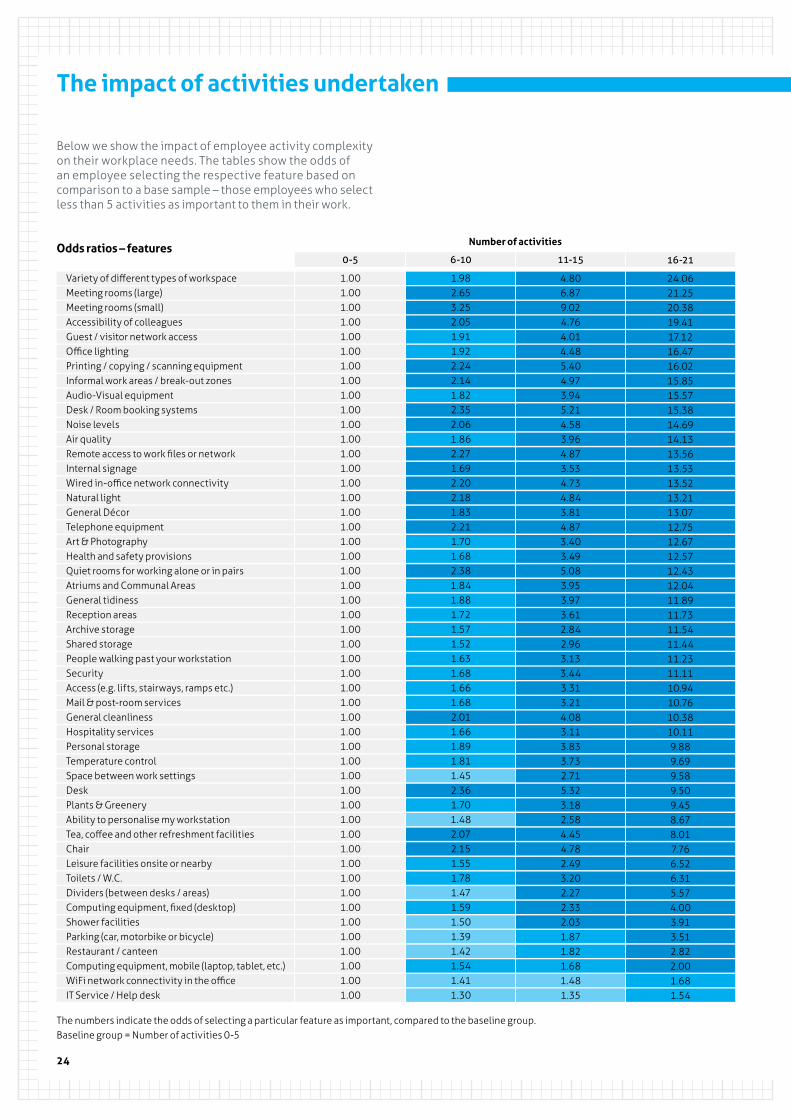
The impact of activities undertaken
Below we show the impact of employee activity complexity on their workplace needs. The tables show the odds of an employee selecting the respective feature based on comparison to a base sample – those employees who select less than 5 activities as important to them in their work.
Variety of different types of workspaceMeeting rooms (large)Meeting rooms (small)Accessibility of colleagues Guest / visitor network accessOffice lightingPrinting / copying / scanning equipmentInformal work areas / break-out zones Audio-Visual equipmentDesk / Room booking systemsNoise levelsAir qualityRemote access to work files or networkInternal signageWired in-office network connectivityNatural lightGeneral DécorTelephone equipmentArt & PhotographyHealth and safety provisions Quiet rooms for working alone or in pairsAtriums and Communal AreasGeneral tidinessReception areas Archive storage Shared storagePeople walking past your workstationSecurityAccess (e.g. lifts, stairways, ramps etc.)Mail & post-room servicesGeneral cleanlinessHospitality servicesPersonal storageTemperature controlSpace between work settingsDeskPlants & GreeneryAbility to personalise my workstationTea, coffee and other refreshment facilitiesChairLeisure facilities onsite or nearbyToilets / W.C.Dividers (between desks / areas)Computing equipment, fixed (desktop)Shower facilitiesParking (car, motorbike or bicycle) Restaurant / canteenComputing equipment, mobile (laptop, tablet, etc.)WiFi network connectivity in the officeIT Service / Help desk
4.806.879.024.764.014.485.404.973.945.214.583.964.873.534.734.843.814.873.403.495.083.953.973.612.842.963.133.443.313.214.083.113.833.732.715.323.182.584.454.782.493.202.272.332.031.871.821.681.481.35
24.0621.2520.3819.4117.1216.4716.0215.8515.5715.3814.6914.1313.5613.5313.5213.2113.0712.7512.6712.5712.4312.0411.8911.7311.5411.4411.2311.1110.9410.7610.3810.119.889.699.589.509.458.678.017.766.526.315.574.003.913.512.822.001.681.54
16-21
1.982.653.252.051.911.922.242.141.822.352.061.862.271.692.202.181.832.211.701.682.381.841.881.721.571.521.631.681.661.682.011.661.891.811.452.361.701.482.072.151.551.781.471.591.501.391.421.541.411.30
6-10
1.001.001.001.001.001.001.001.001.001.001.001.001.001.001.001.001.001.001.001.001.001.001.001.001.001.001.001.001.001.001.001.001.001.001.001.001.001.001.001.001.001.001.001.001.001.001.001.001.001.00
0-5 11-15Odds ratios – features
The numbers indicate the odds of selecting a particular feature as important, compared to the baseline group. Baseline group = Number of activities 0-5
Number of activities
25
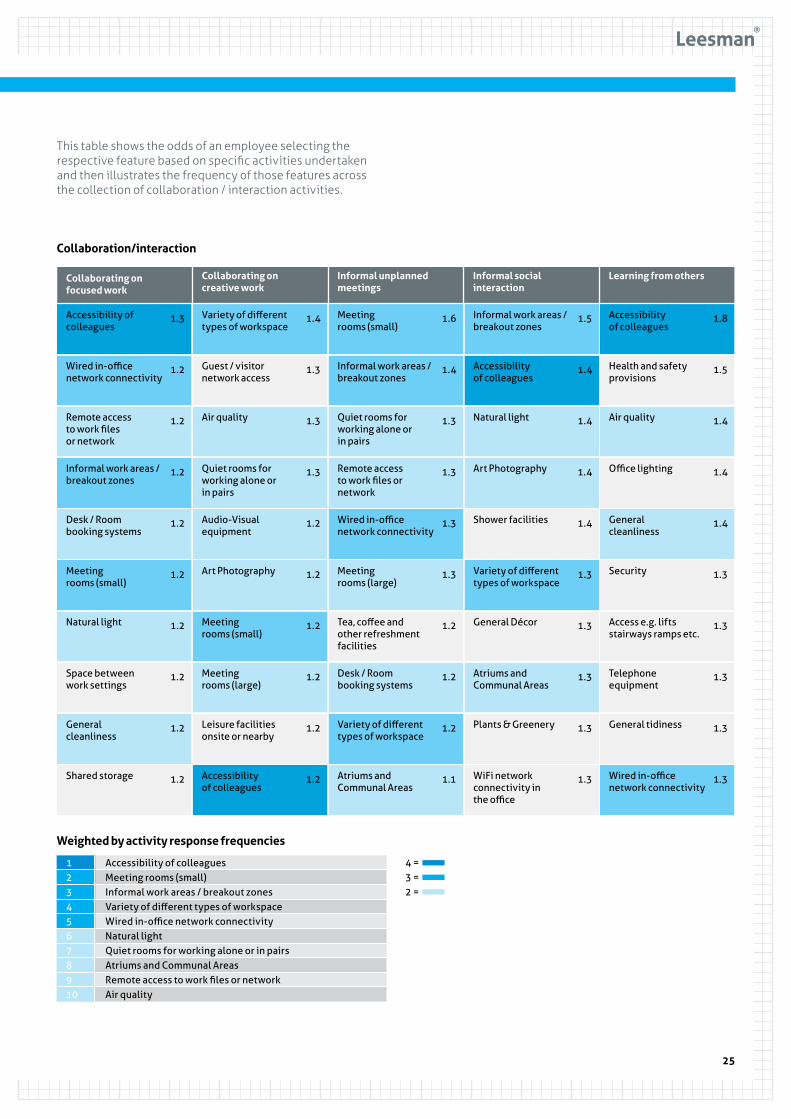
This table shows the odds of an employee selecting the respective feature based on specific activities undertaken and then illustrates the frequency of those features across the collection of collaboration / interaction activities.
Collaboration/interaction
Collaborating on focused work
Accessibility of colleagues
1.3 Variety of different types of workspace
1.4 Meeting rooms (small)
1.6 Informal work areas / breakout zones
1.5 Accessibility of colleagues
1.8
Meeting rooms (small)
1.2 Art Photography 1.2 Meeting rooms (large)
1.3 Variety of different types of workspace
1.3 Security 1.3
Remote access to work files or network
1.2 Air quality 1.3 Quiet rooms for working alone or in pairs
1.3 Natural light 1.4 Air quality 1.4
Space between work settings
1.2 Meeting rooms (large)
1.2 Desk / Room booking systems
1.2 Atriums and Communal Areas
1.3 Telephone equipment
1.3
Wired in-office network connectivity
1.2 Guest / visitor network access
1.3 Informal work areas / breakout zones
1.4 Accessibility of colleagues
1.4 Health and safety provisions
1.5
Natural light 1.2 Meeting rooms (small)
1.2 Tea, coffee and other refreshment facilities
1.2 General Décor 1.3 Access e.g. lifts stairways ramps etc.
1.3
Informal work areas / breakout zones
1.2 Quiet rooms for working alone or in pairs
1.3 Remote access to work files or network
1.3 Art Photography 1.4 Office lighting 1.4
General cleanliness
1.2 Leisure facilities onsite or nearby
1.2 Variety of different types of workspace
1.2 Plants & Greenery 1.3 General tidiness 1.3
Desk / Room booking systems
1.2 Audio-Visual equipment
1.2 Wired in-office network connectivity
1.3 Shower facilities 1.4 General cleanliness
1.4
Shared storage 1.2 Accessibility of colleagues
1.2 Atriums and Communal Areas
1.1 WiFi network connectivity in the office
1.3 Wired in-office network connectivity
1.3
Informal unplanned meetings
Collaborating on creative work
Informal social interaction
Learning from others
Weighted by activity response frequencies
Accessibility of colleaguesMeeting rooms (small)Informal work areas / breakout zonesVariety of different types of workspaceWired in-office network connectivityNatural lightQuiet rooms for working alone or in pairsAtriums and Communal AreasRemote access to work files or networkAir quality
12345678910
4 =3 =2 =
26
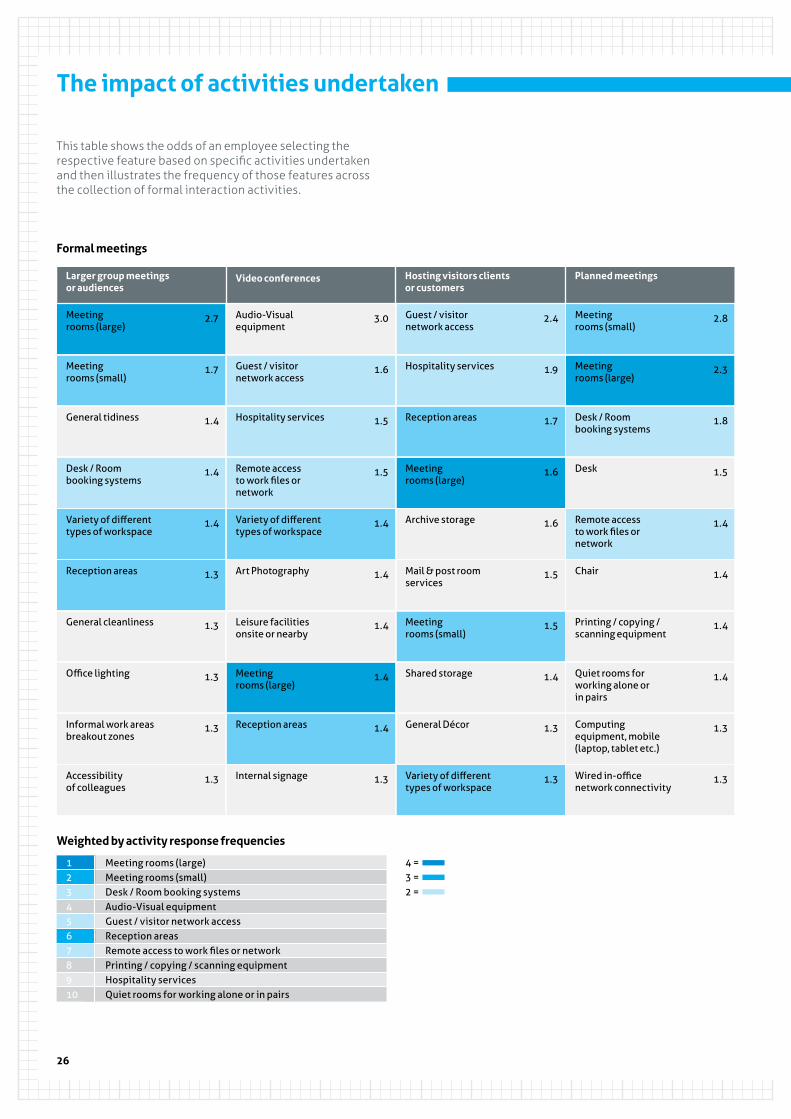
The impact of activities undertaken
This table shows the odds of an employee selecting the respective feature based on specific activities undertaken and then illustrates the frequency of those features across the collection of formal interaction activities.
Formal meetings
Larger group meetings or audiences
Video conferences Hosting visitors clients or customers
Planned meetings
Meeting rooms (large)
2.7
Reception areas 1.3
General tidiness 1.4
Office lighting 1.3
Meeting rooms (small)
1.7
General cleanliness 1.3
Desk / Room booking systems
1.4
Informal work areas breakout zones
1.3
Variety of different types of workspace
1.4
Accessibility of colleagues
1.3
Guest / visitor network access
2.4
Mail & post room services
1.5
Reception areas 1.7
Shared storage 1.4
Hospitality services 1.9
Meeting rooms (small)
1.5
Meeting rooms (large)
1.6
General Décor 1.3
Archive storage 1.6
Variety of different types of workspace
1.3
Audio-Visual equipment
3.0
Art Photography 1.4
Hospitality services 1.5
Meeting rooms (large)
1.4
Guest / visitor network access
1.6
Leisure facilities onsite or nearby
1.4
Remote access to work files or network
1.5
Reception areas 1.4
Variety of different types of workspace
1.4
Internal signage 1.3
Meeting rooms (small)
2.8
Chair 1.4
Desk / Room booking systems
1.8
Quiet rooms for working alone or in pairs
1.4
Meeting rooms (large)
2.3
Printing / copying / scanning equipment
1.4
Desk 1.5
Computing equipment, mobile (laptop, tablet etc.)
1.3
Remote access to work files or network
1.4
Wired in-office network connectivity
1.3
Weighted by activity response frequencies
Meeting rooms (large)Meeting rooms (small)Desk / Room booking systemsAudio-Visual equipmentGuest / visitor network accessReception areasRemote access to work files or networkPrinting / copying / scanning equipmentHospitality servicesQuiet rooms for working alone or in pairs
12345678910
4 =3 =2 =
27
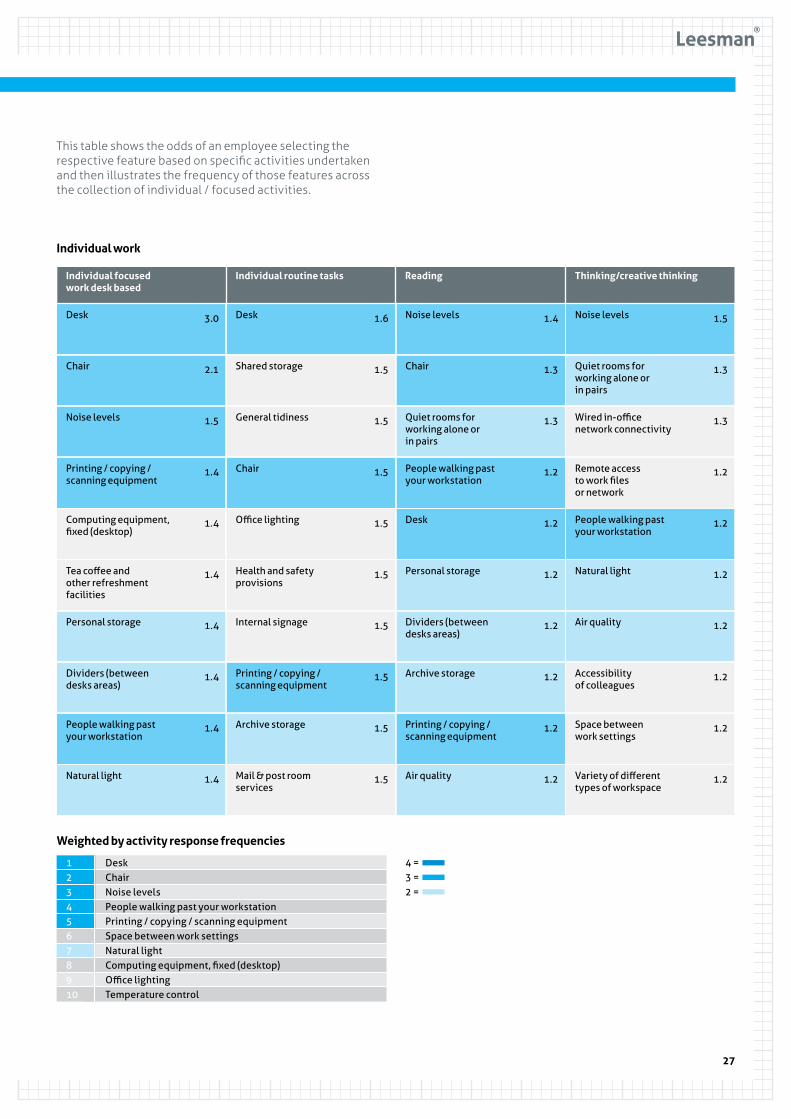
This table shows the odds of an employee selecting the respective feature based on specific activities undertaken and then illustrates the frequency of those features across the collection of individual / focused activities.
Individual work
Individual focused work desk based
Individual routine tasks Reading Thinking/creative thinking
Desk 3.0
Tea coffee and other refreshment facilities
1.4
Noise levels 1.5
Dividers (between desks areas)
1.4
Chair 2.1
Personal storage 1.4
Printing / copying / scanning equipment
1.4
People walking past your workstation
1.4
Computing equipment, fixed (desktop)
1.4
Natural light 1.4
Noise levels 1.4
Personal storage 1.2
Quiet rooms for working alone or in pairs
1.3
Archive storage 1.2
Chair 1.3
Dividers (between desks areas)
1.2
People walking past your workstation
1.2
Printing / copying / scanning equipment
1.2
Desk 1.2
Air quality 1.2
Desk 1.6
Health and safety provisions
1.5
General tidiness 1.5
Printing / copying / scanning equipment
1.5
Shared storage 1.5
Internal signage 1.5
Chair 1.5
Archive storage 1.5
Office lighting 1.5
Mail & post room services
1.5
Noise levels 1.5
Natural light 1.2
Wired in-office network connectivity
1.3
Accessibility of colleagues
1.2
Quiet rooms for working alone or in pairs
1.3
Air quality 1.2
Remote access to work files or network
1.2
Space between work settings
1.2
People walking past your workstation
1.2
Variety of different types of workspace
1.2
Weighted by activity response frequencies
DeskChairNoise levelsPeople walking past your workstationPrinting / copying / scanning equipmentSpace between work settingsNatural lightComputing equipment, fixed (desktop)Office lightingTemperature control
12345678910
4 =3 =2 =
28
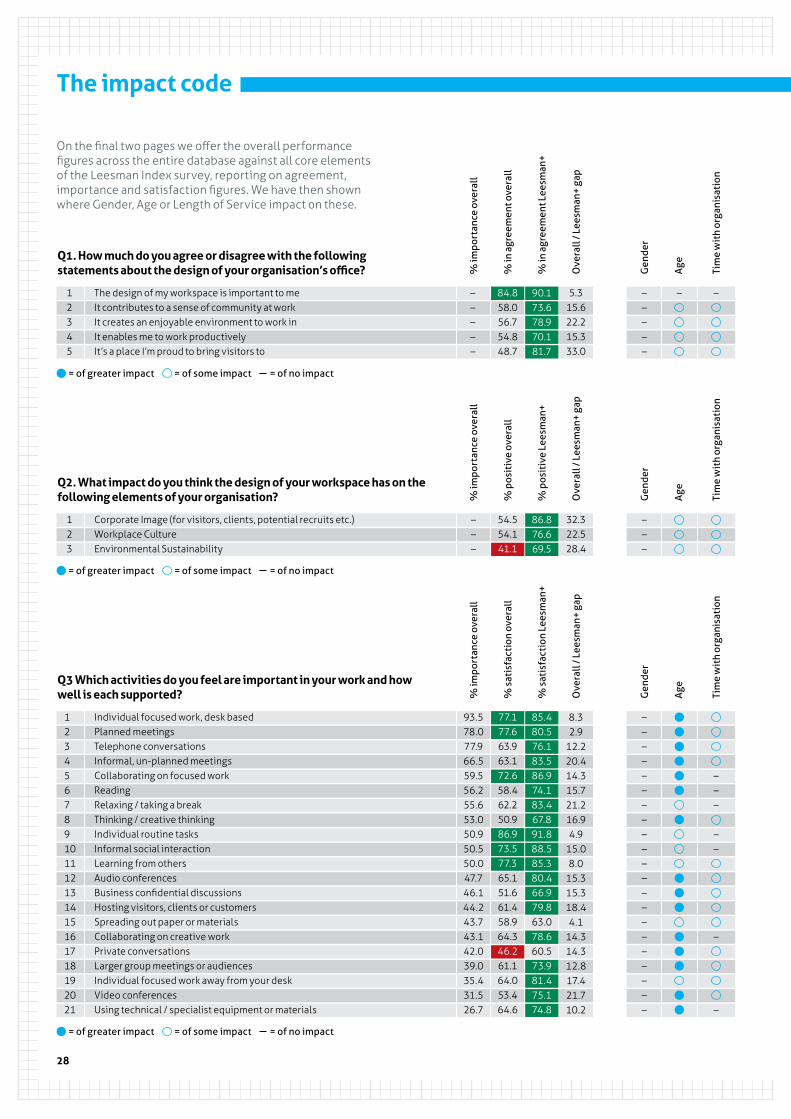
The impact code
On the final two pages we offer the overall performance figures across the entire database against all core elements of the Leesman Index survey, reporting on agreement, importance and satisfaction figures. We have then shown where Gender, Age or Length of Service impact on these.
% im
port
ance
ove
rall
% im
port
ance
ove
rall
% im
port
ance
ove
rall
% in
agr
eem
ent o
vera
ll%
pos
itiv
e ov
eral
l%
sat
isfa
ctio
n ov
eral
l
% in
agr
eem
ent L
eesm
an+
% p
osit
ive
Lees
man
+%
sat
isfa
ctio
n Le
esm
an+
Ove
rall
/ Lee
sman
+ ga
pO
vera
ll / L
eesm
an+
gap
Ove
rall
/ Lee
sman
+ ga
p
Gen
der
Gen
der
Gen
der
Age
Age
Age
Tim
e w
ith
orga
nisa
tion
Tim
e w
ith
orga
nisa
tion
Tim
e w
ith
orga
nisa
tion
Q1. How much do you agree or disagree with the following statements about the design of your organisation’s office?
The design of my workspace is important to meIt contributes to a sense of community at work It creates an enjoyable environment to work in It enables me to work productively It’s a place I’m proud to bring visitors to
12 345
–––––
–––––
– –5.3 15.6 22.2 15.3 33.0
Q2. What impact do you think the design of your workspace has on the following elements of your organisation?
Corporate Image (for visitors, clients, potential recruits etc.) Workplace CultureEnvironmental Sustainability
12 3
–––
32.322.528.4
Q3 Which activities do you feel are important in your work and how well is each supported?
Individual focused work, desk based Planned meetingsTelephone conversations Informal, un-planned meetingsCollaborating on focused workReadingRelaxing / taking a breakThinking / creative thinking Individual routine tasks Informal social interactionLearning from othersAudio conferencesBusiness confidential discussionsHosting visitors, clients or customersSpreading out paper or materialsCollaborating on creative workPrivate conversations Larger group meetings or audiencesIndividual focused work away from your deskVideo conferencesUsing technical / specialist equipment or materials
12 34567 89101112 1314151617 18192021
93.578.077.966.559.556.255.653.050.950.550.047.746.144.243.743.142.039.035.431.526.7
8.32.9
12.220.414.315.721.216.94.9
15.08.0
15.315.318.44.1
14.314.312.817.421.710.2
= of greater impact = of some impact = of no impact
= of greater impact = of some impact = of no impact
= of greater impact = of some impact = of no impact
–––
–––––––––––––––––––––
–––
––
–
–
54.554.141.1
77.177.663.963.172.658.462.250.986.973.577.365.151.661.458.964.346.261.164.053.464.6
84.858.0 56.754.8 48.7
85.480.576.183.586.974.183.467.891.888.585.380.466.979.863.078.660.573.981.475.174.8
86.876.669.5
90.1 73.6 78.9 70.1 81.7
29
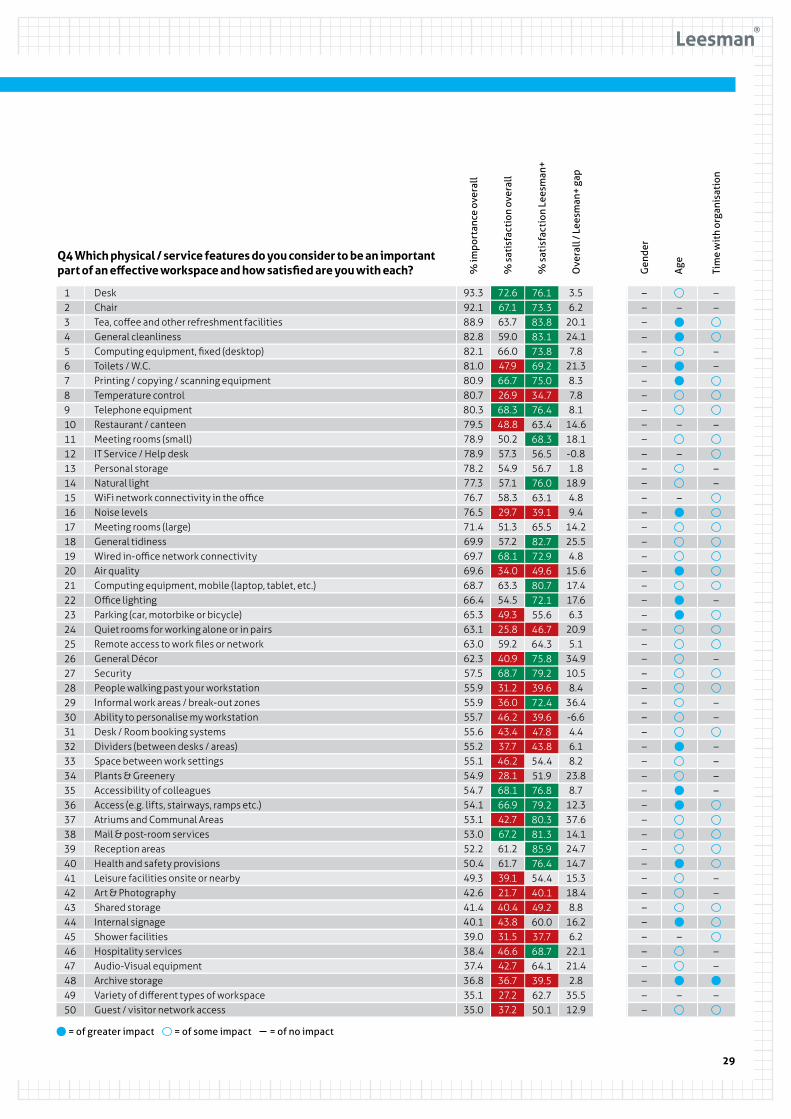
Q4 Which physical / service features do you consider to be an important part of an effective workspace and how satisfied are you with each?
DeskChairTea, coffee and other refreshment facilitiesGeneral cleanlinessComputing equipment, fixed (desktop)Toilets / W.C.Printing / copying / scanning equipmentTemperature controlTelephone equipmentRestaurant / canteenMeeting rooms (small)IT Service / Help deskPersonal storageNatural lightWiFi network connectivity in the officeNoise levelsMeeting rooms (large)General tidinessWired in-office network connectivityAir qualityComputing equipment, mobile (laptop, tablet, etc.)Office lightingParking (car, motorbike or bicycle) Quiet rooms for working alone or in pairsRemote access to work files or network General DécorSecurityPeople walking past your workstationInformal work areas / break-out zonesAbility to personalise my workstationDesk / Room booking systemsDividers (between desks / areas)Space between work settingsPlants & GreeneryAccessibility of colleaguesAccess (e.g. lifts, stairways, ramps etc.)Atriums and Communal AreasMail & post-room servicesReception areasHealth and safety provisionsLeisure facilities onsite or nearbyArt & PhotographyShared storageInternal signageShower facilitiesHospitality servicesAudio-Visual equipmentArchive storageVariety of different types of workspaceGuest / visitor network access
12 34567 89101112 1314151617 1819202122 2324252627 2829303132 3334353637 3839404142 4344454647 484950
% im
port
ance
ove
rall
93.392.188.982.882.181.080.980.780.379.578.978.978.277.376.776.571.469.969.769.668.766.465.363.163.0 62.357.555.955.955.755.655.255.154.954.754.153.153.052.250.449.342.641.440.139.038.437.436.835.135.0
% s
atis
fact
ion
over
all
% s
atis
fact
ion
Lees
man
+
Ove
rall
/ Lee
sman
+ ga
p
3.56.2
20.124.17.8
21.38.37.88.1
14.618.1-0.81.8
18.94.89.4
14.225.54.8
15.617.417.66.3
20.95.1
34.910.58.4
36.4-6.64.46.18.2
23.88.7
12.337.614.124.714.715.318.48.8
16.26.2
22.121.42.8
35.512.9
Gen
der
Age
Tim
e w
ith
orga
nisa
tion
––––––––––––––––––––––––––––––––––––––––––––––––––
–
–
–
–
–
–
––
––
–
––
–
–
––
––––
––
––
–
= of greater impact = of some impact = of no impact
72.667.163.759.066.047.966.726.968.348.850.257.354.957.158.329.751.357.268.134.063.354.549.325.859.2 40.968.731.236.046.243.437.746.228.168.166.942.767.261.261.739.121.740.443.831.546.642.736.727.237.2
76.173.383.883.173.869.275.034.776.463.468.356.556.776.063.139.165.582.772.949.680.772.155.646.764.3 75.879.239.672.439.647.843.854.451.976.879.280.381.385.976.454.440.149.260.037.768.764.139.562.750.1

30
Our clients
ABBAedasAllen & Overy AMF FastigheterAmgenAONAOS StudleyArtilleryAster GroupAstraZeneca Atlas CopcoATOS ConsultingBBCBethpage Federal Credit UnionBMCBNP ParibasBoschBritish American TobaccoBuro HappoldCadillac FairviewCapitaCapital GroupCatlin Group CD&BCDSChannel 4CHS Inc.CienaCoca ColaColliers InternationalColt Technology ServicesCompass GroupContract WorkplacesCrédit Agricole Cripps Data-Info OyDeloitteDelta LloydDentsplyDerwent LondonDeVonoDiners ClubDirect Line GroupDuke UniversityEdge ArchitectureeHalsomyndighetenElektaEmcor Erie Federal Credit UnionEssex County CouncilEurosport Fidelity InternationalFKA Architecture + InteriorsFNVFortumFraikinFreedom Credit UnionGavi AllianceGDF SuezGilead SciencesGMW - ArchitectsGo to WorkGrant ThorntonGuide Dogs for the Blind AssociationHachetteHarry’sHeeremaHeinekenHelsedirektoratet
Herman MillerHOKHufvudstadenHusqvarnaIBMICAIkano BankIKEAInstitution of Engineering and Technology (IET)International Air Transport Association (IATA)InterxionISOISS JAC GroupJaguar Land RoverJohnson & JohnsonJohnson ControlsJones Lang LaSalleKBLKingsley NapleyKKS StrategyKPMGLandgateLendleaseLewis SilkinLiberty SyndicatesLidingö stadLinkedInLloyds RegisterLondon Pensions Fund Authority (LPFA)Maples Teesdale Marks and SpencerMASS Design GroupMax FordhamMBDAMCM ArchitectureMedical Protection Society Limited (MPS) Mentor GraphicsMerck SeronoMikomaxMills & ReeveMITIEMoelven ModusMOMENTUM Moore BlatchMorgan LovellMorgan StanleyNATSNCCNesta NestléNetwork RailNHS Property ServicesNN SlovakiaNordeanpowerNuffield HealthOktraOrange CentreOranginaOSU FederalPan MacmillanPantheon VenturesPeabodyPGGMPlantronicsPosten NorgePreem ABPringle Brandon
Prisma Medios de PagoProdubanco - Grupo PromericaProvidentRabobank Rational GroupRealinformRLFRockwell CollinsSaab ABSaffron Building SocietySafranSainsburysSanofiSASSavillsSEBSheppard RobsonSisleySkanskaSKFSMABTPSodexoSolocalSolvedSouthend-on-Sea Borough CouncilSpirit AirlinesStaplesStatsbyggStockholm Stad (City council)SwecoSwedaviaSwedbankSwedish Red CrossTalokeskus TavistockTDC SverigeTele2TelefónicaTeliaSoneraTenant and PartnerTengbomTetra PakThe Law SocietyThe Prostate Cancer CharityTillväxtverketTLVTrader Media GroupTSKTTSPTU DelftTV4University of CambridgeUniversity of GlasgowUniversity of St AndrewsUniversity Properties of Finland LtdUppsala KommunUSG PeopleUtbildningsradion (UR)Valley of the Sun United WayVeldhoen + CompanyVinci ConcessionsVodafoneVolvo CarsWellcome TrustWithers worldwideWoningstichting Haag WonenXchangingYarra Ranges CouncilZespri International
100,000+ employees, colleagues, partners, workmates, team-mates, co-workers, comrades and associates have now contributed their personal opinions of how their work is supported in their workplace. It is helping us build the largest ever insight into people and place. So we thank every contributor for the time they spent answering our questionnaire. For more information on our work, or to visit us at our base, please feel free to contact:
Leesman Ltd.
LondonHenry Wood House2 Riding House StreetLondon W1W 7FAt. +44 20 3239 5980
New YorkRise43 W 23rd Street2nd FloorNew York, NY 10010t. +1 212 858 9665
StockholmUnited Spaces Waterfront Stockholm ABWaterfront Building, P.O. Box 190SE-101 23 Stockholmt. +46 (0)8 692 65 00
AmsterdamSpaces ZuidasBarbara Strozzilaan 101-201 1083 HN Amsterdamt. +31 (0)20 893 2598

For six years Leesman has measured one thing, just one way: how workplaces support the work of the employees they accommodate.
This focused approach to performance measurement has quickly established Leesman as the world leader in measuring the effectiveness of corporate and educational workplaces with the Leesman Index benchmark now generated from the largest global database of employee workplace satisfaction surveys available.
Our simple, standardised e-survey and analytics tools provide an inexpensive, systematic approach to the collection, analysis and benchmarking of workplace performance data and generate a single, transferable measure of effectiveness – our Leesman ‘Lmi’. This gives clients and their consultants the unrivalled ability to compare their results with thousands of others, offering deep insights into how their places are supporting organisational performance. Together we are changing the way workplace is measured.
leesmanindex.com
Design – fullyfledgeddesign.comPrint – mayfield-press.co.uk
Leesman is a registered trademark and all content is copyright to Leesman Ltd March 2016. All rights reserved.