100% Renewable grid by 2030 - Alternative technology · 4 November 2017 2. Executive summary...
32
100% Renewable grid by 2030 Discussion Paper November 2017
-
Upload
nguyentruc -
Category
Documents
-
view
216 -
download
0
Transcript of 100% Renewable grid by 2030 - Alternative technology · 4 November 2017 2. Executive summary...

100% Renewable grid by 2030
Discussion Paper
November 2017

2
www.ata.org.au November 2017
1. Document information
Document Version Date Prepared By Reviewed By Comments
GridTransitionProgress1d 30/10/17 Andrew Reddaway –
Energy Analyst
Katy Daily,
Donna Luckman
Initial Draft
100%RenewableGridBy2030H 16/11/17 Andrew Reddaway –
Energy Analyst
Robyn Deed
20/11/2017
Complete draft
© 2017 Alternative Technology Association. All rights are reserved. No part of this report may be reproduced
without acknowledgement of source.
For general release
ATA Energy Projects Team
Prepared by: Andrew Reddaway, Dean Lombard, Damien Moyse
Alternative Technology Association
Level 1, 39 Little Collins St, Melbourne VIC 3000
+61 3 9639 1500
+61 3 9639 5814
www.ata.org.au
The ATA is a not-for-profit organisation that enables, represents and inspires people to live
sustainably in their homes and communities.
3
www.ata.org.au November 2017
Contents
1. Document information .......................................................................................................... 2
2. Executive summary ............................................................................................................... 4
3. Introduction .......................................................................................................................... 6
3.1 Recent developments in the grid ........................................................................................ 6
4. Where is this grid transition taking us? ............................................................................... 13
4.1 How is the grid planned now? .......................................................................................... 13
4.2 What kind of planning do we need? ................................................................................. 14
4.3 The best plan so far .......................................................................................................... 14
5. Cost of electricity generation .............................................................................................. 17
5.1 Levelised cost of energy ................................................................................................... 17
5.2 Costs: renewables vs coal ................................................................................................. 19
6. When can we have a 100% renewable grid? ....................................................................... 20
6.1 Renewable generation capacity ........................................................................................ 20
6.2 Energy storage ................................................................................................................. 21
6.1 Targets by political parties................................................................................................ 24
6.2 Transmission – work required .......................................................................................... 25
6.3 Renewable generation by state ........................................................................................ 26
7. Alternative options ............................................................................................................. 27
7.1 Future electricity consumption ......................................................................................... 27
7.1 Less-connected options .................................................................................................... 28
8. How will we manage energy storage? ................................................................................. 28
9. What does all this mean for consumers? ............................................................................ 29
9.1 Electricity prices ............................................................................................................... 29
9.2 Energy efficiency .............................................................................................................. 29
9.3 Rooftop solar ................................................................................................................... 29
9.4 What if the transition is halted? ....................................................................................... 30
10. Conclusion ........................................................................................................................... 31
11. Glossary............................................................................................................................... 32

4
www.ata.org.au November 2017
2. Executive summary
Australia should transition quickly to a 100% renewable electricity grid, as it is cheaper and less risky
than the alternative of building new coal-fired power stations. This can be achieved by 2030.
The Alternative Technology Association (ATA) is a not-for-profit organisation that enables,
represents and inspires people to live sustainably in their homes and communities. Established in
1980, the ATA provides expert, independent advice on sustainable solutions for the home to
households, government, industry and corporate clients.
Based on recent research by the Australian National University (ANU), we forecast likely progress
towards a fully-renewable grid in the National Electricity Market (NEM). We considered recent
trends and developments in projects such as Snowy Hydro 2.0.
Fully-renewable operation of the National Electricity Market requires 93,300 megawatts (MW) of
renewable generation capacity, according to the ANU. If construction of wind and solar generation
continues at the 2017 rate, this level will be attained in 2040. To reach this milestone by 2030 would
require an acceleration of 80% from the 2017 rate. This is illustrated in the following chart.
Figure 1: Forecast renewable generation capacity.
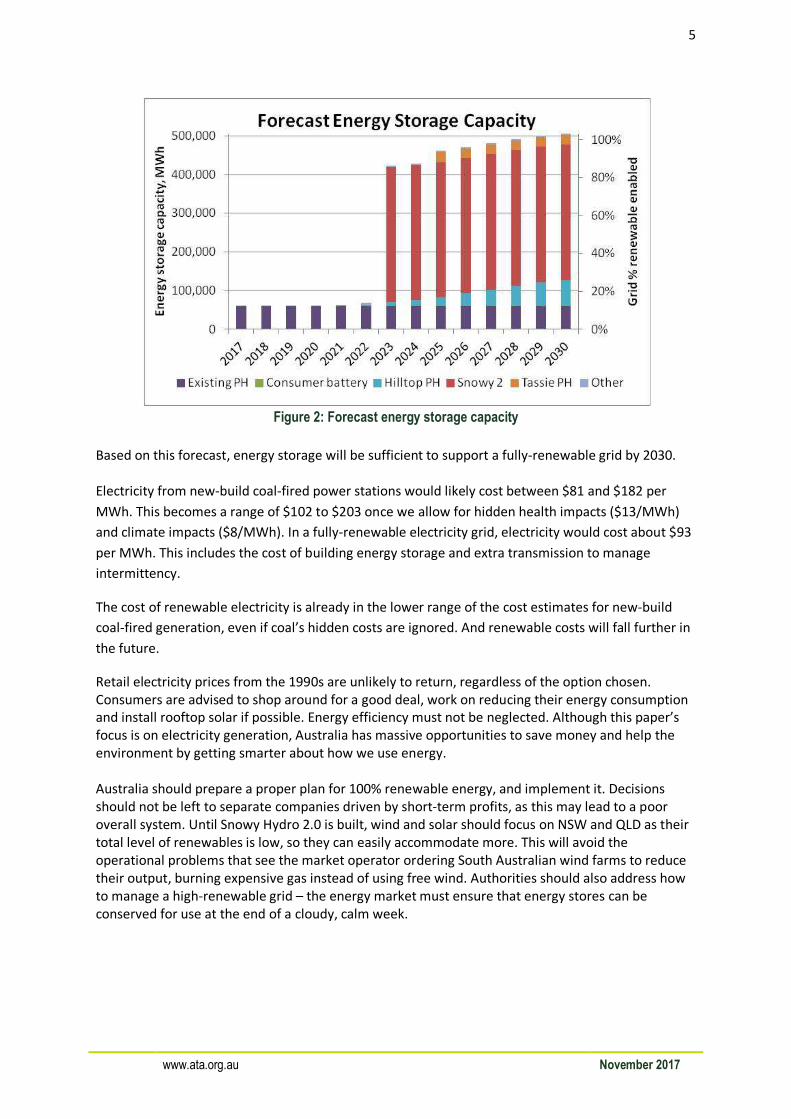
The following chart forecasts the construction of energy storage facilities by project category in the
National Electricity Market. Energy storage capacity is shown in megawatt-hours (MWh), and also as
a percentage of the 490,000 MWh required for a 100% renewable grid. “PH” is an abbreviation for
“pumped hydro”. The category “Other” includes Cultana, Kidston, Aurora and the Jamestown and
Vic batteries. “Hilltop PH” represents 21 small, off-river facilities as proposed by the ANU.
5
www.ata.org.au November 2017
Figure 2: Forecast energy storage capacity
Based on this forecast, energy storage will be sufficient to support a fully-renewable grid by 2030.
Electricity from new-build coal-fired power stations would likely cost between $81 and $182 per
MWh. This becomes a range of $102 to $203 once we allow for hidden health impacts ($13/MWh)
and climate impacts ($8/MWh). In a fully-renewable electricity grid, electricity would cost about $93
per MWh. This includes the cost of building energy storage and extra transmission to manage
intermittency.
The cost of renewable electricity is already in the lower range of the cost estimates for new-build
coal-fired generation, even if coal’s hidden costs are ignored. And renewable costs will fall further in
the future.
Retail electricity prices from the 1990s are unlikely to return, regardless of the option chosen.
Consumers are advised to shop around for a good deal, work on reducing their energy consumption
and install rooftop solar if possible. Energy efficiency must not be neglected. Although this paper’s
focus is on electricity generation, Australia has massive opportunities to save money and help the
environment by getting smarter about how we use energy.
Australia should prepare a proper plan for 100% renewable energy, and implement it. Decisions
should not be left to separate companies driven by short-term profits, as this may lead to a poor
overall system. Until Snowy Hydro 2.0 is built, wind and solar should focus on NSW and QLD as their
total level of renewables is low, so they can easily accommodate more. This will avoid the
operational problems that see the market operator ordering South Australian wind farms to reduce
their output, burning expensive gas instead of using free wind. Authorities should also address how
to manage a high-renewable grid – the energy market must ensure that energy stores can be
conserved for use at the end of a cloudy, calm week.
6
www.ata.org.au November 2017
3. Introduction
Australia is in a transition, as the ageing coal-fired power stations are reaching end-of-life and being
retired.
So what should we replace them with? New-build generation since 2012 has been dominated by
wind farms and solar panels. If we continue this path to its conclusion, what does our country’s final
electricity grid look like? How close are we to that future? What might it mean for electricity prices?
We explore these issues, drawing on recent research and developments.
The Alternative Technology Association (ATA) is a not-for-profit organisation that enables,
represents and inspires people to live sustainably in their homes and communities. Established in
1980, the ATA provides expert, independent advice on sustainable solutions for the home to
households, government, industry and corporate clients.
This document aims to inform Australian households and policymakers. It builds on our paper
published in December 2016, “100% Renewable Grid – Feasible?”1, which explained that a fully-
renewable grid:
o is feasible and economic in the long-term
o would be a big project, but achievable
o is a major step to meeting Australia’s climate commitments.
Energy efficiency must not be neglected. Although this paper’s focus is on electricity generation,
Australia has massive opportunities to save money and help the environment by getting smarter
about how we use energy.
3.1 Recent developments in the grid
The last year has seen much action in the electricity grid, both announced and commenced.
It’s become clear that the electricity grid’s transition is well underway, as coal-fired power stations
are being replaced by renewables.
However, poor planning and coordination has caused problems such as curtailment of wind
generation in South Australia (see Section 3.1.4 below).
3.1.1. Generator construction and retirement
The following chart from the Australian Energy Regulator shows historical construction and
retirement of large generators. Generating capacity is noted in megawatts (MW) of rated power.
Retirement of generators is indicated as negative capacity. New generation is dominated by
renewables (mostly wind farms) while coal-fired power stations have been closing. The chart’s
timeline ends before closure of the coal-fired Hazelwood Power Station in March 2017. That power
station’s capacity was 1,600 MW.
1 http://www.ata.org.au/wp-content/general/One_Hundred_Percent_Renewable_Grid.pdf

7
www.ata.org.au November 2017
Figure 3: Investment in new generation, and plant retirements2
The above chart also does not include rooftop solar panels, because these are installed on customer
premises and are largely invisible to organisations managing the grid.
The following chart shows the uptake of rooftop solar. The rated capacity of rooftop solar systems
reached 6,000 MW in 2017 and is increasing by about 1,000 MW per year. This exceeds the annual
build in large generator capacity in any year from 2009 to 2016.
Figure 4: Installed capacity of solar PV generation by year3
2 State of the Energy Market, May 2017, Australian Energy Regulator. Page 38.
https://www.aer.gov.au/system/files/AER%20State%20of%20the%20energy%20market%202017%20-
%20A4.pdf 3 Australian PV Institute press release 31 July 2017.
http://apvi.org.au/wp-content/uploads/2017/07/APVI-Press-201707_PV-in-Australia-Report.pdf
Nearly all
renewables
since 2012
Coal closing
8
www.ata.org.au November 2017
As of September 2017, investors were very keen to build new renewable generators. According to
the CEO of the Australian Energy Market Operator in September:
“We have 21,000 megawatts of connection requests, all solar and wind.” 4
On the other hand, investors are not keen to build new coal-fired power stations. This is seen clearly
in statements by AGL, Australia’s largest owner of coal-fired electricity generation. For example,
according to CEO Andy Vesey,
“Technology is driving this — we don’t see any baseload other than renewables.”5
3.1.2. Electricity energy generation
Of the grid’s total generating capacity, newly-built renewable generating capacity still only accounts
for a small fraction. The National Electricity Market (which excludes WA and NT) has a total
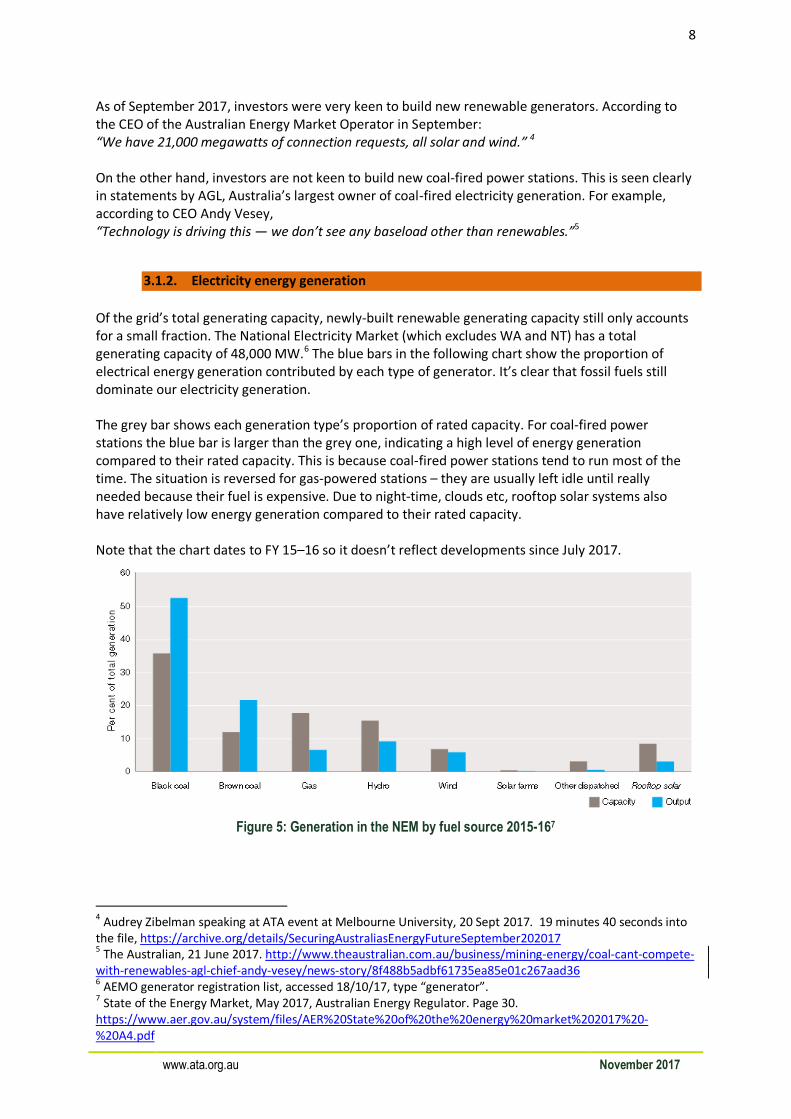
generating capacity of 48,000 MW.6 The blue bars in the following chart show the proportion of
electrical energy generation contributed by each type of generator. It’s clear that fossil fuels still
dominate our electricity generation.
The grey bar shows each generation type’s proportion of rated capacity. For coal-fired power
stations the blue bar is larger than the grey one, indicating a high level of energy generation
compared to their rated capacity. This is because coal-fired power stations tend to run most of the
time. The situation is reversed for gas-powered stations – they are usually left idle until really
needed because their fuel is expensive. Due to night-time, clouds etc, rooftop solar systems also
have relatively low energy generation compared to their rated capacity.
Note that the chart dates to FY 15–16 so it doesn’t reflect developments since July 2017.
Figure 5: Generation in the NEM by fuel source 2015-167
4 Audrey Zibelman speaking at ATA event at Melbourne University, 20 Sept 2017. 19 minutes 40 seconds into
the file, https://archive.org/details/SecuringAustraliasEnergyFutureSeptember202017 5 The Australian, 21 June 2017. http://www.theaustralian.com.au/business/mining-energy/coal-cant-compete-
with-renewables-agl-chief-andy-vesey/news-story/8f488b5adbf61735ea85e01c267aad36 6 AEMO generator registration list, accessed 18/10/17, type “generator”.
7 State of the Energy Market, May 2017, Australian Energy Regulator. Page 30.
https://www.aer.gov.au/system/files/AER%20State%20of%20the%20energy%20market%202017%20-
%20A4.pdf
9
www.ata.org.au November 2017
3.1.3. Recent developments
2017 has seen many innovative developments and proposals in our electricity grid. Interestingly,
many of these were foreshadowed by our paper last year. Here are some of the highlights.
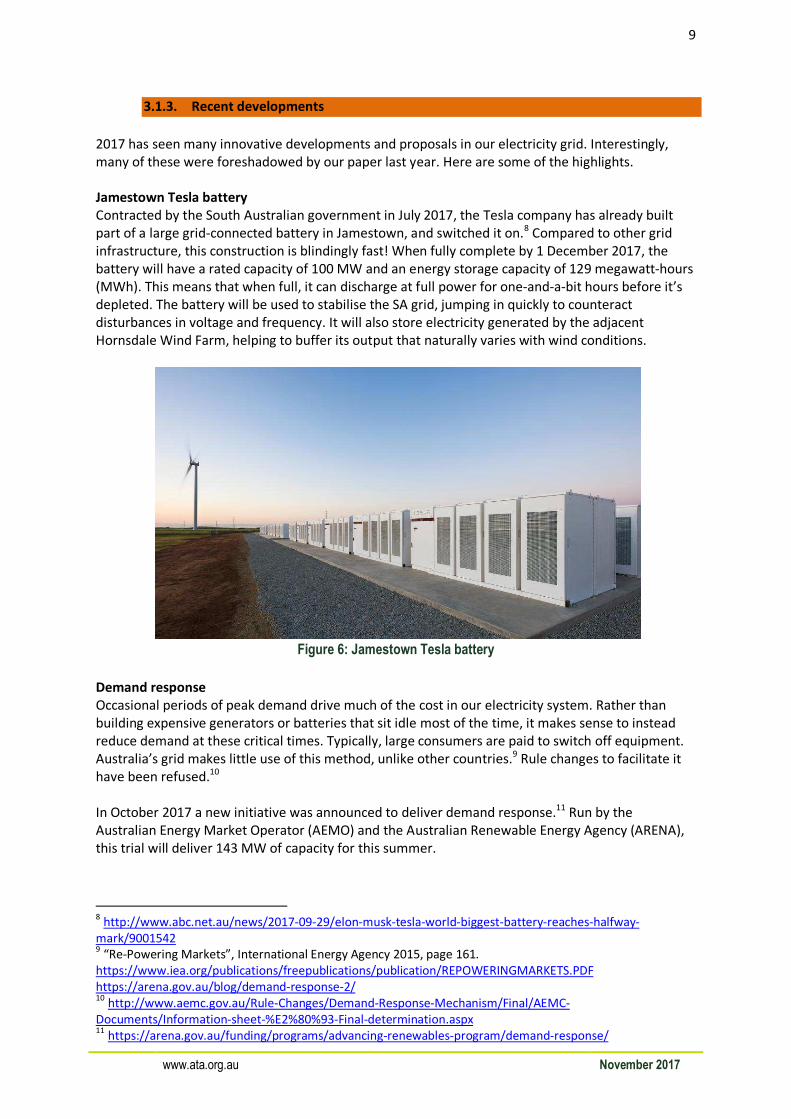
Jamestown Tesla battery
Contracted by the South Australian government in July 2017, the Tesla company has already built
part of a large grid-connected battery in Jamestown, and switched it on.8 Compared to other grid
infrastructure, this construction is blindingly fast! When fully complete by 1 December 2017, the
battery will have a rated capacity of 100 MW and an energy storage capacity of 129 megawatt-hours
(MWh). This means that when full, it can discharge at full power for one-and-a-bit hours before it’s
depleted. The battery will be used to stabilise the SA grid, jumping in quickly to counteract
disturbances in voltage and frequency. It will also store electricity generated by the adjacent
Hornsdale Wind Farm, helping to buffer its output that naturally varies with wind conditions.
Figure 6: Jamestown Tesla battery
Demand response
Occasional periods of peak demand drive much of the cost in our electricity system. Rather than
building expensive generators or batteries that sit idle most of the time, it makes sense to instead
reduce demand at these critical times. Typically, large consumers are paid to switch off equipment.
Australia’s grid makes little use of this method, unlike other countries.9 Rule changes to facilitate it
have been refused.10
In October 2017 a new initiative was announced to deliver demand response.11 Run by the
Australian Energy Market Operator (AEMO) and the Australian Renewable Energy Agency (ARENA),
this trial will deliver 143 MW of capacity for this summer.
8 http://www.abc.net.au/news/2017-09-29/elon-musk-tesla-world-biggest-battery-reaches-halfway-
mark/9001542 9 “Re-Powering Markets”, International Energy Agency 2015, page 161.
https://www.iea.org/publications/freepublications/publication/REPOWERINGMARKETS.PDF
https://arena.gov.au/blog/demand-response-2/ 10
http://www.aemc.gov.au/Rule-Changes/Demand-Response-Mechanism/Final/AEMC-
Documents/Information-sheet-%E2%80%93-Final-determination.aspx 11
https://arena.gov.au/funding/programs/advancing-renewables-program/demand-response/
10
www.ata.org.au November 2017
Victorian batteries in western Victoria
To strengthen the electricity grid in western Victoria, the state government will build a battery with a
power of 40 MW and energy storage of 100 MWh.12
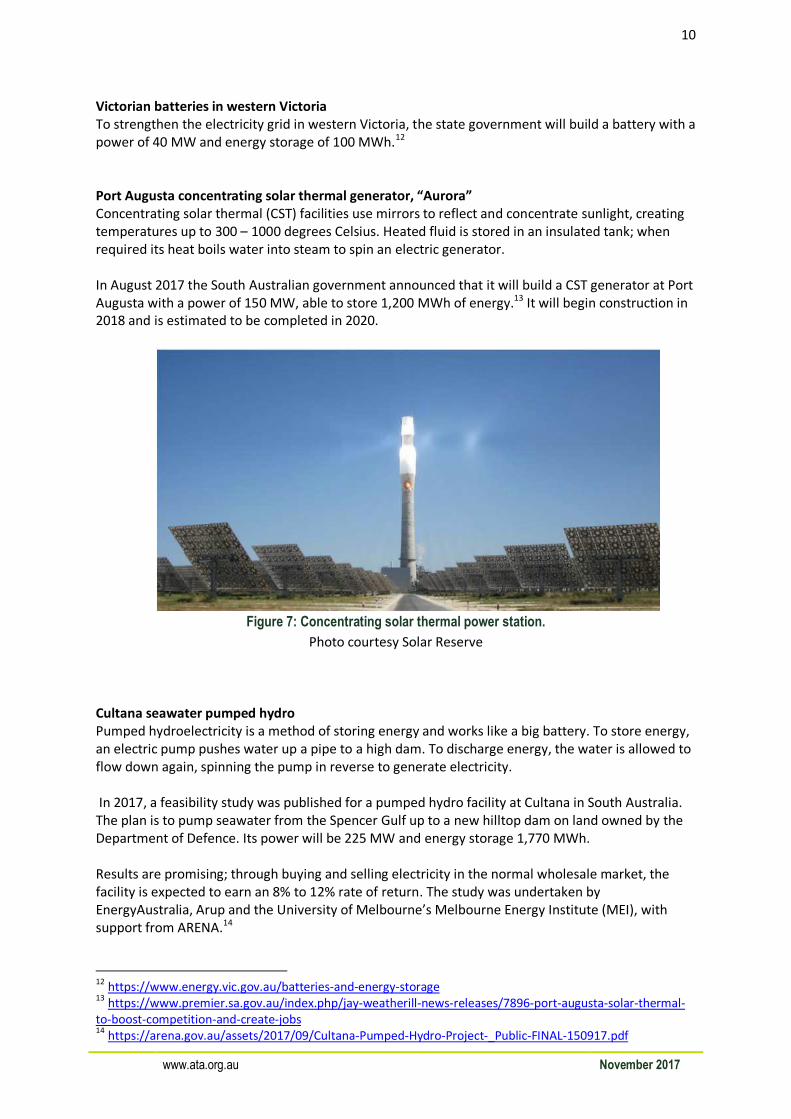
Port Augusta concentrating solar thermal generator, “Aurora”
Concentrating solar thermal (CST) facilities use mirrors to reflect and concentrate sunlight, creating
temperatures up to 300 – 1000 degrees Celsius. Heated fluid is stored in an insulated tank; when
required its heat boils water into steam to spin an electric generator.
In August 2017 the South Australian government announced that it will build a CST generator at Port
Augusta with a power of 150 MW, able to store 1,200 MWh of energy.13 It will begin construction in
2018 and is estimated to be completed in 2020.
Figure 7: Concentrating solar thermal power station.
Photo courtesy Solar Reserve
Cultana seawater pumped hydro
Pumped hydroelectricity is a method of storing energy and works like a big battery. To store energy,
an electric pump pushes water up a pipe to a high dam. To discharge energy, the water is allowed to
flow down again, spinning the pump in reverse to generate electricity.
In 2017, a feasibility study was published for a pumped hydro facility at Cultana in South Australia.
The plan is to pump seawater from the Spencer Gulf up to a new hilltop dam on land owned by the
Department of Defence. Its power will be 225 MW and energy storage 1,770 MWh.
Results are promising; through buying and selling electricity in the normal wholesale market, the
facility is expected to earn an 8% to 12% rate of return. The study was undertaken by
EnergyAustralia, Arup and the University of Melbourne’s Melbourne Energy Institute (MEI), with
support from ARENA.14
12
https://www.energy.vic.gov.au/batteries-and-energy-storage 13
https://www.premier.sa.gov.au/index.php/jay-weatherill-news-releases/7896-port-augusta-solar-thermal-
to-boost-competition-and-create-jobs 14
https://arena.gov.au/assets/2017/09/Cultana-Pumped-Hydro-Project-_Public-FINAL-150917.pdf

11
www.ata.org.au November 2017
Kidston pumped hydro
This planned project will use two
existing pits in a disused gold mine
in north Queensland as upper and
lower dams for pumped
hydroelectricity. The feasibility
study is complete, and the
company Genex Power is
negotiating transmission
connections. It’s expected to be
operational in 2019, with a power
of 250 MW and energy storage of
1,500 MWh.15
Figure 8: Disused pits at Kidston gold mine in north Queensland
Image source: https://arena.gov.au/projects/kidston-pumped-storage-project/
Hydro Tasmania “Battery of the nation”
Tasmania already has a lot of hydroelectric generation. The state’s rainwater dams and lakes already
store huge amounts of potential energy, ready to be released through electricity-generating turbines
before flowing down-river to the sea.
The existing system has its limitations. Water release must consider other stakeholders, e.g.
irrigation. And Tassie dams cannot store energy generated elsewhere, e.g. by a wind farm. To
operate like a proper battery, Tassie needs the addition of pumped hydro.
In April 2017, a study was announced into the feasibility of adding 13 pumped hydro facilities in
Tasmania, mostly connecting existing dams.16,17
The power expected by these projects is 2500 MW, but energy storage in MWh has not been stated.
Snowy Hydro 2.0
This is a proposal to develop pumped hydro energy storage in the Snowy Mountains.18 The idea is to
periodically pump water uphill between existing water reservoirs (Talbingo and Tantangara), and
then release the water back downhill to generate electricity. It will act to store electricity like an
enormous battery. Proposed generating capacity is 2,000 MW of power, and energy storage capacity
is 350,000 megawatt-hours (MWh). This means that if the top dam is full, Snowy 2.0 could generate
at full power for a whole week before it was depleted. The feasibility study is due in December 2017,
and the project might take 6 years to complete.19
Other projects
In addition there are many renewable projects planned by large industrial companies. For example,
Arrium plans to construct a pumped hydro facility sized at 120 MW / 600 MWh, a battery sized at
100 MW / 100 MWh and many hundred megawatts of renewable generation capacity.20
15
http://www.genexpower.com.au/the-kidston-pumped-storage-hydro-project-250mw.html 16
https://www.hydro.com.au/about-us/news/2017-04/talking-point-let%E2%80%99s-be-battery-nation 17
http://www.themercury.com.au/news/tasmania/can-tasmania-be-the-battery-of-the-nation/news-
story/145ab43ec960aff34d07ce1250112509 18
http://www.snowyhydro.com.au/our-scheme/snowy20/ 19
http://www.news.com.au/technology/innovation/snowy-hydro-20-to-get-funding-boost/news-
story/63d905fa328b7fe5d0ef1ef5f8bc7a4f 20
http://www.afr.com/news/sanjeev-guptas-700-million-solarbatteryhydro-bet-to-power-whyalla-steel-
20171029-gzaqfe

12
www.ata.org.au November 2017
3.1.4. Curtailment of South Australian wind farms
At first glance it seems there shouldn’t be any trouble using all of SA’s wind generation. However, in
the interests of system security AEMO has ordered wind farms to reduce (curtail) output many times
in 2017. Expensive gas has been burnt instead of using free wind power.
SA’s wind generation capacity has already grown to 1,700 MW21, with investors attracted by SA’s
historically high electricity prices, excellent wind resource and federally-administered incentives.
SA’s record minimum electricity demand is 834 MW22, and SA can also export up to 790 MW to
Victoria. Adding these two numbers, the grid can always use at least 1,624 MW of power from
generators in SA. Since it’s highly unlikely for all of SA’s wind turbines to simultaneously spin at full
capacity, there seems to be no problem.
However, running totally on wind can create problems for the state’s current electricity grid.23
AEMO has been studying this situation for many years.24
In April 2017 AEMO decided to run some gas-fired power generation at all times to ensure grid
stability and security. 25 These gas generators supply some of SA’s electricity demand, reducing the
outlet available to wind farms. If wind farms are generating more power than can be absorbed by
the grid then AEMO instructs them to reduce power. Wind farms may have had around 6% of their
generation curtailed in the period from 19 July to 13 September 2017.26 As new additional wind
farms are built, curtailment will increase.
AEMO’s specific reason for always requiring some gas generation is to maintain system strength. If a
transmission line touches the ground (for example), we actually want a strong grid to push a
momentary, massive current into the ground, because then the grid’s big safety switches will switch
off as they’ll register the high current as a fault. Successful disconnection of the faulty power line
helps stabilise the rest of the grid and allows safe restoration works.
Current wind turbines don’t provide this system strength, so the grid may not push enough current
into the fault for the safety switches to operate correctly. Gas generators are currently the only
equipment in South Australia that can provide sufficient system strength.
This appears to be a failure in planning. With some foresight and coordination, the coal-fired
Northern Power Station’s decommissioned turbines could have been re-purposed as synchronous
condensers which provide system strength without burning fuel.27 In future, this service could be
provided by other renewable solutions such as concentrating solar thermal or pumped hydro energy
storage. These two technologies naturally provide system strength and inertia because they include
heavy, spinning machinery.
21
AEMO NEM registration list, accessed 28/10/17. 22
AEMO South Australian Electricity Report 2016, page 23. http://www.aemo.com.au/-
/media/Files/Electricity/NEM/Planning_and_Forecasting/SA_Advisory/2016/2016_SAER.pdf 23
For example, the grid’s inertia drops to a low level, meaning any grid disturbance that happens will unfold
more rapidly and be hard to control For more info please see ATA’s paper “100% renewable grid: feasible?”. 24
https://www.aemo.com.au/Datasource/Archives/Archive1365 25
https://www.aemo.com.au/-
/media/Files/Electricity/NEM/Market_Notices_and_Events/Power_System_Incident_Reports/2016/Power-
System-Operations-Incident-Report_SA13Nov16.pdf 26
http://www.wattclarity.com.au/2017/09/how-much-wind-powered-electricity-production-has-been-
curtailed-in-sa-since-these-new-constraints-were-invoked/ 27
Electranet, Page 32, “Northern South Australia Region Voltage Control” https://www.electranet.com.au/wp-
content/uploads/resource/2016/08/20160803-Report-NorthernSARegionVoltageControlPSCR.pdf
13
www.ata.org.au November 2017
4. Where is this grid transition taking us?
At the completion of this transition, we expect that Australia’s electricity grid will be powered
completely or almost completely by renewable energy.
Some progress has already been achieved in solar and wind generation.
However, there’s been little progress on energy storage and strengthening the transmission system.
In a grid dominated by wind and solar, energy storage is essential to get through a calm, cloudy
week. And extra transmission lines are needed to transport electricity from areas experiencing
sunshine and wind to the rest of the country.
4.1 How is the grid planned now?
Most of Australia’s current power stations were constructed in the 1970s and 80s by state-based
electricity bodies such as ETSA in South Australia. These were integrated organisations controlling
the entire supply chain from generation through to customer billing. They managed their generator
fleets carefully, planning new power stations to take over from those nearing end-of-life.
In the current system there is no such plan. In the 1990s the state-based bodies were mostly split up
and privatised, and superseded by the new National Electricity Market.28 Generators compete
against each other, may close without notice and have a business incentive to conceal their future
intentions.
There is no guarantee that new power stations will be built – the system expects that investors will
foresee a shortfall, identify a profit and construct the needed infrastructure. To assist investors, the
market operator (AEMO) annually produces the Electricity Statement Of Opportunities report29
attempting to identify future shortfalls. This document only looks ahead 10 years, and doesn’t
consider scenarios such as 100% renewables. AEMO also a transmission report30, which looks ahead
20 years but has a relatively narrow focus on transmission lines and related assets.
In hindsight this system has a clear flaw. If investors fail to act in time, generating capacity may be
insufficient to meet demand. It takes several years to build a new power station, but an old one can
be closed very quickly – Hazelwood’s owners provided only 5 months’ notice.31 Individual asset
owners have no responsibility for the overall system’s reliability. This is why interventions in the
market have been required in 2017, including the South Australian government’s Energy Plan32 and
the federal government’s efforts to dissuade AGL’s plans to close Liddell power station in 2022.33 The
market is now facing its first major refresh of the generation fleet, as end-of-life approaches for the
old generators constructed prior to the market’s commencement.
The current system also relies heavily on clear, long-term government policy to guide investors.
Without such policy, investors face the risk that their newly-built asset might have to contend with
unexpected new incentives, rules and regulations.
28
http://www.aemc.gov.au/Australias-Energy-Market/Markets-Overview/National-electricity-market 29
“ESOO”: https://www.aemo.com.au/Media-Centre/2017-Electricity-Statement-of-Opportunities 30
“NTNDP”: http://www.aemo.com.au/-
/media/Files/Electricity/NEM/Planning_and_Forecasting/NTNDP/2016/Dec/2016-NATIONAL-TRANSMISSION-
NETWORK-DEVELOPMENT-PLAN.pdf 31
http://www.abc.net.au/news/2017-03-24/hazelwood-latrobe-valley-not-the-first-or-the-last-to-
close/8380760 32
http://ourenergyplan.sa.gov.au/ 33
http://www.sbs.com.au/news/article/2017/09/11/agl-consider-extending-life-liddell-power-station

14
www.ata.org.au November 2017
4.2 What kind of planning do we need?
As the grid transitions to a high level of renewables, good long-term planning is required.
If the grid’s current planning arrangements continue unchanged, decisions and investments will be
uncoordinated. They may make sense for the short-term profits of individual companies, but may
not lead to a well-designed overall system.
The Chief Scientist considered this, and recommended an “integrated grid plan” by AEMO.34
4.3 The best plan so far
In the absence of long-range planning by authorities for a high-renewable grid, the best studies have
come from universities.35 In February 2017, the ANU published a clear vision for our future grid.36 Its
researchers found the most economic combination for a fully-renewable grid comprises:
• wind farms (45,000 MW)
• solar farms (23,000 MW)
• rooftop solar (17,000 MW)
• existing hydroelectric and biomass generators (10,800 MW)37
• pumped hydro energy storage
• extra transmission lines.
Total generation capacity is 93,300 MW, nearly double our grid’s generation capacity of 48,000
MW38 in 2017. This is due to “over-building” wind and solar to cater for their intermittent nature.
Generators are spread widely to ensure that some of them are always generating well regardless of
weather conditions, as the whole continent is never calm and cloudy simultaneously.
To transport electricity around the NEM, the ANU proposes a new transmission “backbone”, roughly
following the Great Dividing Range and onward into South Australia and Tassie. The ANU’s study
only considered the National Electricity Market, so the separate grids in WA and NT were excluded.
Energy storage requirements are relatively modest – enough to supply average grid demand for 30
hours without any generation. Off-grid households know this concept as “days of autonomy”. Such
families typically have batteries large enough to supply 3 to 5 days of average electricity demand
with no generation. An off-grid house requires a relatively large amount of storage because it can
harvest solar and wind energy from only a single location, so it’s vulnerable to localised stretches of
cloudy, calm weather.
Detailed simulations determined that this combination of generation and energy storage keeps the
grid reliable even under rare weather conditions. This includes supplying heavy industry such as
smelters. Existing hydroelectric power stations (e.g. the Snowy hydro scheme) and existing biomass
generation (e.g. burning sugar cane residue) are used when the weather is particularly unfavourable.
34
Independent Review into the Future Security of the National Electricity Market, June 2017, Alan Finkel.
Recommendations 5.1 and 5.2. http://www.environment.gov.au/system/files/resources/1d6b0464-6162-
4223-ac08-3395a6b1c7fa/files/electricity-market-review-final-report.pdf 35
For a list of previous studies, refer to ATA’s paper “100% renewable electricity grid – feasible?” 36
“100% renewable electricity in Australia”, Andrew Blakers, Bin Lu and Matthew Stocks, Australian National
University. http://energy.anu.edu.au/files/100%25%20renewable%20electricity%20in%20Australia.pdf 37
AEMO generator registration list, accessed 18/10/17, type “generator”. 38
Ibid

15
www.ata.org.au November 2017
4.3.1. Off-river pumped hydro dams
The ANU found that the most economical form of energy storage is pumped hydro. They propose
earthen constructions like oversized farm dams, built on hilltops. A second similar dam sits at the
bottom of each hill. The upper dam is 300 to 900 metres higher than the lower one. When solar and
wind power are plentiful in the grid, water is pumped up a pipe to the top dam. When power is
required, water is allowed to flow down the pipe, spinning the pump in reverse to generate
electricity. The same water is recycled so the only losses are due to evaporation, and are very small
compared to other demands on Australian water.39 River flows are not affected.
High pressure due to the upper dam’s height enables large amounts of energy to be stored with a
relatively small area. For example, an upper dam might cover 10 hectares to a depth of 20 metres.
On a 700m tall hill, it can generate 500 MW of power for six hours, for a total energy storage of
3,000 MWh.40 Round-trip efficiency is 80%.
Figure 9: A plentiful choice of upper dam sites near Araluen, ACT. Topography exaggerated41.
In the absence of any other energy storage, the ANU’s plan requires about 160 such facilities, with
energy storage totalling 490,000 MWh. Total power capacity is 16,000 MW, and total inundated area
is 36 square kilometres.
Potential sites are plentiful – a topological search found 22,000 suitable locations away from
national parks and urban areas.42 This leaves plenty of scope to pick sites with easy access,
cooperative landowners, simple construction and minimal environmental impact. Most sites are
close to the Great Dividing Range, within easy reach of the ANU’s proposed new transmission
backbone.
39
Presentation by Bin Lu, “100% renewable electricity”, slide 15.
https://www.google.com.au/url?sa=t&rct=j&q=&esrc=s&source=web&cd=19&cad=rja&uact=8&ved=0ahUKEw
ip3ZL61pLXAhVFkZQKHX6eDVw4ChAWCE0wCA&url=http%3A%2F%2Fwww.cleanenergysummit.com.au%2Fda
m%2Fclean-energy-summit%2Fagenda%2Faces-2017-presentations%2FTransitioning-the-generation-
fleet%2FBIN-LU-UPDATED%2FBIN%2520LU%2520UPDATED.pdf&usg=AOvVaw3t_X71AHXPbeS5YymKXell 40
Page 11, “100% renewable energy in Australia”, February 2017.
http://energy.anu.edu.au/files/100%25%20renewable%20electricity%20in%20Australia.pdf 41
Page 18, An atlas of pumped hydro energy storage, Andrew Blakers et al, ANU, 21st
September 2017.
https://www.dropbox.com/s/5s5cbwcw32ge18p/170919%20PHES%20Atlas.pdf?dl=0 42
An Atlas of pumped hydro energy storage, Andrew Blakers et al, ANU, 21st
Sept 2017.
https://www.dropbox.com/s/5s5cbwcw32ge18p/170919%20PHES%20Atlas.pdf?dl=0
16
www.ata.org.au November 2017
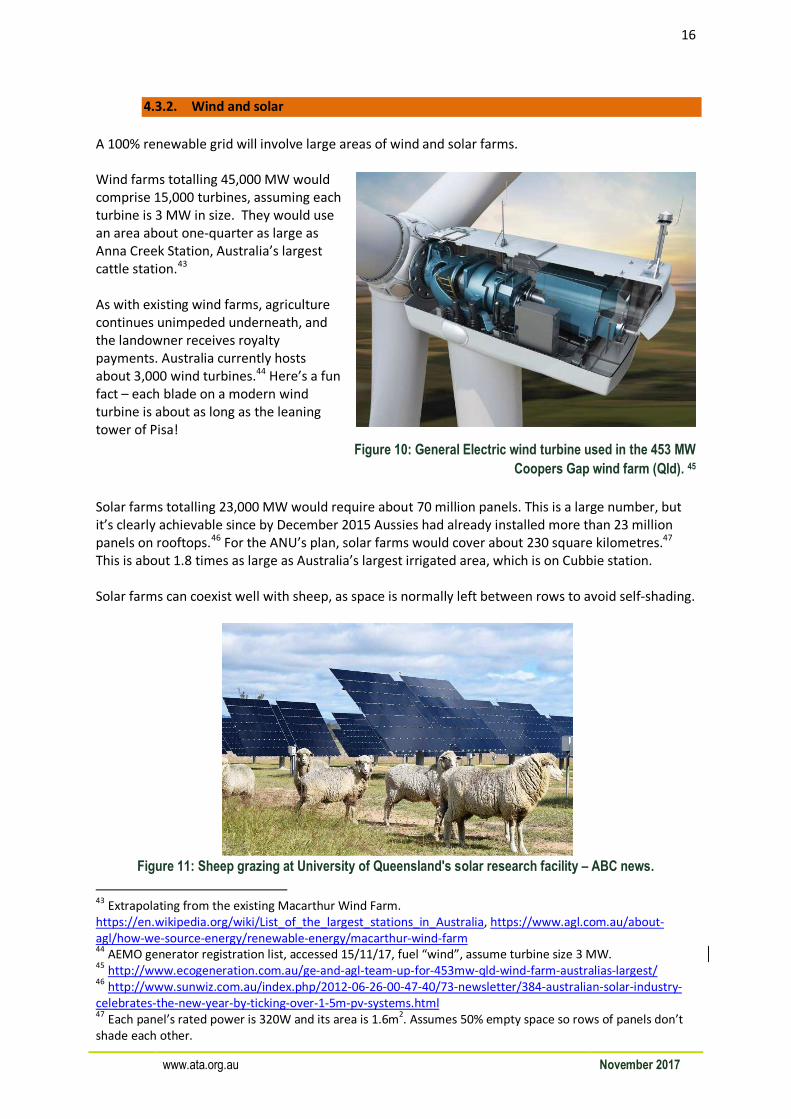
4.3.2. Wind and solar
A 100% renewable grid will involve large areas of wind and solar farms.
Wind farms totalling 45,000 MW would
comprise 15,000 turbines, assuming each
turbine is 3 MW in size. They would use
an area about one-quarter as large as
Anna Creek Station, Australia’s largest
cattle station.43
As with existing wind farms, agriculture
continues unimpeded underneath, and
the landowner receives royalty
payments. Australia currently hosts
about 3,000 wind turbines.44 Here’s a fun
fact – each blade on a modern wind
turbine is about as long as the leaning
tower of Pisa!
Figure 10: General Electric wind turbine used in the 453 MW
Coopers Gap wind farm (Qld). 45
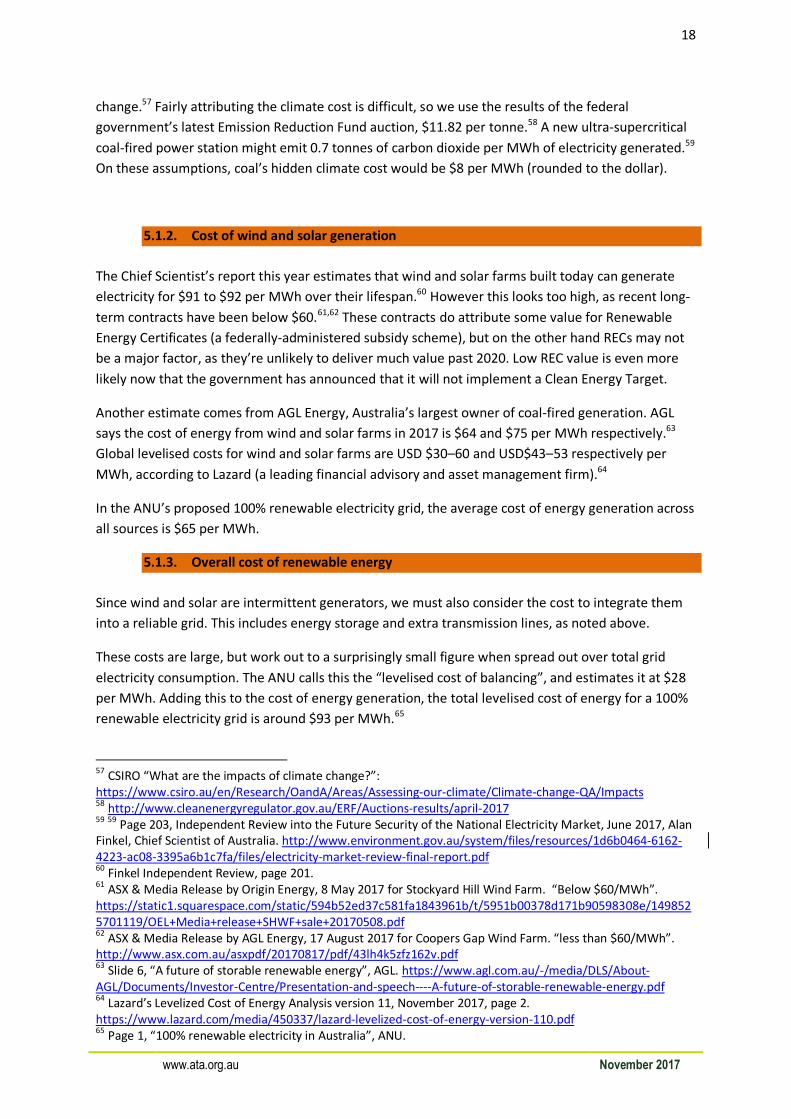
Solar farms totalling 23,000 MW would require about 70 million panels. This is a large number, but
it’s clearly achievable since by December 2015 Aussies had already installed more than 23 million
panels on rooftops.46 For the ANU’s plan, solar farms would cover about 230 square kilometres.47
This is about 1.8 times as large as Australia’s largest irrigated area, which is on Cubbie station.
Solar farms can coexist well with sheep, as space is normally left between rows to avoid self-shading.
Figure 11: Sheep grazing at University of Queensland's solar research facility – ABC news.
43
Extrapolating from the existing Macarthur Wind Farm.
https://en.wikipedia.org/wiki/List_of_the_largest_stations_in_Australia, https://www.agl.com.au/about-
agl/how-we-source-energy/renewable-energy/macarthur-wind-farm 44
AEMO generator registration list, accessed 15/11/17, fuel “wind”, assume turbine size 3 MW. 45
http://www.ecogeneration.com.au/ge-and-agl-team-up-for-453mw-qld-wind-farm-australias-largest/ 46
http://www.sunwiz.com.au/index.php/2012-06-26-00-47-40/73-newsletter/384-australian-solar-industry-
celebrates-the-new-year-by-ticking-over-1-5m-pv-systems.html 47
Each panel’s rated power is 320W and its area is 1.6m2. Assumes 50% empty space so rows of panels don’t
shade each other.

17
www.ata.org.au November 2017
5. Cost of electricity generation
Electricity from a 100% renewable grid would cost about $93/MWh, based on the ANU plan. This is
cheap compared to a new ultra-supercritical coal-fired power station, which would likely cost
between $81 and $182 per MWh, or $102 to $203 once we allow for the hidden health and climate
impacts. This reinforces the message from several previous studies48 which found that a 100%
renewable grid is economically competitive with other newly-built generators.
5.1 Levelised cost of energy
The average cost of generating energy over a power station’s lifespan is called the levelised cost of
energy, or LCOE. This is the sum of all costs including construction, operation and fuel divided by
total electricity generated. It also includes a discount rate to allow for the decreasing value of money
over time.49 With wind and solar, the cost is mostly incurred during construction – after that the fuel
is free. Conversely with fossil fuels the cost is spread out more evenly over the power station’s
lifespan.
5.1.1. Cost of coal-fired generation
A new, like-for-like replacement coal-fired power station could generate electricity for around $75-
$80 per MWh.50,51 However, proposals for new projects use the slightly less polluting ultra-
supercritical coal-burning technology. This has not yet been proven in Australia so costing is
uncertain, but estimates range from $8152 to $18253 per MWh once market financing costs are
included. These figures assume no carbon capture technology, which further increases costs to
prohibitive levels.54 It also excludes decommissioning and remediation costs, which can be large.
Coal-burning emits into the atmosphere particles and gases that reduce air quality and impact
people’s health. The cost of this health burden has been estimated at $13 per MWh in Australia.55
Also, each MWh generated in current Australian coal-fired power stations emits on average about 1
tonne of carbon dioxide gas56, which imposes current and future costs on Australia due to climate
48
For a list, see ATA’s paper “100% renewable grid – feasible”? 49
https://en.wikipedia.org/wiki/Cost_of_electricity_by_source#Levelized_cost_of_electricity 50
Page iii, Australian Power Generation Technology Report, CO2CRC, 2016.
http://www.co2crc.com.au/wp-content/uploads/2016/04/LCOE_Report_final_web.pdf 51
Page 201, Independent Review into the Future Security of the National Electricity Market, June 2017, Alan
Finkel, Chief Scentist of Australia. http://www.environment.gov.au/system/files/resources/1d6b0464-6162-
4223-ac08-3395a6b1c7fa/files/electricity-market-review-final-report.pdf 52
Ibid 53
Australian Financial Review, 3 February 2017 “Clean coal sounds good, but the numbers weigh against it”.
http://www.afr.com/business/mining/coal/clean-coal-sounds-good-but-the-numbers-weigh-against-it-
20170202-gu4220 54
Page iii, Australian Power Generation Technology Report, CO2CRC, 2016.
http://www.co2crc.com.au/wp-content/uploads/2016/04/LCOE_Report_final_web.pdf 55
Page “ii”, The Australian Academy of Technological Sciences and Engineering, “The Hidden Costs of
Electricity”, 2009: https://www.scribd.com/document/36842518/ATSE-Hidden-Costs-Electricity-report 56
Clean Energy Regulator, “Australia’s largest electricity generators”
http://www.cleanenergyregulator.gov.au/DocumentAssets/Documents/Australia%E2%80%99s%20largest%20
electricity%20generators%20factsheet.pdf
18
www.ata.org.au November 2017
change.57 Fairly attributing the climate cost is difficult, so we use the results of the federal
government’s latest Emission Reduction Fund auction, $11.82 per tonne.58 A new ultra-supercritical
coal-fired power station might emit 0.7 tonnes of carbon dioxide per MWh of electricity generated.59
On these assumptions, coal’s hidden climate cost would be $8 per MWh (rounded to the dollar).
5.1.2. Cost of wind and solar generation
The Chief Scientist’s report this year estimates that wind and solar farms built today can generate
electricity for $91 to $92 per MWh over their lifespan.60 However this looks too high, as recent long-
term contracts have been below $60.61,62 These contracts do attribute some value for Renewable
Energy Certificates (a federally-administered subsidy scheme), but on the other hand RECs may not
be a major factor, as they’re unlikely to deliver much value past 2020. Low REC value is even more
likely now that the government has announced that it will not implement a Clean Energy Target.
Another estimate comes from AGL Energy, Australia’s largest owner of coal-fired generation. AGL
says the cost of energy from wind and solar farms in 2017 is $64 and $75 per MWh respectively.63
Global levelised costs for wind and solar farms are USD $30–60 and USD$43–53 respectively per
MWh, according to Lazard (a leading financial advisory and asset management firm).64
In the ANU’s proposed 100% renewable electricity grid, the average cost of energy generation across
all sources is $65 per MWh.
5.1.3. Overall cost of renewable energy
Since wind and solar are intermittent generators, we must also consider the cost to integrate them
into a reliable grid. This includes energy storage and extra transmission lines, as noted above.
These costs are large, but work out to a surprisingly small figure when spread out over total grid
electricity consumption. The ANU calls this the “levelised cost of balancing”, and estimates it at $28
per MWh. Adding this to the cost of energy generation, the total levelised cost of energy for a 100%
renewable electricity grid is around $93 per MWh.65
57
CSIRO “What are the impacts of climate change?”:
https://www.csiro.au/en/Research/OandA/Areas/Assessing-our-climate/Climate-change-QA/Impacts 58
http://www.cleanenergyregulator.gov.au/ERF/Auctions-results/april-2017 59
59
Page 203, Independent Review into the Future Security of the National Electricity Market, June 2017, Alan
Finkel, Chief Scientist of Australia. http://www.environment.gov.au/system/files/resources/1d6b0464-6162-
4223-ac08-3395a6b1c7fa/files/electricity-market-review-final-report.pdf 60
Finkel Independent Review, page 201. 61
ASX & Media Release by Origin Energy, 8 May 2017 for Stockyard Hill Wind Farm. “Below $60/MWh”.
https://static1.squarespace.com/static/594b52ed37c581fa1843961b/t/5951b00378d171b90598308e/149852
5701119/OEL+Media+release+SHWF+sale+20170508.pdf 62
ASX & Media Release by AGL Energy, 17 August 2017 for Coopers Gap Wind Farm. “less than $60/MWh”.
http://www.asx.com.au/asxpdf/20170817/pdf/43lh4k5zfz162v.pdf 63
Slide 6, “A future of storable renewable energy”, AGL. https://www.agl.com.au/-/media/DLS/About-
AGL/Documents/Investor-Centre/Presentation-and-speech----A-future-of-storable-renewable-energy.pdf 64
Lazard’s Levelized Cost of Energy Analysis version 11, November 2017, page 2.
https://www.lazard.com/media/450337/lazard-levelized-cost-of-energy-version-110.pdf 65
Page 1, “100% renewable electricity in Australia”, ANU.
19
www.ata.org.au November 2017
5.2 Costs: renewables vs coal
As noted above, electricity from new-build coal-fired power stations would likely cost between $81
and $182 per MWh. This becomes a range of $102 to $203 once we allow for the hidden health
impacts ($13/MWh) and climate impacts ($8/MWh).
In a fully-renewable electricity grid, electricity would cost about $93 per MWh. This is in the lower
range of the cost estimates for new-build coal-fired generation, even if coal’s hidden costs are
ignored. If coal’s hidden costs are included, a renewables grid becomes cheaper than even the lower
estimate for coal.
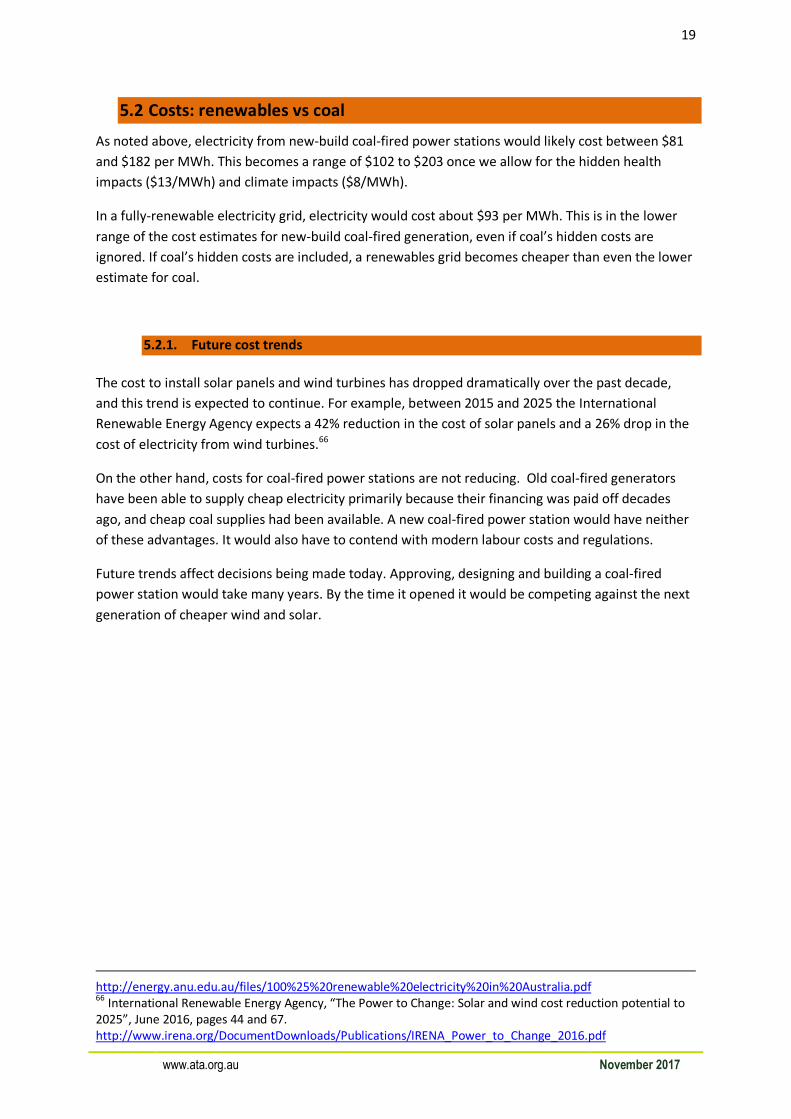
5.2.1. Future cost trends
The cost to install solar panels and wind turbines has dropped dramatically over the past decade,
and this trend is expected to continue. For example, between 2015 and 2025 the International
Renewable Energy Agency expects a 42% reduction in the cost of solar panels and a 26% drop in the
cost of electricity from wind turbines.66
On the other hand, costs for coal-fired power stations are not reducing. Old coal-fired generators
have been able to supply cheap electricity primarily because their financing was paid off decades
ago, and cheap coal supplies had been available. A new coal-fired power station would have neither
of these advantages. It would also have to contend with modern labour costs and regulations.
Future trends affect decisions being made today. Approving, designing and building a coal-fired
power station would take many years. By the time it opened it would be competing against the next
generation of cheaper wind and solar.
http://energy.anu.edu.au/files/100%25%20renewable%20electricity%20in%20Australia.pdf 66
International Renewable Energy Agency, “The Power to Change: Solar and wind cost reduction potential to
2025”, June 2016, pages 44 and 67.
http://www.irena.org/DocumentDownloads/Publications/IRENA_Power_to_Change_2016.pdf

20
www.ata.org.au November 2017
6. When can we have a 100% renewable grid?
Using the ANU plan as a target, we examine our progress towards a 100% renewable grid.
If Australia commences a proper effort in early 2018, ATA analysis shows that a fully-renewable
electricity grid is achievable by 2030. This 12-year timeframe allows for the renewable industry to
ramp up its capacity prior to a full-speed rollout in the final decade.
Constructing wind and solar generators at the rate seen in 2017, a fully-renewable grid will be
achieved in 2040. If this is accelerated by 80%, full renewable operation can occur a decade earlier,
in 2030.
The speed of transition is determined by wind and solar generation capacity, as energy storage
requirements can be largely covered by 2025. This assumes the construction of new, large pumped
hydro facilities in the Snowy Hydro scheme and in Tasmania, utilising existing dams.
6.1 Renewable generation capacity
Current solar and wind generation capacity is relatively small, only amounting to 16% and 10%
respectively of the levels required to fulfil the ANU plan.67 If we also include existing hydroelectric
and biomass generators, total renewable generation capacity in the National Electricity Market is
19,100 MW, which is 20% of the amount required for a fully-renewable grid. Most existing solar
panels are on rooftops, bought by householders assisted by government incentives.
In 2017, construction of wind and solar farms has reached a rate of around 2,200 MW of new
generating capacity per year.68,69 The pipeline is strong – AEMO has a big backlog of requests to
connect proposed new generators to the grid. This totals 21,000 MW, and all the generators on
AEMO’s list are renewable.70
Adding 1,000 MW of rooftop solar per year (see Section 3.1) gives a total of 3,200 MW per year.
Fully-renewable operation of the National Electricity Market requires 93,300 MW of renewable
generation capacity, according to the ANU.71 If construction of wind and solar generation continues
at the 2017 rate, this level will be attained in 2040. To reach this milestone by 2030 would require an
acceleration of 80% from the 2017 rate.
The following chart forecasts renewable generation capacity in megawatts (MW) and as a
percentage of 93,300 MW.
67
AEMO generator registration list, accessed 18/10/17, type “generator”,
APVI Market Analyses http://pv-map.apvi.org.au/analyses 68
https://www.cleanenergycouncil.org.au/news/2017/February/2017-renewable-energy-projects-snowy-
hydro.html 69
http://www.afr.com/news/agl-energy-wind-farm-helps-turn-clean-energy-wave-into-tsunami-20170818-
gxzbmm 70
Audrey Zibelman speaking at ATA event at Melbourne University, 20 September 2017. 19 minutes 40
seconds into the file, https://archive.org/details/SecuringAustraliasEnergyFutureSeptember202017 71
Page 16 & 17, “100% renewable electricity in Aus.”, ANU. Also added 8,300 MWh for existing hydro & bio.
http://energy.anu.edu.au/files/100%25%20renewable%20electricity%20in%20Australia.pdf

21
www.ata.org.au November 2017
Figure 12: Forecast renewable generation capacity.
6.2 Energy storage
Energy storage in 2017 is dominated by the pumped hydro facilities at Tumut 3 (Snowy Mountains),
Kangaroo Valley (near Shoalhaven) and Wivenhoe (near Brisbane). These can generate at a total
power of 2,240 MW and can store energy totalling nearly 60,000 MWh. Operation of these dams is
constrained by water flows, as they are part of other systems such as rivers.
A 100% renewable grid requires energy storage to supply about 30 hours of average demand,
according to the ANU. This equates to 490,000 MWh of energy storage.72
Many new energy storage projects are proposed – see Section 3.1.3 for details. We’ve assumed the
following projects will proceed.
- Jamestown battery (Tesla)
- Snowy Hydro 2.0
- Hydro Tasmania upgrades: “Battery of the nation”73
- Cultana and Kidston pumped hydro
- Big battery in Western Victoria
- “Aurora” concentrating solar thermal generator in Port Augusta
- 21 hilltop pumped hydro dams, following ANU example specifications noted in Section 4.3.1.
Completion year is estimated from public documents, except for the hilltop pumped hydro facilities.
The first of these is assumed to be built in 2022, with a rollout accelerating to a peak in 2027 and
then easing off to 2030. We haven’t included projects by industrial companies, such as the one
announced by Arrium.
72
Ibid. 73
Assumed 10 hours of energy storage, as the energy storage in GWh has not been announced.

22
www.ata.org.au November 2017
Homes and businesses are also installing batteries; we’ve followed the latest AEMO forecast.74 This
is conservative, as it only considers batteries included with new solar systems, not batteries
retrofitted to existing solar systems.
The following chart forecasts the construction of energy storage facilities by project category in the
National Electricity Market. Energy storage capacity is shown in megawatt-hours (MWh), and also as
a percentage of the 490,000 MWh required for a 100% renewable grid. “PH” is an abbreviation for
“pumped hydro”. The category “Other” includes Cultana, Kidston, Aurora and the Jamestown and
Victorian batteries.
Figure 13: Forecast energy storage capacity
Based on this forecast, energy storage will be sufficient to support a fully-renewable grid by 2030.
Pumped hydro projects dominate the chart. When Snowy 2.0 is constructed (estimated 2023), the
grid will already have 80% of the storage required for fully-renewable operation. By 2025 this level
has risen to 94%.
6.2.1. Energy storage: power
The previous section considered the amount of energy stored in each facility. This is the key
attribute to support a fully-renewable grid through a cloudy, calm week, as capacity is gradually
discharged to meet demand.
In a high-renewable future, energy storage facilities will also be called upon to rapidly discharge to
supply peaks in demand. Here the key measure is power delivery, measured in megawatts (MW).
The ANU found that a fully-renewable grid requires energy storage capable of discharging at a total
power level of 18,200 MW.75
74
AEMO National Electricity Forecasting Report 2016, pages 29 & 31. Averaged the forecasts for 20-21 and 25-
26. Assumed 1.56 hours to discharge, consistent with numbers for 2035-36. 75
Page 17, “100% renewable electricity in Australia”, ANU. Also added 2,240 MW for existing hydro & bio.
23
www.ata.org.au November 2017
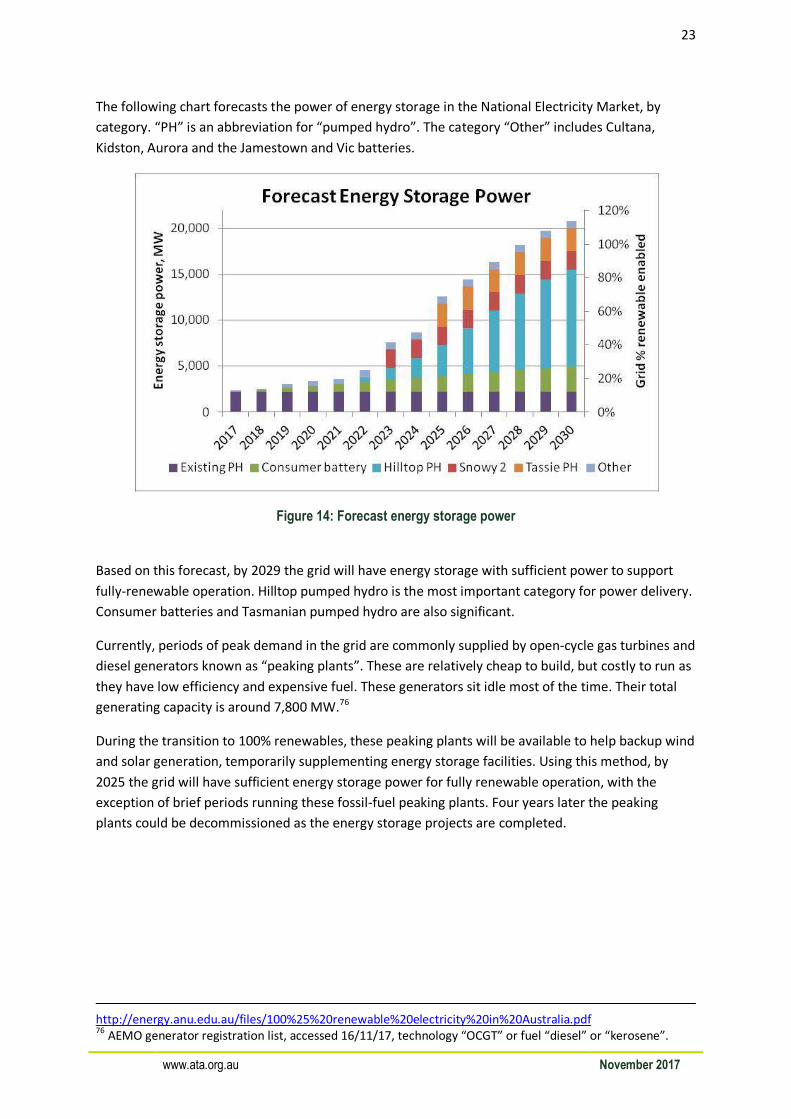
The following chart forecasts the power of energy storage in the National Electricity Market, by
category. “PH” is an abbreviation for “pumped hydro”. The category “Other” includes Cultana,
Kidston, Aurora and the Jamestown and Vic batteries.
Figure 14: Forecast energy storage power
Based on this forecast, by 2029 the grid will have energy storage with sufficient power to support
fully-renewable operation. Hilltop pumped hydro is the most important category for power delivery.
Consumer batteries and Tasmanian pumped hydro are also significant.
Currently, periods of peak demand in the grid are commonly supplied by open-cycle gas turbines and
diesel generators known as “peaking plants”. These are relatively cheap to build, but costly to run as
they have low efficiency and expensive fuel. These generators sit idle most of the time. Their total
generating capacity is around 7,800 MW.76
During the transition to 100% renewables, these peaking plants will be available to help backup wind
and solar generation, temporarily supplementing energy storage facilities. Using this method, by
2025 the grid will have sufficient energy storage power for fully renewable operation, with the
exception of brief periods running these fossil-fuel peaking plants. Four years later the peaking
plants could be decommissioned as the energy storage projects are completed.
http://energy.anu.edu.au/files/100%25%20renewable%20electricity%20in%20Australia.pdf 76
AEMO generator registration list, accessed 16/11/17, technology “OCGT” or fuel “diesel” or “kerosene”.

24
www.ata.org.au November 2017
6.1 Targets by political parties
For reference, the following chart shows an indicative path to 2030, accompanied by targets
contained in policies of three federal political parties as at 3/11/17.77
Figure 15: Political policies/targets for renewable electricity
Please note that this chart forecasts electrical energy generated by year. This doesn’t directly
correspond to the other forecast charts as they show generating capacity instead. Nevertheless it
provides a useful comparison.
77
https://www.liberal.org.au/our-plan/protecting-our-environment, http://www.alp.org.au/renewableenergy,
https://greens.org.au/sites/greens.org.au/files/2015_11_Renew_Australia.pdf
25
www.ata.org.au November 2017
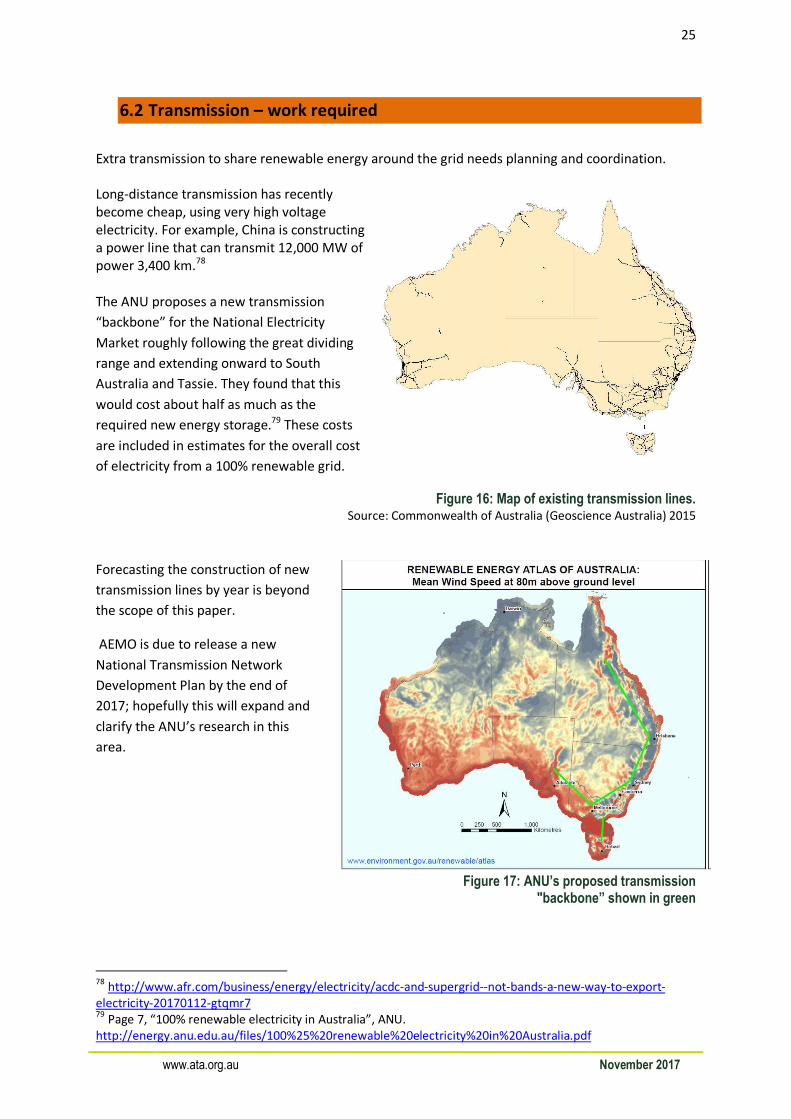
6.2 Transmission – work required
Extra transmission to share renewable energy around the grid needs planning and coordination.
Long-distance transmission has recently
become cheap, using very high voltage
electricity. For example, China is constructing
a power line that can transmit 12,000 MW of
power 3,400 km.78
The ANU proposes a new transmission
“backbone” for the National Electricity
Market roughly following the great dividing
range and extending onward to South
Australia and Tassie. They found that this
would cost about half as much as the
required new energy storage.79 These costs
are included in estimates for the overall cost
of electricity from a 100% renewable grid.
Figure 16: Map of existing transmission lines. Source: Commonwealth of Australia (Geoscience Australia) 2015
Forecasting the construction of new
transmission lines by year is beyond
the scope of this paper.
AEMO is due to release a new
National Transmission Network
Development Plan by the end of
2017; hopefully this will expand and
clarify the ANU’s research in this
area.
Figure 17: ANU’s proposed transmission "backbone” shown in green
78
http://www.afr.com/business/energy/electricity/acdc-and-supergrid--not-bands-a-new-way-to-export-
electricity-20170112-gtqmr7 79
Page 7, “100% renewable electricity in Australia”, ANU.
http://energy.anu.edu.au/files/100%25%20renewable%20electricity%20in%20Australia.pdf

26
www.ata.org.au November 2017
6.3 Renewable generation by state
Once the big energy storage and transmission projects are complete, there will be no problem
accommodating intermittent renewable generation. Until then, their rollout must be managed to
avoid local issues such as wind curtailment in South Australia (see Section 3.1.4 above).
Currently, wind and solar farms are not distributed evenly among the states. The following chart
shows the total registered generating capacity of wind and solar capacity, as a proportion of total
capacity in each state in the National Electricity Market.80,81
Figure 18: Proportion of generating capacity from intermittent renewables, by state
States having a low value in this chart such as NSW and QLD can easily accommodate the
construction of more wind and solar farms. Their existing fossil fuel generation can supply demand
during poor weather and also supply other needs such as system strength.
There is no need to slow down Australia’s current rate of renewable generation; it just needs
geographic re-balancing.
80
AEMO generator registration list, accessed 1/11/17, type “generator”, fuel “solar” or “wind”. 81
http://pv-map.apvi.org.au, accessed 16/11/17, NSW includes ACT too.

27
www.ata.org.au November 2017
7. Alternative options
A feature of the plan described above is that it largely relies only on proven, well-understood
technology: wind farms, solar panels and pumped hydro energy storage. Hydroelectric pumps and
generators are heavy spinning machines, so as well as energy they also naturally provide all the
other services of fossil fuel generators such as inertia and system strength.
There are other ways Australia could achieve a fully-renewable grid. More energy could be provided
by concentrating solar thermal generators such as the “Aurora” project described in Section 3.1.3
above. This integrates into a single facility both energy generation and storage, and can also provide
inertia and system strength. Batteries could potentially play a bigger role, reducing the amount of
pumped hydro required. Breakthroughs could occur with currently immature technologies such as
wave energy or geothermal energy (using underground heat via deep bores).
We support a flexible approach to take advantage of new opportunities arising during the transition.
We don’t support a “wait and see” attitude. Wind, solar and pumped hydro should be built straight
away as they are already economic, and their clean energy, storage and other services will make an
important contribution regardless of future developments.
7.1 Future electricity consumption
Plans for a fully-renewable grid aim to supply the same amount of electricity as our current grid.
However, future demand may be different. Australia has massive opportunities to improve energy
efficiency82, for example by improving building insulation. This directly lowers consumers’ bills,
improves comfort and also reduces the investment required to replace ageing fossil-fuel generators.
In the future, our nation’s total electricity demand could be much lower than now. For example,
Australia consumes 44% more electricity per capita than Germany, a country with high industrial
output and a more severe climate.83 Beyond Zero Emissions estimated that Australia’s total energy
consumption could be halved.84
On the other hand, electricity consumption could rise as people install efficient electric appliances to
replace their old gas ones.85 Similarly, electricity may displace fossil fuels for transport.
These two trends tend to cancel each other out, but their
magnitude is uncertain. It seems sensible to plan the grid
to supply current demand.
Excluding these two trends, electricity consumption is not
expected to change much to 2030, as its growth largely
halted in 2009.86
82
Also known as energy productivity. 83
United Nations World Development Indicators, annual kWh per capita, 2013. Aus 10,134, Germany 7,019.
http://data.un.org/Data.aspx?d=WDI&f=Indicator_Code%3AEG.USE.ELEC.KH.PC 84
page 13, Beyond Zero Emissions, “Zero Carbon Australia 2020 Stationary Energy Plan” 2010.
http://media.bze.org.au/ZCA2020_Stationary_Energy_Report_v1.pdf 85
ATA, “Are we still cooking with gas?”,
http://www.ata.org.au/wp-content/projects/CAP_Gas_Research_Final_Report_251114_v2.0.pdf 86
https://www.aer.gov.au/wholesale-markets/wholesale-statistics/national-electricity-market-electricity-
consumption

28
www.ata.org.au November 2017
7.1 Less-connected options
Our future electricity grid described above has multiple strong connections within and between
states. Sharing electricity around the country minimises total investment in wind and solar farms.
It may be possible for each state to autonomously achieve a fully-renewable electricity grid.
However, this would require a much larger investment to retain the current level of service. For
example, to supply itself through a cloudy, calm winter week, Victoria would need to build a very
large amount of generation and/or energy storage.
Similarly, self-sufficiency for individual towns and cities would be an expensive proposition. We
believe cities and large industrial sites should retain a grid connection. Ideally they will generate
much of their own electricity, but the grid allows surpluses and shortfalls to be balanced.
An exception is small, remote towns and properties connected to the grid with long, expensive lines.
In these cases self-sufficiency may be the best option, as the savings in line maintenance often
outweigh the extra investment required in local generation and storage. The off-grid option is also
likely to be more reliable than a long power line through the bush.87
8. How will we manage energy storage?
In a high-renewable grid the key challenge is to get through a cloudy, calm week. This is a familiar
concept to families living in off-grid houses – battery energy must be conserved for the week’s end.
In the National Electricity Market, assets are controlled by their owners who operate them to
maximise individual profits. Owners of energy storage will be tempted to discharge whenever the
electricity spot price is high, rather than conserving energy for later. If they control newly-built
energy storage, market traders will gain even more scope to “game” the market.
To ensure that energy storage can be managed effectively in the future, authorities should review
the relevant market rules. Perhaps AEMO should control large-scale energy storage and operate it
according to well-defined, transparent rules. This energy storage would act to smooth out demand
for electricity, discharging at times of peak demand and charging at other times. By including energy
storage in their published short-term electricity forecasts, AEMO would provide a more stable load
against which generators could bid. This would reduce market volatility and consumer costs.
A precedent is Hydro Tasmania, which manages all the hydroelectric generation in Tasmania
cooperatively, conserving energy to meet future electricity demand.
Under this approach, energy storage could be owned by private companies. AEMO would contract
companies to construct and operate the facilities, and would pay them an agreed annual fee for this
service. AEMO would recover its costs through market fees as usual. The companies could be
selected via tender. A precedent is AEMO’s existing contracts for “black start” services.
87
Rule change submission by Energy Networks Australia, ATA and PIAC, 8/11/17:
https://www.ata.org.au/news/moving-beyond-poles-and-wires-2

29
www.ata.org.au November 2017
9. What does all this mean for consumers?
9.1 Electricity prices
One way or another, money must be spent to refresh Australia’s ageing fleet of power stations.
Unfortunately, none of the replacement options is likely to generate electricity as cheaply as the old,
paid-off coal-fired power stations. The wholesale electricity price is unlikely to return to the
abnormally low levels of the 1990s and 2000s.
On the other hand, electricity generation only makes up about a third of household electricity bills.88
The bulk of our bills go to maintaining electricity distribution “poles and wires”, retailer call centres,
profits etc. All these components have good scope for reduction, as found recently by the ACCC.89
Electricity prices are notoriously hard to predict. We recommend that households expect continuing
volatility. Consumers should shop around for a good deal on their electricity.
9.2 Energy efficiency
The total bill is what matters to a consumer. Even if electricity tariffs rise, smarter use of energy can
see the total bill fall.
The ATA recommends that consumers understand their energy consumption and take steps to
manage and reduce it. Most households have opportunities such as:
• turning off lights and appliances that aren’t in use
• draught sealing, e.g. around windows and doors
• insulation and window shading
• LED lights and efficient appliances.
9.3 Rooftop solar
A well-planned solar system pays for itself quickly these days. Equipment prices have dropped
rapidly, and feed-in tariffs are now decent in most locations. However, adding a battery is generally
not yet economic since its additional bill savings are small compared to its additional upfront cost.
For a quick, easy indication of bill savings from solar and batteries in your household, please refer to
www.ata.org.au/ata-solar-advice.
Renters and apartment-dwellers can find solar tricky to install. Solutions exist, such as devices to
cleverly share a solar system’s generation among apartments90, and smart financing such as
Environmental Upgrade Agreements.91 Policymakers should remove barriers to their uptake.
88
Page 27, “Retail electricity price history and projected trends”, Jacobs for AEMO,
http://www.aemo.com.au/-/media/Files/Electricity/NEM/Planning_and_Forecasting/EFI/Jacobs-Retail-
electricity-price-history-and-projections_Final-Public-Report-June-2017.pdf 89
Retail Electricity Pricing Inquiry, Prelim. Report 22 September 2017. Aust. Competition & Consumer
Commission.
https://www.accc.gov.au/system/files/ACCC%20Retail%20Electricity%20Pricing%20Inquiry%20-
%20Preliminary%20Report%20-%2022%20September%202017.pdf 90
Eg Allume Energy, http://www.afr.com/leadership/entrepreneur/startup-allume-lets-solar-panels-be-
shared-by-strata-dwellers-20170228-gun689

30
www.ata.org.au November 2017
9.4 What if the transition is halted?
It’s possible that investment in wind and solar generation could dry up, if government policy works
against it.
If this occurs, new fossil fuel generators would have to be built to replace the ageing coal-fired
power stations. This would be a poor outcome for consumers, locking Australia into purchasing coal
and gas for many decades to come.
This would also be an uncertain course. It takes many years to approve, plan and build a new coal-
fired power station. During this time political opposition to fossil fuels may harden, especially as the
impact of climate change becomes obvious and harder to deny. Construction would likely attract
vigorous local protests.
Potentially we could be left with abandoned fossil fuel projects and no backup plan, leading to
power shortages.
Figure 19: Anglesea coal mine and power station in Vic. Closed August 2015.
Photo: Flickr user Takver, licensed under CC BY-SA 2.0
91
http://sustainablemelbournefund.com.au/services/environmental-upgrade-finance/

31
www.ata.org.au November 2017
10. Conclusion
Australia should transition quickly to a 100% renewable electricity grid, as it is cheaper and less risky
than the alternative of building new coal-fired power stations. This can be achieved by 2030 by
accelerating the installation of wind and solar generation by 80% (compared to 2017 rates), backed
up by pumped hydro energy storage facilities and extra transmission lines.
Electricity from new-build coal-fired power stations would likely cost between $81 and $182 per
MWh. This becomes a range of $102 to $103 once we allow for hidden health impacts ($13/MWh)
and climate impacts ($8/MWh). In a fully-renewable electricity grid, electricity would cost about $93
per MWh.92 This includes the cost of building energy storage and extra transmission to manage
intermittency.
The cost of renewable electricity is already in the lower range of the cost estimates for new-build
coal-fired generation, even if coal’s hidden costs are ignored. And renewable costs will fall further in
the future.
Retail electricity prices from the 1990s are unlikely to return, regardless of the option chosen.
Consumers are advised to shop around for a good deal, work on reducing their energy consumption
and install rooftop solar if possible. Energy efficiency must not be neglected. Although this paper’s
focus is on electricity generation, Australia has massive opportunities to save money and help the
environment by getting smarter about how we use energy.
Australia should prepare a proper plan for 100% renewable energy, and implement it. Decisions
should not be left to separate companies driven by short-term profits, as this may lead to a poor
overall system. Until Snowy Hydro 2.0 is built, wind and solar should focus on NSW and QLD as their
level of renewables is low. This will avoid the operational problems that see the market operator
ordering South Australian wind farms to reduce their output, burning expensive gas instead of using
free wind. Authorities should also address how to manage a high-renewable grid – the energy
market must ensure that energy stores can be conserved for use at the end of a cloudy, calm week.
Figure 20: Amazon CEO Jeff Bezos opening a new 253 MW wind farm in Texas, October 2017 93.
92
Ibid 93
https://www.cnbc.com/2017/10/19/amazons-jeff-bezos-has-just-opened-a-massive-wind-farm-in-
texas.html

32
www.ata.org.au November 2017
11. Glossary
AEMO Australian Energy Market Operator https://www.aemo.com.au/About-
AEMO
Alternating Current (AC) An electric current in which the flow of electric charge periodically
reverses direction, e.g. 50 cycles per second.
ATA
Bagasse
Alternative Technology Association www.ata.org.au
Residue left over from processing sugar cane.
Base Load (1) Demand for electricity that’s always present – minimum demand.
(2) A power station that can operate when desired, not dependent on
weather etc.
Biofuel Liquid fuel made from biological sources, e.g. ethanol from sugarcane or
biodiesel from canola.
Biogas Methane gas created from biological sources such as landfill sites.
Biomass Woody waste such as sawdust and crop stubble.
BZE Beyond Zero Emissions, http://bze.org.au
Carbon Capture & Storage (CCS) A way to lock up carbon dioxide emitted by power plants.
Concentrated Solar Thermal (CST) A power station using mirrors to concentrate sunlight creating heat.
CSIRO Commonwealth Scientific And Industrial Research Organisation,
www.csiro.au
Curtail Instruct a generator to reduce its output.
Current The flow of electricity. Similar to the flow rate in a water pipe.
Demand Response Mode (DRM) A method of remotely controlling appliances, to assist the grid.
Dispatch An instruction from the grid operator to a power station.
Grid fault A disruption in the grid with abnormal electric current, e.g. due to a
short-circuit or lightning strike.
Inertia A useful property of resisting change in speed.
Big, heavy things naturally have this property.
Interconnector An electricity transmission line connecting two states.
Intermittent generation Generation that varies depending on weather conditions etc.
Megawatt (MW) A unit of power (1 million watts). More than 1,000 horsepower.
Megawatt-hour (MWh) A unit of energy (1 million watt-hours). Equal to 1 MW for 1 hour.
Levelised Cost of Energy (LCOE) The cost of energy from a power station, averaged over its lifespan.
National Electricity Market (NEM) The electricity grid covering most of Australia, and its associated market
for companies to buy and sell electricity. Excludes WA & NT.
Pumped Hydro Pumping water uphill, to store energy.
Voltage (Volts, V) A kind of force that drives electric current. Similar to pressure in a water
pipe.