10 years of research on Power Management (now called green computing) Rami Melhem Daniel Mosse Bruce...
35
10 years of research on Power Management (now called green computing) Rami Melhem Daniel Mosse Bruce Childers
-
Upload
angel-daniel -
Category
Documents
-
view
223 -
download
4
Transcript of 10 years of research on Power Management (now called green computing) Rami Melhem Daniel Mosse Bruce...

10 years of research on Power Management
(now called green computing)
Rami Melhem
Daniel Mosse
Bruce Childers

• Introduction• Power management in real-time systems• Power management in multi-core processors• Performance-Resilience-Power Tradeoff • Management of memory power• Phase Change Memory

Power management techniques
Two common techniques:
1) ThrottlingTurn off (or change mode of) unused components (Need to predict usage patterns to avoid time and energy overhead of on/off or mode switching)
2) Frequency and voltage scalingScale down core’s speed (frequency and voltage)
Designing power efficient components is orthogonal to power management

Frequency/voltage scaling
• Gracefully reduce performance• Dynamic power Pd = C f 3 + Pind
• Static power: independent of f. power
Static power
time
C f 3
Pind
timeWhen frequency is halved:• Time is doubled• C f 3 is divided by 8• Energy caused by C f 3 is divided by 4• Energy caused by Pind is doubled
Idle time

• Minimize total energy consumption
- static energy decreases with speed
- dynamic energy increases with speed
• Minimize the energy-delay product – Takes performance into consideration
• Minimize the maximum temperature• Maximize performance given a power budget• Minimize energy given a deadline• Minimize energy given reliability constraints
Different goals of power management
Ene
rgy*
dela
y
f
Pind / f 2
C f
ener
gy
Speed (f)
C f 2
total
Pind / f

DVS in real-time systemsCPU speed
time
deadlineSmax
Smin
Worst case execution
Remaining time
• Utilize slack to slow down future tasks (Proportional, Greedy, aggressive,…)
timeStatic scaling
(power management points)
Dynamic scaling
Remaining time

Implementation of Power Management Points
•Can be implemented as periodic OS interrupst
• Difficulty: OS does not know how much execution is remaining
• Compiler can insert code to provide hints to the OS
min average max
branch
loop

Example of compiler/OS collaboration
•Compiler records WCET based on the longest remaining path
At a power management hint
min average max
At a power management point•OS uses knowledge about current load to set up the speed

Run-timeinformation
OS/HW(knows the
system)
Compiler/OS collaboration
Compiler(knows the
task)
Static analysis
Application Source Code
Application Source Code
PMHs: Power management hints
PMPs: Power management
points
Interrupts for executing PMPs
PMHs
time

DVS for multiple cores
Manage energy by determining:
• The speed for the serial section• The number of cores used in the
parallel section• The speed in the parallel section
One core
Two cores
Slowing down the cores
Slowing down the parallel section
To derive a simple analytical model, assume Amdahl’s law: - p % of computation can be perfectly parallelized.
p
Using more cores
s

• Streaming applications are prevalent– Audio, video, real-time tasks, cognitive
applications
• Constrains:– Inter-arrival time (T)– End-to-end delay (D)
• Power aware mapping to CMPs– Determine speeds– Account for communication– Exclude faulty cores
T
D
Mapping streaming applications to CMPs

Mapping a linear task graph onto a linear pipeline
If the # of stages = # of cores
Core Core Core Core
Dt stage
n
stage stage )(
0
Tt stagestagestage )(max
)(0 stage
n
stage stagee minimize
Subject to
ei : energy for executing stage i
ei : energy for moving data from stage i-1 to stage i
ti : time for executing stage i
ti : time for moving data from stage i-1 to stage i
Find tstage

1) Group the stages so that the number of stages equals the number of cores
2) Use a dynamic programming approach to explore possible groupings
3) A faster solution may guarantee optimality within a specified error bound.
Core Core Core Core
If the # of stages > # of cores
Mapping a linear task graph onto a linear pipeline

• Timing constraints are conventionally satisfied through load balanced mapping
• Additional constraint– Minimize energy consumption
– Maximize performance for a given energy budget
– Avoid faulty cores
instance
instance
A
B C
E
D
FG H I
J
K
Mapping a non-linear task graph onto CMP
A
B
C
D
FEG
H IJ
K
Maximum speed
Medium speed
Minimum speed

Turn OFF some PEs
Maximum speed/voltage (fmax)
instance
instance
A
B C
E
D
FG H I
J
K
A
B C
D
F
E G
H
I
J
K
Medium speed/voltage
Minimum speed/voltage (fmin)
PE OFF

DVS using Machine Learning
Characterize the execution state of a core by• Rate of instruction execution (IPC) • # of memory accesses per instruction• Average memory access time (depends on other threads)
During training, record for each state• The core frequency • The energy consumption
Determine the optimal frequency for each state
During execution, periodically,Estimate the current state (through run-time measurements)Assume that the future is a continuation of the presentSet the frequency to the best recorded during training
MMC
core
L1 $$
core core core
L1 $$ L1 $$ L1 $$
L2 $$ L2 $$ L2 $$ L2 $$

17
Training phase
Runtime
Learning
engine
determine freq. & voltages
Integrated DVS policy
Auto. policy generator
Statistical learning applied to DVS in CMPs.

deadline
If you have a time slack:
1) add checkpoints
2) reserve recovery time
3) reduce processing speed
For a given number of checkpoints, we can find the speed that minimizes energy consumption, While guaranteeing recovery and timeliness.
Smax
Using time redundancy (checkpointing and rollbacks)
Energy-Reliability tradeoff

More checkpoints = more overhead + less recovery slack
D
C
r
Optimal number of checkpoints
For a given slack (C/D) and checkpoint overhead (r/C),we can find the number of checkpoints that minimizes energy consumption, and guarantee recovery and timeliness.
# of checkpoints
Energy

Faults are rare events
If a fault occurs, may continue executing at Smax after recovery.

Non-uniform check-pointing
Observation: If a fault occurs, may continue executing at Smax after recovery.
Advantage: recovery in an early section can use slack created by execution of later sections at Smax
Disadvantage: increases energy consumption when a fault occurs (a rare event)
Requires non-uniform checkpoints.
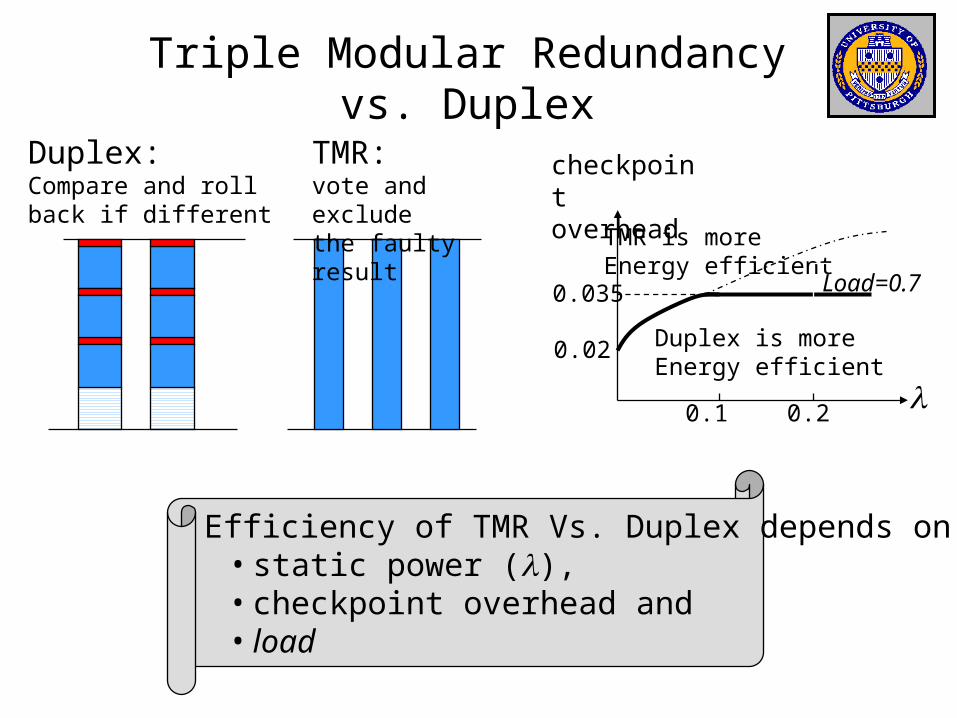
Triple Modular Redundancy vs. Duplex
TMR: vote and exclude the faulty result
Duplex: Compare and rollback if different
Efficiency of TMR Vs. Duplex depends on • static power (l), • checkpoint overhead and • load
Duplex is more Energy efficient
TMR is more Energy efficient
0.02
0.035 Load=0.7
l0.1 0.2
checkpoint overhead

Add memory power to the mix
Example: DRAM and SRAM modules can be switched between different power states (modes) – not free:
- Mode transition power overhead- Mode transition time overhead
Active(779.1 mW)
Power-down(150 mW)
Standby(275.0 mW)
Self-refresh(20.87 mW)
5ns5ns1000ns5ns
auto

• keep a histogram for patterns of bank accesses and idle time distributions.
• Use machine learning techniques to select the optimal “threashold” to turn banks off.
OS assisted Memory Power Management?

Example of compiler assisted Memory Power Management?
….Load x ….Store x….Load z….Load y….Store z….Store y….….
Load x Load y….….….….….….Store yLoad z….Store z
Compiler transformation
Code transformations to increase the memory idle time (the time between memory accesses).

Declare A[], B[], C[], D[]….Access A….Access D….Access B….Access C….Access B….….
Memory allocation
Algorithms that use the access pattern to allocate memory to banks in a way that maximizes bank idle times
A[], B[] C[], D[]
A[], D[] C[], B[]
OR
Example of compiler assisted Memory Power Management?

Phase Change Memory (PCM)A power saving memory technology
• Solid State memory made of germanium-antimony alloy
• Switching between states is thermal based (not electrical based)
• Samsung, Intel, Hitachi and IBM developed PCM prototypes (to replace Flash).
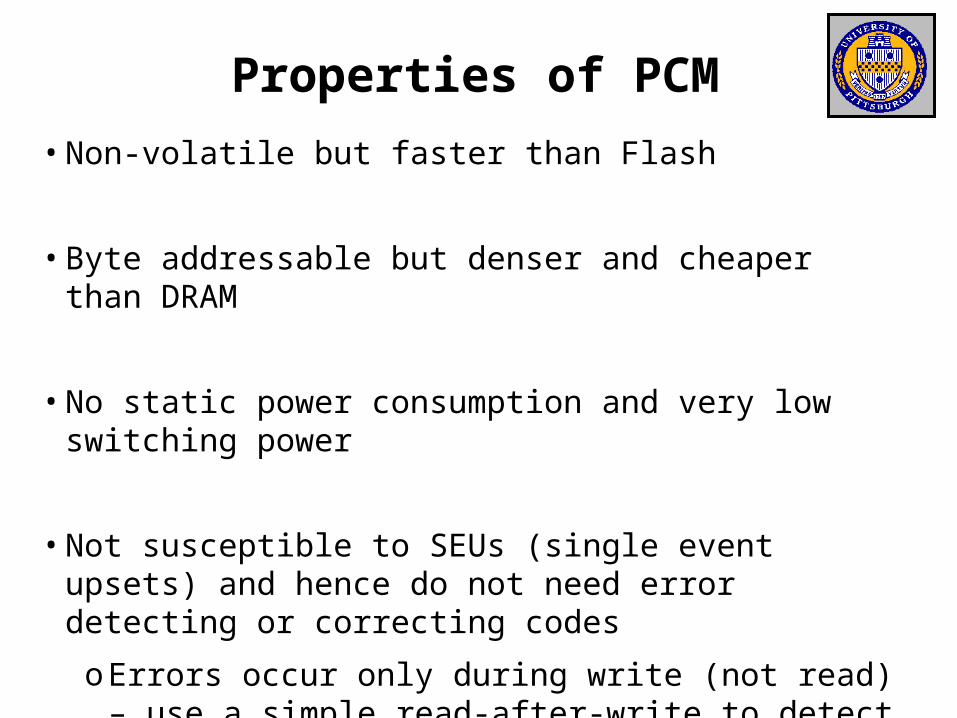
Properties of PCM
• Non-volatile but faster than Flash
• Byte addressable but denser and cheaper than DRAM
• No static power consumption and very low switching power
• Not susceptible to SEUs (single event upsets) and hence do not need error detecting or correcting codes
oErrors occur only during write (not read) – use a simple read-after-write to detect errors

So, where is the catch?
• Slower than DRAM
• factor of 2 for read and 10 for write
• Low endurance
• A cell fails after 107 writes (as opposed to 1015 for DRAM)
• Asymmetric energy consumption
• write is more expensive than read
• Asymmetry in bit writing
• writing 0s is faster than writing 1s

CPU
MemoryController
DRAM
CPU
AEB MM
PCM
Traditional architecture Proposed architectureAEB: acceleration/endurance bufferMM: memory manager
Goal: use PCM as main memory
Advantages: cheaper + denser + lower power consumption

Dealing with asymmetric read/write
• Use coherence algorithms in which “writes” are not on the critical path.
• Design algorithms with “read rather than write” in mind
• Take advantage of the fact that writing 0s is faster than 1s
• Pre-write a block with 1’s as soon as block is dirty in the cache
• On write back, only write 0’s .

Dealing with low write endurance(write minimization)
• Block (or page) allocation algorithms should not be oblivious to the status of the block – for wear minimization
• Modify the cache replacement algorithm
• ex. LRR replacement (least recently read)
• Lower priority to dirty pages in cache replacement
• Use coherence algorithms that minimize writes (write-through is not good)
• Read/compare/write == write a bit only if it is different than the current content

Wear leveling
• Memory allocation decisions should consider age of blocks (age = number of write cycles exerted)
• Periodically change the physical location of a page (write to a location different than the one read from)
• Consider memory as a consumable resource - can be periodically replaced

Memory Manager
CPUBus
Interface
Request ControllerTag Array
V St CPU R/W Size Tag AEB PCM
Requests Buffer
In FlightBuffer
(SRAM)
FSM
DRAMController/DMAC
PCMController/DMAC
V D Addr
n
In Flight Buffer Busy Bitmap
AEB
PageCache
In FlightBuffer
Spare Table
PCM
PagesArea
Spares
V D AddrV D Addr
Control bus
Data bus
Detailed architecture

Conclusion
Time constrains(deadlines or rates) Energy constrains
Reliability constrains
It is essential to manage the tradeoffs between
Hardware
Compiler OS