10 Steps to Creating a Conversation: Community Design for ... · 10 Steps to Creating a...
29
10 Steps to Creating a Conversation: Community Design for Affordable Homes and Sustainable Places Michael S. Blau Village of Tarrytown Adam Lubinsky, PhD, AICP WXY architecture + urban design William Morrish The New School Rose Noonan Housing Action Council
Transcript of 10 Steps to Creating a Conversation: Community Design for ... · 10 Steps to Creating a...

10 Steps to Creating a Conversation:
Community Design for Affordable
Homes and Sustainable Places
Michael S. Blau
Village of Tarrytown
Adam Lubinsky, PhD, AICP
WXY architecture + urban design
William Morrish
The New School
Rose Noonan
Housing Action Council

10 S T E P S T O C R E A T I N G A C O N V E R S AT I O N
Community Design for Affordable Homes and
Sustainable Places
Community leaders, professional experts and citi-zens of Westchester County’s municipalities have been working hard in the last few years to generate a public conversation for a local and regional vision of thriving, beautiful, sustainable and diverse com-munities that integrate affordable homes.1
It is not a simple planning, design and develop-ment process to achieve this vision. Rather, it is a complicated problem that calls for pre-development community design conversa-tions where stakeholders can “model” a diverse set of issues and desired outcomes, such as land use planning at the regional and local levels, local needs for school seats, open space, affordable housing, economic growth and location-specific concerns. This effort is intended to develop an alterna-tive, more inclusive approach to modeling future design and planning that may be of use to many communities in Westchester at a time when the social, physical and ecological realities of Westchester County are changing. Its residents
are getting older on average, and driving less, and others are increasingly working at or closer to home. Local residents seek different lifestyles which demand changes in infrastructure services, ecologically responsible rules, extended recre-ational networks and new mixed use land uses. Existing infrastructure is aging and working at full capacity and natural systems are under stress. New development that includes affordable homes can play a role in meeting these demands. There is an opportunity to generate a new con-versation in which affordable housing is a part of the wider visioning about the potential direction of the municipalities within Westchester. This workbook outlines a process of gather-ing, organizing and synthesizing a large stack of reports, plans and data into a set of next genera-tion interactive workshop tools that can be used to understand multiple stakeholder values, to visual-ize impacts and opportunities in a transparent way, and to document decision-making negotiations in order to shape the design of new developments in
the context of broader community change. Communities in Westchester can use this workbook to envision the role that development can play in achieving affordable and sustainable communities and to understand a process that will help them achieve this. This process can lead to direct benefits by facilitating a shared vision for communities and achieving new development more inclusively, more effectively and more efficiently for all involved.
1 “Affordable” and “affordability” are complex terms that vary according to community, state and national crite-ria. Affordability is broadly defined as a household that pays no more than 30% of their monthly gross income towards housing. The U.S. Department of Housing and Urban Development (HUD) sets income limits for a variety of housing programs based on a standard called the Area Median Income (AMI) for each metropolitan statistical area and which is further adjusted for family size. This model uses a 50% AMI for affordable housing units in Westchester County, which assumes an income of $36,500 for a 1-person household, $41,700 for a 2-person house-hold and $52,100 for a 4 person household in 2013.
2 1 0 S T E P S T O C R E A T I N G A C O N V E R S A T I O N
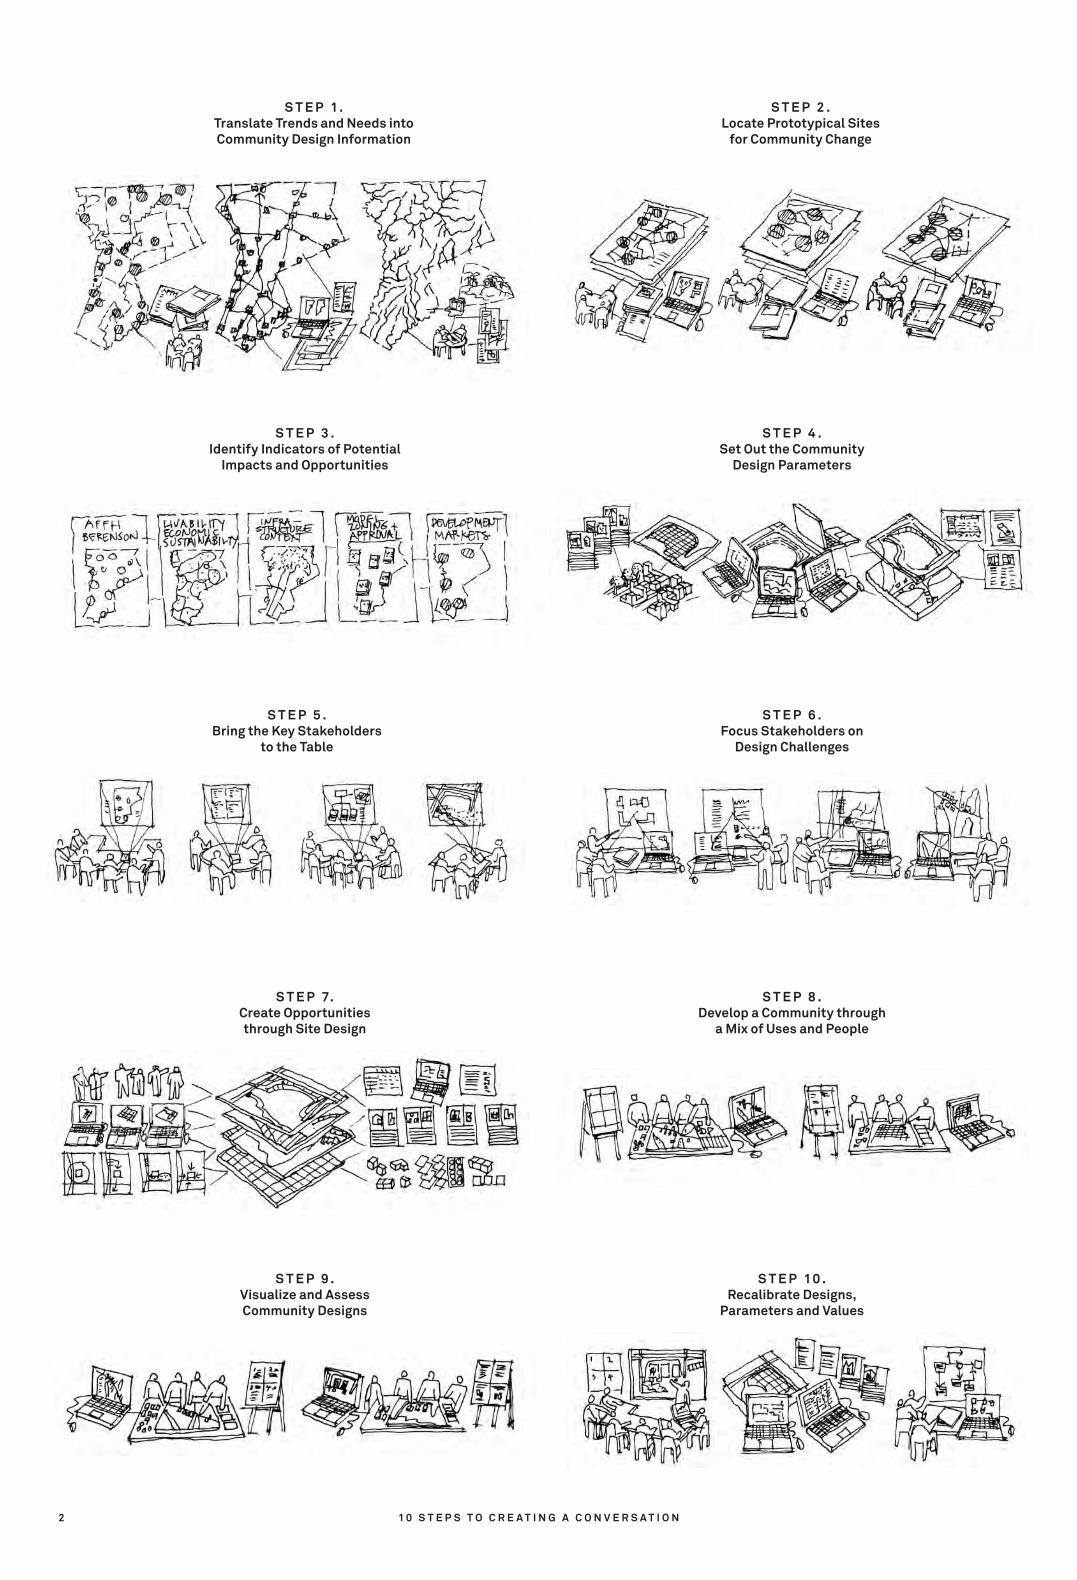
S T E P 1. Translate Trends and Needs into Community Design Information
S T E P 2 . Locate Prototypical Sites
for Community Change
S T E P 3 . Identify Indicators of Potential
Impacts and Opportunities
S T E P 4 . Set Out the Community
Design Parameters
S T E P 5 . Bring the Key Stakeholders
to the Table
S T E P 6 . Focus Stakeholders on
Design Challenges
S T E P 7. Create Opportunities through Site Design
S T E P 8 . Develop a Community through
a Mix of Uses and People
S T E P 9 . Visualize and Assess Community Designs
S T E P 1 0 . Recalibrate Designs,
Parameters and Values

3
This workbook “broadsheet” presents ten steps that developed from the work prepared for three Community Design Institutes facilitated by William Morrish, Professor at Parsons New School of Design, and Adam Lubinsky, Principal of WXY Architecture + Urban Design, with Tygron Gaming Software, held in March and May 2014. Attended by municipal leaders, planners, developers, advocates and land and design professionals, these insti-tutes were supported by, among others, Homes for Westchester and the Land Use Law Center at Pace Law School. This document distills a process that municipal leaders may want to undertake in order to realize a vision for their village or town. The Community Design Institutes involved months of preliminary planning research, com-puter-based modeling and traditional workshop techniques to allow participants to test devel-opment scenarios on two case study sites in Tarrytown and Pound Ridge. This process estab-lished a new paradigm for workshops by mediat-ing the concerns and perspectives of the many stakeholders identified above through design and data in a modeling exercise and by providing live feedback on the development scenario impacts. We utilized a 3-D interactive modeling software adapted to urban planning issues—the Tygron Engine—to shape scenarios based on the values of different stakeholders. By allowing multiple stakeholders to develop scenarios, collaborate and negotiate, the tool streamlines the planning process and can sharply reduce the costs for development projects while helping to ensure that multiple stakeholders are satisfied. This process allows stakeholders to explore a variety of issues, such as urban design approaches, planning policies, infrastructure needs and finan-cial viability. Through this modeling process, the Community Design Institutes and this workbook aim to:
• Highlight the potential of good site design to make a community more livable.
• Clarify and integrate the impacts and benefits of new development that includes affordable homes.
• Address multiple stakeholder interests and show potential trade-offs in order to benefit a wide range of stakeholders.
• Identify clear next steps that can expedite the development process en route to achieving strong, affordable communities.
There are a number of instances in which this pro-cess could be used, including these three:
• A site owned by the municipality that they would like developed as part of the community vision.
• A site to be sold or recently purchased by a developer that may require re-thinking in terms of future uses and zoning.
• A site that is considered to be underutilized, where planning work will help frame a com-munity vision for the site and will help land-owners, potential developers and the general community see the potential opportunities in redevelopment.
The intention of this workbook is to allow readers to understand the ten steps undertaken before and at the Institutes, and to consider how this new process might be put to work in their municipality in order to meet their community’s needs.
P A R T A : C R E AT I N G A M O D E L
Steps 1 – 5 all occurred before the Institutes, requiring data- and map-based research into primary and secondary sources: a review of documents such as local comprehensive plans; preliminary interviews with a range of stakehold-ers, officials and professionals; identification of
prototype sites; preparation of workshop materials; and outreach to Institute attendees. The result of this research is a computer-based model that will be the basis for a community workshop that sythesizes multiple data points and physical design parameters.
P A R T B : B U I L D I N G T O G E T H E R
Steps 6 – 10 all were elements of the Institute ses-sions. These day-long events included the following activities:
• An introductory presentation of local trends, policies, site parameters and description of workshop activities.
• A physical modeling activity in which partici-pants are able to create a site development by placing “building blocks” and markers on a plan that show the kinds of buildings; the mix of uses and types of homes; site access; ame-nities including parks, grocery stores, public transportation, community centers, theaters and services; landscaping; and levels of afford-ability in the homes.
• A computer model that both mirrors the par-ticipants’ designs and calculates a range of impacts, such as parking, traffic generated, a developer’s rate of return, property taxes, number of students and school costs.
• A presentation of the participants’ designs and revisions to those designs based on the feedback from the computer model.
Throughout this document, each of those steps is explained, with examples provided from the Institute activities and the preparation/informa-tion-gathering that is required, including what data sources should be reviewed and who should be interviewed. An overview of the ten steps follows:
P A R T A : C R E AT I N G A M O D E L
S T E P 1. Translate Trends and Needs into Community Design Information
Each town and village grows and changes in unique ways and develops particular needs. In preparation for the collaborative work of the process, research must be conducted into changing demographic, land use, infrastructure requirements and travel patterns.
S T E P 2 . Locate Prototypical Sites
for Community ChangeThe community trends and needs will provide a strong indication of how land uses are changing, and as a result, where new development can meet these needs. Finding opportunities to accommo-date growth and change within an existing subur-ban landscape is more challenging and complicated than it may appear at first glance.
S T E P 3 . Identify Indicators of Potential
Impacts and Opportunities The potential development of prototypical sites will bring a range of potential impacts. A plan-ning indicator is a signal of problems as well as opportunities. Indicators, such as schoolchildren or parking, should be measured in both quantitative and qualitative terms.
S T E P 4 . Set Out the Community
Design Parameters At Step 4, we outline development constraints tied to physical features such as wetlands and steep slopes and policies such as zoning, height restric-tions and setbacks. In addition, design parameters
are prepared for the workshop through establishing the range of potential uses within the site (that may test what is permitted under current zoning), the different potential building types (such as apart-ment buildings or townhouses), the kinds of tenure ( i.e., whether a home is owned or rented) and levels of affordability that could be associated with these buildings.
S T E P 5 .Bring the Key Stakeholders
to the Table Every person views a new building development through their own set of concerns and values, and together they offer a wealth of experience and constructive energy. Therefore, building a model requires a mix of the key stakeholders who are able to articulate a broad array of concerns and are open to creative ideas from civic leaders, municipal officials, developers, affordable housing advocates and neighbors living adjacent to the development site.
P A R T B : B U I L D I N G T O G E T H E R
S T E P 6 . Focus Stakeholders on
Design ChallengesThe design process begins concretely by address-ing a particular site and project. The participating stakeholders will identify the planning indicators that represent their concerns, and they will begin to articulate how these concerns can be addressed within the site area.
S T E P 7. Create Opportunities through Site Design
Testing different site designs is a critical part of understanding how a new development may benefit or negatively impact a surrounding area. Building heights, street setbacks, open space and site access are elements of a livable community, and this step provides an opportunity to reflect on the current zoning and how it advances its stated purpose and the effort to build affordable homes.
S T E P 8 . Develop a Community through
a Mix of Uses and PeopleDefining a development’s “uses” (e.g., homes, shops, offices) and the types of homes further clarifies the nature of the community, the mix of activities that occurs there, the kinds of people who will live there (e.g., seniors, young couples, children) and the diversity of people in terms of race and income level. Establishing this approach requires some reconsideration of the site layout.
S T E P 9 . Visualize and Assess Community Designs
With the site layout, mix of uses, types of homes and levels of affordability established, the partici-pants are able to reflect on how well the community design meets the expressed community needs and values. They are able to understand for example, in quantitative terms, if the design meets a devel-oper’s need for financial viability, and in qualitative terms, whether the design is appealing to the site’s neighbors.
S T E P 1 0 . Recalibrate Designs,
Parameters and ValuesWith all the feedback received from the assess-ment step, the participants will reevaluate their designs and make adjustments.
E X E C U T I V E S U M M A R Y
E X E C U T I V E S U M M A R Y
4 1 0 S T E P S T O C R E A T I N G A C O N V E R S A T I O N
Legend
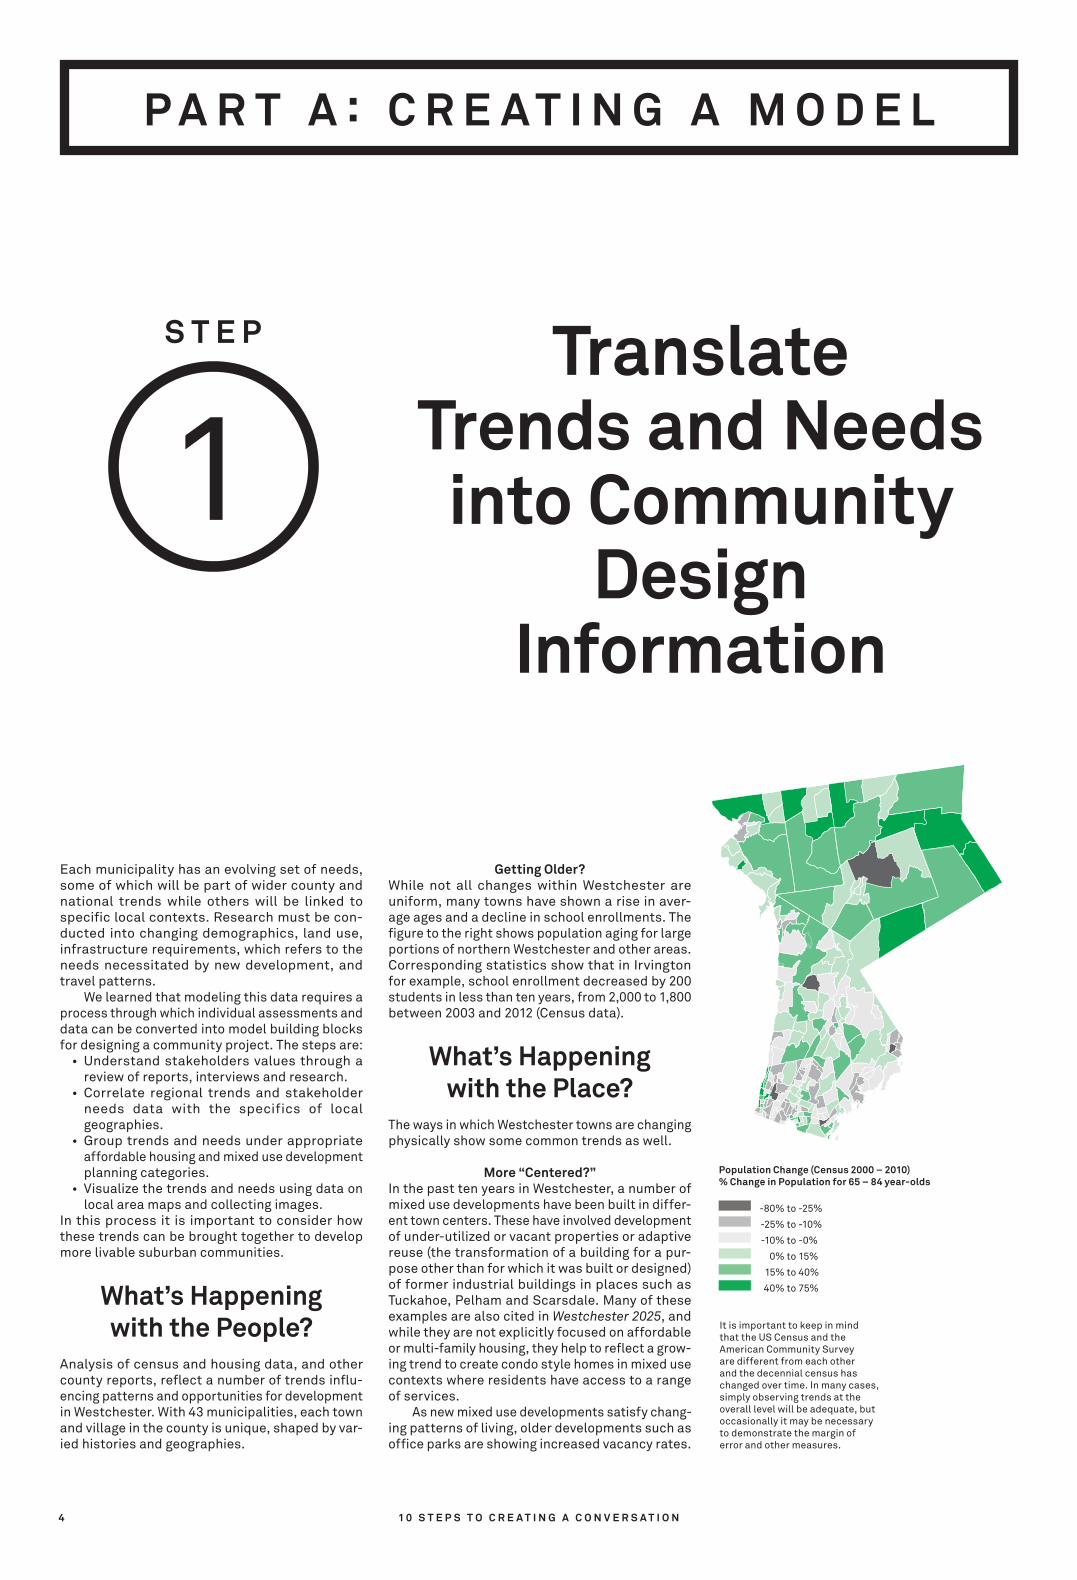
Population Change (2000 – 2010)% Change Populatioin (65-84)
-80% – -25%
-25% – -10%
-10% – -0%
0% - 15%
15% - 40%
40% - 75%
Each municipality has an evolving set of needs, some of which will be part of wider county and national trends while others will be linked to specifi c local contexts. Research must be con-ducted into changing demographics, land use, infrastructure requirements, which refers to the needs necessitated by new development, and travel patterns. We learned that modeling this data requires a process through which individual assessments and data can be converted into model building blocks for designing a community project. The steps are:
• Understand stakeholders values through a review of reports, interviews and research.
• Correlate regional trends and stakeholder needs data with the specifics of local geographies.
• Group trends and needs under appropriate affordable housing and mixed use development planning categories.
• Visualize the trends and needs using data on local area maps and collecting images.
In this process it is important to consider how these trends can be brought together to develop more livable suburban communities.
What’s Happeningwith the People?
Analysis of census and housing data, and other county reports, refl ect a number of trends infl u-encing patterns and opportunities for development in Westchester. With 43 municipalities, each town and village in the county is unique, shaped by var-ied histories and geographies.
It is important to keep in mind that the US Census and the American Community Survey are different from each other and the decennial census has changed over time. In many cases, simply observing trends at the overall level will be adequate, but occasionally it may be necessary to demonstrate the margin of error and other measures.
P A R T A : C R E A T I N G A M O D E L
Population Change (Census 2000 – 2010)% Change in Population for 65 – 84 year-olds
Getting Older?While not all changes within Westchester are uniform, many towns have shown a rise in aver-age ages and a decline in school enrollments. The fi gure to the right shows population aging for large portions of northern Westchester and other areas. Corresponding statistics show that in Irvington for example, school enrollment decreased by 200 students in less than ten years, from 2,000 to 1,800 between 2003 and 2012 (Census data).
What’s Happeningwith the Place?
The ways in which Westchester towns are changing physically show some common trends as well.
More “Centered?”In the past ten years in Westchester, a number of mixed use developments have been built in differ-ent town centers. These have involved development of under-utilized or vacant properties or adaptive reuse (the transformation of a building for a pur-pose other than for which it was built or designed) of former industrial buildings in places such as Tuckahoe, Pelham and Scarsdale. Many of these examples are also cited in Westchester 2025, and while they are not explicitly focused on affordable or multi-family housing, they help to refl ect a grow-ing trend to create condo style homes in mixed use contexts where residents have access to a range of services. As new mixed use developments satisfy chang-ing patterns of living, older developments such as offi ce parks are showing increased vacancy rates.
Translate Trends and Needs
into Community Design
Information
1
-80% to -25%
-25% to -10%
-10% to -0%
0% to 15%
15% to 40%
40% to 75%
S T E P

Here’s What You Can Do:
P E O P L E
Research Questions
� What are the overall trends in terms of demographics and land use for Westchester County?
� How are commuting patterns shifting?
� Is the school-aged child population growing or shrinking?
� Are there any towns that stand out as deviating from the trends?
� How are general trends affecting individual towns?
� How do specific census tracts reflect or differ from town-wide trends?
� How will those patterns affect the demand for current and future development?
� What do the demographic, land use and infrastructure projections show specifically?
Research Actions
� Research demographic trends of the municipality and surrounding towns, based on 2000 and 2010 Census.
� Research commuting patterns and trends, based on 2000 and 2010 Census.
� Research commercial and residential real estate markets and employment growth areas.
� Research school enrollment data and projections.
P L A C E
Research Questions
� What are current zoning regulations and land use patterns?
� Specifically, what are the parking requirements for multi-family housing?
� What are the barriers to potential multi-family housing development?
� Identify predominant development patterns—arrangement of the street, the density of homes and the different kinds of uses provided. Are there limited-access communities, pedestrian-friendly downtowns, office parks or large-lot properties. What is the nature of the community’s density?
� Collect general building typologies—single-family housing, apartment buildings, multi-story commercial developments.
Research Actions
� Analyze land use patterns.
� Research recent regional and comprehensive planning documents.
� Map and analyze data.
I N F R A S T R U C T U R E
Research Questions
� What are the road network characteris-tics—local roads, highway access?
� What municipal boundaries apply to various areas of town—school, sewer, refuse, fire, etc.?
� What are the physical limitations challenging economic growth in Westchester towns?
Research Actions
� Research recent/current infrastructure projects.
� Download and analyze mapping/GIS data for Westchester County and individual towns.
Here’s Who to Speak with:
• Town supervisors• Real estate and legal experts• Affordable housing experts• Developers• Architects• Economic analysts• Town planners• Community advocates
Here Are the Sources We Used:
DemographicsU.S. Census Bureau—Decennial Census & American
Community Survey (American FactFinder), http://factfinder2.census.gov/faces/nav/jsf/pages/index.xhtml
Westchester County Census Data, http://planning.westchestergov.com/census-statistics
Westchester County GIS Data, http://giswww.west-chestergov.com/Default.htm
School-aged Children ProjectionsBurchell et. al., “Residential Demographic Multipliers—
Estimates of the Occupants of New Housing” Rutgers University, 2006*, http://www.dataplace.org/static/pdfs/NEW%20YORK%20multipliers.pdf
*Note: Actual numbers of School-Aged-Children may be higher than estimates
*CEQR Technical Manual: residential development Citywide generates average .17 public school aged children, http://www.nyc.gov/html/oec/downloads/ pdf/2014_ceqr_tm/06_Community_Facilities_2014.pdf
Affordable Rents & Sales (HUD Guidelines)Westchester County AMI Sales & Rent Information, http://
homes.westchestergov.com/images/stories/pdfs/incomesalesrentlimits.pdf
Commuting DataU.S. Census Bureau—Decennial Census & American
Community Survey (American FactFinder), http://factfinder2.census.gov/faces/nav/jsf/pages/index.xhtml
Census Transportation Planning Products, http://ctpp.transportation.org/Pages/default.aspx
http://data5.ctpp.transportation.org/ctpp/Browse/browsetables.aspx
ReportsLand Use in Westchester: A Detailed Look at Existing
Conditions and Development Trends, Westchester 2025/plan together, Westchester County Department of Planning
The Blueprint for Westchester County: A Time for Action, The Westchester County Association, 2011
Westchester County Affordable Housing Needs Assessment: Final Report, Bloustein School of Planning & Public Policy, Rutgers University, 2004
Long Island’s Rental Housing Crisis, Regional Plan Association, September, 2013, http://library.rpa.org/pdf/RPA-Long-Islands-Rental-Housing-Crisis.pdf
Sternman, Matthew Shiers. “Integrating the Suburbs: Harnessing the Benefits of Mixed-Income Housing in Westchester County and Other Low-Poverty Areas.” Colum. JL & Soc. Probs. 44 (2010): 1, http://www.columbia.edu/cu/jlsp/pdf/Fall%202010/Sternman.JLSP.44.1.pdf
News Articles“In Westchester County, the Platinum Mile Is
Reinvented, Again”, New York Times, 1/3/12, http://www.nytimes.com/2012/01/04/realestate/com-mercial/westchester-countys-platinum-mile-is-reinvented-again.html?_r=0
“Adaptive Reuse Could Renew the Platinum Mile”, 12/21/11, http://www.prlog.org/11755338-adaptive-reuse-could-renew-the-platinum-mile-attorney-frank-mccullough-points-to-special-use-permit.html
“Suburbs Try to Prevent an Exodus as Young Adults Move to Cities and Stay”, New York Times, 4/16/14, http://www.nytimes.com/2014/04/17/nyregion/suburbs-try-to-hold-onto-young-adults-as-exodus-to-cities-appears-to-grow.html?hpw&rref=nyregion
5
Reports show that there is six million square feet of vacant office space across the county, much of which is in “greyfield” office park sites along highway corridors. Greyfields refer to buildings surrounded by large parking lots that are under-used. This trend follows national averages, where national suburban office park construction totaled 160 million SF in 1988 – 1989 and only 12 million SF in 2011 – 2012.
What Infrastructure Is Holding the
People and Places Together?
The demographic and land use patterns are reinforced by data on new behaviors that show people in Westchester are using public transit more, driving to work less and working from home more frequently. These trends emphasize a need to consider issues such as bus lines, zoning requirements for parking and inclusion of small workspaces within residential development. Other kinds of infrastructure face demands as well such as sewer systems, garbage col-lection, roads, public transportation, schools, etc. Many of the towns and villages in northern Westchester—from Bedford Hills to Pound Ridge to North Salem—were agricultural towns that became weekend destinations for New Yorkers in the mid 20th century. With small populations and dispersed residential patterns, sewage was eas-ily managed with septic systems. When weekend retreats began to be converted into year-round residences and the demands on town centers began to grow, the reliance on individual septic systems became harder to manage.
Challenges in Meeting the
Need for Change: An Initial Summary
Based on interviews and a review of documents, the following needs were identified:
Need to Address Affordability / Diversity in Westchester
• Adult children of current residents cannot afford to live in the area.
• Elderly people cannot downsize into affordable units and remain within their communities.
• People who work in and service the county cannot afford to live nearby.
• Build community ability through population growth and economic growth.
Desire to Leverage Development to Address Multiple Community Needs
• Infrastructure deficits such as sewerage can be addressed through new development.
• Many small hamlets lack volunteer firemen to fill positions.
• Some schools are under-enrolled and can become more stable with additional students.
Need to Improve and Expedite the Development Process
• New development is frustrated in many places by uneven approval processes. The benefits that can be leveraged by development are less likely to materialize due to the costs of an extended approvals process.
Note: Reports cited here can be found in the “Reports” section on this page.
S T E P 1 . Translate Trends and Needs into Community Design Information
6 1 0 S T E P S T O C R E A T I N G A C O N V E R S A T I O N
The community trends and needs will provide a strong indication of how land uses are changing, and as a result, where new development can meet these needs. Finding opportunities to accommo-date change within an existing suburban land-scape is more challenging and complicated than it appears at first glance. Locating a productive site can begin with a review of land use maps, parcel patterns and real estate listings, but it also requires a deeper investigation into a site’s particular circumstances, configuration and structure. The solution process must address how a future set of uses will enrich its surroundings, support local service, fit its geography and enhance natural systems. All of these uses would be viewed through the lens of the stakeholders’ needs. We are calling these sites that are critical to a town’s evolving vision “prototypical sites” since change has the potential to develop more than one site, and locating prototypical sites suggests that there are similar places throughout the municipal-ity that could benefit from change. An analysis of prototypical sites begins with the following three considerations:
Contextual SituationContext is a familiar term used in community plan-ning to refer to the geographic pattern and built environment of the neighborhood surrounding a particular site. We have added the term “situa-tion” to the word context to highlight the fact that
the context is dynamic in terms of time and use. Children grow up and move out, even as their child-hood homes remain behind, often with only aging parents occupying the household.
Spatial ConfigurationIn the suburbs, land parcels vary greatly in shape and land contour. This variation impacts and complicates the potential development capacity of each site. Prototypical suburban sites are multi-dimensional locations, incorporating the site’s square footage, width and changes in topography.
Stakeholder StructurePeople can’t be left out of the prototypical site’s development. A site’s actualization into a com-munity vision will be driven by the stakeholders’ effort to learn and negotiate in the open together with other stakeholders.
Prototypical Sites for Westchester?
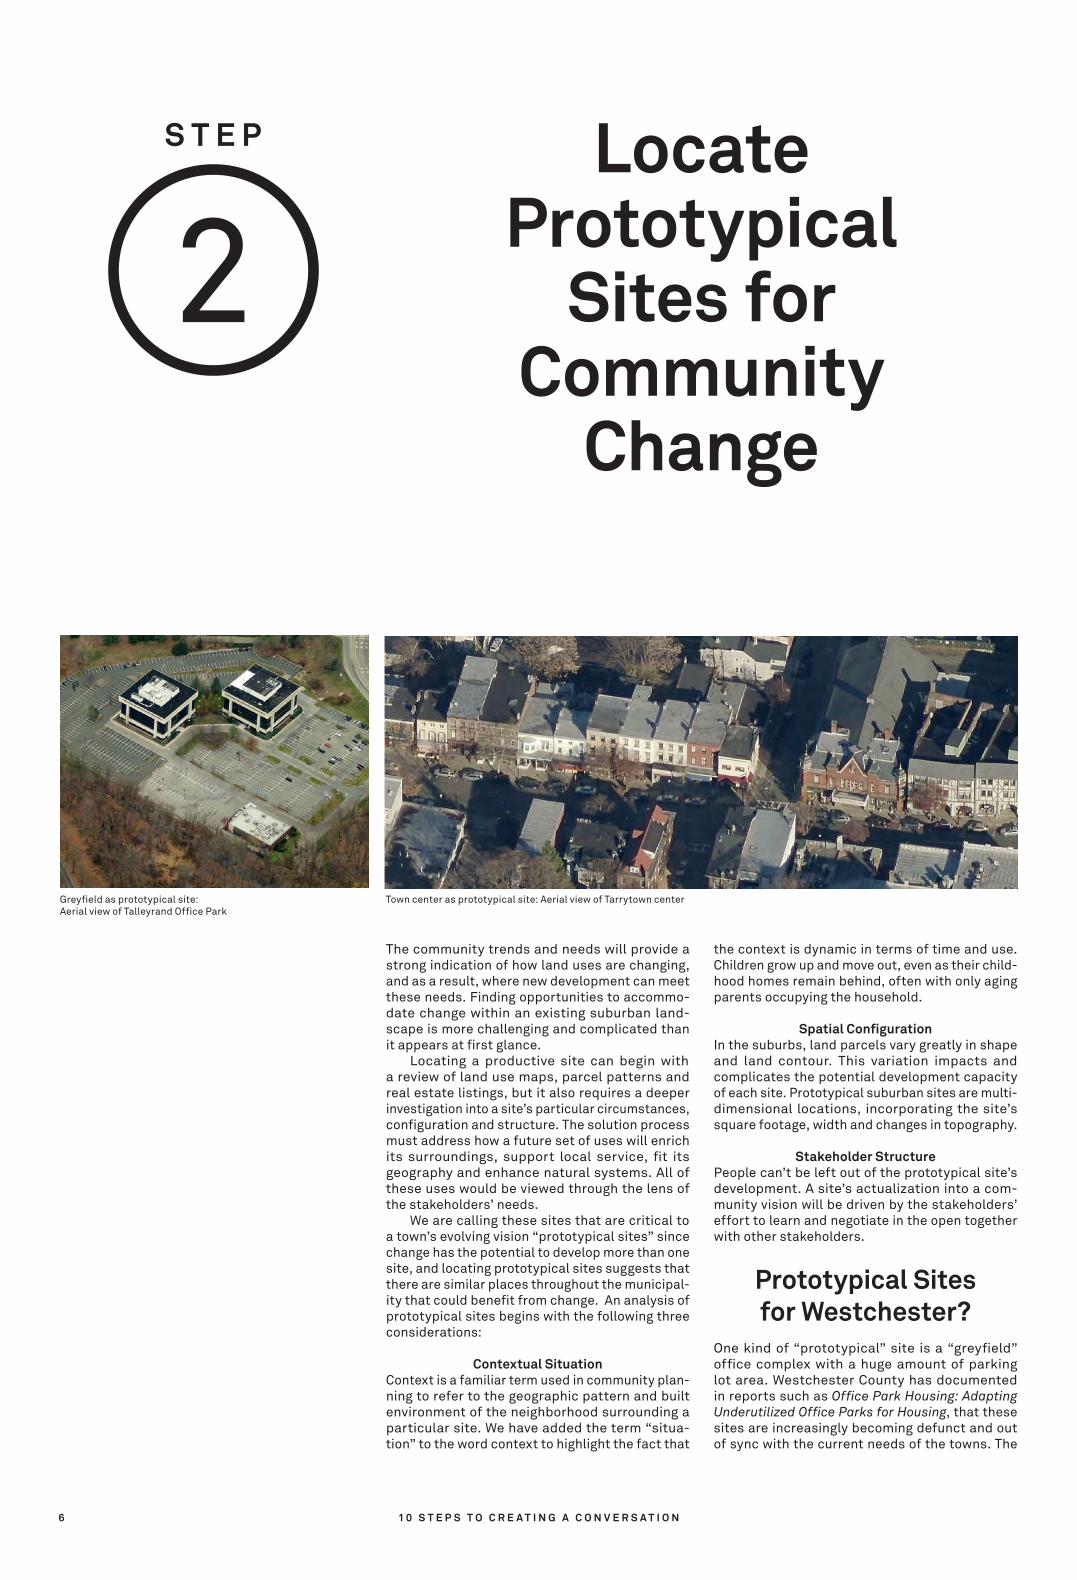
One kind of “prototypical” site is a “greyfield” office complex with a huge amount of parking lot area. Westchester County has documented in reports such as Office Park Housing: Adapting Underutilized Office Parks for Housing, that these sites are increasingly becoming defunct and out of sync with the current needs of the towns. The
Locate Prototypical
Sites for Community
Change
Greyfield as prototypical site: Aerial view of Talleyrand Office Park
Town center as prototypical site: Aerial view of Tarrytown center
2S T E P

7
Here’s What You Can Do:
P L A C E
Research Questions
� Where are the sites that offer opportunities for benefi cial development within the town?
� Is there a pattern or series of patterns of site “types”?
� Do these “types” occur frequently enough to allow meaningful impact towards the goal of building more affordable housing?
� How do different development patterns affect site opportunities and constraints?
� How can different development patterns be modifi ed?
� Where is zoning already in place to facilitate possible solutions (i.e., mixed use)?
� Where are successful examples of new developments that could be case studies: local/national?
� Do these prototypical sites have potential impacts for adjacent communities (or school districts) and if so, how should they be involved?
Research Actions
� Examine the different needs of towns depending on whether they are urban or rural.
� Identify types of prototypical sites:
• Greyfi elds
• Town Centers
• Others
� Find examples of mixed use zoning across the county.
� Identify the sites where both conditions were in place: mixed use zoning and large, underutilized site.
� Determine opportunities for pedestrian-friendly, reconnected communities.
I N F R A S T R U C T U R E
Research Questions
� How long does it take people to reach services: shopping, transportation, schools?
� Can unique site challenges be solved through development?
� Can county trends be addressed through development?
� Can funding be found to support/supplement private investment?
Research Actions
� Analyze proximity/access to public transportation.
� Analyze proximity/access to shopping.
� Clarify difference between local shopping and regional shopping.
� Research state and federal grant opportunities.
� Consider development options that incorporate infrastructure upgrades for individual towns.
Here’s Whoto Speak with:
• Town, supervisors and mayors• Real estate and legal experts• Affordable housing experts• Developers• Architects• Economic analysts• Town planners• Community advocates
offi ce parks, predominantly constructed between the 1960s and 1980s, were built in a car-dependent period of time following the expansion of the high-way system. These offi ce park buildings and the road corridors feeding them dramatically reshaped the towns they landed in. Most of the sites were developed to serve single use occupants and users. Current trends point towards mixed use programs that call for diverse development portfolios and transit oriented development, allowing employees to walk or take transit. The redevelopment of these greyfi elds for housing and other uses and amenities can help to enhance the livability of their surrounding areas, and bring the towns closer to the neighborhood-oriented, pedestrian-friendly communities they historically were and that are increasingly desired today. Developing multiple sites along the same corridor, with the right design, could activate the streetscape (which refers to the elements that con-tribute the character of a street such as the road and sidewalks, the adjoining buildings, benches and streetlights, paving materials and trees), cre-ating a more attractive walking environment and providing opportunity for small business, and could enhance access to open spaces and parks. The second prototypical site identifi ed for examination is a town center site and is, in many ways, the complement to the greyfi eld site. As the conversion of the greyfi eld site can help rein-vigorate the structure of each town, additional
development in a town center can help pump new life into a town’s heart. Many town centers were developed more than a century ago, before cars were used on a regular basis. The town and village centers across the county each have their own character, but are similar in their pedestrian-friendly footprints and small scales. There is a need in many town or village centers for additional infrastructure and amenities—whether it be a need for sewage infrastructure, volunteer fi remen, or a bookstore café and the foot traffi c to sustain the shops. The right kind of development can leverage resources to put infrastructure and amenities into place.Useful models within Westchester include, for example, towns like Tarrytown which have used their downtown as a point of attraction—saving their 130-year-old theatre and inspiring small business entrepreneurs to open shop. While they developed as a place to live and work, over time they then became places to solely work, as homes moved farther from the center. With their pedestrian-friendly urban fabrics and historic charm, town centers provide a range of opportunities for new homes and stores. One-story buildings, large parking lots or vacant lots often sit on or adjacent to main streets and can be used to create mixed use buildings. New homes in these locations bring added benefi ts, such as the ability to leverage funding for infrastructure needs or to generate more foot traffi c for existing or new businesses.
Here Are the Sources
We Used:Reports
Context for County & Municipal Planning in Westchester County and Policies to Guide County Planning, Adopted by Westchester County Planning Board 5/6/2008, Amended 1/5/2010
Municipal Zoning Abstracts, Westchester, 2 0 13 , h t t p : // h a s t i n g s g o v. o r g / P a g e s /HastingsNY_Documents/01B78631-000F8513
Density & Community Design APA Making Great Communities Happen: DensityAPA Planners Advisory Service, Quicknotes on Density,
http://www.planning.org/pas/quicknotes/pdf/QN12.pdf
Building Affordability into Sustainable Communities, Center for Housing Policy, 2011: http://www.smart-growthamerica.org/documents/lubell_building-affordability-into-sustainable-communities.pdf
Building Healthy Communities, Density and Design, http://lahd.lacity.org/lahdinternet/Portals/0/Policy/curriculum/gettingfacts/design/index.html
Lincoln Institute of Land Policy—Visualizing Density: Investigating the Density Challenge Facing the United States, http://www.lincolninst.edu/subcenters/visualizing-density/
SFMTC, “Reforming Parking Policies to Support Smart Growth,” Handbook for Strategies, Best Practices in the San Francisco Bay Area, June 2007, http://www.mtc.ca.gov/planning/smart_growth/parking/parking_seminar/Toolbox-Handbook.pdf*
*This report is focused on parking policies, but it also provides a strong framework for basic site analysis, see page 4
Greyfi eldsOffi ce Park Housing: Adapting Underutilized Offi ce
Parks for Housing, Westchester County Department of Planning, Prepared by RH Consulting, March 2008, reissued September 2010
CNU & PWC, Greyfi elds into Goldfi elds: From Failing Shopping Centers to Great Neighborhoods, February 2001, http://www.cnu.org/sites/fi les/Greyfi eld_Goldfi elds_vol2.pdf
Route 119
Benedict Ave.
Aqu
aduc
t Tra
il
Bro
adw
ay
S T E P 2 . Locate Prototypical Sites for Community Change
The adjacent diagram shows the cul-de-sac developments along Route 119 and, to the north, the historical street grid of Tarrytown’s center.
8 1 0 S T E P S T O C R E A T I N G A C O N V E R S A T I O N
The development of a prototypical site will bring a range of potential impacts. A “planning indicator” is both a signal of problems as well as planning opportunities; it should be evaluated in both quan-titative and qualitative terms. This step in the pro-cess is focused on identifying the areas of impact, gathering data and information to measure the impacts, and starting to consider how those areas of impacts should be addressed to best respond to emerging trends. Each area of impact has an “indicator” that measures the impact. This step involves research into financial indicators such as construction costs, current market rents and sale prices for homes. This research on indicators is fed into the Tyron computer model. It is important to note that different stakehold-ers will interpret the impact differently. Below are examples of indicators:
School-aged childrenOne indicator that many stakeholders focus on is the number of potential school-age children that may live in a new development. The presence of children is interpreted as a positive or nega-tive impact, depending on the perspective of the stakeholder. While many people are eager to see family-oriented homes being created because they often create long-term stability for a neighborhood, many others view children as a concern in terms of the potential impacts on local school capacity and
property taxes. As a result, we created an indica-tor that would measure the estimated property taxes of the new development in relationship to the estimated cost of the new schoolchildren. The indicator that we used to generate the number of school children came from a 2006 study conducted by Rutgers University that considered the number of schoolchildren that may live in different types of homes, depending on number of bedrooms and market value. In addition, our team did a sensitivity analysis by looking at an adjacent development built in Tarrytown within the last 15 years to see (based on 2010 Census data) if the Rutgers’ estimates were similar to what was actually happening in the local context. We were also careful to look at the school capacity trends for the local school district. It is important to note that there are several Westchester districts that have declining enrollments where new students are important to the sustainability of the schools.
TaxesTo understand the impact school-age children from a new development would have on the local school system, one needs to also understand how much tax revenue the new units will generate for the town and school district as well as the cost per pupil at the local school. All of these numbers—the amount assessed per unit, the cost per student, and the percentage of cost per student covered
Identify Indicators of
Potential Impacts and
Opportunities
by local taxes (as opposed to state funding)—are particular to the individual municipalities and school districts. It is also important to note that new students do not truly generate the full cost-per-student (the marginal cost is about 70%) since so many basic school costs are fixed costs that don’t increase with new students. Sharing this information on the school-related indicators at the outset of the workshops dispels a number of myths, such as that developments that include some affordable multi-family housing always results in additional costs to the school district and taxpayers.
ParkingParking is another indicator that signifies an area of opportunity and concern for different stakehold-ers. On the one hand, many developers are bound by zoning requirements created decades ago to provide high levels of parking. This requirement is expensive and is a cost that developers typically cannot recoup in a suburban context. On other hand, surrounding residents are often concerned that an under-provision of parking will mean resi-dents of the new development parking on surround-ing streets. The number of spaces generated by a scenario is frequently a critical debate point and is increasingly an area targeted by municipalities for further study or for a zoning change.
3S T E P

9
Sample IndicatorsStudents
Local Student Costs:• Bedford CSD spending per pupil: $27,741
Source: Westchester-Putnam School Boards Association Facts & Figures 2013.
• Bedford CSD revenue from local sources: 84.8%. Source: Westchester County School District Revenue and Spending 2009.
• Marginal student cost percentage: 70%. Source: Richard Hyman’s memo Public School Student Generation, dated May 6, 2004.
• $27,741 * 84.8% * 70% = $16,467.06 $16,467.06 is the “real cost” of spending per pupil calculated from the Bedford CDS spending per pupil and adjusted to % of student cost covered by the school
district taxes (84.8%) and the marginal cost (70%). Marginal cost accounts for the fact that additionally students will not necessary require additional costs for teachers, infra-structure and facilities.
Here’s What You Can Do:
I N D I C AT O R S
Research Questions
� What are the general categories of indicators?
� Who should be consulted to get an understanding of critical issues?
� Which constituencies should we consider: residents, business owners, employers, workers, shoppers, visitors?
� What factors are town residents most sensitive about?
� How will development patterns (for example, density and proximity to town centers) be reflected in our indicators?
� How can we incorporate sustainability indicators and/or green infrastructure (land conserved, energy use avoided, transition to cleaner fuels, stormwater runoff management)?
� Where can we get the information that will show the impact on each indicator (publicly available/proprietary)?
� How can we structure the information to help us understand the impacts of each indicator?
� How can the indicators be incorporated into the software that will be a central part of the exercise?
• What is the base unit (size/shape)?
• How detailed can/should we get to give us actionable feedback?
• Can we use the visual and numerical feedback in all scenarios or will our site typologies limit us?
Property Taxes & BreakdownMarket value comparables for new construction:
• 2 Unit Apartment Building: 144 Babitt Rd, Bedford Hills, NY assessment in 2014 market value of $397,500 for 1,800 SF
• 1-Story Retail: 73 Westchester Ave., Pound Ridge, NY assessment in 2014 market value of $1,300,000 for 5,500 SF
• Retail with Apartment Above: 77 Westchester Ave., Pound Ridge, NY assessment in 2014 market value of $650,000 for 4,864 SF
Source: 2013 Pound Ridge Assessment Role & Real Estate Listings
Traffic (new AM peak trips)
• .75 single-family home• .44 condo unit• .41 apartment unit• .29 retirement Unit• 6.41 per 1,000 SF retail• .45 per employee office park• .75 3BRs were assumed equivalent to
single-family• .56 2BRs were assumed to be midway
between 1BRs and 3BRs
AM peak trip generation from ITE, via Community Guide to Development Impact Analysis, http://www.lic.wisc.edu/shaping-dane/facilitation/all_resources/impacts/analysis_traffic.htm Affordable units assumed to have 95% of trips of market, via Nelson/Nygaard New Haven Mixed Use Trip Generation Model
Parking Required by Current ZoningPound Ridge, NY Town Code
Research Actions
� Determine different sets of indicators based on which prototype site you are addressing.
� Delineate difference between physical/numerical indicators and financial indicators (i.e., number of students vs. cost of students):
• Number of students relates to school capacity as well as implications on budgets.
• Cost of students indicates fiscal impact/budget implications.
� Determine key indicators that could impact the success of a project.
� Create a spreadsheet to collect and track all the possible issues affecting the project:
• Eventually, this will be a tool for calculating the impact of various design scenarios.
� Explore precedents for possible zoning changes (i.e., reduced parking requirements in other Westchester towns).
• The software can handle multiple scenarios so you can show the impact on existing zon-ing and what could happen if the zoning changed.
� Start to create a “pro forma” to calculate financial return (this will need to be fleshed out further in the next step).
� Research opportunities for green infrastructure:
• This could be a source of funding.
Indicators such as building heights, lot coverage, building coverage and setbacks (the distance a building can be sited from the edge of its lot as mandated by the municipal zoning code) all have implications for a development’s urban design and relate to existing zoning.
Here Are the Sources We Used:
Real EstateSecond Quarter Residential Real Estate Sales Report:
Westchester and Putnam Counties, New York (Hudson gateway Multiple Listing Service, Inc.), 2012
Westchester County AMI Sales & Rent Information, http://homes.westchestergov.com/images/stories/pdfs/incomesalesrentlimits.pdf
Comparables: Researched a number of real estate listing and news sites for both residential and com-mercial properties,
http://www.zillow.com/http://www.trulia.com/http://www.loopnet.com/http://westfaironline.com/choose-county/westchester/
School Enrollment Rutgers University’s “Residential Demographic
Multipliers—Estimates of the Occupants of New Housing”, 2006
BFJ Mamaroneck EIS, 2012Westchester-Putnam School Boards Association Facts
& Figures, 2013Westchester County School District Revenue and
Spending, 2009 (Richard Hyman’s memo “Public School Student Generation”, dated May 6, 2004)
Traffic and ParkingTraffic Generation Estimates, http://www.lic.wisc.
edu/shapingdane/facilitation/all_resources/impacts/analysis_traffic.htm (Based on Institute of Transportation Engineers)
Trip Reduction Data, Nelson/Nygaard Mixed Use Trip Generation Model, http://www.scrcog.org/docu-ments/2011_New_Haven_Modal_Split_Study.pdf
Parking Management, EPA Report—Parking Spaces/Community Places, http://www.epa.gov/smart-growth/pdf/EPAParkingSpaces06.pdf*
*Reduced minimums—1 space per unit w/.25 spaces per additional bedroom
Assessed Value/Property taxesCounty Overall Full Value Tax Rates—NY State
Department of Taxation and Finance, http://www.tax.ny.gov/research/property/reports/fvtaxrates/overall_county_12.htm
County Average Residential Tax Bills—NY State Office of Real Property Tax Service, http://orpts.tax.ny.gov/cfapps/MuniPro/osc/oscAvrtaxlevy.cfm?fiscalyr_ending=2012
Septic Capacity in Gallons/Day (GPD)Funding Sources from Various Federal and State
Agencies
Pound Ridge $ per thousand
School 80.42
County 21.31
Town 13.39
Fire District 2.03
Library District 1.41
Public Parking District 17.84
Total 136.40
Assessed value equalization rate: 18.3%2013 tax rates as follows: Via Edye McCarthy—Greenburgh Town Assessor
Unit Type Multi-family Near Transit (BFJ. 2013)
Low Income Multi-family (Rent) (BFJ, 2013)
Low Income Multi-family (Own) (BFJ, 2013)
Mixed Income Housing (Rent) (BFJ, 2012)
Studio N/A N/A N/A N/A
1 BR 0.05 0.14 0.06 0.07
2 BRs 0.12 0.62 0.18 0.16
3 BRs 0.56 1.27 0.5 0.32
S T E P 3 . Identify Indicators of Potential Impacts and Opportunities

10 1 0 S T E P S T O C R E A T I N G A C O N V E R S A T I O N
This is the point in the process where it is impor-tant to outline the development constraints, consider the parameters for the kinds of uses and activities that might occur on the site (e.g., residential, stores, offi ces), establish the typical kinds of buildings (e.g., the density and mix of uses) and units (e.g., family-oriented and senior hous-ing), and the level of affordability and tenure (e.g., ownership and rental) of those units. In preparation for the workshop, the param-eters for site development need to be established through interviews with key people including town offi cials, developers and other stakeholders. These parameters include the existing zoning and site conditions such as wetlands and slopes as well as the potential building types and uses to be considered for the site design. This step also requires the “bundling” of data (e.g., parking, student numbers) associated with those build-ings and uses. This bundle of data is entered into the computer model allowing for an integrated understanding of changes brought by proposed development. Through this process, we understand that:
• Design becomes a way to visualize values and policies using different spatial and program-matic (e.g., uses and activities) components.
• The spatial parameters will measure the indi-cators such as density and site coverage, and will consider these features in terms of livabil-ity, sustainability and satisfaction of needs.
• The establishment of site uses and building types should be informed by best practice case studies implemented on similar sites around the country.
Set out the Community
Design Parameters
Site Boundary
Parks
Streams
Water Bodies
Buildings
Driveway
Parking Lot
Street
Sidewalk
Tarrytown 150’ Wetland Road and Property Boundary Setback
NYS DEC Wetlands
100-year Flood Zone
Steep Slopes (Over 25%)
Required Setback:100’ from State Route 11975’ from Wetlands75’ from Property Line
Contours (10’)
1 inch = 30 feet
Mews / Permeable Pavement
Playgrounds
Assume mix of uses with no maximum percent. Existing zoning sets maximum residential at 55%.
Assume no building on wetlands. Building on the 150-foot wetland buffer requires 1-to-1 replacement of wetlands.
Assume no building on steep slopes.
Assume suggested alternative for parking requirement (as per flashcard). The model will calculate current and alternative parking and with parking in building and on internal streets.
Consider road and property-line buffers requirements adjustable.
Assume buildings spacing to be 30 feet (1-inch tile on the grid). Existing zoning requires 50 feet.
Use a variety of types and uses based on 2-, 3-, and 4-story building types (see flashcards). Keep in mind, the numbers are calculated for building type per tile rather than for the entire building.
1
2
3
4
5
6
Zoning assumptions:
How do you use the model? Legend
0 50 100 15025Feet
}}“the tile”
0 50 100 15025 Feet
• The parameters, building types, uses and lev-els of affordability can be integrated into the Tygron software so that when stakeholders begin to build a scenario for the case study site, they are able to see both the spatial arrange-ments and the quantifi ed impacts created by the modeling software.
The indicators set out in Step 3 apply to any site that may eventually be selected for further review. Once a site is selected there is an extensive pro-cess of analysis to understand the physical aspects of the site.
Site ParametersCurrent zoning will provide much of the baseline information for a site, but it is critical to also learn from how other municipalities have addressed zoning in similar conditions. Changing the zoning to mixed use and/or reducing the parking require-ments are two options that many towns have used to successfully encourage development. Topography plays a major role in the ability of the site to host development. In particular, we are limited a the prototype site by wetlands and steep slopes. Flood zones and aquifers are strictly pro-tected by state environmental and health agencies, but with environmentally sensitive design these wetlands can be integrated into open space plan-ning. Open space can also be protected and access can be improved by creating stronger connections both physically and visually with the surrounding community.
Building TypologiesThis step in the process includes the selection
of the building typologies which defi ne different kinds of buildings, such as apartment buildings or townhouses and other types for specifi c uses that may be appropriate for the site. Once zoning, demographics and indicator research is complete, or at least under way, the types of buildings that fi t the site can be identifi ed. The selection of building typologies, with variations based on unit types, tenure and mix of uses, will go a long way toward setting the vision for the community. For instance, a plan that focuses on ownership-based three-bedroom townhouses with a rental unit on the top fl oor aims for a family-oriented development.
A Note on Tygron: Integrating Parameters and Indicators
The more complex the project, the harder it becomes to grasp the consequences of design choices; as a result solutions are delayed or postponed. One problem is that critical parties affected by the process are often not included in the planning. When confl icts arise, delays occur and costs increase. Tygron software creates a virtual space in which site indicators can be measured and stake-holders can plan and negotiate differences. With a front-end input of data, parameters and a 3-D model of the development site, all parties can then work with real information and visualization as they share their own perspectives and develop work-able scenarios. This virtual environment can be modifi ed at any point to provide live feedback based on current data. The Tygron model provides a living document that refl ects the current state of affairs and the concerns of key stakeholders.
Map of Site-based Parameters for the Tarrytown Greyfi eld Site
The adjacent plan of the Tarrytown greyfi eld site highlights the site-based parameters, such as current zoning requirements (including required setbacks, wetlands, required wetland buffers and steep slopes.
Site Boundary
Steep Slopes (Over 25%)
Tarrytown 150' Wetland Road and Property Boundary Setback
NYS DEC Wetlands
100-year Flood Zone
Required Setback:100' from State Route 11975' from Wetlands75' from Property Line
4S T E P
11
Here’s WhatYou Can Do:
S I T E P A R A M E T E R S /T Y P O L O G I E S
Research Questions
� What are the specifi c sites under consideration?
� What are the general trends regarding site conditions in the area (i.e., what are the common issues that property owners in the area deal with)?
� What are the unique site conditions?
• Infrastructure
• Geologic —soil and rock composition
• Hydrologic—water shed and soil absorption
� Are there any factors that will physically prevent development moving forward vs. general site constraints?
� How close is each site to primary services?
� Which municipal district does each site fall within? Will there be any complications as a result of being in multiple districts?
� What are the primary factors on adjacent and other neighboring sites? how will changes on the project site
Students
Property TaxesTax for School District
Affordable UnitsAffordable Family UnitsMarket Units
at 20%* at 50%* at 100%*
School District Cost **.25 .32 .42
$4.3K $5.4K $7.2K
$11.6K $11.2K $10.6K
$6.9K $6.7K $6.3K
.6 1.5 3
0 0 0
2.4 1.5 0
* Percentage of Affordable Units in Bldg. ** Marginal Cost
Hyde Square Co-op, Jamaica Plain, MA, Photo: Jones et al. Good Neighbors: Affordable Family Housing
Traffic (new AM peak trips)Parking Required by Current ZoningParking Required by Suggested ZoningParking Zoning ChangeParking Spaces within Building
All calculations are per tile
3-story townhouse3 x 1BRs
Sq Feet/TileNo. Units/Tile
1.22 1.20 1.17
7.5
3
- 4.5
2
3
2.1K
MODEL
2,100
* Percentage of Affordable Units in Bldg. ** Marginal Cost
Hyde Square Co-op, Jamaica Plain, MA, Photo: Jones et al. Good Neighbors: Affordable Family Housing
3-story townhouseSTUDIO + 3BR
Sq Feet/TileNo. Units/Tile
Students
Property TaxesTax for School District
Affordable UnitsAffordable Family UnitsMarket Units
at 20%* at 50%* at 100%*
School District Cost **.51 .80 1.27
$8.5K $13.7K $21.9K
$11.6K $11.2K $10.6K
$6.9K $6.7K $6.3K
.4 1 2
.4 1 2
1.6 1 0
Traffic (new AM peak trips)Parking Required by Current ZoningParking Required by Suggested ZoningParking Zoning ChangeParking Spaces within Building
1.15 1.13 1.10
5
2.5
- 2.5
2
2
All calculations are per tile
2.1K
RENTRENT
wet dry
* Marginal Cost
All calculations are per tile
Students
Property TaxesTax for School District
Gallons per DayInfrastructure Grant Amount (HIF)
School District Cost *
Traffic (new AM peak trips)Parking Spaces
Market UnitsAffordable Units / Aff. Family Units
--
1600- -
-
$6.7K$3.9K
108.21
-
800
Beacon, NY, Photo: Google Streetview
2-/3-story mixed-use
Sq Feet/Tile
ground floor store with office above
2000
Beacon, NY, Photo: Google Streetview
2-/3- story mixed-use
Sq Feet/Tile
ground floor store with 2BR above to RENT
wet dry
* Marginal Cost
All calculations are per tile
Students
Property TaxesTax for School District
Gallons per DayInfrastructure Grant Amount (HIF)
School District Cost *
Traffic (new AM peak trips)Parking Spaces
Market UnitsAffordable Units / Aff. Family Units
.16$2.6K
1468- -
0/0
$6.7K$3.9K
76.97
1
668
2000
1 unit 0 units
Requires 4 Parking Tiles
Requires 2 Parking Tiles
Example: Pound Ridge Flashcard
Example: Tarrytown Flashcard
impact them?
� How can we visualize the parameters graphically?
� What are the range of building typologies that might be appropriate for the site ?
Actions
� Establish Site Parameters and identify opportunities and constraints:
• Wetlands & buffers
• Floodzones (coastal vs. riparian)
• Topography/steep slopes
• Zoning
� Review specifi c geospatial questions:
• Proximity/access to public transportation
• Distance to schools
• Distance to primary shopping districts
• Distance to central business districts
• Watershed concerns (regional and local)
� Identify potential building types:
• Scotts Corners had a limited number of build-ing types while Tarrytown had more options.
� Create Flashcards.
� Consider the opportunity for ‘Re’-development rather than new development.
� Examine municipal boundaries—water/school/tax districts are often not coterminous with each other or with town borders.
Here’s Whoto Speak with:
• Town planner• School district administration/
superintendant• County/town engineer• Planning board members
Here Are the Sources
We Used:County Data and Zoning
Shapiro, John, Alix Fellman and Brian Kintish, “Report on Zoning by Municipality in Westchester County, New York”, Pratt Institute, July, 2013, http://www.crotononhudson-ny.gov/public_documents/croton-hudsonny_webdocs/exhibit-1.pdf
Mapping Westchester County—Interactive Mapping— Thematic Maps (Schools & School Districts), http://giswww.westchestergov.com/gismap/
Westchester County GIS Data, http://giswww.west-chestergov.com/Default.htm
DesignBook: Jones, Tom, William Pettus and Michael Pyatok,
“Good Neighbors: Affordable Family Housing (Design for Living)”, McGraw Hill, 1997
Affordable Housing Design Advisor, http://designadvi-sor.org
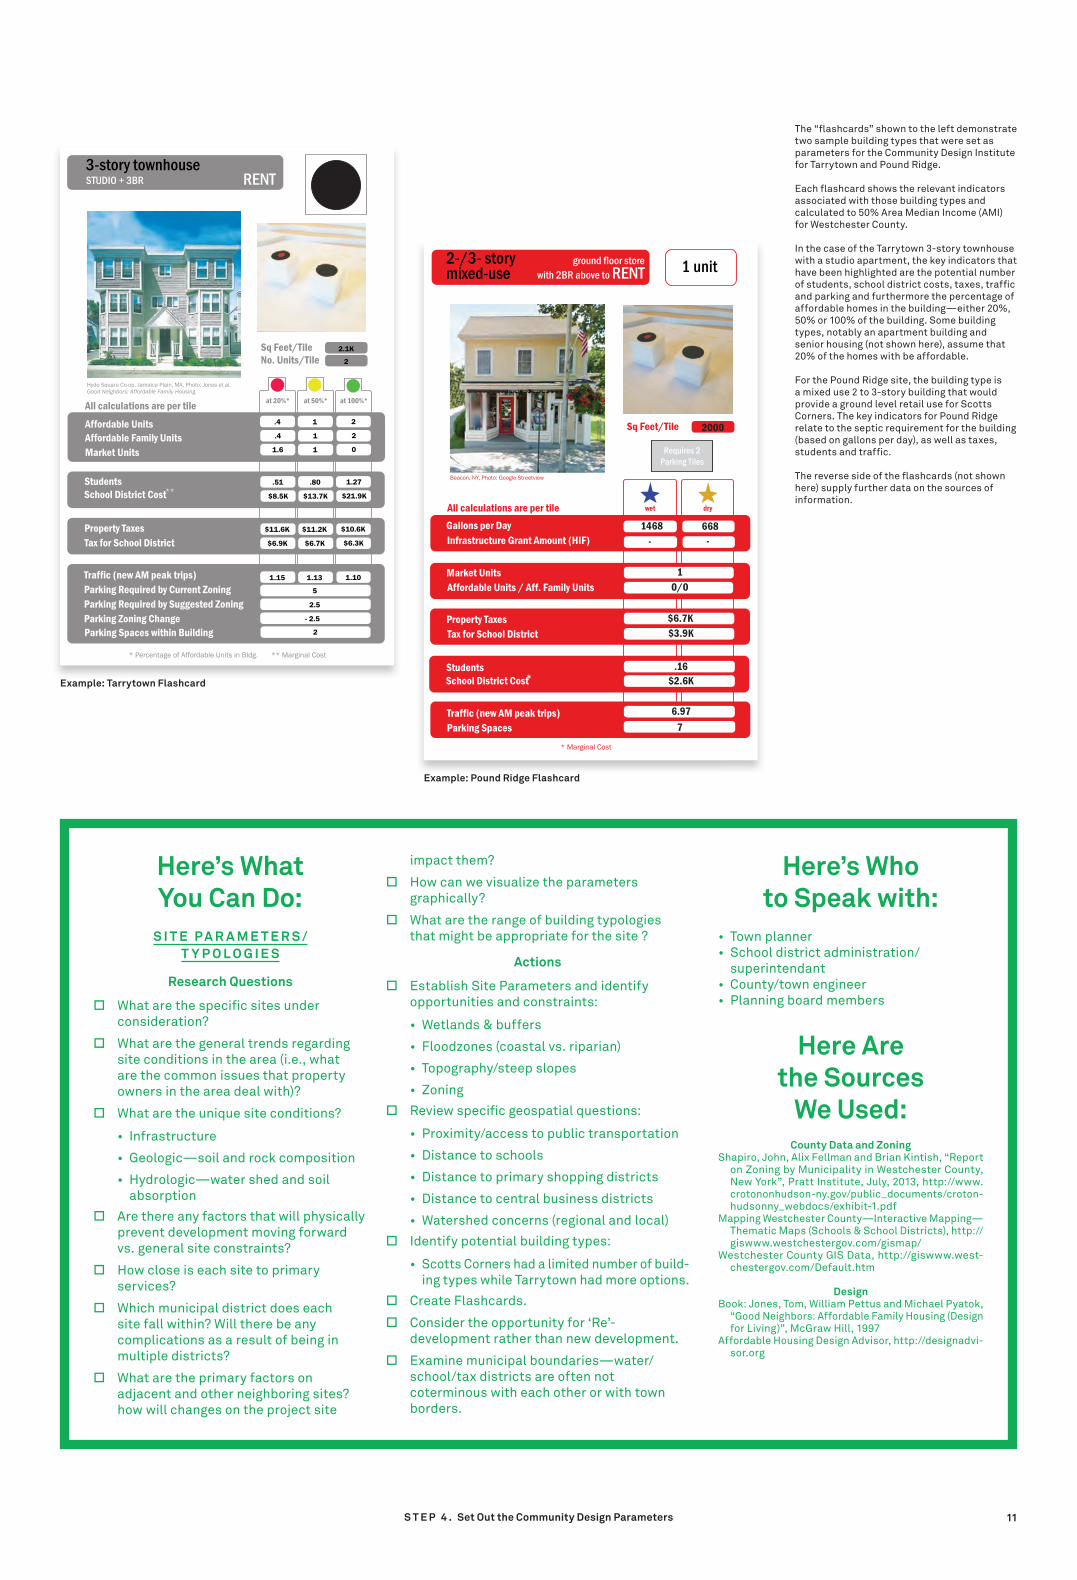
The “fl ashcards” shown to the left demonstrate two sample building types that were set as parameters for the Community Design Institute for Tarrytown and Pound Ridge.
Each fl ashcard shows the relevant indicators associated with those building types and calculated to 50% Area Median Income (AMI) for Westchester County.
In the case of the Tarrytown 3-story townhouse with a studio apartment, the key indicators that have been highlighted are the potential number of students, school district costs, taxes, traffi c and parking and furthermore the percentage of affordable homes in the building—either 20%, 50% or 100% of the building. Some building types, notably an apartment building and senior housing (not shown here), assume that 20% of the homes with be affordable.
For the Pound Ridge site, the building type is a mixed use 2 to 3-story building that would provide a ground level retail use for Scotts Corners. The key indicators for Pound Ridge relate to the septic requirement for the building (based on gallons per day), as well as taxes, students and traffi c.
The reverse side of the fl ashcards (not shown here) supply further data on the sources of information.
S T E P 4 . Set Out the Community Design Parameters

12 1 0 S T E P S T O C R E A T I N G A C O N V E R S A T I O N
Every person views a new building development through their own set of concerns and values, and together they offer a wealth of experience and constructive energy. Building a model requires the right mix of stakeholders to share their particular concerns and who are open to creative ideas from other stakeholders. The selection and invitation of stakeholders is perhaps the most critical step in the whole process. Having the right people at the table is vital to a successful outcome, though it does not guarantee one. Discussing everybody’s concerns together is what leads to successful compromise. The outreach process should begin as early as possible and it should include many different view-points. Participants should have local expertise, but county-wide experience will also be helpful. Enlist the help of local representatives early to develop the list of invitees. By including a diverse set of perspectives the workshop can generate the discussion of many top-ics that would otherwise not receive exposure. By raising issues early in the process there is a greater likelihood that an affordable housing development will receive approval from important stakeholder groups:
• How can stakeholders understand each other’s concerns?
• How can the interplay of stakeholder values
achieve a sustainable community vision?• Help stakeholders identify collaborative
actions to move forward mutual goals that include affordable housing.
• How can a good design process help stakehold-ers to learn from the values of other stake-holders and the data prepared in advance to create more collaborative and effective design negotiation?
At the two full-day Institutes, each person was assigned a stakeholder role in the morning to allow them to consider the values and concerns from that stakeholder perspective. The first four were used in Tarrytown, two more were added for Pound Ridge and others could be added or substituted for site specific conditions:
The NeighborEmphasizing values such as the scale of new build-ings, traffic and the contribution of new develop-ment toward creating pedestrian-friendly streets and green space.
The DeveloperFocusing on the ability to create a quality product and achieve a sufficient level of profit.
The EnvironmentalistSpotlighting the importance of conserving natural
and open space as an important town asset.
The Municipal CitizenStressing concerns about infrastructure such as schools, fire departments and sewage systems and aspiring to new amenities for the town.
The Affordable Housing AdvocateWorking to deliver a range of housing types and affordability to meet needs of current and future residents.
The Local Business OwnerHighlighting the value of supporting local busi-ness to meet community needs, create a vibrant streetscape and provide important tax revenues.
Stakeholders Represent a Community’s Activities and Qualities
Bringing the right stakeholders together needs to be reflective of the people, the places and the activities of the communities. The photos on this page speak to the many elements of the communi-ties in Pound Ridge and Tarrytown, including the schools, the open spaces and scenic areas, the town center shops and the areas’ businesses as well as the homes.
Bringing the Right
Stakeholders to the Table
Here’s What You Can Do:
S TA K E H O L D E R S
Research Questions
� What is the complete list of constituencies for each municipality?
� Who can help identify these groups and individuals?
� Who are the major players?
� Who are the groups most directly affected by any changes?
� How are they approached?
� What is our goal for inviting a wide selection of stakeholders? What can we accomplish with a diversity of opinions
that we cannot accomplish with a smaller, more focused group?
� How are they educated before the community design process?
� What are the main concerns for each stakeholder group? Do they tie into the indicators?
Actions
� Push to engage with all viewpoints and harness the expertise of as wide a network as possible.
� Engage all the people who can make or break a project with the goal of bringing them all to the table early in the process.
� Work with partners to invite potential stakeholders outside immediate circle of contacts.
� Send formal letter of invitation to attend the workshop.
Here’s Who to Speak with:
• Municipal official• Developer• Neighbor• Affordable housing advocate• Environmentalist• Local business owner (Could be
the Chamber of Commerce)
Note: Each village/town will have their own appropriate set of stakeholders, but this group worked in Tarrytown and Pound Ridge.
5S T E P

13
Main St. Scotts Corners (Google Maps)
Pound Ridge Town Park (Sonja Lovas, Flickr)
Pound Ridge Elementary School
Tarrytown Music Hall (curbcollege.org)
Main St. Tarrytown (Flickr)
Scenic Hudson Riverwalk Park (scenichudson.org)
Landmark Eastview (biomedreality.com)
S T E P 5 . Bring the Key Stakeholders to the Table

14 1 0 S T E P S T O C R E A T I N G A C O N V E R S A T I O N
Foam model for site in Tarrytown, NY

15S T E P 6 . Focus Stakeholders on Design Challenges
16 1 0 S T E P S T O C R E A T I N G A C O N V E R S A T I O N
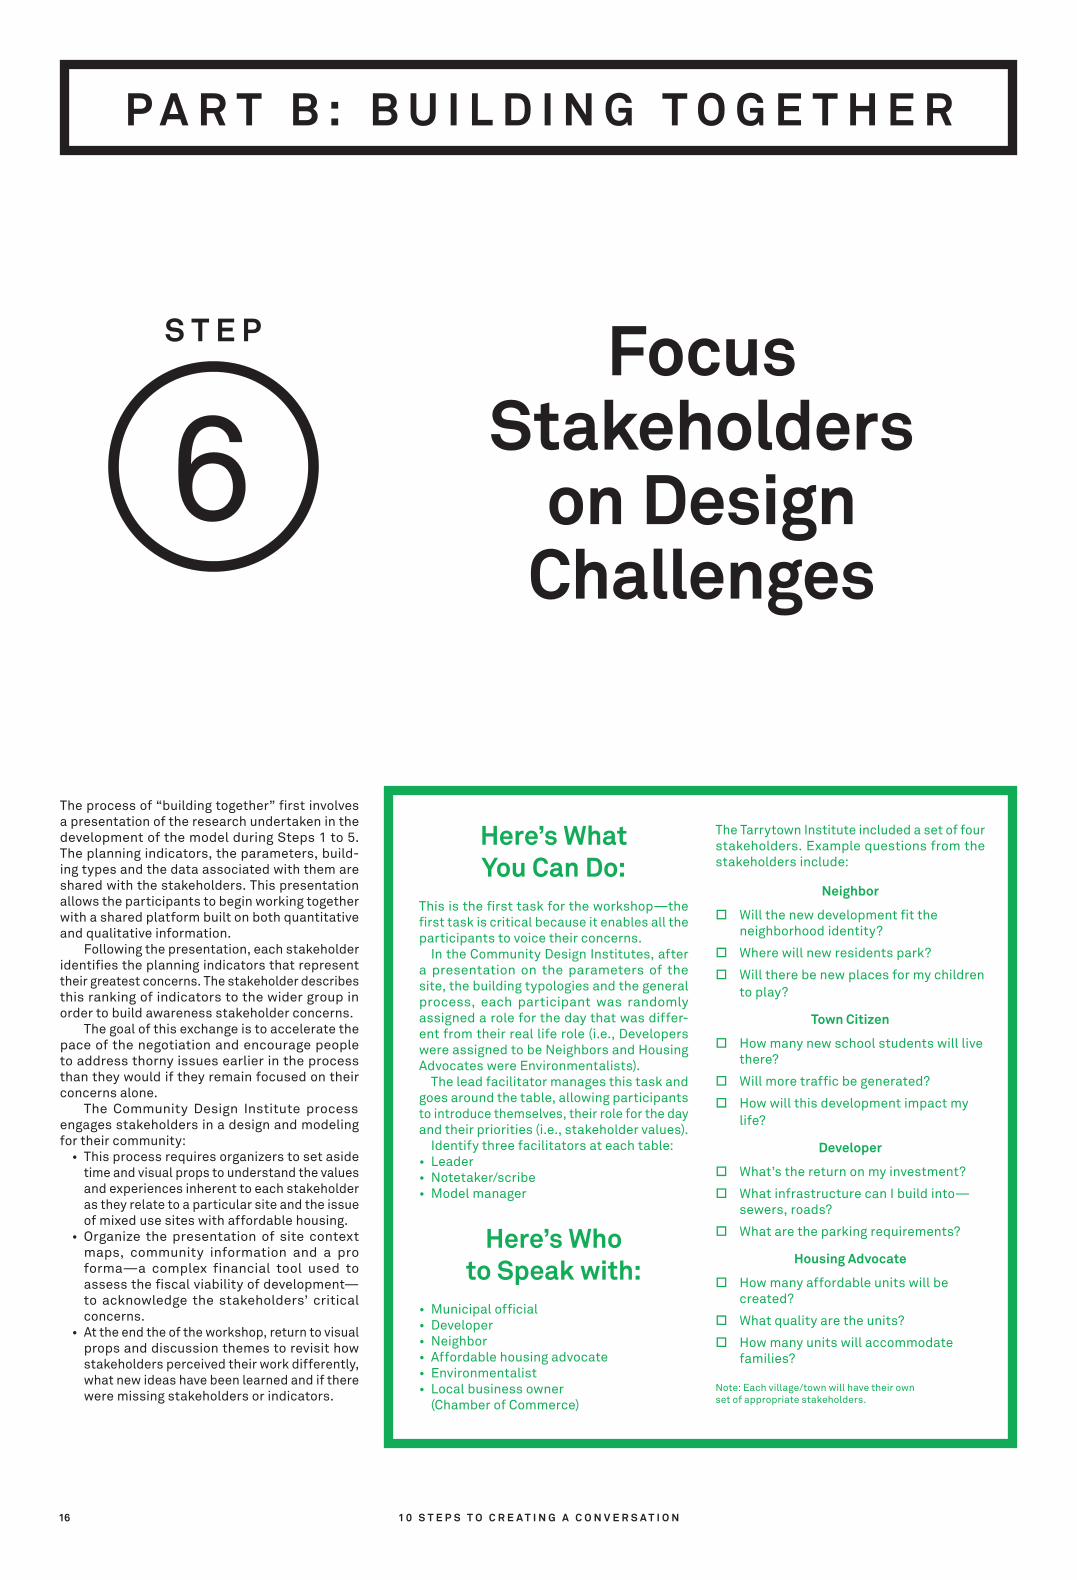
The process of “building together” first involves a presentation of the research undertaken in the development of the model during Steps 1 to 5. The planning indicators, the parameters, build-ing types and the data associated with them are shared with the stakeholders. This presentation allows the participants to begin working together with a shared platform built on both quantitative and qualitative information. Following the presentation, each stakeholder identifies the planning indicators that represent their greatest concerns. The stakeholder describes this ranking of indicators to the wider group in order to build awareness stakeholder concerns. The goal of this exchange is to accelerate the pace of the negotiation and encourage people to address thorny issues earlier in the process than they would if they remain focused on their concerns alone. The Community Design Institute process engages stakeholders in a design and modeling for their community:
• This process requires organizers to set aside time and visual props to understand the values and experiences inherent to each stakeholder as they relate to a particular site and the issue of mixed use sites with affordable housing.
• Organize the presentation of site context maps, community information and a pro forma—a complex financial tool used to assess the fiscal viability of development—to acknowledge the stakeholders’ critical concerns.
• At the end the of the workshop, return to visual props and discussion themes to revisit how stakeholders perceived their work differently, what new ideas have been learned and if there were missing stakeholders or indicators.
P A R T B : B U I L D I N G T O G E T H E R
Focus Stakeholders
on Design Challenges
Here’s What You Can Do:
This is the first task for the workshop—the first task is critical because it enables all the participants to voice their concerns.
In the Community Design Institutes, after a presentation on the parameters of the site, the building typologies and the general process, each participant was randomly assigned a role for the day that was differ-ent from their real life role (i.e., Developers were assigned to be Neighbors and Housing Advocates were Environmentalists).
The lead facilitator manages this task and goes around the table, allowing participants to introduce themselves, their role for the day and their priorities (i.e., stakeholder values).
Identify three facilitators at each table:• Leader• Notetaker/scribe• Model manager
Here’s Who to Speak with:
• Municipal official• Developer• Neighbor• Affordable housing advocate• Environmentalist• Local business owner
(Chamber of Commerce)
The Tarrytown Institute included a set of four stakeholders. Example questions from the stakeholders include:
Neighbor
� Will the new development fit the neighborhood identity?
� Where will new residents park?
� Will there be new places for my children to play?
Town Citizen
� How many new school students will live there?
� Will more traffic be generated?
� How will this development impact my life?
Developer
� What’s the return on my investment?
� What infrastructure can I build into—sewers, roads?
� What are the parking requirements?
Housing Advocate
� How many affordable units will be created?
� What quality are the units?
� How many units will accommodate families?
Note: Each village/town will have their own set of appropriate stakeholders.
6S T E P

17
This next step enables participants to put their values into action. Using a scale model of the site, each group works together to create a development plan that accomplishes the goals of the various stakeholders. Foam blocks and paper cutouts were used to represent a palate of options that could be built on the site. The facilitators work to guide the participants and answer specific questions, but the participants make the decisions about the specific design issues. This step emphasizes the urban design quality of the proposed development before engaging the issues of uses and building types. Site plan layout, the building heights, street setbacks, open space and site access are critical elements to achieving a community vision and provide an opportunity to reflect on the current zoning. This mediated approach requires adequate preparation time to collect the proper building bocks as well as extensive testing of how the modeling components help stakeholders achieve the aspirations defined by the workshop outcomes.
Create Opportunities
through Site Design
Here’s What You Can Do:
Materials provided for site design included:
� Scale model of the site (our models included a grid showing the size of each “tile.” Changes to indicators are reflected at the level of each tile (see Step 3).
� Foam blocks in different shapes and sizes (1 to 6 tiles) to represent building types (residential, commercial, mixed, senior) and size.
� Colored paper squares representing other land uses (open space, playgrounds, wetlands).
� Legend to be shared by participants at each table.
� Flashcard booklet providing information on each of the building types ( no. units, unit mix, no. bedrooms, ground floor retail).
� Prior to the workshop date, a number of building typologies (see Step 4) were created from foam blocks. These shapes were provided to allow a three dimensional sense of the impact of any site design decisions.
� The exercise is designed to be hands-on for the participants. Facilitators should avoid placing the units on the model unless necessary to assist participants.
7S T E P
S T E P 7. Create Opportunities through Site Design
The model exercise explores how site design can help to achieve a community vision.

18 1 0 S T E P S T O C R E A T I N G A C O N V E R S A T I O N
The previous step allowed participants to begin the process of site design by placing the blocks on the model. This is a great start because it allows people to get a feel for the scale of the site and its potential. Tougher decisions come in this step where we add in several other parameters in two separate sub-steps. First the primary character of the development will be determined by the unit mix, the number of affordable units, the mix of uses and other options available. Each of these options is represented by colored stickers, which means that there are a wide range of different combinations of building type and unit mix, for example, that groups can select. A second set of colored stickers is applied to make another round of decisions, which would determine the tenure (rental or ownership) and level of affordability associated with each building. Setting the affordability for rental units will directly related to the economic viability of the project.
Two different designs from two different teams with identical material and information
Develop a Community
through a Mix of Uses
and People
Here’s What You Can Do:
Materials provided for mix of uses included:
� Stickers can be used to represent many different things.
� Large stickers were used to represent combinations of the following:
• Rent/own
• Unit mix
� Small stickers were used for the following:
• % of affordable units in building (differ-ent colors can be used to set different levels e.g., 20%, 50% or 100%)
• Wet/dry businesses (this applied to Pound Ridge GPD septic limits)
� A series of flashcards was created for each design institute to provide a “cheat sheet,” or a guide, on the impact of
building a given unit type (examples provided in the Appendix).
� The impact was measured on how it would affect each of the indicators (see Step 3).
With all of these materials, and with the guidance of the facilitators, the tables make decisions on the mix of uses, activities and people reflecting the values they articulated in the Stakeholder Values exercise in Step 6.
Here’s who to Speak with:
• Municipal official• Developer• Neighbor• Affordable housing advocate• Environmentalist• Local business owner (could
be Chamber of Commerce)
8S T E P

19
Following a few hours of intense discussion, team-work and model making, groups have the opportu-nity to see the fruit of their labor converted into a digital model. The digital model is designed from the beginning to break down into discrete “tiles,” and these tiles can be recreated to show a digital representation of the physical model created by the team. In typical workshops it would be almost impossible to understand the impact of so many complicated decisions, particularly where those decisions are so closely interrelated. The digital model gives us instant feedback. The benefit of this tool is that stakeholders are able to understand the impact of their decisions quickly and simply, based on a calculation of the planning indicators identified earlier. (The Appendix highlights the indicators and parameters that were used in the Institutes and show the results of two of the working groups.) If one part of the group has fought for something only to find out that it has pushed the model beyond financial viability they can find compromise quickly, hopefully avoiding long and contentious approval cycles.
Samples of indicator outputs from the model. Results are based on decisions made by the group.
Here’s What You Can Do:
The physical model created by the group is converted and entered into software tables to create a digital model of their plan.
The model generates two components. The first is a 3-D digital representation of the site showing all the buildings, roads and other elements in a realistic image. The image can be viewed from different angles to get a sense of height, bulk and layout. The second component shows the results of the unique combination of choices on the complete list of indicators:
Visualize and Assess Community
Designs
student co traffic parking de parking de tarrytownparking (ge school tax units residents lot coverage
TrafficImportance: 10%
Explanation:
Total amount of new AM peak trips
Apartments (Senior, Design)Apartments (1BR/2BR/3BR, Design)3-Story Townhouse 1BRs (20% Design)3-Story Townhouse 1BRs (100% Design)3-Story Townhouse 3BR + Studio (20% Design)3-Story Townhouse 3BR + Studio (50% Design)3-Story Townhouse 3BR + Studio (100% Design)3-Story Townhouse 2BRs (20% Design)2-Story Townhouse (Market, Design)US Parking Space (Design)Commercial / Office (Design)Retail/Garage 1-story (only connected to 4-storyapartments, Design)2-Story Townhouse (Affordable, Design)
By taking 13 measures 149 trips have beenachieved.
13 trips36 trips9 trips4 trips4 trips6 trips3 trips9 trips14 trips2 trips36 trips5 trips
2 trips
48 spaces120 spaces24 spaces12 spaces10 spaces15 spaces7 spaces22 spaces38 spaces54 spaces12 spaces
6 spaces
MeasuresApartments (Senior, Design)Apartments (1BR/2BR/3BR, Design)3-Story Townhouse 1BRs (20% Design)3-Story Townhouse 1BRs (100% Design)3-Story Townhouse 3BR + Studio (20% Design)3-Story Townhouse 3BR + Studio (50% Design)3-Story Townhouse 3BR + Studio (100% Design)3-Story Townhouse 2BRs (20% Design)2-Story Townhouse (Market, Design)Commercial / Office (Design)Retail/Garage 1-story (only connected to 4-storyapartments, Design)2-Story Townhouse (Affordable, Design)
Parking Demand (sugg.)Importance: 10%
Explanation:
Total amount of parking spaces demandedby suggested zoning.
By taking 12 measures 369 spaces have been achieved.
48 units63 units24 units12 units8 units12 units6 units18 units19 units3 units
MeasuresApartments (Senior, Design)Apartments (1BR/2BR/3BR, Design)3-Story Townhouse 1BRs (20% Design)3-Story Townhouse 1BRs (100% Design)3-Story Townhouse 3BR + Studio (20% Design)3-Story Townhouse 3BR + Studio (50% Design)3-Story Townhouse 3BR + Studio (100% Design)3-Story Townhouse 2BRs (20% Design)2-Story Townhouse (Market, Design)2-Story Townhouse (Affordable, Design)
Additional units can be earned by taking extra measures relevant to this indicator.
New UnitsImportance: 10%
Explanation:
Total amount of new units.
By taking 10 measures 213 units have been achieved.
• No. of school aged children• No. of units• No. of bedrooms• Traffic volumes generated• No. parking spaces required• All of the indicators chosen during Step 3• Tax impacts• Other municipal services
Our method led to discussions and com-promise happening in real time with various options tried and then coming off the table throughout the exercise.
Each team presents in front of the entire group to explain their model, how they made their decisions and why certain elements were included.
9S T E P
S T E P 9 . Visualize and Assess Community Designs

20 1 0 S T E P S T O C R E A T I N G A C O N V E R S A T I O N
At this point, stakeholders have presented their plan, walked the other workshop participants through their logic, learned the impact of their plan based on the list of relevant indicators and seen a 3-D digital model of the development scenario.
Time is set aside in the schedule after each group has presented for review and refl ection:
• What was the result of their plan? • How did their plan compare to those of the
other groups? • What would they change after learning the
impact on taxes, school-aged children, park-ing requirements and number of affordable units?
• Can the project be successfully fi nanced? All of these elements can be adjusted in the model through a collaborative process.
Recalibrate Design,
Parameters and Values
Here’s What You Can Do:
After each group presents, they are given the feedback on the results to all of the relevant indicators.
They are informed whether or not the project, as conceived, is fi nancially viable, and they fi nd out how well they did in achieving their values based on the indicators.
Following this session, the tables come back together to consider what changes they would like to make, and see if there is any way to improve the model they developed.
Original site in the Tygron model
One of the workshop models after data is input into Tygron
10S T E P
21
A P P E N D I X : P A R A M E T E R S &
R E S U L T S
A P P E N D I X : P A R A M E T E R S & R E S U L T S

22 1 0 S T E P S T O C R E A T I N G A C O N V E R S A T I O N
Students
Property TaxesTax for School District
Affordable UnitsAffordable Family UnitsMarket Units
at 20%* at 50%* at 100%*
School District Cost **.25 .32 .42
$4.3K $5.4K $7.2K
$11.6K $11.2K $10.6K
$6.9K $6.7K $6.3K
.6 1.5 3
0 0 0
2.4 1.5 0
* Percentage of Affordable Units in Bldg. ** Marginal Cost
Hyde Square Co-op, Jamaica Plain, MA, Photo: Jones et al. Good Neighbors: Affordable Family Housing
Traffic (new AM peak trips)Parking Required by Current ZoningParking Required by Suggested ZoningParking Zoning ChangeParking Spaces within Building
All calculations are per tile
3-story townhouse3 x 1BRs
Sq Feet/TileNo. Units/Tile
1.22 1.20 1.17
7.5
3
- 4.5
2
3
2.1K
MODEL
2,100
* Percentage of Affordable Units in Bldg. ** Marginal Cost
Hyde Square Co-op, Jamaica Plain, MA, Photo: Jones et al. Good Neighbors: Affordable Family Housing
3-story townhouseSTUDIO + 3BR
Sq Feet/TileNo. Units/Tile
Students
Property TaxesTax for School District
Affordable UnitsAffordable Family UnitsMarket Units
at 20%* at 50%* at 100%*
School District Cost **.51 .80 1.27
$8.5K $13.7K $21.9K
$11.6K $11.2K $10.6K
$6.9K $6.7K $6.3K
.4 1 2
.4 1 2
1.6 1 0
Traffic (new AM peak trips)Parking Required by Current ZoningParking Required by Suggested ZoningParking Zoning ChangeParking Spaces within Building
1.15 1.13 1.10
5
2.5
- 2.5
2
2
All calculations are per tile
2.1K
RENTRENT
Flashcard (Front): Indicators
Flashcard (Back): Assumptions and Sources
The site is restricted by a steep slop in north (slope over 25%) and by wetland and a wetland buffer in south. 50% of the site is within the 100-year fl ood zone. The site also requires a 75-foot setback from wetlands as well as a 100-foot setback from Route 119 that runs just north of the site and a 75-foot setback from the property line.
Apartment 2-Story Townhouse
ParametersWetland, Floodplain & Slope
Options
Community Design Institute #1:
Tarrytown Case Study
Steps to Successful Workshop Preparation:
Attendees
Design workshops required a full day commitment from participants with months of research in advance for the preparation of mate-rial. Gathering data and interviewing experts allowed the workshop organizers to understand trends, identify sites, analyze the context surrounding those sites and create all the material for participants to work through all the relevant issues and questions. These images provide a snapshot of some of the steps followed to accomplish this process and some of the results.
Maps, drawings and graphics were an important part of the day because we wanted people to understand the physical aspects of the site as well as the complexity and inter-relatedness of the issues. Finally, the day’s activities were presented in the form of a series of questions:
• Presentation: What are we starting with?• Negotiation: What can we make together?• Review: What did we achieve?• Refi ne: What can we target for change?• Performance: What do we need to achieve our vision
All of this was set in the context of the primary goal of this work: building strong communities that include affordable housing.
Site Boundary
Parks
Streams
Water Bodies
Buildings
Driveway
Parking Lot
Street
Sidewalk
Tarrytown 150’ Wetland Road and Property Boundary Setback
NYS DEC Wetlands
100-year Flood Zone
Steep Slopes (Over 25%)
Required Setback:100’ from State Route 11975’ from Wetlands75’ from Property Line
Contours (10’)
1 inch = 30 feet
Mews / Permeable Pavement
Playgrounds
Assume mix of uses with no maximum percent. Existing zoning sets maximum residential at 55%.
Assume no building on wetlands. Building on the 150-foot wetland buffer requires 1-to-1 replacement of wetlands.
Assume no building on steep slopes.
Assume suggested alternative for parking requirement (as per flashcard). The model will calculate current and alternative parking and with parking in building and on internal streets.
Consider road and property-line buffers requirements adjustable.
Assume buildings spacing to be 30 feet (1-inch tile on the grid). Existing zoning requires 50 feet.
Use a variety of types and uses based on 2-, 3-, and 4-story building types (see flashcards). Keep in mind, the numbers are calculated for building type per tile rather than for the entire building.
1
2
3
4
5
6
Zoning assumptions:
How do you use the model? Legend
0 50 100 15025Feet
}}“the tile”
0 50 100 15025 Feet
Site Boundary
Steep Slopes (Over 25%)
Tarrytown 150' Wetland Road and Property Boundary Setback
NYS DEC Wetlands
100-year Flood Zone
Required Setback:100' from State Route 11975' from Wetlands75' from Property Line

23
Scenario A
Scenario B
Scenario A Scenario B
No. of New Residents 599 431
Building Types
Apartment, Senior 84 units 36 units
Apartment (1BR/2BR/3BR) 135 units 63 units
3-Story Townhouse 3x1BRs (20%) 15 units 18 units
3-Story Townhouse 3x1BRs (50%) 0 21 units
3-Story Townhouse 3x1BRs (100%) 0 0
3-Story Townhouse 3BR + Studio (20%) 26 units 14 units
3-Story Townhouse 3BR + Studio (50%) 0 10 units
3-Story Townhouse 3BR + Studio (100%) 0 0
3-Story Townhouse 2x2BRs (20%) 22 units 32 units
3-Story Townhouse 2x2BRs (50%) 0 0
3-Story Townhouse 2x2BRs (100%) 0 0
2-Story Townhouse (Market) 9 units 12 units
2-Story Townhouse (Affordable) 0 0
Retail 23,400 SF 10,800 SF
Commercial 3,600 SF 0 SF
Open Space 220,500 SF 246,600 SF
Unit Types
No. of New Units 291 206
Affordable Units 56 48
Senior Units 3846
School Impacts
Cost for New Students $681 K $564 K
Students Generated 39 32
Taxes
Taxes Generated for School District $1.131 M $740 K
Traffic and Parking
New Traffic AM Trips Generated 213 108
Parking Spaces Required Under Current Zoning 942 554
Parking Spaces Required Under Proposed Zoning 543 301
Tygron Model Results Pro Forma: Scenario Comparison
The pro forma developed for the Tarrytown Case Study was an inte-gral part in developing and refining the workshop scenarios. As each scenario presented a unique vision for development, the pro forma gave each scenario an opportunity to determine the most financially sustainable version possible while also permitting scenario-by-scenario comparisons. The pro forma was built upon market driven income and expense assumptions, as well as construction cost estimates based on R.S. Means data for Westchester County. Quickly generated projections on Internal Rates of Return (IRR), Total Development Cost and Total Operating Income allowed participants to evaluate and make adjust-ments to the Tyron model to balance developer’s profitability and cash flow with affordable housing. The pro forma additionally assumed that if the scenarios met federal and state criteria, the developer could take advantage of available Low-Income Housing Tax Credits. In comparing Scenarios A and B, Scenario A presented the more profitable model with a higher projected IRR. The estimated develop-ment cost for Scenario A is approximately 46% higher than Scenario B. It assumes that from this projection, the total operating cost for the rentals in Scenario A are approximately 45% higher than Scenario B. However, though Scenario A presented the more profitable model, workshop participants discussed the projections while remaining engaged with qualitative elements of the scenarios including urban design, wetland preservation and unit and community mix.
A P P E N D I X : P A R A M E T E R S & R E S U L T S

24 1 0 S T E P S T O C R E A T I N G A C O N V E R S A T I O N
0
400
2000
400
0
400
400
1200
400
400
400
400
600
400
700
400
400
400400
400
400
400
400
400
100
1100
400
400
400
400
0
400
400
400
400
700
300
200
300
400
400400
300
400
400
300
400
400
900
400
400
400
400900
800
400
400
300
400
400
100
400
400
100
100
400
0
400
500
900
700
15001700 300
0
PB-BPB-A
PB-BPB-C
Pound Ridge
Pound RidgeBedford
Bedford
Scotts Corners
Pound Ridge
Shopping District: Bedford Village
Shopping District: New Canaan (CT)
Connecticut
Pound Ridge
Ripowam River WatershedStone Hill River
Watershed
MianusRiver Watershed
Pound RidgeBedford
Bedford
Scotts Corners
Pound Ridge
Connecticut
Regional Parameter: Shopping District
Regional Parameter: Watershed
Local Parameter: Zoning
Local Parameter: Slopes and Wetlands
Scotts Corner is part of three watersheds including the Stone Hill River Watershed in the northwest, the Mianus River Watershed to the southwest and the Ripowam River Watershed to the east.
Scotts Corner has limited retail and further limited wet retail (cafes, restaurants, salons) due to caps on waste water processing. The nearest shopping districts are in Bedford Village and New Canaan.
Development in Scotts Corner is limited by some steep slopes and large areas of wetlands.
Current zoning caps the number of units that can be developed per parcel due to limits of the in-ground septic system.
Steps to Successful Workshop Preparation:
Organizers
When researching potential redevelopment sites it is important to examine both the local context and the regional conditions. Our team looked at the county, the town and/or the village as carefully as we focused on the site itself. Any residents that decide to move into a new development will consider the distance to transportation and access to employment, how long it will take to drive their kids to school if they miss the bus and the location and the quality of local shopping and dining so we need to acknowledge those factors as well.
Significant time goes into analyzing Census data, zoning ordi-nances and school enrollment histories and projections, as well as appropriate building typologies. In parallel with this research, a series of tools are built to convert the decisions made in the workshop into material results. The volume of data and level of detail is considerable, although the analysis applied to the data is not extraordinarily com-plex. This requires careful attention on the part of the researchers, and many of the tools require the team to make a series of assumptions. Assumptions, of course, may be challenged, but we were careful to lay them out explicitly in our documentation provided during the workshops (e.g., see Page 8)
Community Design Institute #2:
Pound Ridge Case Study
Parameters
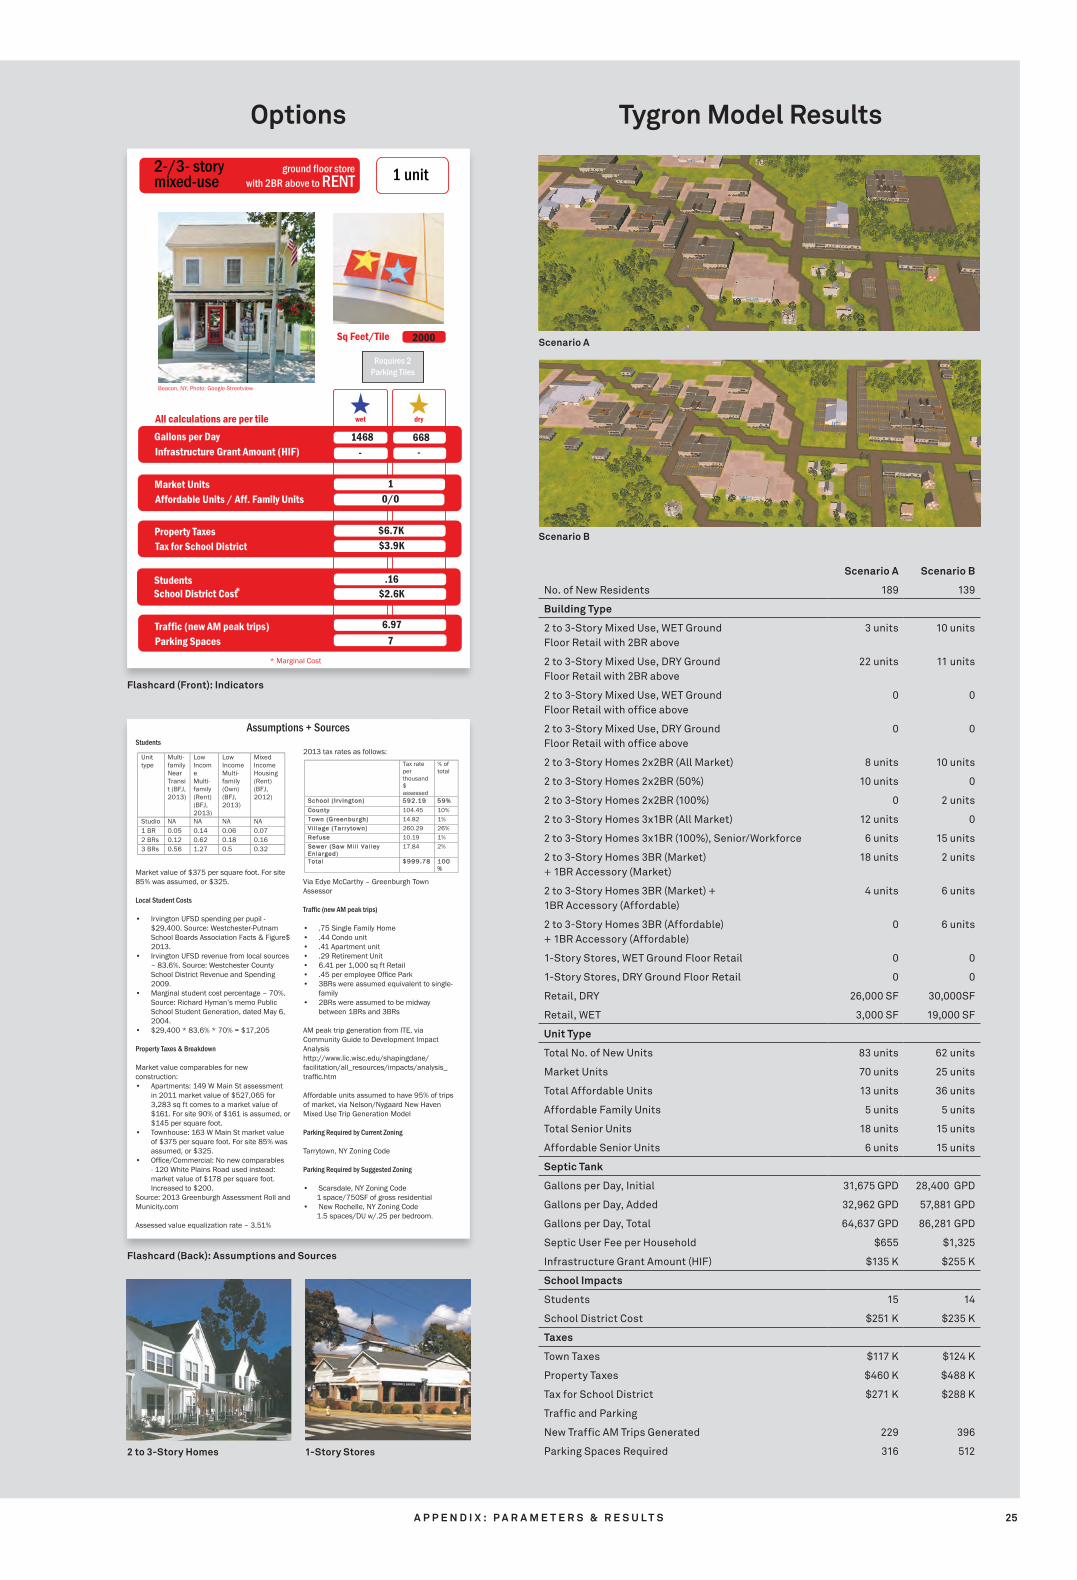
25
Scenario A
Scenario B
2 to 3-Story Homes 1-Story Stores
wet dry
* Marginal Cost
All calculations are per tile
Students
Property TaxesTax for School District
Gallons per DayInfrastructure Grant Amount (HIF)
School District Cost *
Traffic (new AM peak trips)Parking Spaces
Market UnitsAffordable Units / Aff. Family Units
--
1600- -
-
$6.7K$3.9K
108.21
-
800
Beacon, NY, Photo: Google Streetview
2-/3-story mixed-use
Sq Feet/Tile
ground floor store with office above
2000
Beacon, NY, Photo: Google Streetview
2-/3- story mixed-use
Sq Feet/Tile
ground floor store with 2BR above to RENT
wet dry
* Marginal Cost
All calculations are per tile
Students
Property TaxesTax for School District
Gallons per DayInfrastructure Grant Amount (HIF)
School District Cost *
Traffic (new AM peak trips)Parking Spaces
Market UnitsAffordable Units / Aff. Family Units
.16$2.6K
1468- -
0/0
$6.7K$3.9K
76.97
1
668
2000
1 unit 0 units
Requires 4 Parking Tiles
Requires 2 Parking Tiles
Students
Market value of $375 per square foot. For site 85% was assumed, or $325.
Local Student Costs
• Irvington UFSD spending per pupil - $29,400. Source: Westchester-Putnam School Boards Association Facts & Figure$ 2013.
• Irvington UFSD revenue from local sources – 83.6%. Source: Westchester County School District Revenue and Spending 2009.
• Marginal student cost percentage – 70%. Source: Richard Hyman’s memo Public School Student Generation, dated May 6, 2004.
• $29,400 * 83.6% * 70% = $17,205
Property Taxes & Breakdown
Market value comparables for new construction:• Apartments: 149 W Main St assessment
in 2011 market value of $527,065 for 3,283 sq ft comes to a market value of $161. For site 90% of $161 is assumed, or $145 per square foot.
• Townhouse: 163 W Main St market value of $375 per square foot. For site 85% was assumed, or $325.
• Office/Commercial: No new comparables - 120 White Plains Road used instead: market value of $178 per square foot. Increased to $200.
Source: 2013 Greenburgh Assessment Roll and Municity.com
Assessed value equalization rate – 3.51%
2013 tax rates as follows:
Via Edye McCarthy – Greenburgh Town Assessor
Traffic (new AM peak trips)
• .75 Single Family Home• .44 Condo unit• .41 Apartment unit• .29 Retirement Unit• 6.41 per 1,000 sq ft Retail• .45 per employee Office Park• 3BRs were assumed equivalent to single-
family• 2BRs were assumed to be midway
between 1BRs and 3BRs
AM peak trip generation from ITE, via Community Guide to Development Impact Analysishttp://www.lic.wisc.edu/shapingdane/facilitation/all_resources/impacts/analysis_traffic.htm
Affordable units assumed to have 95% of trips of market, via Nelson/Nygaard New Haven Mixed Use Trip Generation Model
Parking Required by Current Zoning
Tarrytown, NY Zoning Code
Parking Required by Suggested Zoning
• Scarsdale, NY Zoning Code 1 space/750SF of gross residential• New Rochelle, NY Zoning Code 1.5 spaces/DU w/.25 per bedroom.
Assumptions + SourcesAssumptions + Sources
Students Unit type
Multi-family Near Transit (BFJ, 2013)
Low Income Multi-family (Rent) (BFJ, 2013)
Low Income Multi-family (Own) (BFJ, 2013)
Mixed Income Housing (Rent) (BFJ, 2012)
Studio NA NA NA NA 1 BR 0.05 0.14 0.06 0.07 2 BRs 0.12 0.62 0.18 0.16 3 BRs 0.56 1.27 0.5 0.32
Market value of $375 per square foot. For site 85% was assumed, or $325. Local Student Costs
• Irvington UFSD spending per pupil - $29,400 Source: Westchester-Putnam School Boards Association Facts & Figure$ 2013
• Irvington UFSD revenue from local sources – 83.6% Source: Westchester County School District Revenue and Spending 2009
• Marginal student cost percentage – 70% Source: Richard Hyman’s memo Public School Student Generation, dated May 6, 2004
• $29,400 * 83.6% * 70% = $17,205
Property Taxes & Breakdown Market value comparables for new construction:
• Apartments: 149 W Main St assessment in 2011 market value of $527,065 for 3,283 sq ft comes to a market value of $161. For site 90% of $161 is assumed, or $145 per square foot.
• Townhouse: 163 W Main St market value of $375 per square foot. For site 85% was assumed, or $325.
• Office/Commercial: No new comparables - 120 White Plains Road used instead: market value of $178 per square foot. Increased to $200.
Source: 2013 Greenburgh Assessment Roll and Municity.com Assessed value equalization rate – 3.51%
2013 tax rates as follows:
Tax rate per thousand $ assessed
% of total
School ( Irv ington) 592.19 59% County 104.45 10% Town (Greenburgh) 14.82 1% Vi l lage (Tarrytown) 260.29 26% Refuse 10.19 1% Sewer (Saw Mil l Val ley Enlarged)
17.84 2%
Total $999.78 100%
Via Edye McCarthy – Greenburgh Town Assessor
Traffic (new AM peak trips)
• .75 Single Family Home • .44 Condo unit • .41 Apartment unit • .29 Retirement Unit • 6.41 per 1,000 sq ft Retail • .45 per employee Office Park • 3BRs were assumed equivalent to single-
family • 2BRs were assumed to be midway between
1BRs and 3BRs AM peak trip generation from ITE, via Community Guide to Development Impact Analysis http://www.lic.wisc.edu/shapingdane/facilitation/all_resources/impacts/analysis_traffic.htm Affordable units assumed to have 95% of trips of market, via Nelson/Nygaard New Haven Mixed Use Trip Generation Model
Parking Required by Current Zoning Tarrytown, NY Zoning Code
Parking Required by Suggested Zoning
• Scarsdale, NY Zoning Code 1 space/750SF of gross residential
• New Rochelle, NY Zoning Code 1.5 spaces/DU w/.25 per bedroom.
Assumptions + Sources Students
Unit type
Multi-family Near Transit (BFJ, 2013)
Low Income Multi-family (Rent) (BFJ, 2013)
Low Income Multi-family (Own) (BFJ, 2013)
Mixed Income Housing (Rent) (BFJ, 2012)
Studio NA NA NA NA 1 BR 0.05 0.14 0.06 0.07 2 BRs 0.12 0.62 0.18 0.16 3 BRs 0.56 1.27 0.5 0.32
Market value of $375 per square foot. For site 85% was assumed, or $325. Local Student Costs
• Irvington UFSD spending per pupil - $29,400 Source: Westchester-Putnam School Boards Association Facts & Figure$ 2013
• Irvington UFSD revenue from local sources – 83.6% Source: Westchester County School District Revenue and Spending 2009
• Marginal student cost percentage – 70% Source: Richard Hyman’s memo Public School Student Generation, dated May 6, 2004
• $29,400 * 83.6% * 70% = $17,205
Property Taxes & Breakdown Market value comparables for new construction:
• Apartments: 149 W Main St assessment in 2011 market value of $527,065 for 3,283 sq ft comes to a market value of $161. For site 90% of $161 is assumed, or $145 per square foot.
• Townhouse: 163 W Main St market value of $375 per square foot. For site 85% was assumed, or $325.
• Office/Commercial: No new comparables - 120 White Plains Road used instead: market value of $178 per square foot. Increased to $200.
Source: 2013 Greenburgh Assessment Roll and Municity.com Assessed value equalization rate – 3.51%
2013 tax rates as follows:
Tax rate per thousand $ assessed
% of total
School ( Irv ington) 592.19 59% County 104.45 10% Town (Greenburgh) 14.82 1% Vi l lage (Tarrytown) 260.29 26% Refuse 10.19 1% Sewer (Saw Mil l Val ley Enlarged)
17.84 2%
Total $999.78 100%
Via Edye McCarthy – Greenburgh Town Assessor
Traffic (new AM peak trips)
• .75 Single Family Home • .44 Condo unit • .41 Apartment unit • .29 Retirement Unit • 6.41 per 1,000 sq ft Retail • .45 per employee Office Park • 3BRs were assumed equivalent to single-
family • 2BRs were assumed to be midway between
1BRs and 3BRs AM peak trip generation from ITE, via Community Guide to Development Impact Analysis http://www.lic.wisc.edu/shapingdane/facilitation/all_resources/impacts/analysis_traffic.htm Affordable units assumed to have 95% of trips of market, via Nelson/Nygaard New Haven Mixed Use Trip Generation Model
Parking Required by Current Zoning Tarrytown, NY Zoning Code
Parking Required by Suggested Zoning
• Scarsdale, NY Zoning Code 1 space/750SF of gross residential
• New Rochelle, NY Zoning Code 1.5 spaces/DU w/.25 per bedroom.
Scenario A Scenario B
No. of New Residents 189 139
Building Type
2 to 3-Story Mixed Use, WET Ground Floor Retail with 2BR above
3 units 10 units
2 to 3-Story Mixed Use, DRY Ground Floor Retail with 2BR above
22 units 11 units
2 to 3-Story Mixed Use, WET Ground Floor Retail with offi ce above
0 0
2 to 3-Story Mixed Use, DRY Ground Floor Retail with offi ce above
0 0
2 to 3-Story Homes 2x2BR (All Market) 8 units 10 units
2 to 3-Story Homes 2x2BR (50%) 10 units 0
2 to 3-Story Homes 2x2BR (100%) 0 2 units
2 to 3-Story Homes 3x1BR (All Market) 12 units 0
2 to 3-Story Homes 3x1BR (100%), Senior/Workforce 6 units 15 units
2 to 3-Story Homes 3BR (Market) + 1BR Accessory (Market)
18 units 2 units
2 to 3-Story Homes 3BR (Market) + 1BR Accessory (Affordable)
4 units 6 units
2 to 3-Story Homes 3BR (Affordable) + 1BR Accessory (Affordable)
0 6 units
1-Story Stores, WET Ground Floor Retail 0 0
1-Story Stores, DRY Ground Floor Retail 0 0
Retail, DRY 26,000 SF 30,000SF
Retail, WET 3,000 SF 19,000 SF
Unit Type
Total No. of New Units 83 units 62 units
Market Units 70 units 25 units
Total Affordable Units 13 units 36 units
Affordable Family Units 5 units 5 units
Total Senior Units 18 units 15 units
Affordable Senior Units 6 units 15 units
Septic Tank
Gallons per Day, Initial 31,675 GPD 28,400 GPD
Gallons per Day, Added 32,962 GPD 57,881 GPD
Gallons per Day, Total 64,637 GPD 86,281 GPD
Septic User Fee per Household $655 $1,325
Infrastructure Grant Amount (HIF) $135 K $255 K
School Impacts
Students 15 14
School District Cost $251 K $235 K
Taxes
Town Taxes $117 K $124 K
Property Taxes $460 K $488 K
Tax for School District $271 K $288 K
Traffi c and Parking
New Traffi c AM Trips Generated 229 396
Parking Spaces Required 316 512
Flashcard (Front): Indicators
Flashcard (Back): Assumptions and Sources
Tygron Model ResultsOptions
A P P E N D I X : P A R A M E T E R S & R E S U L T S

26 1 0 S T E P S T O C R E A T I N G A C O N V E R S A T I O N

27
Acknowledgments
We would like to acknowledge several organizations and individuals that helped bring together the Community Design Institutes and this workbook, 10 Steps to Creating a Conversation. The origination of this effort derives from James Johnson, the Westchester Housing Monitor. The planning of this process was pushed further by Carolyn Stevens, the former mayor of Scarsdale.
We’d like to acknowledge the funders of the Community Design Institutes and this workbook: the Corporation of Supportive Housing (CSH), a national nonprofit technical assistance provider, with Jane Bilger as the CSH director involved.
We’d also like to acknowledge the organizers of the March 2014 Community Design Institutes: Rose Noonan of Housing Action Council and Joan Arnold of Allied Community Enterprises.
Our preparations were supported by officials at the Village of Tarrytown and the Town of Pound Ridge: Mayor Drew Fixell, Village Administrator Mike Blau and Planning Board Member David Aukland, and Town Supervisor Dick Lyman of Pound Ridge.
We also received important comments and feedback from professionals working in Westchester, including Stephen Tilly, Duo Dickinson, Richard Hyman and Andrew Tung.
We reviewed our approach with a number of community leaders including: Geoffery Anderson, WRO; Laura Rossi, Westchester Community Foundation; and Karen Schatzel, League of Women Voters of Westchester.
A C K N O W L E D G M E N T S
WXY is a planning and architecturefirm based in New York City.Please contact Adam Lubinsky for further information at:[email protected]
William Morrish is a Professor at Parsons The New School ofDesign. Please contact Bill at:[email protected]
Tygron is the product of Tygron Engine, a Dutch software company: www.tygron.com
William Morrish