10 Reasons to Support the Arts in 2021
21
www.AmericansForTheArts.org 10 Reasons to Support the Arts in 2021 The arts are fundamental to our humanity. They ennoble and inspire us—fostering creativity, empathy, and beauty. The arts also strengthen our communities socially, educationally, and economically—benefits that persist even during a pandemic that has been devastating to the arts. The following ten reasons show why an investment in artists and arts organizations is vital to the nation’s post-pandemic healing and recovery. 1. Arts unify communities. 72% of Americans believe “the arts unify our communities regardless of age, race, and ethnicity” and 73% agree that the arts “helps me understand other cultures better”—a perspective observed across all demographic and economic categories. 2. Arts improve individual well-being. 81% of the population says the arts are a “positive experience in a troubled world,” 69% of the population believe the arts “lift me up beyond everyday experiences,” and 73% feel the arts give them “pure pleasure to experience and participate in.” 3. Arts strengthen the economy. The nation’s arts and culture sector—nonprofit, commercial, education—is an $878 billion industry that supports 5.1 million jobs. That is 4.5% of the nation’s economy—a larger share of GDP than powerhouse sectors such as agriculture, transportation, and tourism. The arts have a $30 billion international trade surplus. The arts also accelerate economic recovery: a growth in arts employment has a positive and causal effect on overall employment. 4. Arts drive tourism and revenue to local businesses. The nonprofit arts industry alone generates $166.3 billion in economic activity annually—spending by organizations and their audiences—which supports 4.6 million jobs and generates $27.5 billion in government revenue. Arts attendees spend $31.47 per person, per event, beyond the cost of admission on items such as meals, parking, and lodging—vital income for local businesses. Arts travelers are ideal tourists, staying longer and spending more to seek out authentic culture experiences. 5. Arts improve academic performance. Students engaged in arts learning have higher GPAs, standardized test scores, and college-going rates as well as lower drop-out rates. These academic benefits are reaped by students across all socio-economic strata. Yet, the Department of Education reports that access to arts education for students of color is significantly lower than for their white peers. 91% of Americans believe that arts are part of a well-rounded K-12 education. 6. Arts spark creativity and innovation. Creativity is among the top five applied skills sought by business leaders—per the Conference Board’s Ready to Innovate report—with 72% saying creativity is of “high importance” when hiring. Research on creativity shows that Nobel laureates in the sciences are 17 times more likely to be actively engaged arts an arts maker than other scientists. 7. Arts have social impact. University of Pennsylvania researchers have demonstrated that a high concentration of the arts in a city leads to higher civic engagement, more social cohesion, higher child welfare, and lower poverty rates. 8. Arts improve healthcare. Nearly one-half of the nation’s healthcare institutions provide arts programming for patients, families, and even staff. 78% deliver these programs because of their healing benefits to patients— shorter hospital stays, better pain management, and less medication. 9. Arts for the health and well-being of our military. The arts heal the mental, physical, and moral injuries of war for military servicemembers and Veterans, who rank the creative arts therapies in the top four (out of 40) interventions and treatments. Across the military continuum, the arts promote resilience during pre-deployment,
Transcript of 10 Reasons to Support the Arts in 2021

www.AmericansForTheArts.org
10 Reasons to Support the Arts in 2021
The arts are fundamental to our humanity. They ennoble and inspire us—fostering creativity, empathy, and
beauty. The arts also strengthen our communities socially, educationally, and economically—benefits that
persist even during a pandemic that has been devastating to the arts. The following ten reasons show why
an investment in artists and arts organizations is vital to the nation’s post-pandemic healing and recovery.
1. Arts unify communities. 72% of Americans believe “the arts unify our communities regardless of age, race, and
ethnicity” and 73% agree that the arts “helps me understand other cultures better”—a perspective observed
across all demographic and economic categories.
2. Arts improve individual well-being. 81% of the population says the arts are a “positive experience in a troubled
world,” 69% of the population believe the arts “lift me up beyond everyday experiences,” and 73% feel the arts
give them “pure pleasure to experience and participate in.”
3. Arts strengthen the economy. The nation’s arts and culture sector—nonprofit, commercial, education—is an
$878 billion industry that supports 5.1 million jobs. That is 4.5% of the nation’s economy—a larger share of GDP
than powerhouse sectors such as agriculture, transportation, and tourism. The arts have a $30 billion
international trade surplus. The arts also accelerate economic recovery: a growth in arts employment has a
positive and causal effect on overall employment.
4. Arts drive tourism and revenue to local businesses. The nonprofit arts industry alone generates $166.3 billion
in economic activity annually—spending by organizations and their audiences—which supports 4.6 million jobs
and generates $27.5 billion in government revenue. Arts attendees spend $31.47 per person, per event, beyond
the cost of admission on items such as meals, parking, and lodging—vital income for local businesses. Arts
travelers are ideal tourists, staying longer and spending more to seek out authentic culture experiences.
5. Arts improve academic performance. Students engaged in arts learning have higher GPAs, standardized test
scores, and college-going rates as well as lower drop-out rates. These academic benefits are reaped by students
across all socio-economic strata. Yet, the Department of Education reports that access to arts education for
students of color is significantly lower than for their white peers. 91% of Americans believe that arts are part of a
well-rounded K-12 education.
6. Arts spark creativity and innovation. Creativity is among the top five applied skills sought by business
leaders—per the Conference Board’s Ready to Innovate report—with 72% saying creativity is of “high
importance” when hiring. Research on creativity shows that Nobel laureates in the sciences are 17 times more
likely to be actively engaged arts an arts maker than other scientists.
7. Arts have social impact. University of Pennsylvania researchers have demonstrated that a high concentration of
the arts in a city leads to higher civic engagement, more social cohesion, higher child welfare, and lower poverty
rates.
8. Arts improve healthcare. Nearly one-half of the nation’s healthcare institutions provide arts programming for
patients, families, and even staff. 78% deliver these programs because of their healing benefits to patients—
shorter hospital stays, better pain management, and less medication.
9. Arts for the health and well-being of our military. The arts heal the mental, physical, and moral injuries of war
for military servicemembers and Veterans, who rank the creative arts therapies in the top four (out of 40)
interventions and treatments. Across the military continuum, the arts promote resilience during pre-deployment,

www.AmericansForTheArts.org
deployment, and the reintegration of military servicemembers, Veterans, their families, and caregivers into
communities.
10. Arts Strengthen Mental Health. The arts are an effective resource in reducing depression and anxiety and
increasing life satisfaction. Just 30 minutes of active arts activities daily can combat the ill effects of isolation and loneliness associated with COVID-19.

www.AmericansForTheArts.org/PublicOpinion
What Americans Say About the Arts
Americans are highly engaged in the arts and believe more strongly than ever that the arts
promote personal well-being, help us understand other cultures in our community, are essential
to a well-rounded K-12 education, and that government has an important role in funding the
arts.
1. “The arts provide meaning to our lives.” 69% of Americans believe the arts “lift me up beyond
everyday experiences,” 73% feel the arts give them “pure pleasure to experience and participate in,” and
81% say the arts are a “positive experience in a troubled world.”
2. “The arts unify our communities.” The personal benefits of the arts extend beyond the individual to
the community. 72% believe “the arts unify our communities regardless of age, race, and ethnicity” and
73% agree that the arts “helps me understand other cultures better.”
3. “Most of us seek out arts experiences.” Nearly three-quarters of the adult population (72%) attended
an arts or culture event during the previous year, such as the theater, museum, zoo, or a musical
performance.
4. “We experience the arts in unexpected places.” Americans also enjoy the arts in "non-traditional"
venues, such as a symphony in the park, a performance in an airport, or exhibitions in a hospital or
shopping mall (70%).
5. “There is near universal support for arts education.” 91% agree that the arts are part of a well-
rounded K-12 education. Over 90% say students should receive an education in the arts in elementary
school, middle school, and high school. 89% say the arts should also be taught outside of the classroom
in the community.
6. “We support government arts funding at all levels.” Most Americans approve of arts funding by
local government (60%), state government (58%), federal government (54%), and by the National
Endowment for the Arts (64%).
7. “We will vote for candidates who increase arts funding.” 53% support increasing federal
government spending on nonprofit arts organizations (vs. 22% against). Americans are twice as likely to
vote for a candidate who increases federal arts spending from 45 cents to $1 per person than against
one (37% vs. 18%).
8. “We make art in our personal time.” Half of all Americans are personally involved in art-making
activities such as painting, singing in a choir, making crafts, writing poetry, or playing music (47%).
9. “Creativity boosts job success.” 55% of employed adults say their job requires them to “be creative
and come up with ideas that are new and unique.” An even greater proportion (60%) say that the more
creative and innovative they are at their job, the more successful they are in the workplace.
10. “Cultural institutions add value to our community.” Whether people engage with the arts or not,
90% believe cultural facilities (theaters, museums, sculpture parks, neighborhood arts centers) improve
quality of life, and 86% believe cultural facilities are important to local business and the economy.

www.AmericansForTheArts.org/PublicOpinion
11. “We donate to the arts.” 24% of the population donated to an arts, culture, or public broadcasting
organization in the previous year. Donors were typically younger and had higher incomes and
education.
12. “Not everyone in my community has equal access to the arts.” Despite many benefits that the arts
bring to individuals and communities, just 50% believe that “everyone in their community has equal
access to the arts.”
Americans Speak Out About the Arts in 2018, conducted by Ipsos Public Affairs for Americans for the Arts in 2018, is based on a
nationally representative sample of 3,023 adults.

www.AmericansForTheArts.org
Arts Facts . . . Economic Impact of the
Arts
The nonprofit arts industry generated
$166.3 billion in total economic activity in
2015—supporting 4.6 million jobs and
generating $27.5 billion in government
revenue.
Economic Impact of the Nonprofit Arts and Culture
Industry
Total Economic Activity $166.3 Billion
Direct spending by nonprofit arts and culture organizations $63.8 Billion
Direct spending by culture audiences $102.5 Billion
Total Full-Time Equivalent Jobs Supported 4.6 Million
Total Household Income Generated $96.1 Billion
Total Government Revenue Generated $27.5 Billion
Federal income tax revenue $12.9 Billion
State government revenue $7.7 Billion
Local government revenue $6.9 Billion

www.AmericansForTheArts.org
• Nonprofit arts and culture organizations are valued members of the business community. They employ
people who live in the community, purchase goods and services from local businesses, are members of
their Chambers of Commerce, and promote their regions.
• In 2015, these organizations—performing and visual arts organizations, festivals, public art programs,
municipally owned museums and arts centers, and more—pumped an estimated $63.8 billion into the
nation’s economy. This economic activity leveraged an additional $102.5 billion in event-related
spending by arts audiences. The $166.3 billion in total economic activity supported 4.6 million full-time
equivalent jobs and generated $27.5 billion in total government revenue.
• When patrons attend an arts event, they may pay for parking, eat dinner at a restaurant, shop in local
retail stores, and have dessert on the way home. Based on the 212,691 audience surveys conducted for
this study, the typical attendee spends $31.47 per person, per event, beyond the cost of admission. 34%
of attendees came from outside the county in which the arts event took place. They spent twice as much
as their local counterparts ($47.57 vs. $23.44).
• Arts & Economic Prosperity 5 demonstrates that the arts are an industry that supports jobs, generates
government revenue, and is a cornerstone of tourism. Business and elected leaders need not feel that a
choice must be made between arts funding and economic prosperity. This study proves that they can
choose both. Nationally as well as locally, the arts mean business!
Visit www.AmericansForTheArts.org/AEP5 for more information about the Arts & Economic Prosperity 5 study.

www.AmericansForTheArts.org
• The U.S. Bureau of Labor Statistics (BLS) reports that there were 2.57 million artists in the U.S.
workforce in 2020—representing 1.6% of all workers ages 16 and older.
• In 2020, the unemployment rate for artists was 10.3%, up from 3.7% in 2019. The 2020
unemployment rate for artists remains higher than “Professionals” (4.9%), a category of workers
that includes artists and other occupations that generally require college training. The 2020
unemployment rate for the total workforce was 7.8%.
• It is important to note that this analysis of the artist labor force is comprised of just 11
occupational categories: architects; art directors, fine artists, and animators; designers; actors;
producers, and directors; dancers and choreographers; musicians; announcers; writers and
authors; photographers; and other artists and entertainers. While these categories only capture
a portion of all artists in the workforce, this methodology has been used by the federal
government for over 50 years, which makes it a valuable artist employment trend.
• Also noteworthy is that this is an analysis solely of artist employment. It does not include many
arts-related jobs such as arts administrators, curators, technical staff, and fundraisers.
Source: National Endowment for the Arts, Office of Research & Analysis and the U.S. Bureau of Labor Statistics, 2021.
Arts Facts . . . Artist Employment
As counted by the U.S. Bureau of Labor Statistics, there
are 2.6 million artists in the U.S. workforce—1.6% of all
workers. The unemployment rate for artists grew from
3.7% in 2019 to 10.3% in 2020.

www.AmericansForTheArts.org
Arts Facts . . . Economic Impact of the
Arts
The nonprofit arts industry generated
$166.3 billion in total economic activity in
2015—supporting 4.6 million jobs and
generating $27.5 billion in government
revenue.
Economic Impact of the Nonprofit Arts and Culture
Industry
Total Economic Activity $166.3 Billion
Direct spending by nonprofit arts and culture organizations $63.8 Billion
Event-related spending by arts audiences $102.5 Billion
Total Full-Time Equivalent Jobs Supported 4.6 Million
Total Household Income Generated $96.1 Billion
Total Government Revenue Generated $27.5 Billion
Federal income tax revenue $12.9 Billion
State government revenue $7.7 Billion
Local government revenue $6.9 Billion
www.AmericansForTheArts.org www.AmericansForTheArts.or
g
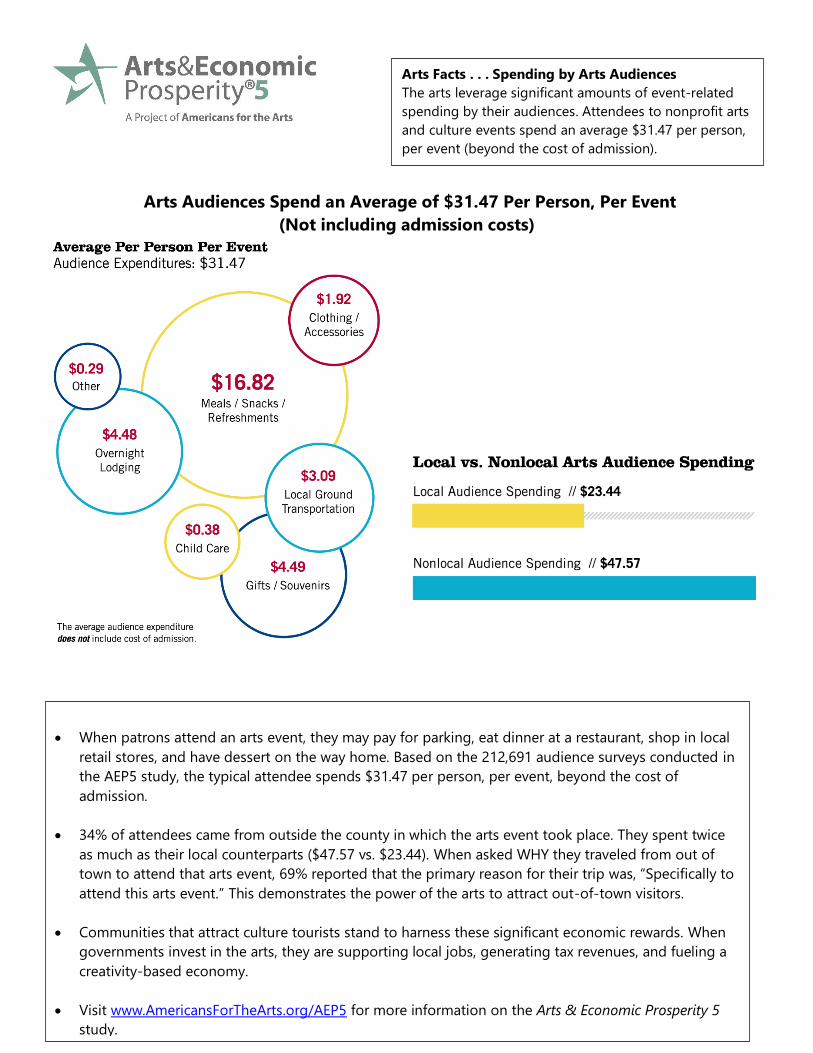
Arts Audiences Spend an Average of $31.47 Per Person, Per Event
(Not including admission costs)
Arts Facts . . . Spending by Arts Audiences
The arts leverage significant amounts of event-related
spending by their audiences. Attendees to nonprofit arts
and culture events spend an average $31.47 per person,
per event (beyond the cost of admission).
• When patrons attend an arts event, they may pay for parking, eat dinner at a restaurant, shop in local
retail stores, and have dessert on the way home. Based on the 212,691 audience surveys conducted in
the AEP5 study, the typical attendee spends $31.47 per person, per event, beyond the cost of
admission.
• 34% of attendees came from outside the county in which the arts event took place. They spent twice
as much as their local counterparts ($47.57 vs. $23.44). When asked WHY they traveled from out of
town to attend that arts event, 69% reported that the primary reason for their trip was, “Specifically to
attend this arts event.” This demonstrates the power of the arts to attract out-of-town visitors.
• Communities that attract culture tourists stand to harness these significant economic rewards. When
governments invest in the arts, they are supporting local jobs, generating tax revenues, and fueling a
creativity-based economy.
• Visit www.AmericansForTheArts.org/AEP5 for more information on the Arts & Economic Prosperity 5
study.

‐
‐

www.AmericansForTheArts.org
Arts Facts…Access to Arts Education is Not
Equitable
In 2008, African American and Hispanic students had
less than half of the access to arts education than their
White peers.
59.2%
64.8%
53.4%57.9%
50.9%
43.5%
36.0%
28.1%
47.2%
34.8%
27.4% 26.2%
1982 1992 2002 2008
Perc
en
tag
e o
f 18 t
o 2
4-y
ear-
old
s w
ho
receiv
ed
an
y a
rts
ed
ucati
on
in
ch
ild
ho
od
Study Year
Decline of Arts Education in Underserved Populations
White
African American
Hispanic
• Access to arts education for Black and Hispanic students is significantly lower than for
their White peers, and has been steadily declining for three decades.
• Findings by UCLA researcher James Catterall indicate that low socio-economic-status
students who are engaged in arts learning have increases in high school academic
performance, college-going rates, college grades, and holding jobs with a future.
• Despite these findings, the decline of arts education is most drastic in underserved
populations, where students who could benefit the most from arts education are getting
it the least.
Source: NEA Office of Research & Analysis, NORC at the University of Chicago (Rabkin & Hedberg,
2011).

www.AmericansForTheArts.org
Arts Facts…Improved Academic
Performance
Students who participate in the arts, both in
school and after school, demonstrate
improved academic performance and lower
dropout rates.
• Longitudinal data of 25,000 students demonstrate that involvement in the arts is linked to
higher academic performance, increased standardized test scores, more community service,
and lower dropout rates (see chart above). These cognitive and developmental benefits are
reaped by students regardless of their socioeconomic status.
• The report, Critical Links, contains 62 academic research studies that, taken together,
demonstrate that arts education helps close the achievement gap, improves academic skills
essential for reading and language development, and advances students’ motivation to
learn.
• Research conducted between 1987 and 1998 on young people working in the arts for at
least three hours on three days of each week throughout at least one full year,
demonstrated the following:
✓ 4 times more likely to have been recognized for academic achievement.
✓ Being elected to class office within their schools more than 3 times as often.
✓ 4 times more likely to participate in a math and science fair.
✓ 3 times more likely to win an award for school attendance.
✓ 4 times more likely to win an award for writing an essay or poem.
Sources: NEA Office of Research & Analysis (Catterall 2012); Arts Education Partnership (Deasy, 2002); Americans for the Arts (Heath
1998).


www.AmericansForTheArts.org
Arts Facts . . . Business Support to the Arts
With billions in arts funding, businesses play a key
role in ensuring the health and vitality of the nation’s
arts sector. Business support for the arts is driven less
by a charitable focus than it is targeted on how the
arts impact the communities in which their employees
live and work.
Corporate Support to the Arts in 2019
According to Giving in Numbers 2020 by Chief Executives for Corporate Purpose (CECP), the “share” of
corporate philanthropy directed to the arts by large corporations decreased to 5% in 2019.
Business Leaders Support the Arts for its Benefits to Quality of Life and the Economy
Business leaders responding to the Conference Board’s 2019 Business Contributions to the Arts Survey indicated
that they support the arts because it improves quality of life (62%) and strengthens the local economy (46%).
The report also showed that companies are increasingly aligning arts contributions programs with business
strategy and goals.
Corporate Arts Sponsorship Tops $1 Billion in 2018
• IEG reports that corporate sponsorship of the arts
was $1.03 billion in 2018.
• The business sectors with the largest arts
sponsorship activity are banks, professional
services, financial services, insurance, and retail.
• The arts were projected to receive 4% of all
corporate sponsorship in 2018.
Source: Compiled by Americans for the Arts, 2021.

www.AmericansForTheArts.org
Arts Facts . . . Government Funding to Arts
Agencies
In 2021, local and state government funding to
their arts agencies is expected to decrease due to
the pandemic’s impact on government budgets.
NEA funding increased to $167.5 million.
• Local government funding to their local arts agencies will be an estimated $797.3 million in
2021, a decrease of 7.5% from 2020. This is the second consecutive year of decline—both
resulting from the COVID-19 pandemic—and followed eight consecutive years of local
government funding increases. There are an estimated 4,500 local arts agencies in the U.S.
($797.3 million = $2.66 per capita)
• State legislative arts appropriations are expected to decrease 18.2% to $400.8 million in 2021,
down from a high-water mark of $490 million in 2020. State arts agencies received a 36%
increase in 2020. Even with the major appropriations decrease in 2021, it still exceeds 2019
($354 million vs. $400.8 million).
($400.8 million = $1.21 per capita)
• Federal appropriations to the National Endowment for the Arts (NEA) increased to $167.5
million in 2021, up from $162.25 million in 2020. The highest level of NEA funding was $176
million in 1992.
($167.5 million = 51 cents per capita)
Note: These figures are limited to government funding directly to the NEA, state arts agencies,
and local arts agencies. They do not represent the full breadth of government funding, such as
legislative line items to culture organizations, facilities, or arts funding by non-arts government
agencies.
Sources: Americans for the Arts, National Assembly of State Arts Agencies, and U.S Census Bureau, 2021.
*Estimated
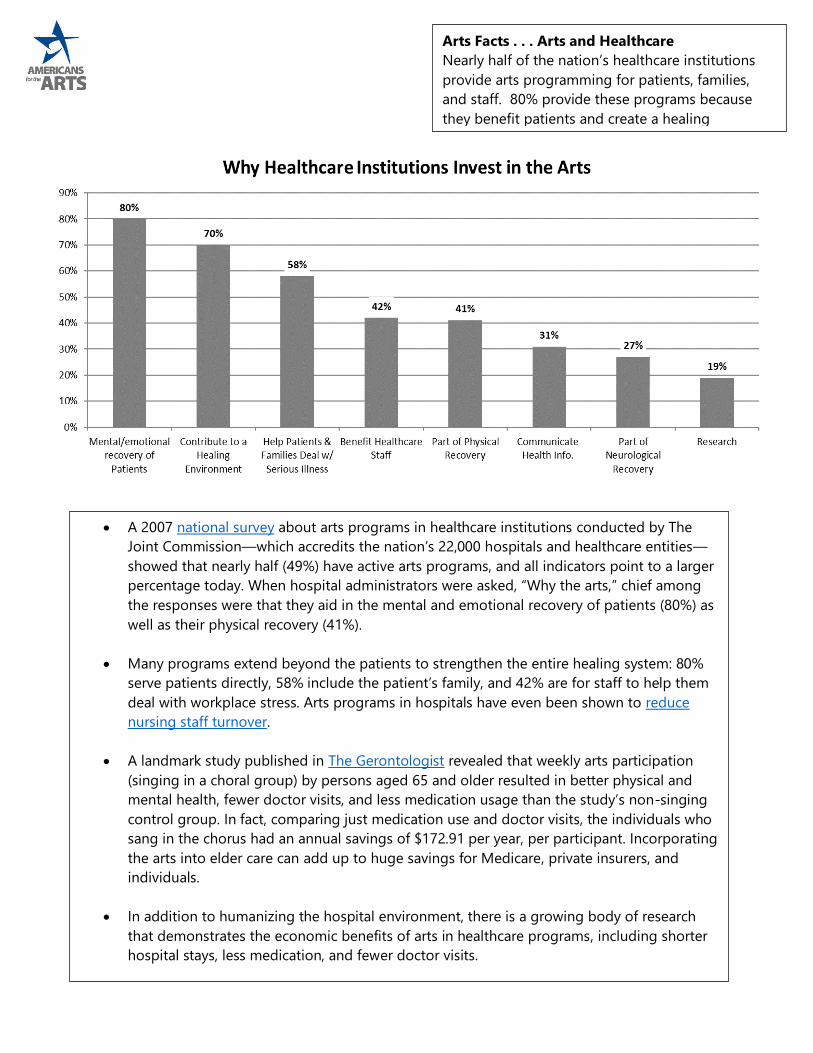
Arts Facts . . . Arts and Healthcare
Nearly half of the nation’s healthcare institutions
provide arts programming for patients, families,
and staff. 80% provide these programs because
they benefit patients and create a healing
environment.
• A 2007 national survey about arts programs in healthcare institutions conducted by The
Joint Commission—which accredits the nation’s 22,000 hospitals and healthcare entities—
showed that nearly half (49%) have active arts programs, and all indicators point to a larger
percentage today. When hospital administrators were asked, “Why the arts,” chief among
the responses were that they aid in the mental and emotional recovery of patients (80%) as
well as their physical recovery (41%).
• Many programs extend beyond the patients to strengthen the entire healing system: 80%
serve patients directly, 58% include the patient’s family, and 42% are for staff to help them
deal with workplace stress. Arts programs in hospitals have even been shown to reduce
nursing staff turnover.
• A landmark study published in The Gerontologist revealed that weekly arts participation
(singing in a choral group) by persons aged 65 and older resulted in better physical and
mental health, fewer doctor visits, and less medication usage than the study’s non-singing
control group. In fact, comparing just medication use and doctor visits, the individuals who
sang in the chorus had an annual savings of $172.91 per year, per participant. Incorporating
the arts into elder care can add up to huge savings for Medicare, private insurers, and
individuals.
• In addition to humanizing the hospital environment, there is a growing body of research
that demonstrates the economic benefits of arts in healthcare programs, including shorter
hospital stays, less medication, and fewer doctor visits.
Source: Americans for the Arts, 2021.

www.AmericansForTheArts.org
Fiscal Year Total Funds
2021 $ 167,500,000
2020 $ 162,250,000
2019 $ 155,000,000
2018 $ 152,800,000
2017 $ 150,000,000
2016 $ 147,949,000
2015 $ 146,021,000
2014 $ 146,021,000
2013 $ 146,020,000
2012 $ 146,020,992
2011 $ 154,690,000
2010 $ 167,500,000
2009 $ 155,000,000
2008 $ 144,706,800
2007 $ 124,561,844
2006 124,406,353$
2005 121,263,000$
2004 120,971,000$
2003 115,731,000$
2002 115,220,000$
2001 104,769,000$
2000 97,627,600$
1999 97,966,000$
1998 98,000,000$
1997 99,494,000$
1996 99,470,000$
1995 162,311,000$
1994 170,228,000$
1993 174,459,382$
1992 175,954,680$
1991 174,080,737$
1990 171,255,000$
1989 169,090,000$
1988 167,731,000$
1987 165,281,000$
1986 158,822,040$
1985 163,660,000$
1984 162,223,000$
1983 143,875,000$
1982 143,456,000$
1981 158,795,000$
1980 154,610,000$
1979 149,585,000$
1978 123,850,000$
1977 99,872,000$
1976 87,455,000$
1975 80,142,000$
1974 64,025,000$
1973 40,857,000$
1972 31,480,000$
1971 16,420,000$
1970 9,055,000$
1969 8,456,875$
1968 7,774,291$
1967 8,475,692$
1966 2,898,308$
Arts Facts . . . National Endowment for the Arts
The NEA supports the creation, preservation, and
presentation of the arts in America—a profound
responsibility yet funded by Congress at just $167.5
million in 2021 (51 cents per capita).
www.AmericansForTheArts.org
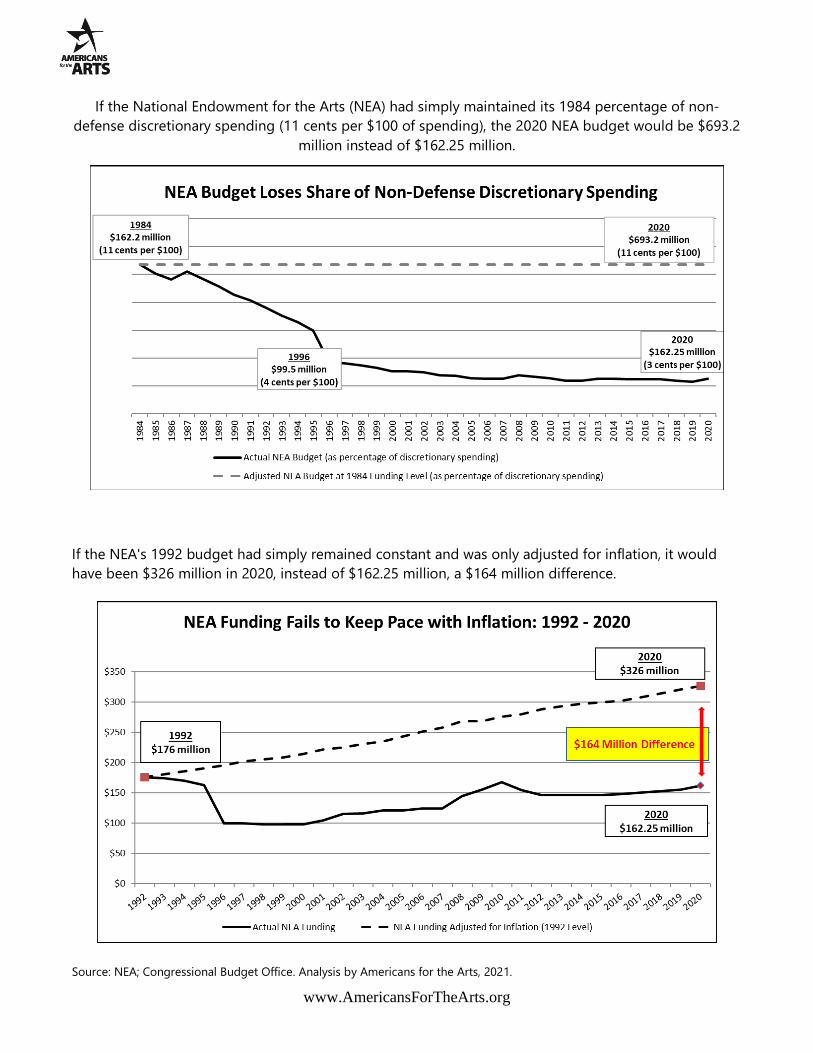
If the National Endowment for the Arts (NEA) had simply maintained its 1984 percentage of non-
defense discretionary spending (11 cents per $100 of spending), the 2020 NEA budget would be $693.2
million instead of $162.25 million.
If the NEA's 1992 budget had simply remained constant and was only adjusted for inflation, it would
have been $326 million in 2020, instead of $162.25 million, a $164 million difference.
Source: NEA; Congressional Budget Office. Analysis by Americans for the Arts, 2021.

www.AmericansForTheArts.org
Arts Facts . . . Private Sector Philanthropy
Giving to the arts by individuals, foundations, and
corporations grew 12.6% to $21.64 billion in 2019
(+10.6% when adjusted for inflation) and represented
4.8% of all charitable giving.
• In 2019, private sector giving to the arts, culture, and humanities—by individuals, foundations,
and corporations—was $21.64 billion, up 12.6% from a revised $19.21 billion in 2018. When
adjusted for inflation, this represents a 10.6% increase.
• As a percentage of all charitable giving, the arts held relatively steady at 4.8%. Maintaining a
strong and steady share of overall philanthropy demonstrates relevance of the arts sector. Even small
fluctuations in the share of total philanthropy have significant financial implications.
• Private contributions to all charities were up 4.2% in 2019 (+2.4% when adjusted for inflation)
reaching $449.64 billion. Total giving by corporations giving soared 13.4% to $21.09 billion and
foundations increased 2.5% to $75.69 billion. Individual giving rebounded with a 4.7% increase to
$309.66 billion, following a decrease in 2018 (-2.3%).
Source: Giving USA: The Annual Report on Philanthropy for the Year 2019. Giving USA Foundation, June 2020.

www.AmericansForTheArts.org
Arts Facts . . . Arts Organization Revenues
Revenue from earned income is the largest source
of income for nonprofit arts organizations. The
remainder must be raised through contributions
and grants. Even small fluctuations in contributed
revenue can mean deficits for many organizations.
Support for the nonprofit arts is a mosaic of funding sources—a delicate 60-30-10 balance of earned
revenue, private sector contributions, and government support. The chart above provides a snapshot
of the revenue picture for a typical nonprofit arts and culture organization in the U.S. Considering that
there are approximately 120,000 such organizations, including public sector ones, the revenue picture
for individual organizations can vary widely. These estimates are pre-COVID19 pandemic.
1. Earned income (60%) represents a little over half of the total revenue pie and includes ticket
sales, sponsorships, fundraising events, and investment and endowment income.
2. Private sector (30%) contributions (individual, foundation, and corporate giving) are the second
largest portion of the revenue pie. The largest segment is comprised of individuals.
3. Government funding (10%)—local, state, and federal—is the smallest of the three revenue
categories, yet is a vital lever in generating private sector contributions. Note that total federal
arts support is not limited to the National Endowment for the Arts. It also includes the Kennedy
Center, Smithsonian Institution, Corporation for Public Broadcasting, and even arts
programming within the agencies such as the U.S. Departments of Justice and Education. Local
and state governments have similarly diverse sources of arts funding.
Source: Estimate by Americans for the Arts based on analyses of federal and industry association data. 2020.

3%
94%
4%
83%
12%
91%
45%
89%
Dance Music Drama/Theatre Visual Arts
Pe
rce
nta
ge o
f Sc
ho
ols
Off
erin
g In
stru
ctio
n in
th
e A
rts
Uneven Arts Education Opportunities Nationwide
Elementary Secondary