1(0) - Cornell Food and Nutrition Policy Program - Cornell University
51
Transcript of 1(0) - Cornell Food and Nutrition Policy Program - Cornell University

ISSN 1936-5071

The Cornel 1 Food and N u t r i t i o n Pol i c y Program (CFNPP) was c rea ted i n 1988 w i t h i n t h e D i v i s i o n o f N u t r i t i o n a l Sciences, C o l l ege o f Human Ecology, Co rne l l U n i v e r s i t y , t o under take research, t r a i n i n g , and t e c h n i c a l ass i s t ance i n food and n u t r i t i o n p o l i c y w i t h emphasis on deve lop ing c o u n t r i e s .
CFNPP i s served by an adv i so r y committee o f f a c u l t y f rom t h e D i v i s i o n o f N u t r i t i o n a l Sciences, Col l ege o f Human Ecology; t h e Departments o f A g r i c u l t u r a l Economics, N u t r i t i o n , C i t y and Regional Planning, Rural Soc io logy; and f rom t h e Cornel 1 I n s t i t u t e f o r I n t e r n a t i o n a l Food, A g r i c u l t u r e and Development. Graduate s tuden ts and f a c u l t y f rom these u n i t s sometimes c o l l a b o r a t e w i t h CFNPP on s p e c i f i c p r o j e c t s . The CFNPP p ro fess i ona l s t a f f i n c l u d e s n u t r i t i o n i s t s , economists, and a n t h r o p o l o g i s t s .
CFNPP i s funded by severa l donors i n c l u d i n g t h e Agency f o r I n t e r n a t i o n a l Development, t h e World Bank, UNICEF, t h e Pew Memorial T rus t , t h e Rocke fe l l e r and Ford Foundat ions, The Carnegie Corporat ion, The Thrasher Research Fund, and i n d i v i d u a l coun t r y governments.
@ 1992 Cornel 1 Food and N u t r i t i o n Pol i c y Program ISBN 1-56401-130-5
Th i s Working Paper s e r i e s p rov ides a v e h i c l e f o r r a p i d and i n f o r m a l r e p o r t i n g o f r e s u l t s f rom CFNPP research. Some o f t h e f i n d i n g s may be p r e l i m i n a r y and s u b j e c t t o f u r t h e r a n a l y s i s .
Th i s document was word processed by Marn ie Ful t on . The manuscr ip t was e d i t e d by E l i z a b e t h Mercado. The t e x t was fo rmat ted by Gaudencio Dizon. The cover was produced by Jake Smith.
For i n f o r m a t i o n about o r d e r i n g t h i s manuscr ip t and o t h e r work ing papers i n t h e s e r i e s con tac t :
CFNPP P u b l i c a t i o n s Department 1400 16 th S t r e e t NM, S u i t e 420
Washi ngton, DC 20036 202-822-6500
308 Savage Hal 1 Cornel 1 U n i v e r s i t y
I thaca , NY 14853 607-255-8093

CONTENTS
LIST OF TABLES
LIST OF APPENDIX TABLES
LIST OF FIGURES
ABBREVIATIONS
FOREWORD
INTRODUCTION
THE VILLAGE AND THE DATA SET
ECONOMETRIC ISSUES
Two L i m i t T o b i t Model D iagnos t i c Tests
A FORMAL MODEL FOR ESTIMATION
EMPIRICAL RESULTS
Toward a General Speci f i c a t i on Extens ions
T e s t i n g f o r Gender-Based D i f f e r e n c e s i n PR E f f e c t s V a r i a t i o n s o f Household Composi t ion and Land
Owners h i p Va r i ab l es N u t r i t i o n E f f e c t s Age E f f e c t s
CONCLUSION
Appendix A - D e f i n i t i o n o f Var iables Appendix B - Frequencies and Summary S t a t i s t i c s Appendix C - An LM Test f o r Heteroscedasti c i t y
v i i
REFERENCES

LIST OF TABLES
Summary S t a t i s t i c s f o r Important Var iab les Used i n t h e Ana lys is
Toward a General Speci f i c a t i on
Tes t i ng f o r Gender-Based D i f fe rences
Va r ia t i ons o f Household Composition E f f e c t s
Va r ia t i ons o f N u t r i t i o n a l Consumption E f f e c t on P a r t i c i p a t i o n Rates
Age E f f e c t s on P a r t i c i p a t i o n Rate o f I n d i v i d u a l s
LIST OF APPENDIX TABLES
Frequency o f Occupational Categori es
Median Values o f Main Var iab les
Summary S t a t i s t i c s o f Person-Specif ic Var iab les
Summary S t a t i s t i c s o f Househol d-Speci f i c Var iab les

LIST OF FIGURES
1 - Histogram o f P a r t i c i p a t i o n Rates ~
2 - The Two L i m i t Tob i t Model
3 - Hypothesized Nonl i nea r Re la t ionsh ip o f Age o r N u t r i t i o n w i t h PR

A B B R E V I A T I O N S
EWT
I R H S
L L
LM
L R
M L
0 L S
PR
RDA
E f f i c i e n c y wage t h e o r i e s
I n s t i t u t e f o r Rura l H e a l t h S t u d i e s
Log 1 i k e l i hood
Lagrange mu1 t i p l i e r
L i k e l i hood r a t i o
Maximum l i k e l i h o o d
O r d i n a r y l e a s t squares
P a r t i c i p a t i o n r a t e s
Requ i red d i e t a r y a l l owance
FOREWORD
The inc reased ava i 1 a b i 1 i t y o f 1 arge da ta s e t s f o r many devel o p i ng c o u n t r i e s has brought w i t h i t new s t a t i s t i c a l and econometr ic cha l lenges . These cha l lenges a re n o t o n l y t o use e x i s t i n g techniques c o r r e c t l y , b u t a l s o t o develop new methods t o a c c u r a t e l y deal w i t h t h e problems o f , and ques t ions posed by, researchers and po l icymakers. Th i s s tudy shows how t h e a p p r o p r i a t e da ta se t , combined w i t h t h e 1 abor ious process o f c o n s t r u c t i n g s p e c i f i c models and r e l a t e d d i a g n o s t i c checks, pays o f f i n t h e c r e a t i o n o f unbiased and r o b u s t es t imato rs , which i s necessary f o r meaningfu l p o l i c y s t u d i e s .
I n p a r t i c u l a r , t h i s paper takes up t h e i s s u e o f "X -e f f i c i ency , " which was o r i g i n a l l y r a i s e d almost f o u r decades ago i n r e l a t i o n t o deve lop ing coun t r i es , and t r i e s t o shed l i g h t on t h e l i n k between e f f i c i e n c y o f workers and t h e i r n u t r i t i o n a l s t a t u s . The l a c k o f v a r i a t i o n i n t h e wage da ta f rom most surveys has h indered t h e s tudy o f t h i s r e l a t i o n s h i p and hence t h e p o l i c y p r e s c r i p t i o n s r e s u l t i n g f rom many o f these p rev ious s tud ies . The au tho r shows how t h e s l a c k season p a r t i c i p a t i o n r a t e o f workers i n a demand-constrained economy can be r e l a t e d t o t h e i r i n d i v i d u a l and household c h a r a c t e r i s t i c s t o shed l i g h t on t h e p r o p o s i t i o n s about e f f i c i e n c y o f workers developed i n t h e e f f i c i e n c y wage l i t e r a t u r e . The unique c h a r a c t e r i s t i c s o f t h e da ta s e t used f o r t h i s s tudy necess i t a t ed t h e use o f a Two L i m i t T o b i t Model f o r e m p i r i c a l e s t i m a t i o n and hypo thes is t e s t i n g . I n o r d e r t o t e s t t h e e f f i c a c y o f t h e model, t h e au tho r c o n s t r u c t s and implements a Lagrange M u l t i p l i e r t e s t t o check f o r he te ros - c e d a s t i c i t y . The L i k e l i h o o d R a t i o t e s t i s used t o t e s t a l t e r n a t i v e s p e c i f i c a t i o n s . The f i n d i n g s correspond t o t h e 1 i t e r a t u r e on r u r a l 1 abor markets o f deve lop ing c o u n t r i e s , and especi a1 l y w i t h t h e p r o p o s i t i o n s o f e f f i c i e n c y wage theory . The au tho r a l s o p o i n t s o u t t h a t t h e undernour ished poor a r e caught i n a v i c i o u s cyc le : employers a re l e s s w i l l i n g t o h i r e undernour ished workers, so t hey remain undernour ished. Some ex te rna l ass i s t ance i s needed t o p r o v i d e nour ishment t o enable these workers t o g e t back i n t o t h e l a b o r market. Hence, t h e s tudy shows t h a t i n o r d e r f o r t h e s t a t e t o h e l p a l l e v i a t e pover ty , i t must f i r s t he1 p poor workers meet t h e i r bas i c n u t r i t i o n a l requ i rements t o enable them t o compete i n t h e l a b o r market. The s tudy a l s o demonstrates t h e e f f i c i e n t a p p l i c a t i o n o f e x i s t i n g t o o l s t o use a v a i l a b l e da ta t o examine t h e complex r e l a t i o n s h i p s w i t h i n t h e l a b o r market.
Washington, DC June 1992
David E. Sahn D i r e c t o r , CFNPP

1. INTRODUCTION
Because the wage var ia t ions in rural labor markets a re too 1 imi ted t o o f fe r su f f i c i en t incentive t o e f f i c i e n t workers, employers resor t t o nonwage mechani sins and other re la ted quanti ty rat ioning mechanisms t o provide incentives. We can use the number of hours of employment t ha t a worker obtains in a demand- constrained, surplus labor market as a proxy f o r his or her eff ic iency. In general, a p ro f i t maximizing employer, both under perfect competition and monopsonistic conditions, would employ only the e f f i c i e n t workers in the slack season, when the demand f o r labor i s low while labor supply i s in surplus (see Canagarajah 1991). T h u s , those workers who are employed in a s lack, demand- constrained season woul d reveal thei r re1 a t i ve work eff ic iency, and the corresponding preference shown toward them by the employers. T h u s , par t ic ipat ion r a t e (PR) of workers i s bound t o reveal the r e l a t i ve eff ic iency of workers. Studies in rural labor markets in the past provide incontrover t ib le evidence of the presence of the above mentioned features (see Rudra 1982; Dreze and Mukherjee 1987; Bharadwaj 1974).
The objective of the present paper i s t o r e l a t e par t ic ipat ion r a t e d i rec t ly t o charac te r i s t i cs of workers and indirect ly t o some of the propositions established i n eff iciency wage l i t e r a tu r e . ' Although we do not s e t out t o formally t e s t ef f ic iency wage propositions, we a re able t o make substantial progress in making sense of most of them through analyzing par t ic ipat ion r a t e of workers in re1 a t i on t o thei r characteri s t i e s .
The present paper i s organized as follows. In the next section the v i 1 lage and the data s e t used in the analysis are introduced. The t h i rd section deals with the important econometric issues, such as the features of the chosen econometric model and the re la ted diagnostic t e s t s . The fourth section presents an out l ine of a simple theoretical model t ha t serves as a motivation fo r the empirical analys is tha t follows i t . In the f i f t h section the r e su l t s of the empi r i cal investigation are presented and t h e i r imp1 i cations in understanding efficiency of workers in terms of t h e i r personal and household charac te r i s t i cs are discussed. The f inal section summarizes the main findings.
1 A good survey on efficiency wage models i s described by Akerl of and Yel len (1986). For a discussion on eff ic iency wage theor ies , which a re relevant f o r developing country rural labor markets, see Canagarajah (1991).
2. THE VILLAGE AND THE DATA SET
We use information from t h e South Indian v i l l a g e of Dokur, which i s s i t u a t e d in t h e Mahbubnagar D i s t r i c t i n t h e S t a t e of Andhra Pradesh. The v i l l a g e has a population of around 4,000 people who a r e mainly involved i n a g r i c u l t u r a l a c t i v i t i e s . I t sha res c u l t u r a l and soc ia l c h a r a c t e r i s t i c s with o t h e r Indian v i l l a g e s : the c a s t e hierarchy plays an important r o l e in deciding t h e economic s t a t u s and a c t i v i t y of i nd iv idua l s . Hence Reddies, who a r e farming c a s t e , cont ro l most of t h e land, while Hari jans, who a r e t h e lowest c a s t e , a r e mostly 1 and1 e s s 1 aborers
The I n s t i t u t e f o r Rural Health S tudies (IRHS) conducted a survey from April 1982 t o March 1983 f o r 52 weeks, co l l e c t i ng information on household composition, a s s e t ownership, l abor fo rce p a r t i c i p a t i o n , hea l th records , n u t r i t i o n a l consumption, income and expenditure flows, and anthropometric va r i ab le s on 349 individual s from 40 sample households. Of these , 172 ind iv idua l s were i d e n t i f i e d a s a c t i v e l y p a r t i c i p a t i n g in t h e a g r i c u l t u r a l labor market. Hence t h i s i s a r i c h da ta s e t f o r analyzing t h e p a r t i c i p a t i o n behavior of workers in t h e context of t h e i r personal and household c h a r a c t e r i s t i c s . For purposes of t h i s ana lys i s , t h e 52 consecutive weeks a r e divided i n t o peak and s lack seasons of t h e a g r i c u l t u r a l a c t i v i t i e s of t h i s v i l l a g e . Thus, weeks 1 through 11 and 46 through 52 represent t h e s l ack season giving a t o t a l of 16 weeks of l abor fo rce p a r t i c i p a t i o n information. This information i s very useful f o r s tudying t h e p a r t i c i p a t i o n behavior of workers t o understand t h e i r underlying e f f i c i e n c y . We de f ine the average worker p a r t i c i p a t i o n r a t e by t h e average number of days each individual worked, of t h e t o t a l number of days avai 1 ab le i n t h e season, which i s used a s t h e dependent v a r i a b l e i n t h e ana lys i s . Thus, lack of p a r t i c i p a t i o n due t o s ickness i s a l s o used t o i n d i c a t e l e s s e f f i c i e n c y . 3
We genera te person-speci f i c and househol d-speci f i c v a r i a b l e s f o r each individual and have i n d i c a t o r s of t hese f o r peak and s l ack season wherever poss ib le and meani ngful . Person-speci f i c vari abl e s i ncl ude age, gender, wage income, k i l o c a l o r i e consumption of food a s a percentage of individual ' s requirement, and anthropometric i n d i c a t o r s such a s weight, he ight , wei ght-for- he ight , and arm c i rcumference. Household-speci f i c var iab l e s i ncl ude per c a p i t a landholding, family s i z e , number of ch i ld ren , number of working members, and t h e
The i n t e r e s t e d reader i s r e fe r r ed t o Canagarajah (1991) f o r more d e t a i l on t h e v i l l a g e c h a r a c t e r i s t i c s and t h e da ta s e t used in t h i s paper.
This i s i n l i n e with the explanat ion t h a t i l l n e s s i s a r e s u l t of lower r e s i s t a n c e , which i s a r e s u l t of low pas t p a r t i c i p a t i o n and wage income (see Behrman e t 31. 1988).
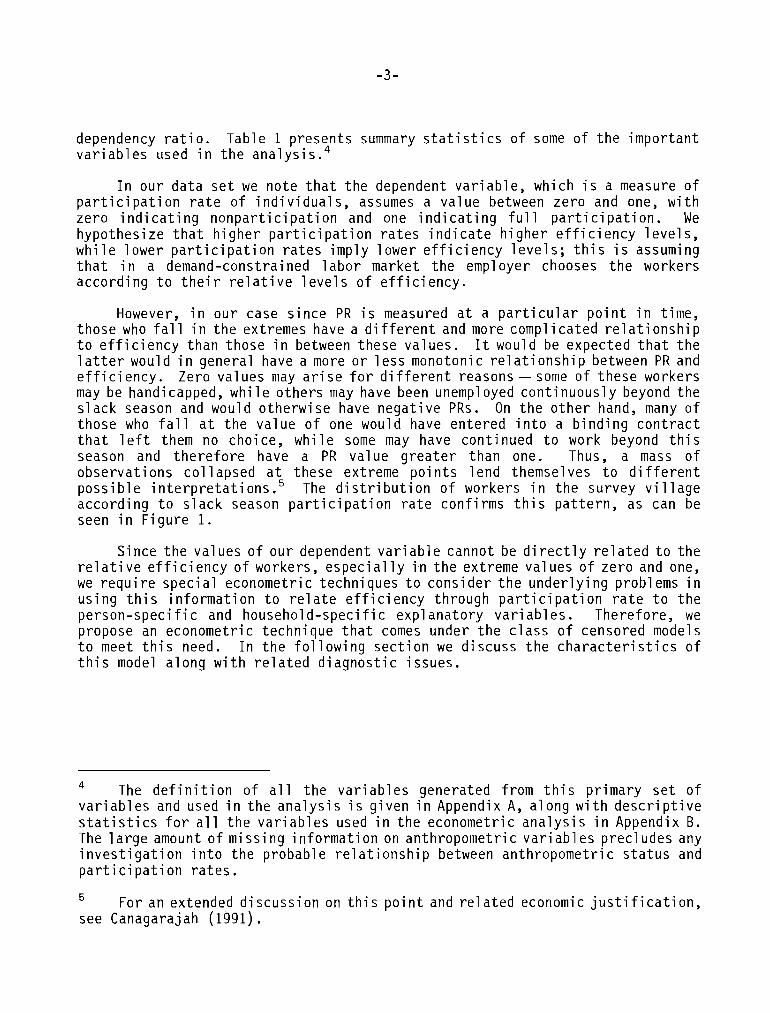
dependency r a t i o . Tab le 1 p r e s e n t s summary s t a t i s t i c s o f some o f t h e i m p o r t a n t v a r i a b l e s used i n t h e a n a l y s i s . 4
I n o u r d a t a s e t we n o t e t h a t t h e dependent v a r i a b l e , wh ich i s a measure o f p a r t i c i p a t i o n r a t e o f i n d i v i d u a l s , assumes a v a l u e between z e r o and one, w i t h z e r o i n d i c a t i n g n o n p a r t i c i p a t i o n and one i n d i c a t i n g f u l l p a r t i c i p a t i o n . We h y p o t h e s i z e t h a t h i g h e r p a r t i c i p a t i o n r a t e s i n d i c a t e h i g h e r e f f i c i e n c y l e v e l s , w h i l e l o w e r p a r t i c i p a t i o n r a t e s i m p l y 1 ower e f f i c i e n c y l e v e l s ; t h i s i s assuming t h a t i n a demand-constra ined l a b o r market t h e employer chooses t h e worke rs a c c o r d i n g t o t h e i r r e 1 a t i v e 1 eve1 s o f e f f i c i e n c y .
However, i n o u r case s i n c e PR i s measured a t a p a r t i c u l a r p o i n t i n t ime, those who f a 1 1 i n t h e extremes have a d i f f e r e n t and more c o m p l i c a t e d r e l a t i o n s h i p t o e f f i c i e n c y t h a n those i n between these va lues . It would be expected t h a t t h e l a t t e r would i n genera l have a more o r l e s s monotonic r e l a t i o n s h i p between PR and e f f i c i e n c y . Zero va lues may a r i s e f o r d i f f e r e n t reasons - some o f t h e s e workers may be handicapped, w h i l e o t h e r s may have been unemployed c o n t i n u o u s l y beyond t h e s l a c k season and would o t h e r w i s e have n e g a t i v e PRs. On t h e o t h e r hand, many o f those who f a l l a t t h e v a l u e o f one would have e n t e r e d i n t o a b i n d i n g c o n t r a c t t h a t l e f t them no cho ice , w h i l e some may have c o n t i n u e d t o work beyond t h i s season and t h e r e f o r e have a PR v a l u e g r e a t e r t h a n one. Thus, a mass o f o b s e r v a t i o n s c o l 1 apsed a t these extreme p o i n t s 1 end themsel ves t o d i f f e r e n t p o s s i b l e i n t e r p r e t a t i o n s .5 The d i s t r i b u t i o n o f workers i n t h e su rvey v i 1 l a g e a c c o r d i n g t o s l a c k season p a r t i c i p a t i o n r a t e c o n f i r m s t h i s p a t t e r n , as can be seen i n F i g u r e 1.
S ince t h e va lues o f o u r dependent v a r i a b l e cannot be d i r e c t l y r e l a t e d t o t h e r e l a t i v e e f f i c i e n c y o f workers , e s p e c i a l l y i n t h e extreme va lues o f z e r o and one, we r e q u i r e s p e c i a l econometr ic techn iques t o c o n s i d e r t h e u n d e r l y i ng p r o b l ems i n u s i n g t h i s i n f o r m a t i o n t o r e l a t e e f f i c i e n c y t h r o u g h p a r t i c i p a t i o n r a t e t o t h e person-spec i f i c and househol d -spec i f i c e x p l a n a t o r y v a r i a b l e s . There fo re , we propose an econometr ic t e c h n i q u e t h a t comes under t h e c l a s s o f censored models t o meet t h i s need. I n t h e f o l l o w i n g s e c t i o n we d i s c u s s t h e c h a r a c t e r i s t i c s o f t h i s model a l o n g w i t h r e l a t e d d i a g n o s t i c i s s u e s .
The d e f i n i t i o n o f a l l t h e v a r i a b l e s genera ted f r o m t h i s p r i m a r y s e t o f v a r i a b l e s and used i n t h e a n a l y s i s i s g i v e n i n Appendix A, a l o n g w i t h d e s c r i p t i v e s t a t i s t i c s f o r a l l t h e v a r i a b l e s used i n t h e econometr ic a n a l y s i s i n Appendix B. The 1 a rge amount o f m i s s i n g i n f o r m a t i o n on an th ropomet r i c v a r i a b l es p r e c l udes any i n v e s t i g a t i o n i n t o t h e p robab le r e l a t i o n s h i p between a n t h r o p o m e t r i c s t a t u s and p a r t i c i p a t i o n r a t e s .
Fo r an extended d i s c u s s i o n on t h i s p o i n t and r e l a t e d economic j u s t i f i c a t i o n , see Canagarajah (1991).

Table 1 - Dokur: Summary S t a t i s t i c s f o r Important Variables Used i n t h e Analysis
Variables Mean Standard Dev ia t ion
P a r t i c i p a t i o n r a t e
Nutr i t ion
A r m circumference
Weight-for-height
Age i n yea r s
Household s i z e
No. of ch i ld ren
Dependency r a t i o
Nucl e a r fami 1 y
Landhol d i ng
Per c a p i t a 1 andhol di ng
Wage income i n cash
Per c a p i t a income
Source: Author 's c a l c u l a t i o n s of IRHS data s e t .

-5-
Figure 1- Dokur: H is togram o f P a r t i c i p a t i o n Rates
0.2 0.4
Participation Rate
Source: A u t h o r ' s c a l c u l a t i o n s o f IRHS da ta s e t .
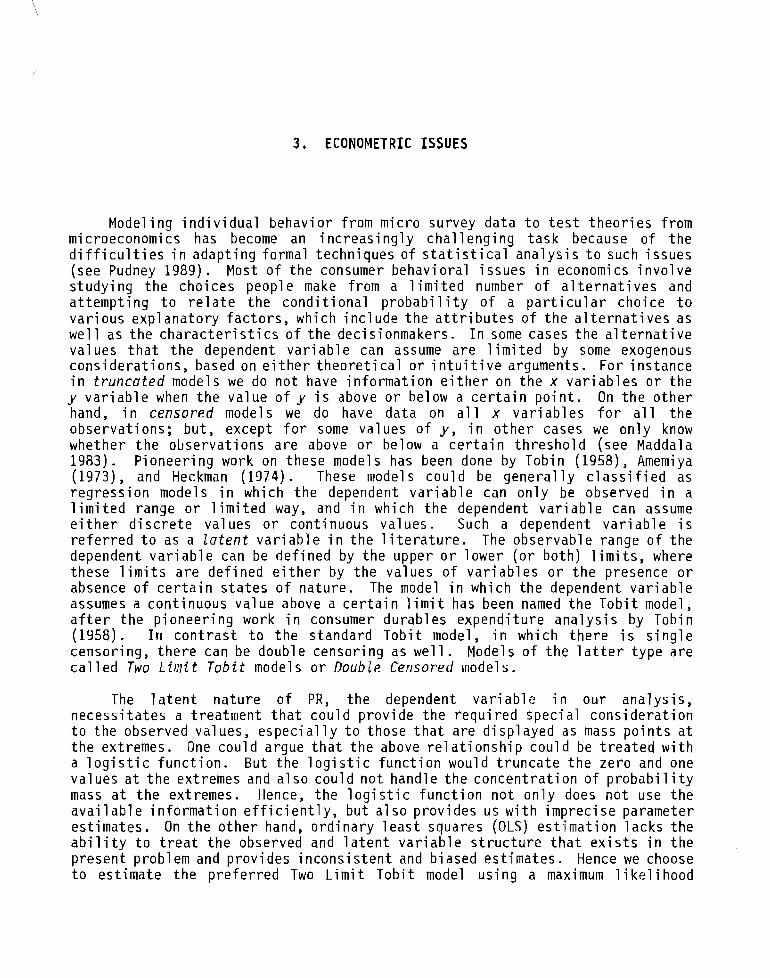
3 , ECONOMETRIC I S S U E S
Modeling individual behavior from micro survey data t o t e s t theor ies from microeconomics has become an increasingly challenging task because of the d i f f i c u l t i e s in adapting formal techniques of s t a t i s t i c a l analysis t o such issues (see Pudney 1989) . Most of the consumer behavioral issues in economics involve studying the choices people make from a limited number of a l t e rna t ives and attempting t o r e l a t e the conditional probabil i ty of a par t i cu la r choice t o various explanatory fac tors , which i nc1 ude the a t t r i b u t e s of the a1 t e rna t i ves as we1 1 as the charac te r i s t i cs of the decisionmakers. In some cases the a1 ternat ive values t ha t the dependent variable can assume a re limited by some exogenous considerations, based on e i t h e r theoretical o r i n tu i t i ve arguments. F o r instance i n truncated model s we do not have information e i t h e r on the x variables o r the y variable when the value of y i s above or below a cer ta in point. On the other hand* in censored models we do have data on a l l x variables f o r a l l the observations; but, except f o r some values of y , in other cases we only know whether the observations are above or below a cer ta in threshold (see Maddala 1983). Pioneering work on these models has been done by Tobin (1958), Ame~iiiya ( lW3) , and Heckman (1974). These models could be generally c l a s s i f i ed as regression models in which the dependent variable can only be observed in a limited range or limited way, and in which the dependent variable can assume e i t h e r d i sc re te values o r continuous values. Such a dependent variable i s referred t o as a la tent variable in the l i t e r a t u r e . The observable range of the dependent variable can be defined by the upper o r lower (or both) l imi t s , where these l im i t s are defined e i t h e r by the values of variables or the presence o r absence of ce r ta in s t a t e s of nature. The model in which the dependent variable assumes a continuous value above a cer ta in 1 imi t has been named the Tobit model, a f t e r the pioneering work in consumer durabl es expenditure analysi s by Tobi n (1958). In contras t t o the standard Tobit model* in which there i s s ingle censoring* there can be double censoring as we1 1. Models of the l a t t e r type are cal led Two limit Tobit models or Double Censored models.
The l a t en t nature of P R Y the dependent variable in our analysis , necess i ta tes a treatment t ha t could provide the required special consideration t o the observed values, especial ly t o those t ha t are displayed as mass points a t the extremes. One could argue t ha t the above re1 at ionship could be t reated with a l o g i s t i c function. B u t the l og i s t i c function would truncate the zero and one va1 ues a t the extremes and a1 so could not hand1 e the concentration of probabi 1 i ty mass a t the extremes. Hence* the l og i s t i c function not only does not use the avai lable information e f f i c i en t l y , b u t a1 so provides us with imprecise parameter estimates. On the other hand, ordinary l e a s t squares (OLS) estimation lacks the a b i l i t y t o t r e a t the observed and l a t en t variable s t ruc ture t ha t e x i s t s in the present probl em and provides inconsistent and bi ased est jmates. Hence we choose t o estimate the preferred Two Limit Tobit model using a maximum likelihood

estimation method in order t o es tab l i sh the re la t ionship between the par t ic ipat ion r a t e of workers and person-speci f i c and household-speci f i c explanatory vari ables.
The histogram in Figure 1 reveals t ha t a substant ia l number of individuals a r e a t the extremes with values of zero and one f o r PR. Thus, we censor a t values zero and one t o allow an analysis of the ef f ic iency of individuals without the d i s t o r t i on caused by mi sspeci f i ca t ion of the extreme values of the dependent variable. The s t a t i s t i c a l techniques re la t ing t o these models t o which we t u r n our a t t en t ion next a re discussed by Maddala (1983) and Pudney (1989).
TWO LIMIT TOBIT MODEL
Let us consider a model in which the dependent var iable i s observed and r e l a t e s t o the phenomena of i n t e r e s t only i f i t 1 i e s between the upper and lower l imi t s , namely, a, and a2, defined by some theoret ica l propositions. The model then becomes
where y* i s the l a t en t variable and u, i s the random e r r o r term, i .e . , u, - N ( 0 , 2). I f y, denotes the observed values of i n t e r e s t f o r the pa r t i cu la r phenomena under consideration, then
where and a, a r e determined based on some a pri or i reasoning . The 1 i kel i hood function f o r the model i s given by

where $ and 0 s i g n i f y t he d i s t r i b u t i o n and dens i t y func t ions , respec t i ve l y , o f t h e standard normal d i s t r i b u t i o n .
We can show diagrammatical l y t he var ious components o f t he 1 i ke l i hood f u n c t i o n t o be est imated and the l o g i c behind t h e Two L i m i t T o b i t model as depicted i n F igure 2 . As i n the standard T o b i t model, one can de r i ve the f i r s t and second d e r i v a t i v e s o f t he 1 og 1 i ke l i hood (he rea f te r LL) f u n c t i o n (see Maddal a 1983). The concav i ty o f t he LL and t h e r e f o r e the convergence o f t h e i t e r a t i v e maximum 1 i ke l i hood s o l u t i o n t o a cons is ten t and asymptomatical l y normal est imate can a l so be shown (see P r a t t 1981).
This model must be e us ing e i t h e r t h e e n t i r e produces b i ased and i ncon t h i s , f i r s t no te t h a t t h e
st imated us ing maximum 1 i ke l i hood methods s ince OLS, sample o r t he subsample o f complete observat ions,
s i s t e n t parameter est imates (Maddala 1983) .6 To see cond i t i ona l expectat ion expression f o r yi i s
and t h a t t h e uncond i t iona l expectat ion o f y, i s
Greene (1981) and Goldberger (1981) consider i n more d e t a i l t h e p rope r t i es o f t h e OLS es t imators i n T o b i t models i n t he spec ia l case when t h e explanatory va r iab les are mu1 t i v a r i a t e normal. However, t h i s assumption precludes the use o f dichotomous var iab les .

-9-
Figure 2 - Dokur: The Two L i m i t T o b i t Model
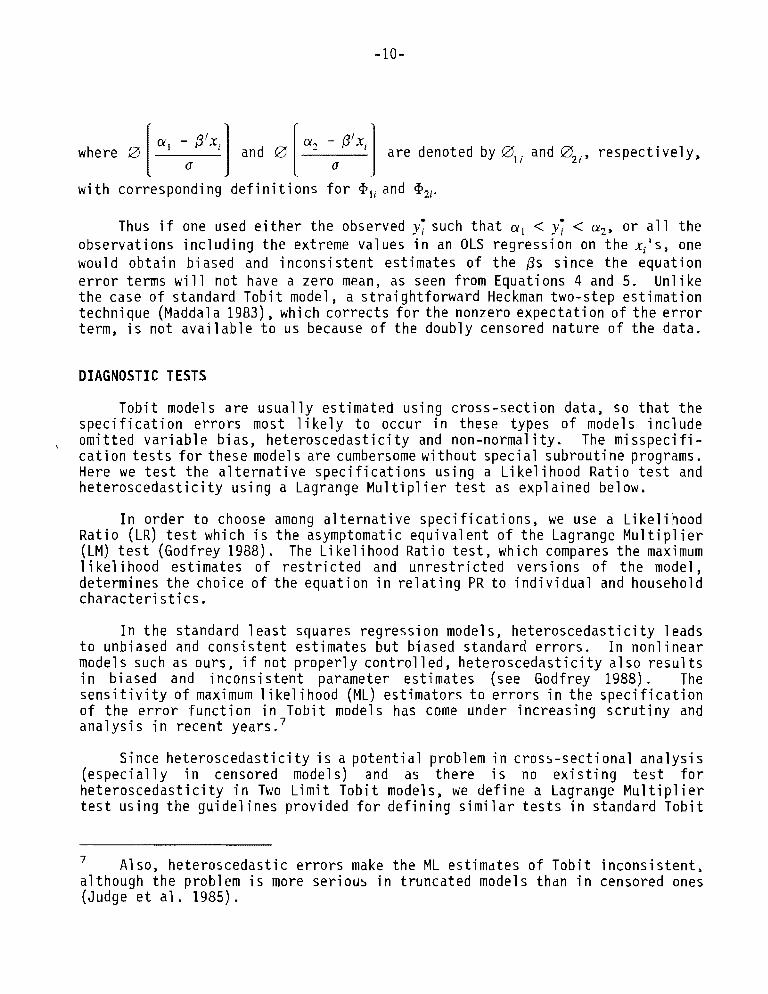
a-, - 13'x. where B and D [ ] a re denoted by DIi and B2,.$ r e s p e c t i v e l y ,
w i t h co r respond ing d e f i n i t i o n s f o r <EÈI and aã
Thus i f one used e i t h e r t h e observed y* such t h a t a; < y* < a,, o r a l l t h e observa t ions i n c l ud ing t h e extreme va l ues i n an OLS r e g r e s s i o n on t h e xiis, one would o b t a i n b iased and i n c o n s i s t e n t es t imates o f t h e 13s s i n c e t h e equa t ion e r r o r terms w i l l n o t have a ze ro mean, as seen f rom Equat ions 4 and 5. U n l i k e t h e case o f s tandard T o b i t model, a s t r a i g h t f o r w a r d Heckman two-s tep e s t i m a t i o n techn ique (Maddala 1983), which c o r r e c t s f o r t h e nonzero e x p e c t a t i o n o f t h e e r r o r term, i s n o t a v a i l a b l e t o us because o f t h e doubly censored n a t u r e o f t h e data.
DIAGNOSTIC TESTS
T o b i t models a r e u s u a l l y es t imated us i ng c ross - sec t i on data, so t h a t t h e s p e c i f i c a t i o n e r r o r s most l i k e l y t o occur i n these types o f models i n c l u d e
, om i t t ed v a r i a b l e b ias , h e t e r o s c e d a s t i c i t y and non-normal i ty. The m i s s p e c i f i - c a t i o n t e s t s f o r these models a r e cumbersome w i t h o u t spec ia l sub rou t i ne programs. Here we t e s t t h e a l t e r n a t i v e s p e c i f i c a t i o n s us i ng a L i k e l i h o o d R a t i o t e s t and h e t e r o s c e d a s t i c i t y us i ng a Lagrange Mu1 t i p 1 i e r t e s t as exp l a ined below.
I n o r d e r t o choose among a1 t e r n a t i ve s p e c i f i c a t i o n s , we use a L i k e l i hood R a t i o (LR) t e s t which i s t h e asymptomatic equ i va l en t o f t h e Lagrange M u l t i p l i e r (LM) t e s t (Godfrey 1988). The L i k e l i hood R a t i o t e s t , which compares t h e maximum l i k e l i h o o d es t imates o f r e s t r i c t e d and u n r e s t r i c t e d ve rs i ons o f t h e model, determines t h e cho ice o f t h e equa t ion i n r e l a t i n g PR t o i n d i v i d u a l and household c h a r a c t e r i s t i c s .
I n t h e s tandard l e a s t squares r eg ress i on models, h e t e r o s c e d a s t i c i t y leads t o unbiased and c o n s i s t e n t es t imates b u t b iased s tandard e r r o r s . I n n o n l i n e a r model s such as ours, i f n o t p r o p e r l y c o n t r o l l ed , h e t e r o s c e d a s t i c i t y a1 so r e s u l t s i n b iased and i n c o n s i s t e n t parameter es t imates (see Godfrey 1988). The s e n s i t i v i t y o f maximum l i k e l i hood (ML) e s t i m a t o r s t o e r r o r s i n t h e s p e c i f i c a t i o n o f t h e e r r o r f u n c t i o n i n T o b i t models has come under i n c r e a s i n g s c r u t i n y and a n a l y s i s i n r e c e n t years . 7
S ince h e t e r o s c e d a s t i c i t y i s a p o t e n t i a1 problem i n c ross - sec t i ona l a n a l y s i s ( e s p e c i a l l y i n censored models) and as t h e r e i s no e x i s t i n g t e s t f o r h e t e r o s c e d a s t i c i t y i n Two L i m i t T o b i t models, we de f i ne a Lagrange M u l t i p l i e r t e s t us i ng t h e guide1 i n e s p rov ided f o r d e f i n i n g s i m i l a r t e s t s i n s tandard T o b i t
' Also, he te roscedas t i c e r r o r s make t h e ML es t imates o f T o b i t i n c o n s i s t e n t , a l t hough t h e prob lem i s more se r i ous i n t r unca ted models than i n censored ones (Judge e t a1. 1985).

models. We d i scuss t h e na tu re o f t h e problem o f h e t e r o s c e d a s t i c i t y , a1 ong w i t h t h e d e t a i l s o f t h e c o n s t r u c t i o n o f t h e t e s t s t a t i s t i c , i n Appendix C. Th i s t e s t i s a p p l i e d t o t h e models es t imated i n t h i s paper. F i n a l l y , i t i s wo r t h n o t i n g t h a t r a t h e r d i f f i c u l t t e s t s have been d e r i v e d f o r non-normal i t y by Jarque and Bera ( l98Z) , and f o r m i s s p e c i f i c a t i o n by Nelson (1981), i n t h e c o n t e x t o f s tandard T o b i t models. I f such t e s t s were developed and conducted i n t h e case o f t h e Two L i m i t T o b i t model then t h i s would i nc rease t h e robustness o f ou r es t imates .
4 . A FORMAL MODEL FOR E S T I M A T I O N
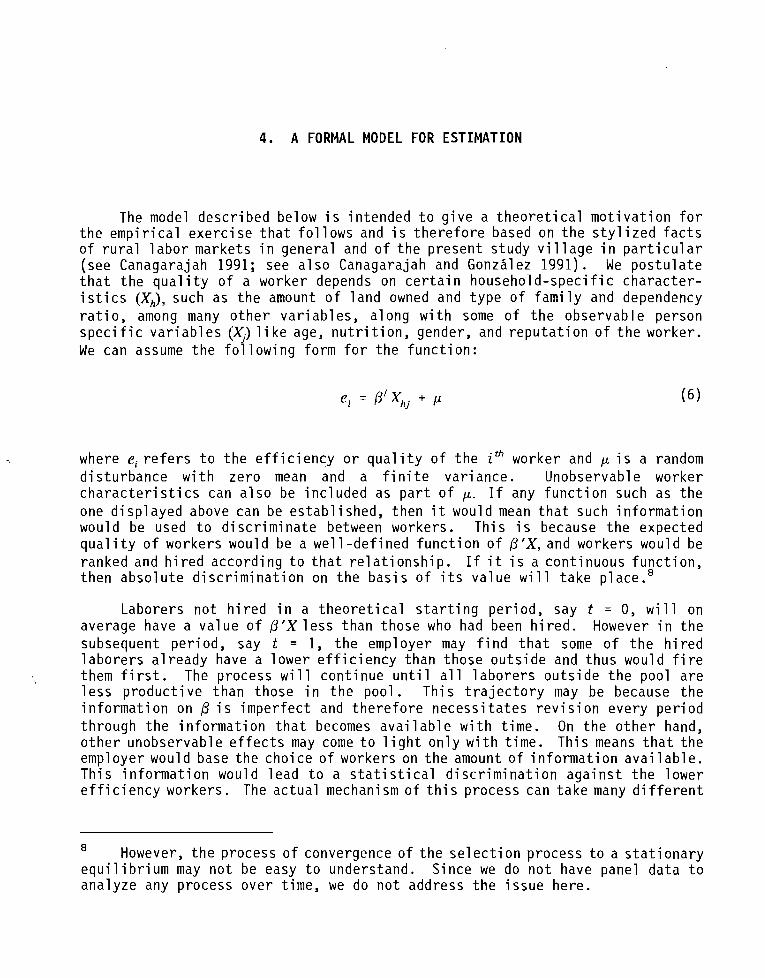
The model d e s c r i b e d below i s i n t e n d e d t o g i v e a t h e o r e t i c a l m o t i v a t i o n f o r t h e e m p i r i c a l e x e r c i s e t h a t f o l l o w s and i s t h e r e f o r e based on t h e s t y 1 i z e d f a c t s o f r u r a l l a b o r marke ts i n genera l and o f t h e p r e s e n t s t u d y v i 1 l a g e i n p a r t i c u l a r (see Canagarajah 1991; see a l s o Canagarajah and G o n z i l e z 1991). We p o s t u l a t e t h a t t h e q u a l i t y o f a worker depends on c e r t a i n h o u s e h o l d - s p e c i f i c c h a r a c t e r - i s t i c s (X,,), such as t h e amount of l a n d owned and t y p e o f f a m i l y and dependency r a t i o , among many o t h e r v a r i a b l e s , a l o n g w i t h some o f t h e observab le person s p e c i f i c v a r i a b l e s (Xj) 1 i ke age, n u t r i t i o n , gender, and r e p u t a t i o n o f t h e worker . We can assume t h e f o l l o w i n g f o r m f o r t h e f u n c t i o n :
where e, r e f e r s t o t h e e f f i c i e n c y o r q u a l i t y o f t h e i th worker and p. i s a random d i s t u r b a n c e w i t h z e r o mean and a f i n i t e v a r i a n c e . Unobservable worker c h a r a c t e r i s t i c s can a l s o be i n c l u d e d as p a r t of p. I f any f u n c t i o n such as t h e one d i s p l a y e d above can be e s t a b l i s h e d , t h e n i t would mean t h a t such i n f o r m a t i o n would be used t o d i s c r i m i n a t e between workers . T h i s i s because t h e expected qua1 i t y o f worke rs would be a we1 1 - d e f i n e d f u n c t i o n o f fl'X, and workers would be ranked and h i r e d a c c o r d i n g t o t h a t r e l a t i o n s h i p . I f i t i s a c o n t i n u o u s f u n c t i o n , t h e n a b s o l u t e d i s c r i m i n a t i o n on t h e b a s i s o f i t s v a l u e wi 11 t a k e place. '
Labore rs n o t h i r e d i n a t h e o r e t i c a l s t a r t i n g p e r i o d , say t = 0, w i l l on average have a v a l u e o f f l l X l e s s than those who had been h i r e d . However i n t h e subsequent p e r i o d , say t = 1, t h e employer may f i n d t h a t some o f t h e h i r e d l a b o r e r s a l r e a d y have a l o w e r e f f i c i e n c y than those o u t s i d e and t h u s would f i r e them f i r s t . The p rocess w i l l c o n t i n u e u n t i l a l l l a b o r e r s o u t s i d e t h e poo l a r e l e s s p r o d u c t i v e t h a n those i n t h e p o o l . T h i s t r a j e c t o r y may be because t h e i n f o r m a t i o n on 6 i s i m p e r f e c t and t h e r e f o r e n e c e s s i t a t e s r e v i s i o n e v e r y p e r i o d t h r o u g h t h e i n f o r m a t i o n t h a t becomes a v a i l a b l e w i t h t i m e . On t h e o t h e r hand, o t h e r unobservab le e f f e c t s may come t o l i g h t o n l y w i t h t i m e . T h i s means t h a t t h e employer would base t h e c h o i c e o f workers on t h e amount o f i n f o r m a t i o n a v a i 1 a b l e . T h i s i n f o r m a t i o n would l e a d t o a s t a t i s t i c a l d i s c r i m i n a t i o n a g a i n s t t h e l o w e r e f f i c i e n c y workers . The a c t u a l mechanism o f t h i s process can t a k e many d i f f e r e n t
However, t h e process of convergence of t h e s e l e c t i o n process t o a s t a t i o n a r y e q u i l i b r i u m may n o t be easy t o unders tand. S ince we do n o t have panel d a t a t o ana lyze any p rocess o v e r t ime, we do n o t address t h e i s s u e here .

paths. It i s t h i s process t h a t we want t o understand and we t h e r e f o r e use t h e PR o f workers, which i n r e a l i t y should revea l t h e r e l a t i o n s h i p between t h e observed c h a r a c t e r i s t i c s o f workers and t h e op t ima l d e c i s i o n s o f employers. An impo r tan t advantage o f t h e method adopted here i s t h a t we a r e a b l e t o cons ide r t h e work e f f i c i e n c y o f t h e se l f -employed and own farmers as w e l l , s i n c e we a re u s i n g PR as opposed t o wage r a t e s i n de te rmin ing worker e f f i c i e n c y .
The ongoing research on e f f i c i e n c y wage t h e o r i e s (EWT) has y i e l d e d a p l e t h o r a o f r e s u l t s t h a t i d e n t i f y v a r i a b l e s t h a t determine and i n f l u e n c e t h e work e f f i c i e n c y o f i n d i v i d u a l s . One can b road l y c l a s s i f y these v a r i a b l e s as person- s p e c i f i c and househo ld - spec i f i c . By r e l a t i n g these v a r i a b l e s t o t h e s l a c k season p a r t i c i p a t i o n r a t e of workers we would be a b l e t o g e t a b e t t e r unders tand ing of t h e r e1 a t i onshi p between worker c h a r a c t e r i s t i e s and worker e f f i c i e n c y . The nex t s e c t i o n p resen t s t h e r e s u l t s o f t h i s i n v e s t i g a t i o n .

5 . E M P I R I C A L RESULTS
In t h e following empirical s ec t ion a general -to-speci f i c modeling techniqueQ i s used in cons t ruc t ing a very general model based on economic and s t a t i s t i c a l c r i t e r i a . We begin with a general model incorpora t ing t h e main person-speci f i c and househol d-speci f i c va r i ab les . Here we a1 so t e s t various combinations of occupational dummies in order t o determine t h e ones t h a t should e n t e r t h e general s p e c i f i c a t i o n a1 ong with some of the important person-speci f i c and household-specific va r i ab les . Then we proceed t o extend t h e prefer red s p e c i f i c a t i o n i n many d i f f e r e n t ways. I n i t i a l l y , t h e prefer red s p e c i f i c a t i o n i s t e s t e d t o see whether males and females have d i f f e r e n t variances f o r the prefer red s p e c i f i c a t i o n by d iv id ing t h e sample on t h e bas i s of gender. Next we t r y t o incorpora te various combinations of household composition e f f e c t s , not included in t h e general model, which a r e s i g n i f i c a n t and economical l y meaningful i n understanding t h e work e f f i c i ency of indiv iduals . Then we turn t o t h e individual - s p e c i f i c e f f e c t s , such a s age and n u t r i t i o n . Since n u t r i t i o n i s hypothesized t o have a nonl inea r r e l a t ionsh ip with worker e f f i c i e n c y (and the re fo re i n our framework with p a r t i c i p a t i o n r a t e s ) in t h e n u t r i t i o n a l version of EWT, we t e s t f o r nonlinear e f f e c t s with polynomial s t r u c t u r e s and piecewise 1 i nea r v a r i a t i o n s of n u t r i t i o n var iable . S imi la r ly we a l s o t e s t f o r suspected nonlinear age e f f e c t s using polynomials and piecewise l i n e a r v a r i a t i o n s .
In order t o t e s t t h e proposi t ions on which t h e e f f i c i ency wage t h e o r i e s found i n t h e ru ra l labor markets 1 i t e r a t u r e a r e based, we es t imate i n i t i a l l y t h e Two Limit Tobit model with P R a s t h e dependent va r i ab le and age, n u t r i t i o n a l consumption, gender, and individual occupational category dummies (using a g r i c u l t u r a l laborer a s t h e base category) a s person-speci f i c explanatory va r i ab les , and per c a p i t a landholding of t h e family and type of family a s househol d-speci f i c explanatory va r i ab les i n a s i n g l e equation (Equation 1, Tab1 e 2 ) . The choice of va r i ab les was determined by what had already been i d e n t i f i e d a s important i n pas t empirical research in these f i e l d s . For example, per cap i t a k i l o c a l o r i e consumption (nu t r i t i ona l versions of Lei benstein 1957; B l i s s and Stern 1978; Behrman e t a1 . 1988), gender (Bardhan 1979; B l i s s and Stern 1978), age (Immink and Vi ter i 1978), and individual work pa t t e rn (St rauss 1986; Immink and Vi t e r i 1978) were incorporated a s the main person-speci f i c vari abl e s , whi 1 e t h e landholding capaci ty of t h e household (Dasgupta and Ray l986), and household composition and i t s e f f e c t s on t h e welfare of the household members (Mirrlees 1975) were incorporated a s household-speci f i c va r i ab les i n t h e general spec: f i c a t i on.
Maddala (1988) presents a b r i e f expos c r i t e r i a .
i t i o n on various model s e l e c t
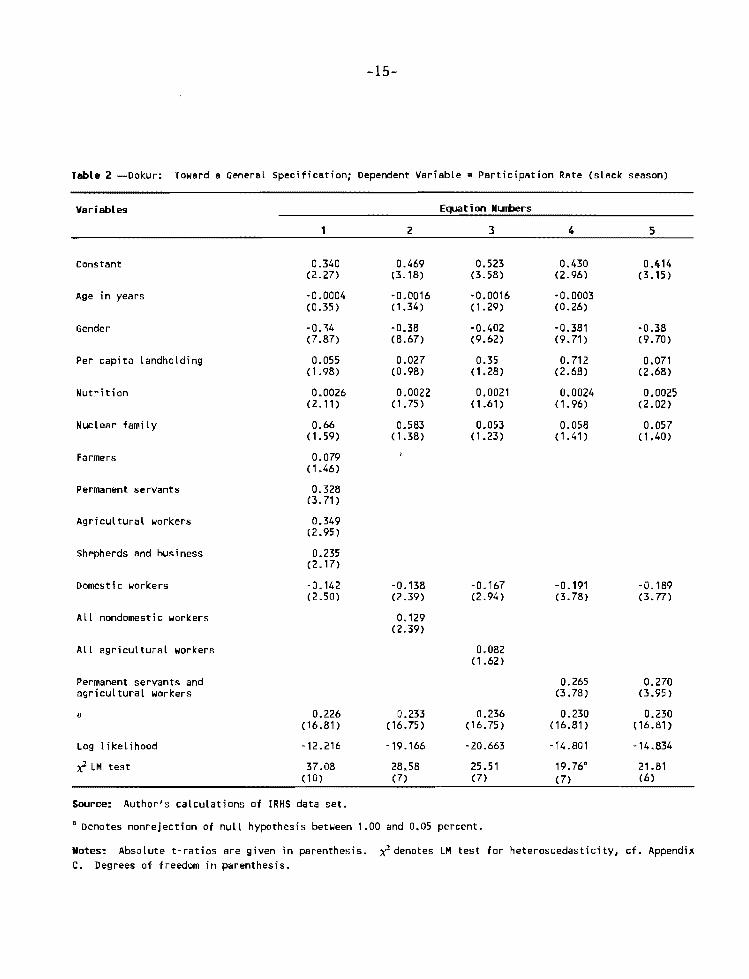
Table 2 -Dokur: Toward a General Specification; Dependent Variable = Participation Rate (slack season)
Variables Equation MuiJx'rs
Constant
Age in years
Gender
Per capita landholding
Nutrition
Nuclear family
Farmers
Permanent servants
Agricultural workers
Shepherds and business
Domestic workers
All nondomestic workers
All agricultural workers
Permanent servants and agricultural workers
Log likelihood
2 LM test
Source: Author's calculations of IRHS data set.
' Denotes nonrejection of null hypothesis between 1.00 and 0.05 percent.
Notes: Absolute t-ratios are given in parenthesis. x2 denotes LM test for heteroscedastici ty, cf. Appendix C . Degrees of freedom in parenthesis.

We use LIMDEP (Greene 1989),a limited dependent variable models estimation package, t o estimate our model.
TOWARD A GENERAL S P E C I F I C A T I O N
The large number of occupational dummies with d i f f e r en t i n t e n s i t i e s and 1 eve1 s of importance compel 1 ed us t o ident i fy the important occupational dummies and t o choose the appropriate speci f i ca t ion , including person-speci f i c and househol d-speci f i c variables, which could simp1 i fy the general functional form. As a f i r s t s t ep toward a general specif icat ion, we incorporated some important person-speci f i c and househol d-speci f i c variables with the f i ve main occupational dummies t o ident i fy the most s ign i f ican t dummies. We arrived a t a LL of -12.216, with coef f ic ien t s s ign i f ican t a t .05 level f o r almost a l l the variables except age and farmers dummy, as i s shown in Equation 1. Next we incorporated an occupational dummy, which combined the f i r s t four dummies, i . e . , a l l nondomestic workers dummy. All of the l a t t e r had previously shown a posi t ive re la t ionship with PR. Domestic workers dummy was included separately as i t had assumed a negative re la t ionship . The resu l t s a re shown in Equation 2. The LL of -19.166 implies t ha t t h i s r e s t r i c t ed specif icat ion can be rejected using the LR t e s t , since -2(-19.116 + 12.216) = 13.8 i s greater than the c r i t i c a l value of Y2(3, .O5) = 7.91. I t a l so reduced the significance of a1 1 the variables t h a t had been previously observed t o be s ign i f ican t . We fur ther tes ted by combining only the f i r s t three dummies, which are agr icul ture re1 a ted, and by dropping DllM4, which r e l a t e s t o shepherds. We arrived a t a LL of -20.663, with ins ignif icant coef f ic ien t s s imi la r t o those in Equation 2. Comparing Equations 1 and 3, we find t ha t the likelihood r a t i o i s equal t o 16.8, while the c r i t i c a l value i s 7.91. After dropping the farmers dummy, we t r i e d the co l lec t ive dummy variable comb-i ni ng permanent servants and agr icul tura l workers, with domestic workers as a separate dummy variable. This gave not only a LL of -14.801, but s ign i f ican t estimates f o r most variables, except f o r age as we1 1. Using the LR t e s t , we find t h a t t h i s t e s t specif icat ion (Equation 4) i s preferred t o the one t ha t includes a l l the dummies, since the c r i t i c a l value f o r y{3, .OS) = 7.91, which i s greater than twice the LL difference between Equation 1 and 4, namely, 2(-14.801 + 12.216) = 4.62. I t i s a l so worth noting tha t the LM t e s t f o r heteroscedast ic i ty does not re jec t the null hypothesis f o r Equation 4, between 0.01 and 0.005 significance leve l s , while the null i s rejected in the other three equations. Thus we chose Equation 4 as the preferred specif icat ion r e l a t i ve t o the one t ha t incorporates a l l the dummies and the other var iants t r i e d .
O u r preferred specif icat ion fo r the re la t ionship of PR t o the person- spec i f ic and household-specific variables al so gives meaning t o most of the postulated re1 at ionships, especial ly those t h a t are important in developing country labor markets, i n the efficiency wage theory 1 i t e r a tu r e . F i r s t , the
l o The program uses Newton's i t e r a t i v e technique of maximum 1 i kel i hood estimation and analytical second der ivat ives of the LL function t o estimate the variances of the parameter estimates (see Rosett and Nelson 1975; 01sen 1978).

gender of the individual assumes a s ign i f i can t negative coef f i c ien t , which implies t ha t females tend t o pa r t i c ipa te l e s s in the slack season. This i s not very surpr is ing in a patr iarchal socie ty , such as the Indian rural sector , where heavy tasks and the ro le of family head a re assumed by males, who have t o search f o r work in the slack season t o support the family, as opposed t o the female members of the family, who tend t o do the household chores. We take u p the issue of the gender-based differences in PR in the extensions. Next the household composition var iables included, namely, per capi ta 1 andholding power of the family and type of family, assume s ign i f i can t posi t ive coef f i c ien t s . Hence, agr icul tura l laborers from fami 1 i e s with large landholdings tend t o pa r t i c ipa te more in agr icu l tu re and re la ted a c t i v i t i e s (see Dasgupta and Ray 1986, 1987). As the abi 1 i t y t o se l f - insure i s an important determinant of nuclearizat ion, one should expect individuals from nuclear families t o be more able workers (see Newbery 1989). Since the re was a danger of i ncl uding too many household-specific var iables in the speci f ica t ion, we did not incorporate al 1 the household-speci f i c var iables , b u t have chosen the most obvious ones through economic and s t a t i s t i c a l considerat ions. However, we address t h i s i ssue in a subsequent section and t e s t how various other household composition variables perform in re1 a t i on t o the postulated re1 a t i onshi p.
Turning next t o the person-specific var iables , o ther than the gender var iable , i t can be observed t ha t the nutr i t ional s t a t u s of the individuals a l so consis tent ly assumes a posi t ive and s ign i f i can t coef f i c ien t . This i s a very in te res t ing finding since the nutr i t ional version of EWT would predict t h i s type of re la t ionship . We t e s t l a t e r f o r the nonlinear nutrition-efficiency e f f ec t hypothesized by Lei benstein (1957), Bl iss and Stern (1978), and Dasgupta and Ray (1986), amon many others. The age variable does not assume a s ign i f i can t coef f i c ien t ? see a l so Equation 5) ; we suspect t h i s may be because only ce r ta in age groups a re important, and a1 so because, a s the 1 i t e r a tu r e suggests, there may be a nonlinear re la t ionship between age and PR. We invest igate t h i s in de ta i l l a t e r . Checking the dummy var iables , we f ind t ha t permanent servants and agr icu l tu ra l workers' dummy constantly assumes a posi t ive s ign i f i can t coef f i c ien t , which imp1 i es t ha t those who cl ass i fy themselves as primarily agricul tu ra l workers and permanent servants have higher par t ic ipat ion r a t e s , while the consis tent negative and s ign i f i can t coef f i c ien t of domestic workers' dummy implies t h a t those who c l a s s i fy themselves as domestic workers tend t o have 1 ower pa r t i c ipa t ion r a t e s in the agr icul tura l 1 abor market. The simpl i f i ca t ion achieved in characterizing the occupational dummies, a s in Equation 4, holds consis tent ly when a l t e rna t i ve speci f ica t ions and extensions are investigated.
EXTENSIONS
Testing f o r Gender-Based Di fferences i n PR Effects
We were in teres ted in assessing whether d i f f e r en t pa r t i c ipa t ion r a t e s were primarily a r e s u l t of gender difference of the individuals and a1 so whether the preferred speci f ica t ion shows any gender-based segregation of the sampl e , s ince the gender variable was always s ign i f i can t ly related t o the observed PR. Thus,

Table 3 -Dokur: Testing f o r Gender-Based Differences; Dependent Variable = Par t i c ipa t ion Rates
Equation Numbers
Variables 6 7 8
Constant
Age i n years 0.0031 0.00024 -0.0020 (1.83) (1.26) (1.33)
Per capi ta landholding
N u t r i t i o n 0.363 (2.76)
Nuclear fami ly
Permanent servants and a g r i c u l t u r a l workers 0.32 (4.29)
Domestic workers
Age x sex
K i l o c a l o r i e consumption x sex
Domestic workers x sex
Per capi ta landholding x sex
Nuclear fami ly x sex
Log l i k e l i h o o d -12.226 -10.108 -1.1824
x2 LM tes t 32.10 16-52' 15-96" (11) (6) (5)
Source: Author's ca lcu lat ions o f IRHS data set.
' Denotes nonre ject ion o f the nu1 l hypothesis between 1.00 and 0.05 percent.
Notes: Absolute t - r a t i o s are given i n parenthesis. x2 denotes LM tes t f o r heteroscedast ici ty. Degrees o f freedom i n parenthesis.

i n o r d e r t o t e s t f o r t h e e f f e c t o f gender, we f i r s t assumed a common va r i ance o f males and females and then i n t e r a c t e d a1 1 t h e v a r i a b l e s i n Equat ion 4 w i t h t h e gender dummy v a r i a b l e . The r e s u l t i n g equa t ion (shown as Equat ion 6 i n Table 3) n o t o n l y f a i l e d t o pass t h e LR t e s t as LR = 2(-14.801 + 12.226) = 5.20 as opposed t o ^(5, .05) = 11.07, b u t a l s o most o f t h e i n t e r a c t i o n v a r i a b l e s were ex t reme ly i n s i g n i f i c a n t . Along w i t h t h e LR t e s t r e s u l t s , t h e LM t e s t (which r e j e c t s t h e n u l l hypo thes is o f h e t e r o s c e d a s t i c i t y i n t h e case o f Equat ion 6) enables us t o p r e f e r Equat ion 4 w i t h gender as a s i n g l e v a r i a b l e t o t h e i n t e r a c t e d f o rm o f Equat ion 6. When we a1 lowed f o r separate va r iances i n t h e s p e c i f i c a t i o n s f o r t h e 84 males (Equat ion 7) and 88 females (Equat ion 8) i n t h e sample, t h e s i g n i f i c a n t v a r i a b l e s were d i f f e r e n t f o r t h e d i f f e r e n t genders. The c o l l e c t i v e LL was -1.182 + -10.108 = -11.290, which was n o t a s u b s t a n t i a l improvement ove r t h e equa t i on w i t h t h e gender v a r i a b l e i n t e r a c t i o n , which had a LL o f -12.226, and a l s o c o u l d n o t be p r e f e r r e d t o Equat ion 4, w i t h t h e gender v a r i a b l e as a s imp le dummy v a r i a b l e . Equat ions 7 and 8 do n o t r e j e c t t h e n u l l hypo thes is o f homos- c e d a s t i c i t y i n terms o f t h e LM t e s t , as t h e x2 va lues i n d i c a t e . Comparing these equa t ions w i t h t h a t which i n c l udes t h e gender v a r i a b l e as an exp l ana to ry v a r i ab l e (Equat ion 4, w i t h a LL o f -14.801), we conclude t h a t t h e gender-based segrega t ion o f t h e sample i s unwarranted. Thus, bo th males and females have a more o r l e s s common s t r u c t u r e i n t h e hypothes ized PR r e l a t i o n s h i p .
V a r i a t i o n s o f Household Composi t ion and Land Ownership V a r i a b l e s
Next we i n q u i r e i n t o t h e r o l e o f household compos i t i on v a r i a b l e s i n t h e a c t i v i t y p a t t e r n s and we1 f a r e o f household members. The 1 i t e r a t u r e on a g r i c u l t u r a l household models p rov i des evidence o f i n c r e a s i n g a p p r e c i a t i o n o f t h e necess i t y o f i n c o r p o r a t i n g household composi t ion v a r i a b l e s i n t h e a n a l y s i s o f household p r o d u c t i o n and consumption dec i s i ons (Singh e t a1 . 1986) . A1 ong t h e same 1 ines , we a1 so i n c o r p o r a t e v a r i a b l e s r e p r e s e n t i n g household c h a r a c t e r i s t i c s as exp lana to r y v a r i a b l e s i n ou r s p e c i f i c a t i o n o f t h e i n d i v i d u a l p a r t i c i p a t i o n r a t e . Not o n l y a r e these househol d-speci f i c v a r i a b l e s impo r tan t i n de te rm in i ng t h e e f f i c i e n c y o f i n d i v i d u a l s , b u t t hey p r o v i d e impo r tan t i n f o r m a t i o n about workers i n t h e r u r a l l a b o r market t h a t employers can observe. Employers can use t h i s i n f o r m a t i o n f o r sc reen ing workers f o r t h e i r a b i l i t y and e f f i c i e n c y t o h e l p determine whom and when t o h i r e . I n t h e genera l s p e c i f i c a t i o n we have a l r eady i n c o r p o r a t e d p e r c a p i t a 1 andhol d i ng and nuc l ea r fami l y dummy.
We a l s o t r i e d some o f t h e o t h e r p o s s i b l e farni l y background v a r i a b l e s . When t h e dependency r a t i o , d e f i n e d as t h e number o f c h i 1 d ren as a r a t i o t o t h e work ing members o f t h e household, was i n c o r p o r a t e d i n s t e a d o f p e r c a p i t a 1 andholding, t h e v a r i a b l e assumed a nega t i ve s i g n i f i c a n t c o e f f i c i e n t and p rov i ded a LL o f -14.910, w h i l e i n c r e a s i n g t h e s i g n i f i c a n c e o f n u c l e a r f a m i l y dummy (Equat ion 9, Table 4). When t h e t o t a l number o f members i n t h e f a m i l y was i n c o r p o r a t e d i n Equat ion 4 i n s t e a d o f n u c l e a r f a m i l y dummy, i t gave a LL o f -14.700 and a nega t i ve c o e f f i c i e n t f o r household s i z e s i g n i f i c a n t a t .10 1 eve1 , w i t h o u t a s u b s t a n t i a1 r e d u c t i o n i n t h e s i g n i f i c a n c e o f o t h e r v a r i a b l e s as shown i n equa t ion 10. There fo re we cou ld say t h a t t h e l a r g e r t h e s i z e o f t h e f a m i l y t h e s m a l l e r t h e p o t e n t i a l PR o f i n d i v i d u a l s be long ing t o i t .

Table 4 -Dokur: Var ia t ions o f Household Composition Effects; Dependent Variable = P a r t i c i p a t i o n Rates
Eaua t im Nos.
Variables 9 10 11
Constant
Age i n years
Gender
Per cap i ta landholding
N u t r i t i o n
Nuclear fami ly
Permanent servants and a g r i c u l t u r a l workers 0.216 0.249 0.239 (3.16) (3.60) (3.46)
Domestic workers
Dependency r a t i o
Household s i ze
Number o f ch i ld ren
a
Log l i k e l i h o o d
2 LM t e s t 18.29' 19-35' 18.67@ (7) ( 7 ) (7)
Source: Author's ca lcu lat ions o f I R H S data set.
' Denotes nonre ject ion o f the n u l l hypothesis between 1.00 and 0.05 percent.
Notes: Absolute t - r a t i o s are given i n parenthesis. y2 denotes LM t e s t f o r heteroscedast ici ty. Degrees o f freedom i n parenthesis.

As ano ther extens ion, we i n c o r p o r a t e t h e number o f c h i l d r e n i n each household i n t h e s p e c i f i c a t i o n o f Equat ion 4, i n s t e a d o f n u c l e a r f a m i l y dummy, g i v i n g a LL of -14.385 as shown i n Equat ion 11. The nega t i ve c o e f f i c i e n t i n d i c a t e s t h e p o s s i b l e n e g a t i v e re1 a t i o n s h i p t h a t t h e number o f c h i 1 d ren v a r i a b l e has w i t h PR. However, as can be seen f r om Equat ion 11, t h i s f o r m u l a t i o n reduces t h e s i g n i f i c a n c e o f t h e n u t r i t i o n v a r i a b l e . A1 1 t h r e e s p e c i f i c a t i o n s accommodating household composi t ion e f f e c t s do n o t r e j e c t t h e assumption o f homoscedas t i c i t y i n terms o f t h e LM t e s t , as can be observed f rom t h e 2 values . - r e p o r t e d w i t h t h e r e s p e c t i v e equat ions.
N u t r i t i o n E f f e c t s
Next we t u r n t o t h e p e r s o n - s p e c i f i c v a r i a b l e s i n c o r p o r a t e d i n t h e genera l s p e c i f i c a t i o n i n o r d e r t o see how a1 t e r n a t i v e s p e c i f i c a t i o n s , u s i n g t h e e x i s t i n g va r i ab l es , pe r fo rm w i t h r espec t t o t h e hypothes ized r e l a t i o n s h i p .
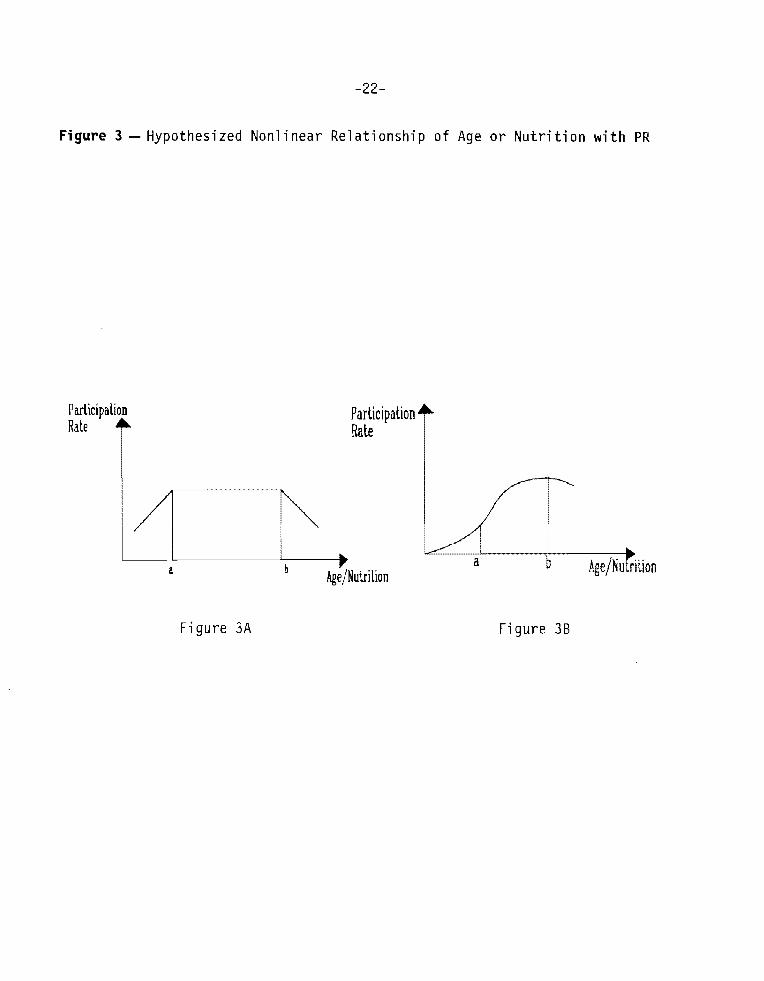
F i r s t , we t e s t t h e most impo r tan t o f a1 1 t h e p e r s o n - s p e c i f i c v a r i a b l e s : t h e n u t r i t i o n a l s t a t u s o f t h e i n d i v i d u a l s . Th is has been hypothes ized i n t h e EWT 1 i t e r a t u r e as hav ing a nonl i n e a r r e l a t i o n s h i p w i t h t h e e f f i c i e n c y o f workers, and we assume a s i m i l a r p a t t e r n i n r e l a t i o n t o p a r t i c i p a t i o n r a t e s , and we t e s t f o r them. We propose t o adopt two methods t o a1 low f o r t h e p o s s i b l e nonl i n e a r i t y o f t h e r e l a t i o n s h i p , t h e diagrammatic forms o f which a r e shown i n F i gu res 3A and 3B. They are:
1. Piecewise L i n e a r : i .e., i n t e r a c t i n g n u t r i t i o n w i t h va r i ous dummy v a r i - a b l e c l a s s i f i c a t i o n s o f t h e v a r i a b l e accord ing t o n u t r i t i o n a l measures (F i gu re 3A).
2. Po lynomia ls : i .e., n u t r i t i o n , " n u t r i t i o n 2 " and/or " n u t r i t i o n 3 " i n s t e a d o f n u t r i t i o n a l one (F i gu re 3B)
F i r s t , a dummy s t r u c t u r e was t r i e d , w i t h n u t r i t i o n a l s t a t u s b e i n g d i v i d e d i n t o t h e t h r e e groups accord ing t o t h e concept o f Required D i e t a r y Al lowance (RDA), which d e f i n e s t h e r e l a t i v e l e v e l s o f n u t r i t i o n a l w e l f a r e of i n d i v i d u a l s:ll
a. Below 80 percen t s tandard: " n u t r i t i o n c 80" = 1 i f n u t r i t i s tandard i s l e s s t han 80, and 0 o therw ise .
b. Between 80 percen t and 110 percen t : "80 < n u t r i t i o n < 110" = n u t r i t i o n a l s tandard l i e s between 80 and 110, and 0 o therw ise .
c. Above 110 percen t s tandard: " n u t r i t i o n > 110" = 1 if n u t r i t i s tandard i s g r e a t e r t han 110, and 0 o therw ise .
onal
1 i f
onal
l 1 see " Inc idence of U n d e r n u t r i t i o n " i n Canagarajah (1991), Appendix A o f Chapter 1.
-22-
Figure 3 - Hypothesized Nonl i near Relati onship of Age o r Nutri t ion w i t h PR
Participation
ha *Â Participation
lbie * Figure 3 A Figure 3B
Each o f these dummies was i n t e r a c t e d w i t h t h e r e s p e c t i v e n u t r i t i o n l e v e l o f i n d i v i d u a l s t o form t h e n u t r i t i o n va r i ab l es , namely, " n u t r i t i o n < 80," "80 < n u t r i t i o n < 110," and " n u t r i t i o n > 110." Th i s was done t o a l l o w f o r t h e p robab le n o n l i n e a r e f f e c t o f n u t r i t i o n w i t h r espec t t o PR w i t h i n these t h r e e groups. These n u t r i t i o n v a r i a b l e s were i nco rpo ra ted i n s t e a d o f n u t r i t i o n a l standard, and t h e s p e c i f i c a t i o n was t e s t e d us i ng LR. F i r s t , we i n t r oduced a1 1 t h r e e v a r i a b l e s , namely, " n u t r i t i o n < 80," "80 < n u t r i t i o n < 110," and " n u t r i t i o n > 110," i n s t e a d o f n u t r i t i o n , and we found t h a t none o f t h e n u t r i t i o n v a r i a b l e s d i d assume s i g n i f i c a n t c o e f f i c i e n t s i n d i v i d u a l l y . When we t e s t e d f o r t h e c o l l e c t i v e s i gn i f i canc ,e th rough t h e LR t e s t we found t h a t t h e LR = -2(-14.801 + 13.722) = 2.158 i s l e s s t han 2 ( 2 , .05) = 5.99. Thus, Equat ion 12 i s n o t a s i g n i f i c a n t improvement ove r Equat ion 4. However, when "80 < n u t r i t i o n 4 110" was i n c o r p o r a t e d i n Equat ion 4 i n s t e a d o f n u t r i t i o n v a r i a b l e ( w i t h age v a r i a b l e ) , t h e LL became -15.047, as can be seen f rom Equat ion 14 w i t h a n e g a t i v e c o e f f i c i e n t f o r "80 < n u t r i t i o n < 110" s i g n i f i c a n t a t 0.10 l e v e l . Th i s i m p l i e s t h a t t h e i n d i v i d u a l s w i t h a l owe r n u t r i t i o n a l s t a t u s on average have a 1 ower p a r t i c i p a t i o n r a t e . On t h e o t h e r hand, as can be observed f rom Equat ion 15, when " n u t r i t i o n > 110" was i n c l u d e d i n s t e a d o f n u t r i t i o n , t h e LL inc reased t o -14.087, and t h e n u t r i t i o n e f f e c t te rm had a p o s i t i v e and s i g n i f i c a n t c o e f f i c i e n t , i n d i c a t i n g t h e p r e f e r e n t i a l p o s i t i o n t hey en joy i n terms o f p a r t i c i p a t i o n r a t e s . Bu t when " n u t r i t i o n < 80" was i nco rpo ra ted , t h e LL became -16.669, which i s a s u b s t a n t i a l r e d u c t i o n i n t h e LL and t h e n u t r i t i o n v a r i a b l e became comple te ly i n s i g n i f i c a n t (see Equat ion 13 i n Table 5) . Thus, " n u t r i t i o n > 110" per forms b e t t e r t han any o t h e r v a r i a t i o n . Th i s i n d i c a t e s t h a t those who a r e we1 1 -nour ished have t h e most s i g n i f i c a n t r e l a t i o n s h i p w i t h PR, w h i l e those i n t h e l owe r spectrum do n o t d i s p l a y such a p a t t e r n .
Next t h e polynomi a1 v a r i a n t s o f n u t r i t i o n a l consumption - n u t r i t i o n , n u t r i t i o n 2 , " and " n u t r i t i o n 3 " - were i nco rpo ra ted w i t h t h e o b j e c t i v e o f accoun t ing f o r t h e p o t e n t i a l n o n l i n e a r e f f e c t n u t r i t i o n i s hypothes ized t o have on e f f i c i e n c y and t h e r e s u l t i n g PR o f workers, f o l l o w i n g t h e p roposa ls o f L e i b e n s t e i n ( l 957 ) , B l i s s and S te rn (1978), and S t rauss (1986). among many o the rs . F i r s t , we i nco rpo ra ted a1 1 t h r e e n u t r i t i o n po lynomia l v a r i a b l e s , w i t h age accoun t i ng f o r age e f f e c t s . As shown i n Equat ion 16, when n u t r i t i o n and n u t r i t i o n 2 " were incorpora ted , t h e LL became -11.046, which u s i n g t h e LR t e s t i s a s i g n i f i c a n t improvement ove r Equat ion 4. Both n u t r i t i o n and " n u t r i t i o n 2 " a r e ex t reme ly s i g n i f i c a n t , s t r o n g l y suppo r t i ng t h e p r o p o s i t i o n s o f t h e n u t r i t i o n a l v e r s i o n o f EWT. S i m i 1 a r l y , when " n u t r i t i o n 2 " and " n u t r i t i o n 3 " were i nco rpo ra ted , t h e LL became -10.927, a1 so a s u b s t a n t i a l improvement ove r Equa t ion 4. Again, b o t h t h e n u t r i t i o n v a r i a b l e s assume s i g n i f i c a n t c o e f f i c i e n t s .
S ince t h e po lynomia l n u t r i t i o n v a r i a b l e s assume a combina t ion o f nega t i ve and p o s i t i v e c o e f f i c i e n t s , we checked whether t h e marg ina l e f f e c t o f n u t r i t i o n
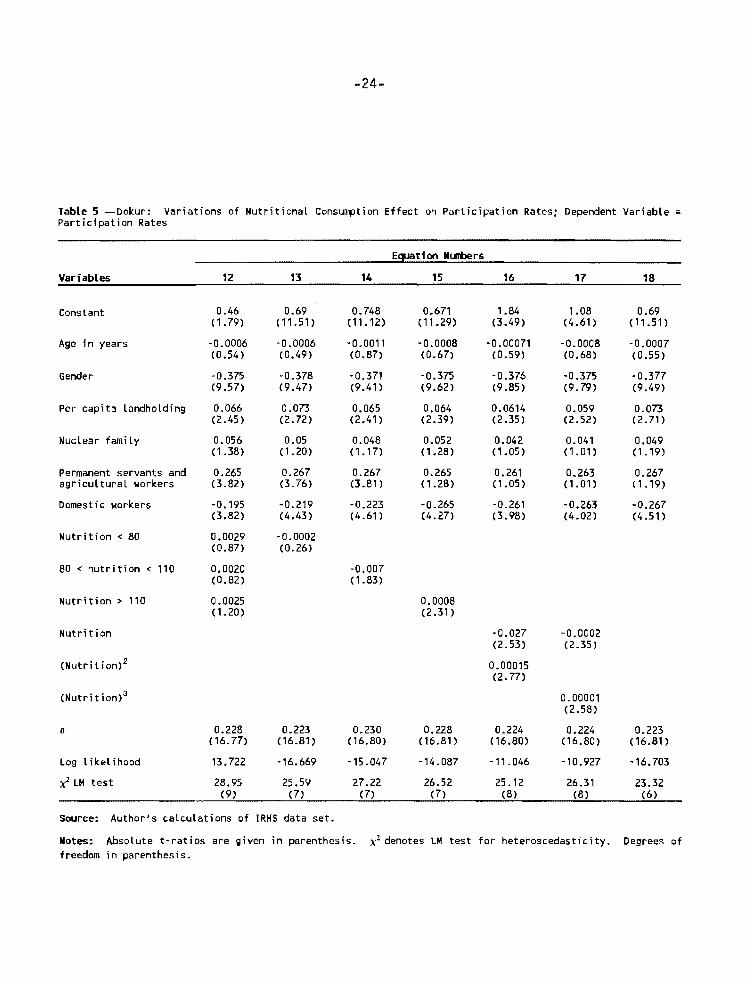
Table 5 -Dokur: Var ia t ions of N u t r i t i o n a l Consumption Ef fect on Par t i c ipa t ion Rates; Dependent Variable = Par t i c ipa t ion Rates
Equation Mmtoers
Variables 12 13 14 15 16 17 18
Constant
Age i n years
Gender
Per capi ta landholding
Nuclear fami ly
Permanent servants and a g r i c u l t u r a l workers
Domestic workers
N u t r i t i o n < 80
80 < n u t r i t i o n < 110
N u t r i t i o n > 110
N u t r i t i o n
(Nutr i t ion)'
( ~ u t r i t i o n ) ~
0
Log l i k e l i h o o d
2 LM t e s t
Source: Author's ca lcu lat ions of I R H S data set.
Notes: Absolute t - r a t i o s are given i n parenthesis. x2 denotes LM t e s t f o r heteroscedast ici ty. Degrees of freedom i n parenthesis.
on PR i s p o s i t i v e o r not.' ' The e f f e c t i v e i n f l uence , o r t h e marg ina l e f f ec t , o f n u t r i t i o n on PR was c a l c u l a t e d f rom es t imates ob ta i ned f rom Equat ion 16; t h e e f f e c t i v e i n f l u e n c e a t t h e mean va lue o f n u t r i t i o n (i .e., 100.66) was 0.003. I n d i v i d u a l s who f e l l be1 ow approx imate ly 90.75 o f t h e i r n u t r i t i o n s tandard had a n e g a t i v e r e l a t i o n s h i p w i t h PR. Th i s i n d i c a t e s t h a t n u t r i t i o n g e n e r a l l y p o s i t i v e l y i n f l u e n c e s PR, as t h e f i g u r e f o r mean n u t r i t i o n shows. A s i m i l a r f i g u r e f o r t h e n u t r i t i o n e f f e c t was ob ta ined f o r Equa t ion 17, a l t hough a t 0.03 t h i s was somewhat h i ghe r . These r e s u l t s a r e i n 1 i ne w i t h t h e genera l n u t r i t i o n a l v e r s i o n o f e f f i c i e n c y wage t heo ry .
The LR t e s t suggests t h a t these s p e c i f i c a t i o n s a r e s u p e r i o r t o one i n which n u t r i t i o n a1 one i s i ncorpora ted i n t h e s p e c i f i c a t i o n . We a1 so found t h a t d ropp ing n u t r i t i o n f r om Equat ion 4 i n d i c a t e s t h a t t h e s p e c i f i c a t i o n i s worse by an LR t e s t , s i n c e w i t h o u t n u t r i t i o n Equat ion 4 has a LL o f -16.703 (see Equat ion 18), as opposed t o t h e LL o f -14.801. The n o n l i n e a r i t y f rom t h e n u t r i t i o n a l v e r s i o n o f t h e EWT (see Le ibens te i n 1957; B l i s s and S t e r n 1978) can be s u b s t a n t i a t e d by t h e s i g n i f i c a n t c o e f f i c i e n t s ( a t .05 l e v e l ) o f " n u t r i t i o n 2 " and ' n u t r i t i o n 3 . " Th i s t y p e o f nonl i n e a r i t y per forms b e t t e r t han t h e p iecewi se l i n e a r s p e c i f i c a t i o n u s i n g " n u t r i t i o n > 110" and "80 < n u t r i t i o n < 110.'' However, i t i s impo r tan t t o no te t h a t most o f these equa t ions f a i 1 marg ina l l y t h e LM t e s t f o r homoscedast ic i ty , as t h e 2 s t a t i s t i c r evea l s .
Age E f fec ts
Next, a l t e r n a t i ve r e p r e s e n t a t i o n s o f t h e age v a r i a b l e were i n c o r p o r a t e d i n t o t h e genera l s p e c i f i c a t i o n t o see whether t hey inc reased t h e exp lana to r y power o f Equat ion 4 and whether t h e y have a s p e c i f i c f u n c t i o n a l r e l a t i o n s h i p w i t h t h e PR o f i n d i v i d u a l s . The n e g a t i v e c o e f f i c i e n t i n d i c a t e s t h a t t h e h i g h e r t h e age t h e lower t h e p a r t i c i p a t i o n r a t e o f i n d i v i d u a l s , which i s p robab l y because people become p h y s i c a l l y weak w i t h h i g h e r age; a1 though f o r t h e most p a r t t h e v a r i a b l e i s i n s i g n i f i c a n t . Thus, when we t e s t e d f o r t h e impor tance o f t h e age v a r i a b l e by d ropp ing i t f rom t h e s p e c i f i c a t i o n a l t o g e t h e r , i t n o t o n l y a f f e c t e d t h e s i g n i f i c a n c e o f t h e o t h e r v a r i a b l e s i nco rpo ra ted i n t h e equat ion, b u t t h e n u l l o f t h e LM t e s t o f h e t e r o s c e d a s t i c i t y was r e j e c t e d f o r t h e equat ion, as can be seen f rom Equat ion 5. Th i s i n d i c a t e s t h e n e c e s s i t y o f i n c o r p o r a t i n g age, as we1 l as v a r y i n g i t s fo rm t o cap tu re i t s s i g n i f i c a n c e i n t h e s p e c i f i c a t i o n s . However, as we can observe from Equat ion 6, bo th age and (age x gender) assume s i g n i f i c a n t
l 2 Th i s e f f e c t i v e i n f l u e n c e o f n u t r i t i o n a l s tandard i s measured as f o l l o w s :
" = coeff. of n.utrition. + 'l(coeff. of [nutrition'^}} nutrition
Q nutrition
m = coeff. of nutrition + 2{coeff. of [nutrition?) 9 nutrition
nutrition + 3 (cot'ff. qf [nutrition 3'}1 (n.utrition)'

c o e f f i c i e n t s , and t h u s we observe t h a t females d i sp lay a marked negat ive e f f e c t with PR, while f o r males the re i s not such a s t rong negat ive r e l a t i o n s h i p . Employers may p r e f e r men t o women because, a s Bardhan (1979) argues, women's labor supply i s i r r e g u l a r due t o v i l l a g e soc ia l customs and conventions, which make them l e s s f l e x i b l e i n meeting weather-dependent and i n t e r m i t t e n t 1 abor market demands. Therefore, i n l i n e with EWT, t h e profit-maxinnzing employers a r e j u s t i f i e d in p re fe r r ing younger males t o work on t h e i r farms and i n o the r a g r i c u l t u r e - r e l a t e d a c t i v i t i e s i n a ru ra l economy.
The i n s i g n i f i c a n t negat ive l i n e a r r e l a t i o n s h i p between age and PR ( a s in Equation 4) i s too naive t o accept a s an explanat ion f o r t h e whole populat ion, and i n general one could expect a nonl inear r e l a t i o n s h i p between age and PR. The r e l a t i o n s h i p could t ake t h e shape depicted i n e i t h e r Figure 3A o r 3E$.I3 This could be captured e i t h e r by using polynomials o r by generat ing i n t e r a c t i o n va r i ab le s with d i f f e r e n t dummies f o r d i f f e r e n t age group c l a s s i f i c a t i o n s , a s was done f o r t h e n u t r i t i o n va r i ab le . Since t h e LL became -14.834 a s opposed t o -14.801 when age was dropped (see Equation 5 ) , i t seemed s e n s i b l e t o t e s t f o r t h e importance of t h e va r i ab le in t h e hypothesized r e l a t i o n s h i p , and t o drop i t i f we do not f ind o the r t ransformations of t h e same va r i ab le improving t h e s p e c i f i c a t i o n s .
F i r s t , we t r i e d a polynomial s t r u c t u r e with age and "age2." These did not improve t h e c r i t e r i o n (as can be seen i n Equation 24 t h e L L was -14.296) and both age and age2 assumed very i n s i g n i f i c a n t c o e f f i c i e n t s . Simi 1 a r l y , when "age2" and a g e 3 " were incorporated t o represent t h e age e f f e c t (Equation 25), t h e L L was - 14.449 and t h e age va r i ab le s again were i n s i g n i f i c a n t . Hence, t h e polynomial s t r u c t u r e does not explain t h e hypothesized nonl i n e a r re1 a t ionsh i p between PR and age.
The ages of i nd iv idua l s were the re fo re divided i n t o t h r e e ca t egor i e s , and t h r e e dummy v a r i a b l e s were c rea t ed . They were
1. Less than 16 years : "age < 16" = 1 f o r those below 16 yea r s , and 0 f o r o t h e r s .
2. Between 16 and 50 years : "16 < age < 50" = 1 f o r those between 16 and 50 yea r s , and 0 f o r o the r s .
3 . Grea ter than 50 years : "age > 50" = 1 f o r those above 50 yea r s , and 0 f o r o the r s .
Each dummy va r i ab le was in t e rac t ed with t h e age of t h e r e spec t ive ind iv idua l s t o form "age < 16," "16 < age < 50," and "age > 50,'' t h u s allowing them t o t ake i n t o account t h e nonl i nea r i t y . These va r i ab le s were independently
l 3 These f i g u r e s a r e s i m i l a r t o Figure 1 of Standing and Sheehan (1978) f o r p a r t i c i p a t i o n r a t e s of rura l males and females i n S r i Lanka. The book i n d i c a t e s evidence f o r s i m i l a r pa t te rn f o r t h e PR of workers in most ru ra l a r eas i n Asia.
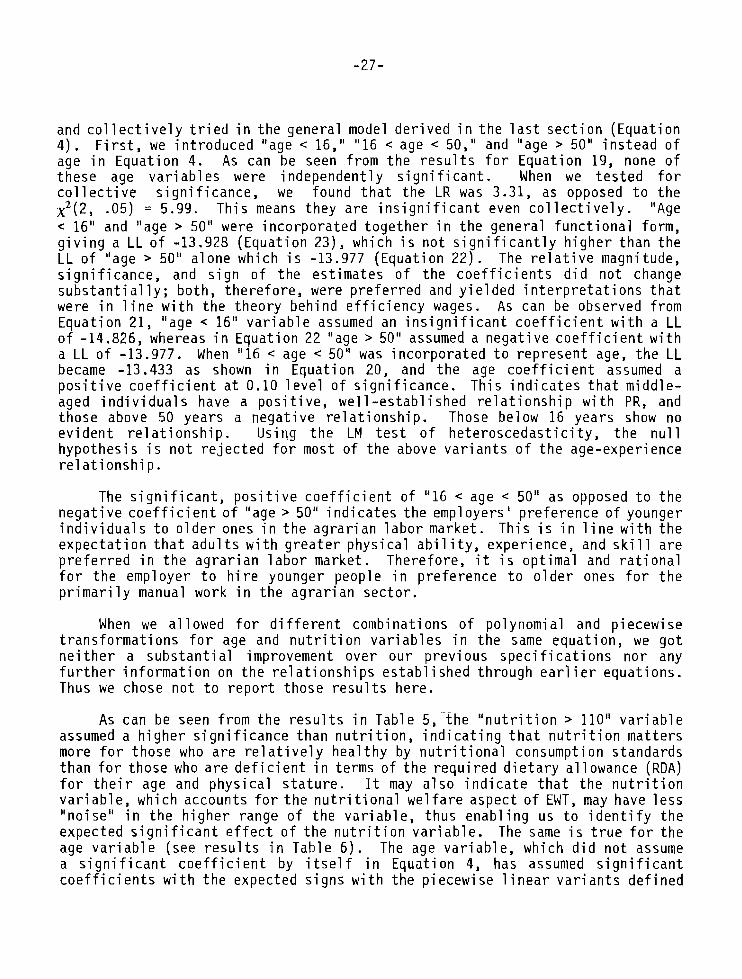
and c o l l e c t i v e l y t r i e d i n t h e genera l model d e r i v e d i n t h e l a s t s e c t i o n (Equat ion 4). F i r s t , we i n t r o d u c e d "age < 16," "16 < age < 50," and "age > 50" i n s t e a d o f age i n Equa t ion 4. As can be seen f rom t h e r e s u l t s f o r Equa t ion 19, none o f these age v a r i a b l e s were independent l y s i g n i f i c a n t . When we t e s t e d f o r c o l l e c t i v e s i g n i f i c a n c e , we found t h a t t h e LR was 3.31, as opposed t o t h e (̂2, .05) = 5.99. Th i s means t hey a re i n s i g n i f i c a n t even c o l l e c t i v e l y . "Age
< 16" and "age > 50" were i nco rpo ra ted t o g e t h e r i n t h e genera l f u n c t i o n a l form, g i v i n g a LL o f -13.928 (Equat ion 23), which i s n o t s i g n i f i c a n t l y h i g h e r t han t h e LL of "age > 50" a lone which i s -13.977 (Equat ion 22). The r e l a t i v e magnitude, s i g n i f i c a n c e , and s i g n o f t h e es t imates o f t h e c o e f f i c i e n t s d i d n o t change s u b s t a n t i a l l y ; both , t h e r e f o r e , were p r e f e r r e d and y i e l d e d i n t e r p r e t a t i o n s t h a t were i n l i n e w i t h t h e t heo ry behind e f f i c i e n c y wages. As can be observed f rom Equat ion 21, "age < 16" v a r i a b l e assumed an i n s i g n i f i c a n t c o e f f i c i e n t w i t h a LL of -14.826, whereas i n Equat ion 22 "age > 50" assumed a nega t i ve c o e f f i c i e n t w i t h a LL of -13.977. When "16 < age < 50" was i nco rpo ra ted t o r ep resen t age, t h e LL became -13.433 as shown i n Equat ion 20, and t h e age c o e f f i c i e n t assumed a p o s i t i v e c o e f f i c i e n t a t 0.10 l e v e l o f s i g n i f i c a n c e . Th i s i n d i c a t e s t h a t midd l e- aged i n d i v i d u a l s have a p o s i t i v e , we1 l -es tab l i shed r e l a t i o n s h i p w i t h PR, and those above 50 years a nega t i ve r e l a t i o n s h i p . Those below 16 years show no e v i d e n t r e l a t i o n s h i p . Us ing t h e LM t e s t o f h e t e r o s c e d a s t i c i t y , t h e n u l l hypo thes is i s n o t r e j e c t e d f o r most o f t h e above v a r i a n t s o f t h e age-exper ience r e l a t i o n s h i p .
The s i g n i f i c a n t , p o s i t i v e c o e f f i c i e n t o f "16 < age < 50" as opposed t o t h e nega t i ve c o e f f i c i e n t o f "age 3 50" i n d i c a t e s t h e employers ' p re fe rence o f younger i n d i v i d u a l s t o o l d e r ones i n t h e a g r a r i a n l a b o r market. Th i s i s i n l i n e w i t h t h e e x p e c t a t i o n t h a t a d u l t s w i t h g r e a t e r phys i ca l a b i 1 i t y , exper ience, and s k i l l a re p r e f e r r e d i n t h e a g r a r i a n l a b o r market. Therefore, i t i s op t ima l and r a t i o n a l f o r t h e employer t o h i r e younger people i n p re fe rence t o o l d e r ones f o r t h e p r i m a r i l y manual work i n t h e a g r a r i a n sec to r .
When we a1 lowed f o r d i f f e r e n t combinat ions o f po lynomia l and p iecewi se t r a n s f o r m a t i o n s f o r age and n u t r i t i o n v a r i a b l e s i n t h e same equat ion, we g o t n e i t h e r a s u b s t a n t i a l improvement over o u r p rev i ous s p e c i f i c a t i o n s n o r any f u r t h e r i n f o r m a t i o n on t h e r e l a t i o n s h i p s e s t a b l i s h e d th rough e a r l i e r equat ions. Thus we chose n o t t o r e p o r t those r e s u l t s here.
As can be seen f rom t h e r e s u l t s i n Table 5, t h e " n u t r i t i o n > 110" v a r i a b l e assumed a h i g h e r s i g n i f i c a n c e than n u t r i t i o n , i n d i c a t i n g t h a t n u t r i t i o n ma t t e r s more f o r those who a r e r e l a t i v e l y heal t h y by n u t r i t i o n a l consumption s tandards t han f o r those who a r e d e f i c i e n t i n terms o f t h e r e q u i r e d d i e t a r y a l 1 owance (RDA) f o r t h e i r age and phys i ca l s t a t u r e . I t may a l s o i n d i c a t e t h a t t h e n u t r i t i o n v a r i a b l e , which accounts f o r t h e n u t r i t i o n a l w e l f a r e aspect o f EWT, may have l e s s ' n o i s e " i n t h e h i g h e r range o f t he v a r i a b l e , t hus enab l i ng us t o i d e n t i f y t h e expected s i g n i f i c a n t e f f e c t o f t h e n u t r i t i o n v a r i a b l e . The same i s t r u e f o r t h e age v a r i a b l e (see r e s u l t s i n Table 6 ) . The age v a r i a b l e , which d i d n o t assume a s i g n i f i c a n t c o e f f i c i e n t by i t s e l f i n Equat ion 4, has assumed s i g n i f i c a n t c o e f f i c i e n t s w i t h t h e expected s i gns w i t h t h e p iecewise 1 i n e a r v a r i a n t s de f i ned
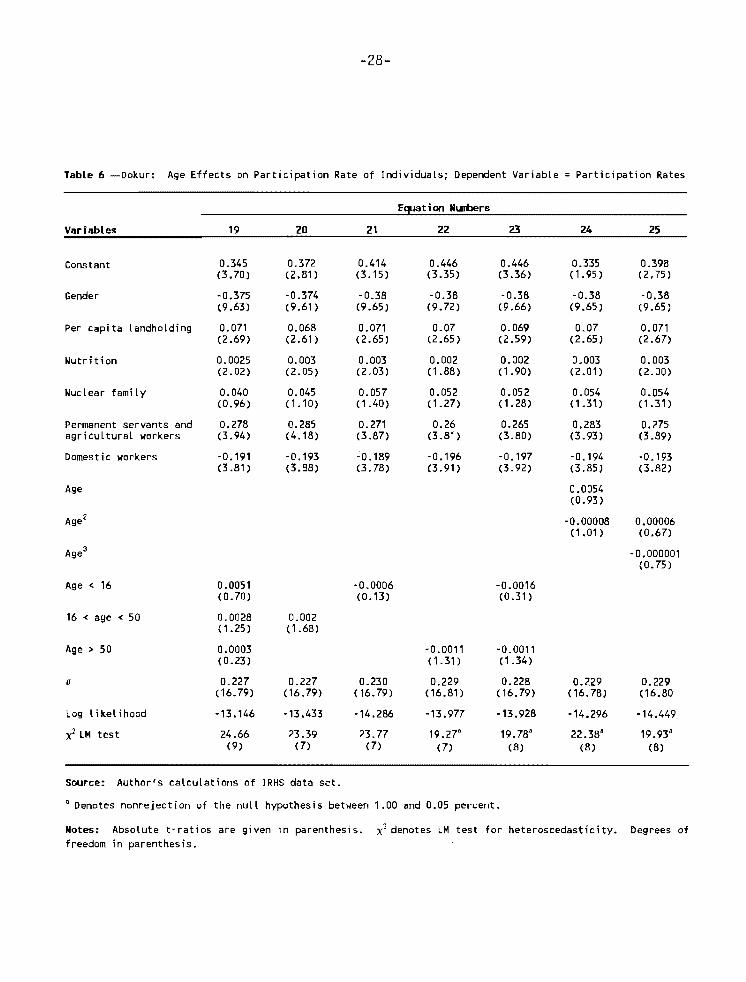
Table 6 -Dokur: Age E f fec ts on P a r t i c i p a t i o n Rate o f Individuals; Dependent Variable = Par t i c ipa t ion Rates
Equation N h r s
Variables 19 20 21 22 23 24 25
Constant
Gender
Per capi ta landholding
N u t r i t i o n
Nuclear fami ly
Permanent servants and agr i cu l tu ra l workers
Domestic workers
Age
~ g e '
~ g e ~
Age < 16
16 < age < 50
Age > 50
a
Log l i ke l ihood
2 LM t e s t
Source: Author's ca lcu lat ions o f I R H S data set
Denotes nonreject ion of the n u l l hypothesis between 1.00 and 0.05 percent.
Notes: Absolute t - r a t i o s are given i n parenthesis. 2 denotes LM tes t f o r heteroscedast ici ty. Degrees o f freedom i n parenthesis.

f o r t h e h i g h e r spec t rum o f age c a t e g o r y , namely "16 < age < 50" and "age > 50" a s opposed t o "age < 16.' '

6 . CONCLUSION
The o b j e c t i v e i n t h i s paper was t o es t ima te a r e l a t i o n s h i p on t h e demand curve between t h e e f f i c i e n c y o f workers, as evidenced by t h e i r p a r t i c i p a t i o n r a tes , and t h e c h a r a c t e r i s t i c s o f workers. Thus, g i ven t h a t employers i n a s u r p l u s l a b o r market w i 11 h i r e workers w i t h t h e h i g h e s t e f f i c i e n c y l e v e l s , we can i d e n t i f y t h e e f f i c i e n t workers th rough t h e i r p a r t i c i p a t i o n r a t e s ( o r converse ly employer h i r i n g r a t e s ) i n t h e l a b o r market.
We p r o v i d e c o n s i s t e n t evidence i n ou r i n i t i a l es t imates f o r t h e consumption- nutrition-efficiency nexus by r e1 a t i n g t h e k i 1 oca l o r i e consumption o f i n d i v i d u a l s ( n u t r i t i o n v a r i a b l e and v a r i a t i o n s o f i t ) t o t h e i r p a r t i c i p a t i o n r a t e s . Th i s enables us t o make much s t r o n g e r s ta tements about t h e expected EWT p r o p o s i t i o n s t h a t one would expect t o f i n d i n t h e LDC r u r a l s e c t o r and t h a t a re hypothes ized i n t h e t h e o r e t i c a l 1 i t e r a t u r e by M i r r l e e s ( l975) , B l i s s and S t e r n (1978), and Dasgupta and Ray (1986) among many o the rs .
The econometr ic model used here was designed t o re1 a t e t h e e f f i c i e n c y o f workers i n a meaningfu l way t o t h e i r r e s p e c t i v e p a r t i c i p a t i o n r a t e s w i t h o u t t h e p robab le d i s t o r t i o n a r y e f f e c t s o f those w i t h extreme va lues o f p a r t i c i p a t i o n r a t e s about whom we l a c k adequate i n f o r m a t i o n t o i n f e r t h e i r e f f i c i e n c y . I n terms o f t h e d i agnos t i c s , t h e h e t e r o s c e d a s t i c i t y t e s t developed s p e c i f i c a l l y f o r t h i s model, d e s p i t e i t s poor smal l sampl e p r o p e r t i e s , d i d n o t a1 ways r e j e c t t h e n u l l hypo thes is . By demonst ra t ing how t h e e f f i c i e n c y o f workers can be m e a n i n g f u l l y r e l a t e d t o t h e i r r e s p e c t i v e c h a r a c t e r i s t i c s and endowments th rough t h e i r s l a c k season p a r t i c i p a t i o n r a t e s i n a demand-constrained, s u r p l u s 1 abor market o f a v i l l a g e economy, t h i s paper shows a new method f o r unders tanding t h e e f f i c i e n c y o f workers.
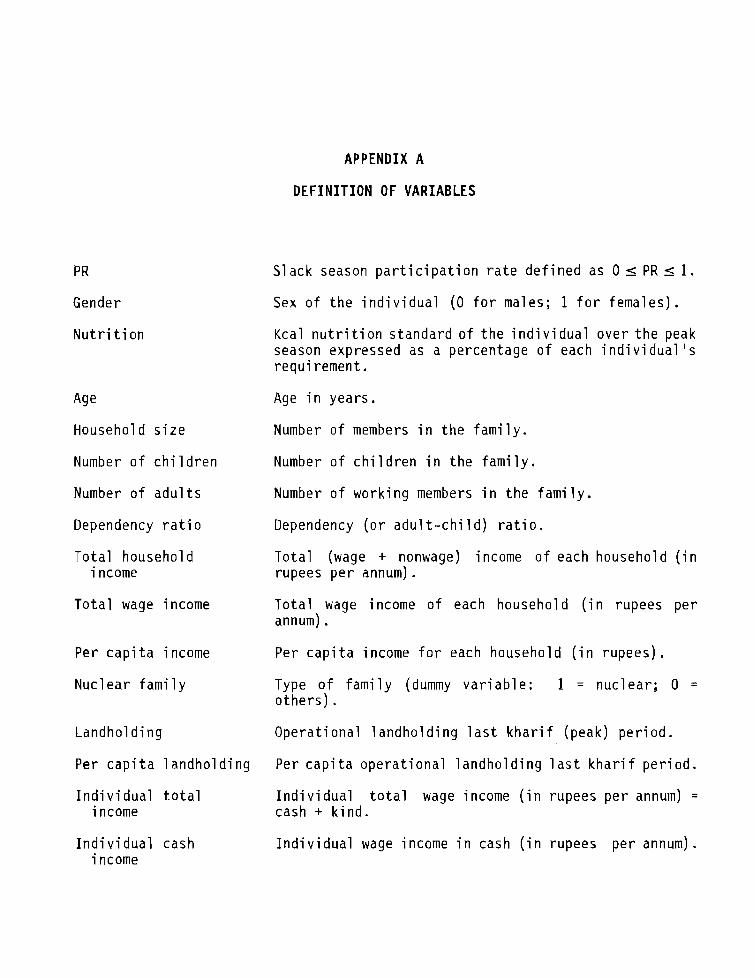
APPENDIX A
D E F I N I T I O N OF VARIABLES
PR
Gender
N u t r i t i o n
Age
Househol d s i z e
Number o f c h i 1 d ren
Number o f a d u l t s
Dependency r a t i o
T o t a l househol d income
T o t a l wage income
Per c a p i t a income
Nuclear fami
Landhold ing
Per c a p i t a 1
1 Y
andhol d i ng
I n d i v i d u a l t o t a l income
I n d i v i d u a l cash i ncome
Slack season p a r t i c i p a t i o n r a t e d e f i n e d as 0 5 PR s 1.
Sex o f t h e i n d i v i d u a l (0 f o r males; 1 f o r females).
Kcal n u t r i t i o n s tandard o f t h e i n d i v i d u a l over t h e peak season expressed as a percentage o f each i n d i v i d u a l ' s r equ i rement . Age i n years .
Number o f members i n t h e f a m i l y .
Number o f c h i l d r e n i n t h e f a m i l y .
Number of work ing members i n t h e f a m i l y .
Dependency ( o r adul t - c h i l d) r a t i o .
To ta l (wage + nonwage) income o f each household ( i n rupees p e r annum).
To ta l wage income o f each household ( i n rupees pe r annum) . Per c a p i t a income f o r each household ( i n rupees) .
Type o f f a m i l y (dummy v a r i a b l e : 1 = nuc lear ; 0 = o t h e r s ) .
Opera t iona l 1 andhol d i n g 1 a s t k h a r i f (peak) p e r i o d .
Per c a p i t a ope ra t i ona l l andho ld i ng l a s t k h a r i f p e r i o d .
I n d i v i d u a l t o t a l wage income ( i n rupees p e r annum) = cash + k i nd .
I n d i v i d u a l wage income i n cash ( i n rupees p e r annum) .

I n d i v i d u a l k i n d I n d i v i d u a l wage income i n k i n d ( i n rupees p e r annurn). i ncome
W e i g h t - f o r - h e i g h t W e i g h t - f o r - h e i g h t expressed as a p r o p o r t i o n o f i n d i v i d u a l ' s requ i rement .
H e i g h t
Weight
H e i g h t expressed as a p r o p o r t i o n o f each i n d i v i d u a l ' s requ i rement ( I n d i a n s tandards ) . Weight expressed as a p r o p o r t i o n o f each i n d i v i d u a l ' s requ i rement ( I n d i a n s tandards) .
Arm c i r c u m f e r e n c e Arm c i r cumference expressed as a p r o p o r t i o n o f each i n d i v i dua l ' s requ i rement .
P r o t e i n P r o t e i n consumption expressed as a p r o p o r t i o n o f each i n d i v i d u a l ' s requ i rement .
OCCUPATIONAL DUMMIES
Base Category A g r i c u l t u r a l 1 abore rs (as p r i m a r y occupa t ion ) . I 4
DUM 1 Farmers (as p r i m a r y occupa t ion ) . DUN2 Permanent se rvan ts . DUM3 Combinat ion o f 0, 1, and 2. DUM4 Shepherds and bus iness. DUM5 Household o r domest ic workers . DUM6 C o n s t r u c t i o n workers.
l 4 Some sma l l 1 andowners have a g r i c u l t u r a l 1 abor as p r i m a r y occupa t ion .

APPENDIX B
FREQUENCIES AND SUMMARY STATISTICS
Table B . 1 - IRHS Data Set: Frequency o f Occupational Categories
Code Description Number Val i d Percentage
0 A g r i c u l t u r a l 1 aborer
1 On own farm
2 Permanent servant
3 0, 1, and 2
4 Shepherd
5 Other business
6 Household work o r none
Total
Source: Author 's c a l cu1 a t i ons .

Table B . 2 - IRHS Data Set : Median Values o f Main Va r i ab les
Vari able Med i an
P a r t i c i p a t i o n r a t e
Landhold ing
Household s i z e
Number o f c h i l d r e n
Number o f a d u l t s
To ta l household income
Household wage income
To ta l household expend i tu re
Household food expend i tu re
N u t r i t i o n
P r o t e i n
Arm c i rcumference
Weigh t - fo r -he i g h t
Weight
He igh t
I n d i v i dual wage i ncome
I n d i v i d u a l k i n d income
I n d i v i d u a l t o t a l income
- -
Source: A u t h o r ' s c a l c u l a t i o n s .

Table B.3 -1RHS Data Set: S m r y Statistics of Person-Specific Variables
Standard Variable Mean Deviation Mininun Maxinun Valid M
Participation rate
Nutrition (calorie)
Protein
Age i n years
Arm circumference
Gender
Individual cash income
Individual kind income
Individual total wage Income
Permanent servants and agricultural workers 0.105 0 .307 0.00 1 .OO 1 72
Domestic worker 0.186 0.390 0.00 1.00 172
Source: Author's calculations.

Table B.4 -1RHS Data Set: Summary Statistics of Household-Specific Variables
Standard Variable Mean Deviation M i n i m Uaximun Valid N
Participation rate
Landholding
Per capita landholding
Household size
No. of children
No. of adults
Nuclear family
Dependency ratio
Per capita income
Total househol.d income
Household wage income
Total household expenditure
Household food expenditure -
Source: Author's calculations.

APPENDIX C
AN LM T E S T FOR HETEROSCEDASTICITY
sec t f o r f o r p roc and
Since i t i s n a t u r a l t o expect t h e problem o f h e t e r o s c e d a s t i c i t y i n c ross - i o n a n a l y s i s o f t h i s k ind , we have developed a Lagrange Mul t i p 1 i e r (LM) Test t h e Two L i m i t T o b i t Model based on t h e h e t e r o s c e d a s t i c i t y t e s t s t h a t e x i s t t h e Standard T o b i t models (see Godfrey 1988). We f o l l o w t h e s tandard edure and s e t up an a l t e r n a t i v e hypo thes is o f t h e t y p e employed by Breusch Pagan (1979). We w r i t e t h e a1 t e r n a t i v e hypo thes is as
where 2, and y a r e k - 1 dimensional v e c t o r s w i t h t h e v a r i a b l e s o f zi, where x', =
(1,~') a r e exogenous and s a t i s f y i n g t h e necessary r e g u l a r i t y c o n d i t i o n s . The f u n c t i o n h( . ) i s assumed t w i c e d i f f e r e n t i a b l e and i s d e f i n e d such t h a t h' (2) = 1. The n u l 1 hypo thes is t o be t e s t e d i s
Thus under t h e n u l l 4 i s a cons tan t and equal t o /?($). L e t (y = (o r , 02, ?') denote t h e parameter v e c t o r f o r t h e a l t e r n a t i v e and 6' = (F, (I2, 0 ' ) denote t h e cons t ra i ned MLE ob ta ined by "imposing 4.
The Log L i k e l i h o o d f o r t h e h e t e r o s c e d a s t i c i t y censored T o b i t model d e f i n e d by ( 1 ) s (31 , and (7) i s
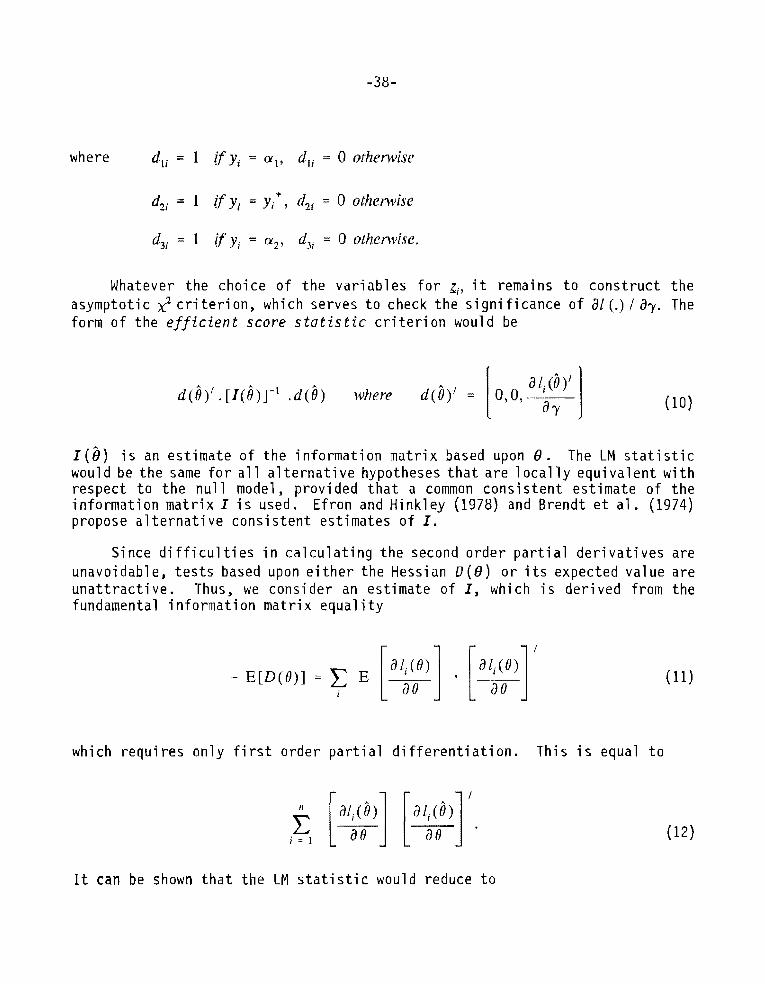
where d,, = 1 ify, = a,, d,. = 0 otherwise
dni = 1 ify. = yi*, r f , , = 0 otherwise
dy = 1 if y, = a*, d3 = 0 otherwise.
Whatever the choice of the variables fo r zi, i t remains t o construct the asymptotic x2 c r i t e r i on , which serves t o check the significance of 91 (.) / Qy. The form of the efficient score statistic c r i t e r i on would be
1(0) i s an estimate of the information matrix based upon 0 . The LM s t a t i s t i c would be the same f o r a l l a l t e rna t ive hypotheses t h a t are loca l ly equivalent w i t h respect t o the null model, provided t h a t a common consistent estimate of the information matrix I i s used. Efron and Hinkley (1978) and Brendt e t a1. (1974) propose a l t e rna t i ve consistent estimates of I.
Since d i f f i c u l t i e s in calculating the second order par t i a1 der ivat ives are unavoidable, t e s t s based upon e i t he r the Hessian D ( 0 ) o r i t s expected value are unat t ract ive . Thus, we consider an estimate of I, which i s derived from the fundamental information matrix equali ty
which requires only f i r s t order par t i a l d i f fe ren t ia t ion . This i s equal t o
I t can be shown t h a t the LM s t a t i s t i c would reduce t o

where i i s the n dimensional vector with every element equal t o unity, (k - 1) i s the number of restr ic t ions, a n d G i s a matrix whose n rows consist of the vectors (31 (6) I 3 (6))' estimated under H ~ . ' ' This variant of the LM procedure i s referred to as the Outer Product of the Gradient (OPG) form of the LM t e s t .
The n vectors & a r e the derivatives of the heteroscedast ic censored T o b i t model and can be calculated as follows:
l 5 Godfrey (1988) demonstrates how the s t a t i s t i c would reduce to t h e above form,

where the individual derivatives are given below, estimated under the nu1 1,
where ui = y , - @xi for < yi* <a2
and 2 hi = a, = h(a2 + -i' Z i ) -
and 0(.) and $(.I denote, respectively, the density function and the d i s t r ibu t ion function of the standard normal d i s t r ibu t ion . Similarly,
and

Following Jarque and Bera (1982) we assume tha t /zt((r2j = 1 under the nu l l , which would enable us t o get the par t ia l der ivat ives in to a t r a c t ab l e and estimable form with no loss of generali ty. The s t a t i s t i c i s equal t o the uncentered R~ x n, where R3' i s calculated by regressing ii (= 1) on g,.. However, t h i s i s not usual ly avai 1 able in standard econometric software used for estima- t ion , as i t i s conventional t o estimate only the centered R' in most regression analysis . We therefore estimate t h i s LM t e s t using a program specia l ly writ ten fo r the present exercise.
The small sample propert ies of the LM t e s t in general, and the OPG variant in par t i cu la r , are very weak; and the t e s t i s very sens i t ive t o problems such as non-normal i t y and omitted variable bias, which are d i s t i n c t from the heteroscedast ic i ty problem the t e s t i s expected t o ident i fy . Even i f we can iden t i fy t ha t a par t i cu la r model f a i l s the diagnostic t e s t , i t i s d i f f i c u l t t o correct i t without adequate information on the exact nature of the problem. Davidson and Mackinnon (1983) argue t ha t the inefficiency in the estimation of the information matrix will tend t o r e su l t in the OPG variant of the LM t e s t s having re1 a t ive ly poor small sample propert ies. They therefore suggest an a l t e rna t ive form of the LM t e s t t ha t they r e f e r t o a s Double Length Regression (DLR) t e s t . However, the OPG version can generally be more eas i ly implemented than the DLR version. Since we do not have the possi bi 1 i t y of using DLR in the case of 1 imi ted dependent variable models we conduct only the OPG version of the LM t e s t in our analysis . l6
Godfrey (1988) provides a discussion of the r e l a t i ve the OPG and DLR methods.
merits and demerits of

REFERENCES
A k e r l o f , G. A., and J. L. Y e l l e n . 1986. " I n t r o d u c t i o n . " I n Efficiency Wage Models of the Labor Market. Cambridge, UK: Cambridge U n i v e r s i t y Press.
Amemiya, T. 1973. "Regress ion A n a l y s i s When t h e Dependent V a r i a b l e i s Truncated Normal ." Econometrica. 41 (6) : 997-1016.
Bardhan, P. K. 1979. "Wages and Unemployment i n a Poor A g r a r i a n Economy: A T h e o r e t i c a l and E m p i r i c a l A n a l y s i s . " Journal of Political Economy. 87(3) : 479-500.
Behrman, J. R., A. B. D e o l a l i k a r , and B. L. Wol fe . 1988. " N u t r i e n t s : Impacts and De te rm inan ts . " The World Bank Economic Review. 2(3) : 299-320.
Berndt , E. K., B. H. H a l l , R. E. H a l l , and J. A. Hausman. 1974. " E s t i m a t i o n and I n f e r e n c e i n Non-1 i n e a r S t r u c t u r a l Models." Annals of Economic and Social Measurement. 3 (4) : 653-665.
Bharadwaj, K. 1974. Production Conditions in Indian Agriculture. Cambridge, UK: Cambridge U n i v e r s i t y Press.
B l i s s , C. J., and N. H. S t e r n . 1978. " P r o d u c t i v i t y , Wages and N u t r i t i o n : The Theory" and "Some Observa t ion . " Journal of Development Economics. 5(4 ) : 331-362; 363-398.
Breusch, T. S., and A. R. Pagan. 1979. "A S imple Tes t f o r H e t e r o s c e d a s t i c i t y and Random C o e f f i c i e n t V a r i a t i o n . " Econometrica. 47 (5) : 1287-1294.
Canagarajah, R. S. 1991. Employment and Consumption Behaviour in a Village Economy: Issues in Imperfect Informat ion and Uncertainty. Ph .D. d i s s e r t a t i o n . Cambridge, UK: U n i v e r s i t y o f Cambridge.
Canagarajah, R. S., and P. Gonz i l ez . 1991. Non-Pr ice R a t i o n i n g and E f f i c i e n c y i n Casual Labor Markets . Cambridge, UK: U n i v e r s i t y o f Cambridge. Photocopy.
Dasgupta, P., and D. Ray. 1986. " I n e q u a l i t y as a De te rm inan t o f M a l n u t r i t i o n and Unemployment: Theory. " Economic Journal. 96 (December) : 1011-1034.
Dasgupta, P., and D. Ray. 1987. " I n e q u a l i t y as a De te rm inan t o f M a l n u t r i t i o n and Unemployment : Pol i c y . " Economic Journal. 97 (March) : 177-188.

Davidson, R., and J. G. MacKi nnon. 1983. "Smal l Sample P r o p e r t i e s o f A1 t e r n a t i ve forms o f t h e Lagrange Mu1 t i p l i e r Test ." Economic Letters. 12(3-4) : 269-275.
Dreze, J., and A. Mukher jee. 1987. "Labor C o n t r a c t s i n Rura l I n d i a : Theor ies and Evidence. " D i scuss i on Paper 7. London : School o f Economics, Development Research Programme.
Ef ron, B . , and D. V . H i n k l e y . 1978. "Assessing t h e Accuracy o f t h e Maximum L i k e l i hood E s t i m a t o r : Observed versus Expected F i s h e r I n f o r m a t i on. " Biometrika. 65(3) : 457-482.
Godfrey, L. G. 1988. Hisspecification Tests in Econometrics. Cambridge, U K : Cambridge U n i v e r s i t y Press.
Goldberger, A. 1981. " L i n e a r Regression A f t e r S e l e c t i o n . " Journal of Econometrics. 15(3) : 357-366.
Greene, W. 1981. "On t h e Asymptot ic B i a s o f t h e O r d i n a r y Leas t Squares E s t i m a t o r o f t h e T o b i t Model ." Econometrica. 49(2) : 505-513.
Greene, W . H. 1989. LIHDEP. Vers ion 5.1. New York: Econometr ic Sof tware, I n c .
Heckman, J . 1974. Shadow P r i c e s , Market Wages and Labor Supply." Econometrica. 42 (4) : 679-694.
Immink, M.D.C., and F. E. V i t e r i . 1981. "Energy I n t a k e and P r o d u c t i v i t y o f Guatemalan Sugar Can C u t t e r s : An E m p i r i c a l Tes t o f E f f i c i e n c y Wage Hypothes is . " P a r t 1 and P a r t 2. Journal of Development Economics. 9(2) : 251-287.
I n s t i t u t e f o r Rura l H e a l t h S t u d i e s . 1984. Dokur 1982-1983 Household Survey. Hyderabad, I n d i a : IRHS.
Jarque, C. M., and A. K . Bera. 1982. " E f f i c i e n t S p e c i f i c a t i o n Tests f o r L i m i t e d Dependent V a r i a b l e Models." Economic Letters. 9(2 ) : 153-160.
Judge, G . G., W. E. G r i f f i t h s , R. C a r t e r H i l l , H. Lutkepohl , H. and T. Lee. 1985. The Theory and Practice of Econometrics, 2nd ed. New York: John Wi ley & Sons.
Le ibens te in , H. 1957. "The Theory of Underdevelopment i n Backward Economies." Journal of Political Economy. 65(2): 91-103.
Maddala, G . S. 1977. Econometrics. New York: McGraw-Hi l l .
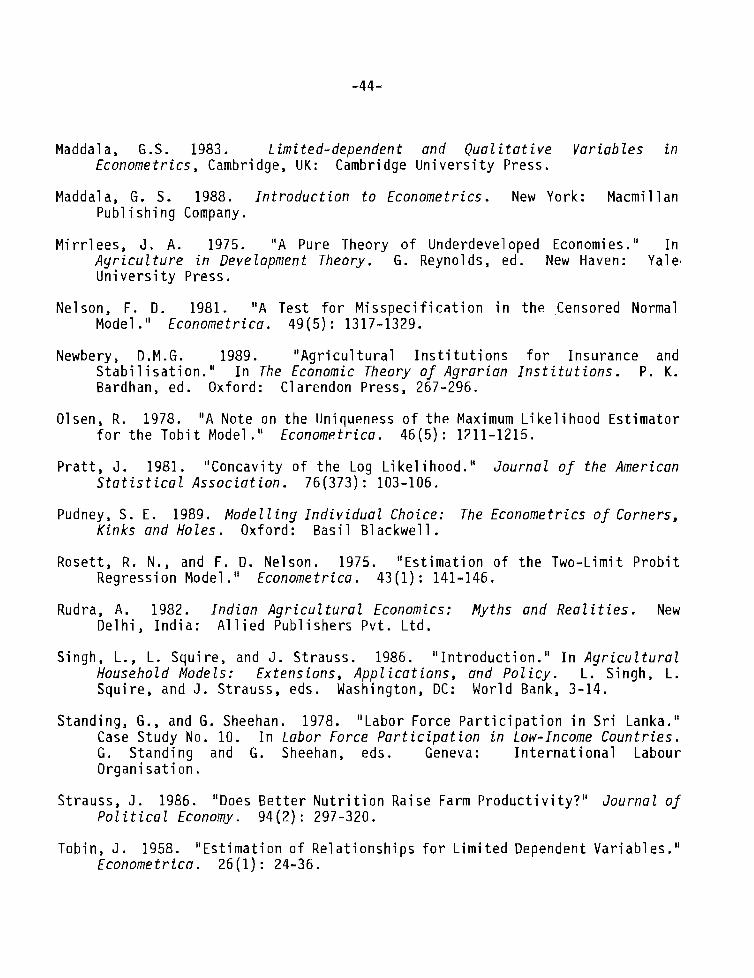
Maddala, G.S. 1983. Limi ted-dependent and Qua1 itative Variables in Econometrics, Cambridge, U K : Cambridge U n i v e r s i t y Press.
Maddal a, G . S. 1988. Introduction to Econometrics. New York: Macmi 11 an Pub1 i s h i n g Company.
M i r r l e e s , J . A. 1975. "A Pure Theory o f Underdeveloped Economies." I n Agriculture in Development Theory. G. Reynolds, ed. New Haven: Yale' U n i v e r s i t y Press.
Nelson, F. D. 1981. "A Test f o r M i s s p e c i f i c a t i o n i n t h e Censored Normal Model . " Econometrica. 49(5) : 1317-1329.
Newbery, D.M.G. 1989. " A g r i c u l t u r a l I n s t i t u t i o n s f o r Insurance and S t a b i 1 i sa t i on . " I n The Economic Theory of Agrarian Institutions. P. K. Bardhan, ed . Oxford: C l arendon Press, 267-296.
Olsen, R. 1978. " A Note on t h e Uniqueness o f t h e Maximum L i k e l i h o o d Es t ima to r f o r t h e T o b i t Model . " Econometrica. 46(5) : 1211-1215.
P r a t t , J. 1981. "Concav i t y o f t h e Log L i k e l i h o o d . " Journal of the American Statistical Association. 76(373) : 103-106.
Pudney, S. E. 1989. Modelling Individual Choice: The Econometrics of Corners, Kinks and Holes. Oxford: Basi 1 B l ackwel l .
Roset t , R. N., and F. D. Nelson. 1975. "Es t ima t i on o f t h e Two-Limit P r o b i t Regression Model." Econometrica. 43(1): 141-146.
Rudra, A. 1982. Indian Agricultural Economics: Myths and Realities. New Del h i , I n d i a : A1 1 i e d Pub1 i shers Pv t . L t d .
Singh, L., L. Squ i re , and J. S t rauss . 1986. " I n t r o d u c t i o n . " I n Agricultural Household Models: Extensions, Applications, and Pol icy. L. Singh, L. Squi re , and J. St rauss, eds. Washington, DC: World Bank, 3-14.
Standing, G . , and G. Sheehan. 1978. "Labor Force P a r t i c i p a t i o n i n S r i Lanka." Case Study No. 10. I n Labor Force Participation in Low-Income Countries. G. S tand ing and G. Sheehan, eds. Geneva: I n t e r n a t i o n a l Labour Organi s a t i on.
St rauss, J. 1986. "Does B e t t e r N u t r i t i o n Raise Farm P r o d u c t i v i t y ? " Journal of Political Economy. 94(2): 297-320.
Tobin, J . 1958. "Es t ima t i on o f Re la t i onsh ips f o r L i m i t e d Dependent Var iab les . " Econometrica. 26(1): 24-36.