
1.0 Acid and base
33
1 Acid and Base 7 Equilibria 7.2 Ionic equilibria Acid and base
Transcript of 1.0 Acid and base

1
Acid and Base
7 Equilibria
7.2 Ionic equilibria
Acid and base

2
Cambridge International AS and A Level Chemistry 9701 syllabus Syllabus content
25Back to contents page www.cie.org.uk/alevel
7 Equilibria
This topic illustrates that many chemical reactions are reversible and involve an equilibrium process. The consideration of the many factors that can affect an equilibrium is an important aspect of physical chemistry.
Learning outcomesCandidates should be able to:
7.1 Chemical equilibria: reversible reactions; dynamic equilibrium
a) explain, in terms of rates of the forward and reverse reactions, what is meant by a reversible reaction and dynamic equilibrium
b) state Le Chatelier’s principle and apply it to deduce qualitatively (from appropriate information) the effects of changes in temperature, concentration or pressure on a system at equilibrium
c) state whether changes in temperature, concentration or pressure or the presence of a catalyst affect the value of the equilibrium constant for a reaction
d) deduce expressions for equilibrium constants in terms of concentrations, Kc , and partial pressures, Kp (treatment of the relationship between Kp and Kc is not required)
e) calculate the values of equilibrium constants in terms of concentrations or partial pressures from appropriate data
f) calculate the quantities present at equilibrium, given appropriate data (such calculations will not require the solving of quadratic equations)
g) describe and explain the conditions used in the Haber process and the Contact process, as examples of the importance of an understanding of chemical equilibrium in the chemical industry
Cambridge International AS and A Level Chemistry 9701 syllabus Syllabus content
26 www.cie.org.uk/alevel Back to contents page
7.2 Ionic equilibria a) show understanding of, and use, the Brønsted-Lowry theory of acids and bases, including the use of the acid-I base-I, acid-II base-II concept
b) explain qualitatively the differences in behaviour between strong and weak acids and bases and the pH values of their aqueous solutions in terms of the extent of dissociation
c) explain the terms pH, Ka, pKa and Kw and use them in calculations
d) calculate [H+(aq)] and pH values for strong and weak acids and strong bases
e) explain the choice of suitable indicators for acid-base titrations, given appropriate data
f) describe the changes in pH during acid-base titrations and explain these changes in terms of the strengths of the acids and bases
g) (i) explain how buffer solutions control pH
(ii) describe and explain the uses of buffer solutions, including the role of HCO3
– in controlling pH in blood
h) calculate the pH of buffer solutions, given appropriate data
i) show understanding of, and use, the concept of solubility product, Ksp
j) calculate Ksp from concentrations and vice versa
k) show understanding of the common ion effect
7.3 Partition coefficients a) state what is meant by partition coefficient; calculate and use a partition coefficient for a system in which the solute is in the same molecular state in the two solvents

31
5. Bronsted-Lowry Theory
Bronsted-Lowry Theory:
•An acid is a proton (hydrogen ion) donor.
• A base is a proton (hydrogen ion) acceptor.
1
146 8 Equilibrium
NH3(g) + H2O(l) NH4 +(aq) + OH–(aq)
acid base
H+ donated
If a reactant is linked to a product by the transfer of a proton we call this pair a conjugate pair. Consider the following reaction:
HCl(g) + H2O(l) H3O+(aq) + Cl–(aq)acid acid base base
conjugate pair
conjugate pair
Looking at the forward reaction:• Cl− is the conjugate base of the acid HCl• H3O+ is the conjugate acid of the base H2O.Looking at the reverse reaction:• HCl is the conjugate acid of the base Cl−
• H2O is the conjugate base of the acid H3O+.In a conjugate pair, the acid has one proton more.
" e conjugate pairs for the equilibrium between ammonia and water to form ammonium ions and hydroxide ions are:
NH3(g) + H2O(l) NH4 +(aq) + OH–(aq)
base acid acid base
conjugate pair
conjugate pair
When an acid or base reacts with water, an equilibrium mixture is formed. For acids such as hydrochloric acid, the position of equilibrium is almost entirely in favour of the products. But for ammonia the position of equilibrium favours the reactants. " e equations can be written to show this. For example:
HCl(g) + aq → H+(aq) + Cl−(aq)
A forward arrow is used as this reaction goes to completion.
NH3(g) + H2O(l) NH4+(aq) + OH−(aq)
An equilibrium arrow is used as this reaction does not go to completion.
Even corrosive acids such as nitric acid can act as bases! When sulfuric acid and nitric acid react in an inert solvent, the following equilibrium is set up:
H2SO4 + HNO3 HSO4− + H2NO3
+
Nitric acid is acting as a proton acceptor, so it is a base.
Fact fi le
14 Identify which reactants are acids and which are bases in the following reactions:a NH4
+ + H2O NH3 + H3O+
b HCOOH + HClO2 HCOOH2+ + ClO2
−
Check-up
Conjugate acids and conjugate basesIn a reaction at equilibrium, products are being converted to reactants at the same rate as reactants are being converted to products. " e reverse reaction can also be considered in terms of the Brønsted–Lowry theory of acids and bases.
Consider the reaction:
NH3(g) + H2O(l) NH4+(aq) + OH−(aq)
In the reverse reaction, the NH4+ ion donates a proton
to the OH− ion. So NH4+ is acting as an acid and OH− is
acting as a base.
15 a Identify the acid and the base on the right-hand side of these equilibria.i H ClO2 + HCOOH
ClO2− + HCOOH2
+
ii H2S + H2O HS− + H3O+
b Identify the acid on the right-hand side of this equation which is conjugate with the base on the left-hand side.
CH3NH2 + H2O CH3NH3+ + OH−
Check-up
5. Strength of conjugatesConsider hydrochloric acid - the often cited strong acid. HCl is a strong acid because in water solution it dissociates (nearly) completely into chloride ion and hydrogen protons.
The equilibrium position lies so far to the right that we usually assume that the HCl molecule completely dissociates in water. This means that the reverse reaction does not occur to any appreciable extent, that is Cl- does not accept a proton from H3O+. This makes Cl- must be a weak base, it has very little tendency to accept a proton.
3
HCl(aq) + H2O ➔ H3O+(aq) + Cl-(aq)
5. Bronsted-Lowry Theory
The Lewis Theory of acids and bases states that:
An acid is an electron pair acceptor.
A base is an electron pair donor.
The two theories are entirely consistent.
2
H F
H - ily→If - e
H F
Bilal Hameed MarginalizerBilal Hameed Acid and base

4 2
5. Strength of conjugates
The conjugate base of a strong acid is a weak base, and
the conjugate base of a weak acid is a strong base.
Conversely,
The conjugate acid of a strong base is a weak acid, and
the conjugate acid of a weak base is a strong acid.
4
5. Strong acidsWhen an acid dissolves in water, a proton (hydrogen ion) is transferred to a water molecule to produce a hydroxonium ion and a negative ion.
These reactions are all reversible, but in some cases, the acid is so good at giving away hydrogen ions that we can think of the reaction as being one-way.
6
HA + H2O ➔ H3O+ + A-
5. Strong acidsWe’ll now look at the terms strong and weak as applied to acids. As a part of this it defines and explains what is meant by pH, Ka and pKa.
It is important that you don't confuse the words strong and weak with the terms concentrated and dilute.
The strength of an acid is related to the proportion of it which has reacted with water to produce ions. This tells you about how much of the original acid is dissolved in the solution. It is perfectly possible to have a concentrated solution of a weak acid, or a dilute solution of a strong acid.
5
Marginalizer Bilal HameedAcid and base Bilal Hameed

53
5. Strong acidsFor example, when hydrogen chloride dissolves in water to make hydrochloric acid, so little of the reverse reaction happens that we can write:
At any one time, virtually 100% of the hydrogen chloride will have reacted to produce hydroxonium ions and chloride ions. Hydrogen chloride is described as a strong acid.
A strong acid is one which is fully ionised in solution.
7
HCl(g) + H2O(l) ➔ H3O+(aq) + Cl-(aq)
5. pHpH is a measure of the concentration of hydrogen ions in a solution.
Strong acids like hydrochloric acid at the sort of concentrations you normally use in the lab have a pH around 0 to 1. The lower the pH, the higher the concentration of hydrogen ions in the solution.
Where [H+] is the concentration of H+ ions.
pH has no units.
9
pH = -log10[H+]
5. Strong acidsOther common strong acids include sulphuric acid and nitric acid.
You may find the equation for the ionisation written in a simplified form:
This shows the hydrogen chloride dissolved in the water splitting to give hydrogen ions in solution and chloride ions in solution.
8
HCl(aq) ➔ H+(aq) + Cl-(aq)
Bilal Hameed MarginalizerBilal Hameed Acid and base

6 4
5. ExampleCalculate the pH of a solution of HCl of concentration 0.135 moldm-3
Ratio of HCl:H+ ions is 1:1
[H+] = 0.135 moldm-3
pH = -log10[H+]
= -log10(0.135) = 0.87
10
HCl(aq) ➔ H+(aq) + Cl-(aq)
5. Skill checkCalculate the pH of the following solutions.
12
Chemical [Conc] moldm-3
i Hydrochloric acid 0.01ii Sulfuric acid 0.025iii Hydrochloric acid 1.0iv Sulfuric acid 1.0
5. ExampleCalculate the pH of a solution of H2SO4 of concentration of 0.20 moldm-3
Ratio of H2SO4:H+ ions is 1:2
[H+] = 2(0.20) moldm-3
[H+] = 0.40 moldm-3
pH = -log10[H+]
= -log10(0.40) = 0.87
11
H2SO4 ➔ 2H+ + SO42-
Marginalizer Bilal HameedAcid and base Bilal Hameed

75
5. Skill checkFind pH and rank them from lowest to highest.
13
Acid Concentration / moldm-3 pH Order
(a) H+(aq) 0.001
(b) H+(aq) 1.00 x 10⁻¹²
(c) HCl(aq) 1.00
(d) HNO3(aq) 2.00 x 10⁻⁴
5. Skill checkThe pH of human blood is 7.40. What is the aqueous hydrogen ion concentration in blood?
15
5. pHTo find the concentration of H+ ions. We can simply reverse the equation. We’ll get:
14
[H+] = 10-pH
Bilal Hameed MarginalizerBilal Hameed Acid and base

8 6
5. Weak acidsA weak acid is one which doesn't ionise fully when it is dissolved in water.
Ethanoic acid is a typical weak acid.
It reacts with water to produce hydroxonium ions and ethanoate ions, but the back reaction is more successful than the forward one.
16
CH3COOH + H2O ➔ H3O+ + CH3COO-
5. The acid dissociation constant, Ka
You can get a measure of the position of an equilibrium by writing an equilibrium constant for the reaction. The lower the value for the constant, the more the equilibrium lies to the left.
The dissociation (ionisation) of an acid is an example of a homogeneous reaction. Everything is present in the same phase - in this case, in solution in water. You can therefore write a simple expression for the equilibrium constant, Kc.
18
5. Weak acids
At any one time, only about 1% of the ethanoic acid molecules have converted into ions. The rest remain as simple ethanoic acid molecules.
Most organic acids are weak.The position of equilibrium of the reaction between the acid and water varies from one weak acid to another. The further it lies to the left, the weaker the acid is.
17
CH3COOH + H2O ⇌ H3O+ + CH3COO-
Marginalizer Bilal HameedAcid and base Bilal Hameed

97
5. The acid dissociation constant, Ka
The equilibrium of a weak acid can be written as:
The Kc for a weak acid becomes:
At the bottom of the expression, you have a term for the concentration of the water in the solution. That's not a problem - except that the number is going to be very large compared with all the other numbers.
19
Kc =[H3O+][A-]
[HA][H2O]
HA + H2O ⇌ H3O+ + A-
5. The acid dissociation constant, Ka
This new equilibrium constant is called Ka.
You may find the Ka expression written differently if you work from the simplified version of the equilibrium reaction:
21
Ka =[H3O+][A-]
[HA]
Ka =[H+][A-]
[HA]
5. The acid dissociation constant, Ka
In 1 dm3 of solution, there are going to be about 55 moles of water.
If you had a weak acid with a concentration of about 1 mol dm-3, and only about 1% of it reacted with the water, the number of moles of water is only going to fall by about 0.01. In other words, if the acid is weak the concentration of the water is virtually constant.
In that case, there isn't a lot of point in including it in the expression as if it were a variable. Instead, a new equilibrium constant is defined which leaves it out.
20
Bilal Hameed MarginalizerBilal Hameed Acid and base
10 8
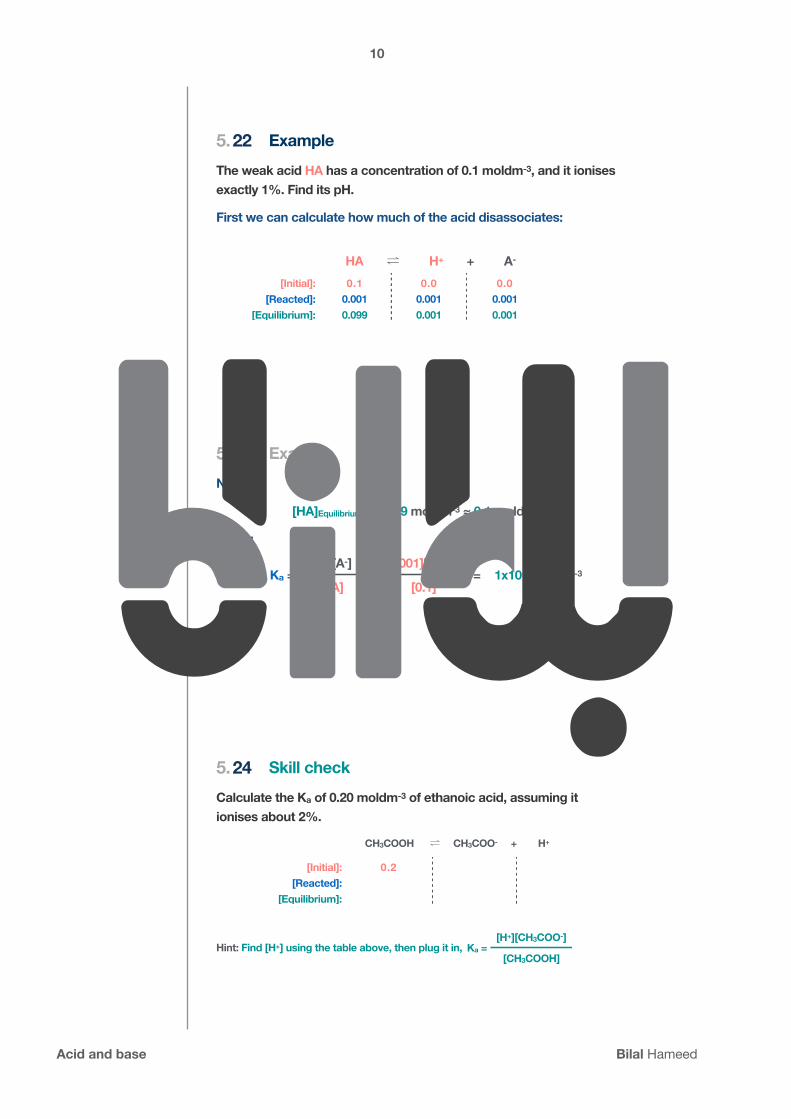
5. ExampleThe weak acid HA has a concentration of 0.1 moldm-3, and it ionises exactly 1%. Find its pH.
First we can calculate how much of the acid disassociates:
22
HA ⇌ H+ + A-
[Initial]: 0.1 0.0 0.0[Reacted]: 0.001 0.001 0.001
[Equilibrium]: 0.099 0.001 0.001
5. Skill checkCalculate the Ka of 0.20 moldm-3 of ethanoic acid, assuming it ionises about 2%.
Hint: Find [H+] using the table above, then plug it in,
24
CH3COOH ⇌ CH3COO- + H+
[Initial]: 0.2[Reacted]:
[Equilibrium]:
Ka =[H+][CH3COO-]
[CH3COOH]
5. ExampleNow,
[HA]Equilibrium = 0.099 moldm-3 ≈ 0.1 moldm-3
Using:
23
Ka =[H+][A-]
= [0.001][0.001]
= 1x10⁻⁵ moldm-3
[HA] [0.1]
Marginalizer Bilal HameedAcid and base Bilal Hameed
119
5. Skill check25
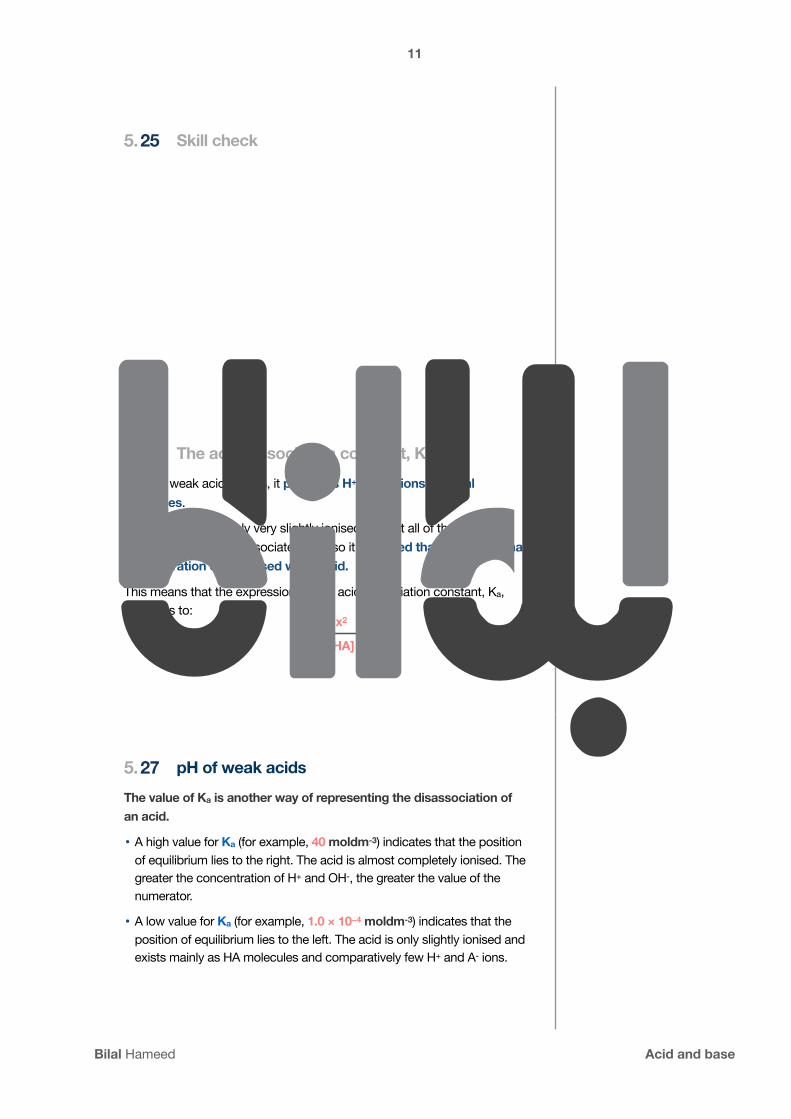
5. pH of weak acidsThe value of Ka is another way of representing the disassociation of an acid.
• A high value for Ka (for example, 40 moldm-3) indicates that the position of equilibrium lies to the right. The acid is almost completely ionised. The greater the concentration of H+ and OH-, the greater the value of the numerator.
• A low value for Ka (for example, 1.0 × 10⁻⁴ moldm-3) indicates that the position of equilibrium lies to the left. The acid is only slightly ionised and exists mainly as HA molecules and comparatively few H+ and A- ions.
27
5. The acid dissociation constant, Ka
When a weak acid ionises, it produces H+ and A- ions in equal quantities.
As weak acids are only very slightly ionised, almost all of the acid molecules remain undissociated, and so it assumed that [HA] = original concentration of unionised weak acid.
This means that the expression for the acid dissociation constant, Ka, simplifies to:
26
Ka =x2
[HA]
Bilal Hameed MarginalizerBilal Hameed Acid and base

12 10
5. pH of weak acidsThe table shows some values of Ka for some simple acids:
Is the pH increasing or decreasing down the table?
28
Acid Ka
hydroflouric acid 5.6 x 10⁻⁴
methanoic acid 1.6 x 10⁻⁴
ethanoic acid 1.7 x 10⁻⁵
hydrogen sulphide 8 x 10⁻⁸
5. pH of weak acidsCalculate the pH of a 0.123 moldm-3 solution of ethanoic acid. Ka for ethanoic acid is 1.7 x 10⁻⁵
30
Ka =[H+][CH3COO-]
[CH3COOH]
[H+] = [CH3COO-] = x, and [CH3COOH] = 0.123 moldm-3
1.7 x 10-5 =[x2]
[0.123]x = 0.00145 moldm-3
pH = -log10[0.00145] = 2.84
5. pH of weak acidsThe pH of a solution of a weak acid of known concentration can be calculated from the value of Ka.
29
Marginalizer Bilal HameedAcid and base Bilal Hameed

1311
5. Skill checkCalculate the pH of a solution of 0.1 moldm-3 ethanoic acid at 25℃. The acid dissociation constant of ethanoic acid at 25℃ is 1.8 x10⁻⁵ moldm-3.
31
5. Skill checkThe pH of 0.1 moldm-3 methanoic acid is 2.4 at 25℃. What is the dissociation constant of methanoic acid at this temperature?
33
5. Skill checkA solution of propanoic acid, C2H5COOH, of concentration 0.222 moldm-3 has a pH of 2.77. Calculate the Ka of propanoic acid.
32
Bilal Hameed MarginalizerBilal Hameed Acid and base

14 12
5. Skill checkThe pH of a 0.1 moldm-3 solution of CH3CO2H is 2.4, and the pH of 0.1 moldm-3 HCl is 1.0.
(i) Calculate the ratio of hydrogen ions concentrations in these two solutions.
(ii) However, when 100 cm3 of 0.1 moldm-3 CH3CO2H is reacted with an excess of zinc powder, the same volume of hydrogen (120 cm3) is evolved as when 100 cm3 of 0.1 moldm-3 HCl is used. Explain why this is so.
34
5. Skill checkThe pH of 0.100 in moldm-3 sulphuric acid is 0.98.
(a) Calculate the concentration of hydrogen ions, H+, in this solution.
(b) Write equations to show the two successive ionisations of sulphuric acid, H2SO4, in water.
(c) Suggest why the concentration of hydrogen ions is not 0.20 in moldm-3 in 0.100 in moldm-3 sulphuric acid.
36
5. Skill check35
Marginalizer Bilal HameedAcid and base Bilal Hameed
1513
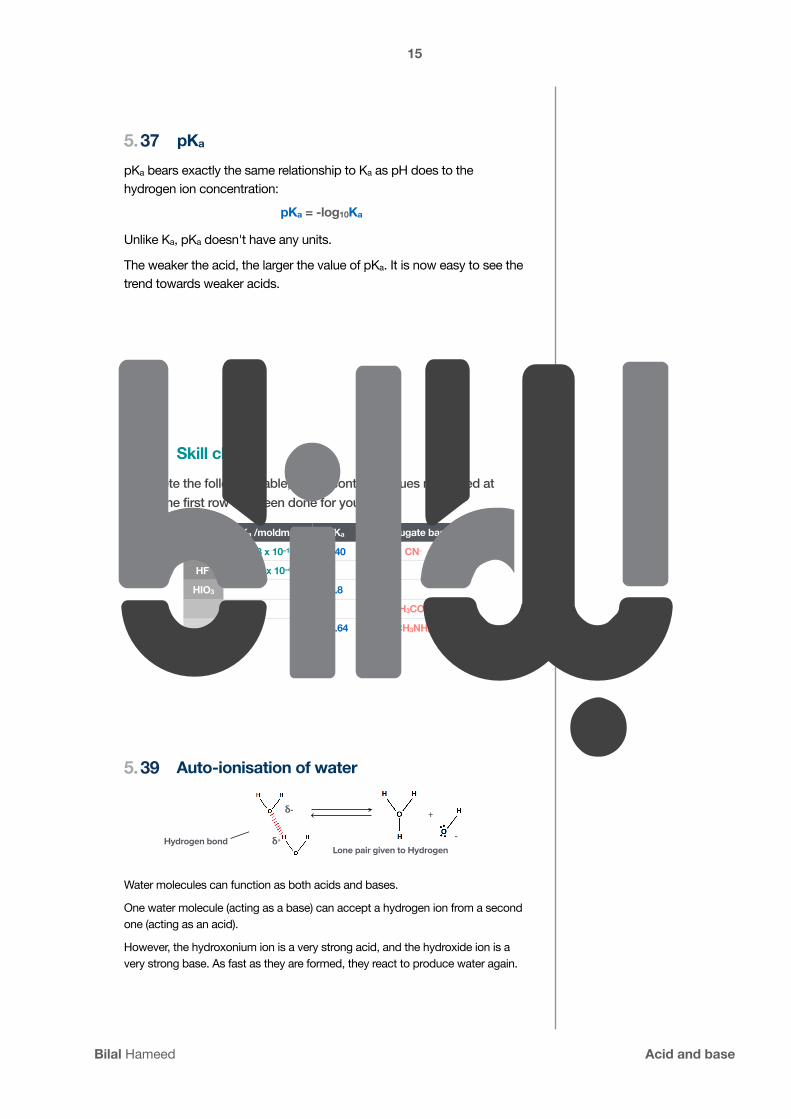
5. pKa
pKa bears exactly the same relationship to Ka as pH does to the hydrogen ion concentration:
Unlike Ka, pKa doesn't have any units.
The weaker the acid, the larger the value of pKa. It is now easy to see the trend towards weaker acids.
37
pKa = -log10Ka
5. Auto-ionisation of water
Water molecules can function as both acids and bases.
One water molecule (acting as a base) can accept a hydrogen ion from a second one (acting as an acid).
However, the hydroxonium ion is a very strong acid, and the hydroxide ion is a very strong base. As fast as they are formed, they react to produce water again.
39
δ-
δ+Hydrogen bond
+
-
Lone pair given to Hydrogen
5. Skill checkComplete the following table, which contains values measured at 25°C. The first row has been done for you:
38
Acid Ka /moldm-3 pKa congugate base
HCN 3.98 x 10⁻¹⁰ 9.40 CN-
HF 5.62 x 10⁻⁴
HIO3 0.8
CH3COO-
10.64 CH3NH2
Bilal Hameed MarginalizerBilal Hameed Acid and base

16 14
5. Auto-ionisation of waterThe net effect is that in pure water, the following equilibrium exists:
This is known as self-ionisation or auto ionisation.
Pure water conducts current slightly showing that it contains ions.
40
30120 Ionic equilibria
20 Ionic equilibria
Learning outcomesCandidates should be able to:
explain the terms pH, pKa and Kw and use them in calculations
calculate [H+(aq)] and pH values for strong and weak acids and strong bases
explain the choice of suitable indicators for acid–base titrations, given appropriate data
describe the changes in pH during acid-base titrations and explain these changes in terms of the strengths of the acids and bases
explain how buffer solutions control pH
describe and explain the uses of buffer solutions, including the role of HCO3
− in controlling pH in the blood calculate the pH of buffer solutions, given appropriate data show understanding of and use the concept of solubility product, Ksp
calculate Ksp from concentrations and vice versa show understanding of the common ion effect.
20.1 IntroductionIn Chapter 8 (page 147) we learned that acids and bases can be classed as strong or weak.• Strong acids ionise completely in water. For example,
hydrochloric acid solution consists entirely of H3O+(aq) and Cl−(aq):
HCl(g) + H2O(l) → H3O+(aq) + Cl−(aq)
• Weak acids only ionise to a small extent in water. For example, ethanoic acid solution consists mostly of un-ionised CH3COOH(aq):
CH3COOH(aq) + H2O(l) CH3COO−(aq) + H3O+(aq)
" e pH of the resulting solutions can be related to the concentration of H3O+ ions formed.
In this chapter:• we shall use hydrogen ion concentrations to calculate
pH values for solutions of strong acids• we will use equilibrium expressions to calculate
hydrogen ion concentrations for solutions of weak acids, in order to calculate their pH values
• we shall also learn about ionic equilibria related to the solubility of salts.
The ionic product of water, Kw
Water is able to act as either an acid (by donating protons, H+) or a base (by accepting protons). In pure water, the following equilibrium exists.
H2O(l) + H2O(l) H3O+(aq) + OH–(aq)acid
H+ donated
base
We can simplify this equation by writing hydroxonium ions, H3O+, as simple hydrogen ions, H+:
H2O(l) H+(aq) + OH−(aq)
Figure 20.1 Compost in a compost bin. The pH of compost changes as the plant material is broken down by bacterial action. The chemical reactions in compost involve weak acids and weak bases.
5. Ionic product of water, Kw
The extent of ionisation of water is very low. The concentration of hydrogen ions and hydroxide ions in pure water (and hence the value of Kc) is extremely small.
So little of the water is ionised at any one time, that its concentration remains virtually unchanged - a constant. Kw is defined to avoid making the expression unnecessarily complicated by including another constant in it. We can therefore incorporate this into the value of Kc:
Kc[H2O] is taken as Kw
42
5. Ionic product of water, Kw
The equation:
Can be simplified to:
Applying equilibrium law:
41
H2O + H2O ⇌ H3O+(aq) + OH-(aq)
H2O ⇌ H+(aq) + OH-(aq)
Kc =[H+][OH-]
[H2O]
Marginalizer Bilal HameedAcid and base Bilal Hameed

1715
5. Ionic product of water, Kw
We can therefore incorporate this into the value of Kc:
Kc[H2O] is taken as Kw
This constant Kw is referred to as ionic product of water.
43
Kw = [H+][OH-]
5. Ionic product of water, Kw
The dissociation of water is an endothermic process. Hence increase of temperature will increase the extent of ionisation and hence Kw would increase with increase of temperature.
45
H2O ⇌ H+ + OH- ΔH = + ve
Kw increases at high temperature: At 100oC Kw = 5.13 x 10⁻¹³ mol2dm-6
Kw decreases at low temperature: At 0oC Kw = 1.1 x 10⁻¹⁵ mol2dm-6
5. Ionic product of water, Kw
At 298 K , [H+] in water = 1 x10⁻⁷ moldm-3
The constant Kw = 1 x10-14 mol2 dm-6 at room temperature and pressure.
44
Kw = [H+][OH-] = [1 x10⁻⁷][1 x10⁻⁷] = 1 x10-14 mol2dm-6
[H+] = [OH-]
Bilal Hameed MarginalizerBilal Hameed Acid and base

18 16
5. Skill checkCalculate the pH of pure water. Take Kw = 1 x10-14 mol2 dm-6.
46
5. Ionic product of water, Kw
Table shows how [H+] and [OH-] vary:
48
[H+] 100 10-1 10-2 10-3 10-4 10-5 10-6 10-7 10-8 10-9 10-10 10-11 10-12 10-13 10-14
[OH-] 10-14 10-13 10-12 10-11 10-10 10-9 10-8 10-7 10-6 10-5 10-4 10-3 10-2 10-1 100
pH 0 1 2 3 4 5 6 7 8 9 10 11 12 13 14
STRONGLY ACIDIC
WEAKLY ACIDIC
NEUTRAL WEAKLY ALKALINE
STRONGLY ALKALINE
pH = -log10[H+]
5. Ionic product of water, Kw
In aqueous solutions if [H+] increases then [OH-] would decrease in order to keep the value of Kw constant:
[H+] > [OH-] then the solution is acidic.
[H+] < [OH-] then the solution is basic.
[H+] = [OH-] then the solution is neutral.
47
Marginalizer Bilal HameedAcid and base Bilal Hameed

1917
5. Skill check
What is the pH of a 0.050 moldm-3 solution of sodium hydroxide at 298 K?
49
5. pH of strong basesA strong base is something like NaOH or KOH which is fully ionic. You can think of the compound as being 100% split up into metal ions and hydroxide ions in solution.
Some strong bases like CaOH aren't very soluble in water. That doesn't matter. What does dissolve is still 100% ionised into calcium ions and hydroxide ions. Calcium hydroxide still counts as a strong base because of that 100% ionisation.
51
NaOH ⇌ Na+ + OH-
5. pOH, alternative approachAnother way to calculate the pH of a base is by finding the pOH first.
50
[H+][OH-] = Kw
log10[H+] + log10[OH-] = log10Kw
- log10[H+] - log10[OH-] = -log10[10-14]
pH + pOH = 14
Bilal Hameed MarginalizerBilal Hameed Acid and base

20 18
5. ExampleThe pH can be worked out in either of the two ways:
52
Calculate [OH-], then [H+] using: Calculate [OH-], then pOH using:
10-14 = [H+][OH-] pOH = -log10[OH-] Then, Then,
pH = -log10[H+] pH = 14 − pOH
5. Skill checkCalculate the pH of a 0.136 moldm-3 solution of barium hydroxide,
Ba(OH)2
54
5. Skill checkCalculate the pH of a 0.123 moldm-3 solution of sodium hydroxide.
53
Marginalizer Bilal HameedAcid and base Bilal Hameed

2119
5. Skill checkCalculate the pH of a saturated solution of calcium hydroxide which contains 2.78 gdm-3 of the base.
55
5. Skill checkCalculate the pH of the following solutions:
(a) 0.015 moldm−3 NaOH
(b) 0.050 moldm−3 Ba(OH)2
57
5. Skill checkCalculate the pOH of the following solutions:
(a) 0.030 moldm−3 KOH
(b) 0.500 moldm−3 NaOH
(c) 0.020 moldm−3 HCl
56
Bilal Hameed MarginalizerBilal Hameed Acid and base

22 20
5. Skill checkFor each of the following reactions:
(i) Identify the two acids and the two bases (ii)Suggest with reasons, which ion or molecule is the stronger
acid, and which the stronger base.
58
NH3 + H2O ⇌ NH4+ + OH- Kc = 1.8 x 10⁻⁵ mol-3
C6H5O- + CH3CO2H ⇌ C6H5OH + CH3CO2- Kc = 1.3 x 10⁴ moldm-3
5. pH curvesFor example, if you were titrating NaOH solution with HCl, both with a concentration of 1 moldm-3, 25 cm3 of NaOH solution would need exactly the same volume of the acid - because they react 1 : 1 according to the equation.
In this particular instance, this would also be the neutral point of the titration, because NaCl solution has a pH of 7.
But that isn't necessarily true of all the salts you might get formed.
60
5. pH curvesWhen you carry out a simple acid-base titration, you use an indicator to tell you when you have the acid and alkali mixed in exactly the right proportions to neutralise each other. When the indicator changes colour, this is often described as the end point of the titration.
In an ideal world, the colour change would happen when you mix the two solutions together in exactly equation proportions. That particular mixture is known as the equivalence point.
59
Marginalizer Bilal HameedAcid and base Bilal Hameed

2321
5. pH curvesFor example, if you titrate ammonia solution with HCl, you would get NH4Cl formed. The NH4+ ion is slightly acidic, and so pure ammonium chloride has a slightly acidic pH.
That means that at the equivalence point (where you had mixed the solutions in the correct proportions according to the equation), the solution wouldn't actually be neutral. To use the term neutral point in this context would be misleading.
61
5. pH curvesTo summarise,
• The term neutral point is best avoided.
• The term equivalence point means that the solutions have been mixed in exactly the right proportions according to the equation.
• The term end point is where the indicator changes colour. As you will see on the page about indicators, that isn't necessarily exactly the same as the equivalence point.
63
5. pH curvesSimilarly, if you titrate NaOH solution with CH3COOH, at the equivalence point the pure sodium ethanoate formed has a slightly alkaline pH because the ethanoate ion is slightly basic.
62
Bilal Hameed MarginalizerBilal Hameed Acid and base
24 22
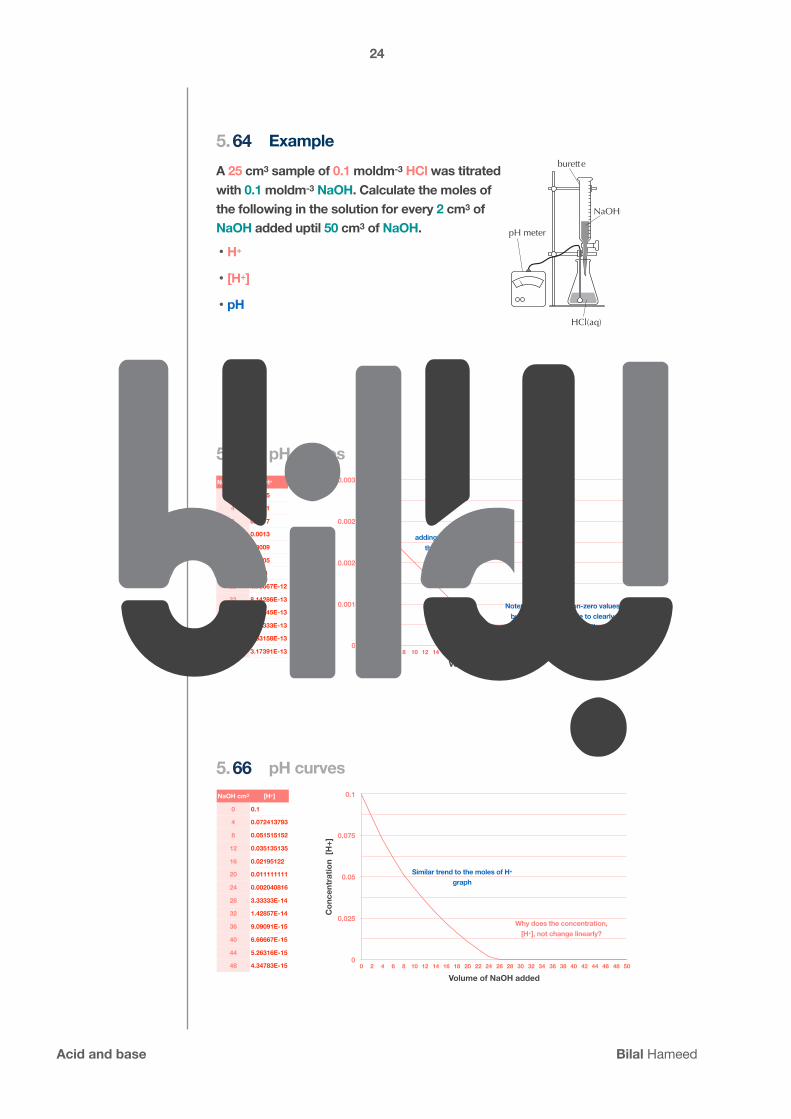
5. ExampleA 25 cm3 sample of 0.1 moldm-3 HCl was titrated with 0.1 moldm-3 NaOH. Calculate the moles of the following in the solution for every 2 cm3 of NaOH added uptil 50 cm3 of NaOH.
• H+
• [H+]
• pH
64
52 Acids and bases
Titration curves and indicators
WEAK ACID – STRONG BASE TITRATIONConsider titrating 50.0 cm3 of 1.0 mol dm–3 CH3COOHwith 1.0 mol dm–3 NaOH.
Ka = 1.8 × 10⁻⁵. Making the usual assumptions the initial[H+] = Ka × [CH3COOH] and pH = 2.37.
When 49.0 cm3 of the 1.0 mol dm–3 NaOH has beenadded [CH3COO–] ≈ 0.05 mol dm–3 and [CH3COOH] ≈ 1.0 × 10⁻² mol dm–3.
[H+] =Ka × [CH3COOH]
≈1.8 × 10–5 × 1 × 10–3
[CH3COO–] 0.05
= 3.6 × 10⁻⁷ mol dm–3 and pH = 6.44
After the equivalence point the graph will follow the samepattern as the strong acid – strong base curve as moresodium hydroxide is simply being added to the solution.
Similar arguments can be used to explain the shapes of pHcurves for strong acid – weak base, and weak acid – weak basetitrations. Since there is no sharp inflexion point titrationsinvolving weak acids with weak bases should not be used inanalytical chemistry.
14
13
12
11
10
9
8
7
6
5
4
3
2
1
0 10 20 30 40 50volume of 1.0 mol dm–3 NaOH added
60 70 80 90 100
This curve shows what happens when 1.0 mol dm–3 sodium hydroxide is added to 50 cm3 of 1.0 mol dm–3 hydrochloric acid
NaOH(aq) + HCl(aq) NaCl(aq) + H2O(l)
inflexion point(maximum gradient)
pH
14
13
12
11
10
9
8
7
6
5
4
3
2
1
0 10 20 30 40 50volume of 1.0 mol dm–3 NaOH
added
60 70 80 90 100
inflexion point
When 25 cm3 of alkali have been added, half the acid hasbeen turned into its salt, so pKa = pH.
suitable indicator:phenolphthaleinpKin = 9.6
CH3COOH(aq) + NaOH(aq) NaCH3COO(aq) + H2O(l)
pH
bufferedregion
0 vol. of base added vol. of base added
7
pH
14
0
7
pH
14
Strong acid – weak basee.g. HCl(aq) and NH3(aq)
Weak acid – weak basee.g. CH3COOH(aq) andNH3(aq)
inflexion pointsuitable indicatormethyl orangepKin = 3.7
INDICATORSAn indicator is a weak acid (or base) in which thedissociated form is a different colour to the undissociatedform.
HIn(aq) H+(aq) + In–(aq)colour A colour B
(colour in acid solution) (colour in alkali solution)
Kin = [In–]
[H+] ×[HIn]
Assuming the colour changes when
[In–] ≈ [Hin] then the end point of the indicator will be when[H+] ≈ Kin, i.e. when pH ≈ pKin. Different indicators havedifferent Kin values and so change colour within different pHranges.
Indicator pKin pH range Usemethyl orange 3.7 3.1–4.4 titrations with
strong acidsphenolphthalein 9.6 8.3–10.0 titrations with
strong bases
STRONG ACID – STRONG BASE TITRATIONThe change in pH during an acid–base titration can befollowed using a pH meter. Consider starting with 50 cm3 of1.0 mol dm–3 hydrochloric acid. Since [H+(aq)] = 1.0 moldm–3 the initial pH will be 0. After 49 cm3 of 1.0 mol dm–3
NaOH have been added there will be 1.0 cm3 of the original 1.0 mol dm–3 hydrochloric acid left in 99 cm3 of solution. At this point [H+(aq)] 51.0 × 10⁻²
mol dm–3 so the pH = 2.
When 50 cm3 of the NaOH solutionhas been added the solution will beneutral and the pH will be 7. This isindicated by the point of inflexion,which is known as the equivalencepoint. It can be seen that there is avery large change in pH around theequivalence point. Almost all of thecommon acid–base indicatorschange colour (reach their endpoint) within this pH region. Thismeans that it does not matter whichindicator is used.
pH meter
NaOH(aq
HCl(aq)
burette
5. pH curves66
Con
cent
ratio
n [H
+]
0
0.025
0.05
0.075
0.1
Volume of NaOH added0 2 4 6 8 10 12 14 16 18 20 22 24 26 28 30 32 34 36 38 40 42 44 46 48 50
NaOH cm3 [H+]
0 0.1
4 0.072413793
8 0.051515152
12 0.035135135
16 0.02195122
20 0.011111111
24 0.002040816
28 3.33333E-14
32 1.42857E-14
36 9.09091E-15
40 6.66667E-15
44 5.26316E-15
48 4.34783E-15
Similar trend to the moles of H+ graph
Why does the concentration, [H+], not change linearly?
5. pH curves65NaOH cm3 H+
0 0.0025
4 0.0021
8 0.0017
12 0.0013
16 0.0009
20 0.0005
24 1E-04
28 1.76667E-12
32 8.14286E-13
36 5.54545E-13
40 4.33333E-13
44 3.63158E-13
48 3.17391E-13
Mol
es o
f H+
0
0.001
0.002
0.002
0.003
Volume of NaOH added0 2 4 6 8 10 12 14 16 18 20 22 24 26 28 30 32 34 36 38 40 42 44 46 48 50
adding NaOH decreases the moles of H+ as
expected
Note: H+ values are non-zero values but the graph isnt able to clearly
represent the information
Marginalizer Bilal HameedAcid and base Bilal Hameed

2523
5. pH curves67NaOH cm3 pH
0 1
4 1.140178703
8 1.288065018
12 1.454258372
16 1.658541347
20 1.954242509
24 2.69019608
28 11.75284539
32 12.08922318
36 12.25606285
40 12.3631779
44 12.43990451
48 12.49840498
pH
0
3.5
7
10.5
14
Volume of NaOH added0 2 4 6 8 10 12 14 16 18 20 22 24 26 28 30 32 34 36 38 40 42 44 46 48 50
Using the log function we can clearly see where exactly the neutralisation takes
place.
← Equivalence point
Very little pH change during the initial 20 cm3
Very sharp change in pH over
the addition of less than half a drop of NaOH
Curve levels off at pH 12.5 due to excess NaOH
5. Strong acid (HCl) vs. strong base (NaOH)pH curve for the titration of 25.0 cm3 of 0.100 moldm−3
HCl with 0.100 moldm−3 NaOH
69
18.3 pH curves 629
■ 24.9975 cm3 of 0.100 mol dm−3 sodium hydroxide added to 25.0 cm3 of 0.100 mol dm−3 hydrochloric acid gives a pH of 5.00:
reaction factor = (25.0 − 24.9975)25.0
= 0.000 100
[H+(aq)] = 0.100 × 0.000 100 = 0.000 010 0 mol dm−3
pH = –log10 0.000 010 0 = 5.00
■ 24.9999 cm3 of 0.100 mol dm−3 sodium hydroxide added to 25.0 cm3 of 0.100 mol dm−3 hydrochloric acid gives a pH of 6.00:
reaction factor = (25.0 − 24.9999)
25.0 = 0.000 010 0
[H+(aq)] = 0.100 × 0.000 010 0 = 0.000 001 00 mol dm−3
pH = –log10 0.000 001 00 = 6.00
These simplified calculations show that the pH rises very rapidly near the end-point or equivalence point where the reacting volumes will be equal. The end-point or equivalence point can also be found using an acid–base indicator.
Finally, when exactly 25 cm3 of sodium hydroxide is added to 25 cm3 of 0.100 mol dm−3 hydrochloric acid, it gives a pH of exactly 7, since the hydroxide and hydrogen ions are in an exactly reacting molar ratio of 1 : 1. Neither sodium nor chloride ions react with water and the solution of sodium chloride is neutral with a pH of exactly 7.
If we continue adding aqueous sodium hydroxide beyond the end-point, the hydroxide ions are now present in excess since all the acid has been removed by neutralization. The hydroxide ion concentration begins to rise as quickly after the end-point as the hydrogen ion concentration decreased before the end-point. The titration curve (Figure 18.16) is symmetrical around an imaginary horizontal axis that runs through pH 7 at the equivalence or end-point.
■ Figure 18.16 The titration curve for the titration of 25.0 cm3 of 0.100 mol dm−3 hydrochloric acid with 0.100 mol dm−3 sodium hydroxide
Volume of 0.100 mol dm–3 NaOH added/cm3
pH
123456789
1011121314
05 10 15 20 25 30 35 40 45 500
equivalence point pH 7
Let us calculate the pH after 25.5 cm3 of 0.100 mol dm−3 sodium hydroxide has been added to 25.0 cm3 of 0.100 mol dm−3 hydrochloric acid:
reaction factor = (25.5 − 25.0)25.0
= 0.02
An approximate pH (ignoring the dilution factor) for the resulting solution is calculated as follows:
[OH–(aq)] = 0.100 × 0.0200 = 0.002 00 mol dm−3
pOH = −log10 0.002 00 = 2.69; pH = 11.3
829055_18_IB_Chemistry_606-642.indd 629 18/05/15 10:55 am
pH barely changes initially
pH levels off abruptly
5. pH curvesYou can see that the pH only rises a very small amount until quite near the equivalence point. Then there is a really steep rise. If you calculate the values, the pH rises all the way from 2.7 when you have added 24.9 cm3 to 11.3 when you have added 25.1 cm3.
The characteristic shape of the curve changes depending on the strength of acid and base used.
68
Bilal Hameed MarginalizerBilal Hameed Acid and base

26 24
5. Weak acid (CH3COOH) vs. strong base (NaOH)The titration curve for the titration of 25.0cm3 of 0.100moldm−3 CH3COOH with 0.100moldm−3 NaOH
70
18 Acids and bases630
Now calculate the pH after 27.5 cm3 of 0.100 mol dm−3 sodium hydroxide has been added to 25.0 cm3 of 0.100 mol dm−3 hydrochloric acid:
reaction factor = (27.5 − 25.0)25.0
= 0.100
An approximate pH (ignoring the dilution factor) for the resulting solution is calculated as follows:
[OH–(aq)] = 0.100 × 0.100 = 0.0100 mol dm−3
pOH = −log10 0.0100 = 2.00; pH = 12.0
Titration of a weak acid against a strong alkali25.00 cm3 of 0.100 mol dm−3 ethanoic acid requires exactly 25.00 cm3 of 0.100 mol dm−3 sodium hydroxide to reach the end-point or equivalence point. When these volumes react together ‘neutralization’ has occurred and only sodium ethanoate and water will be present:
CH3COOH(aq) + NaOH(aq) → CH3COONa(aq) + H2O(l)
However, the resulting solution will not be neutral. Ethanoic acid is a weak acid and exists mainly as molecules:
CH3COOH(aq) ! CH3COO−(aq) + H+(aq)
At the beginning of the titration the pH will be about 3 since the acid is a weak acid and is only slightly dissociated into ions. (The exact pH of the ethanoic acid can be calculated if the value of Ka or pKa is known.)
The addition of sodium hydroxide adds hydroxide ions to this equilibrium, which is ‘pulled over’ to the right as hydroxide ions remove the hydrogen ions via formation of water:
H+(aq) + OH−(aq) → H2O(l)
As alkali is added the ethanoic acid molecules undergo increasing dissociation to replace the hydrogen ions removed:
CH3COOH(aq) → CH3COO−(aq) + H+(aq)
The overall reaction as an ionic equation is therefore:
CH3COOH(aq) + OH−(aq) → H2O(l) + CH3COO−(aq)
Note that the sodium ions are spectator ions and do not participate in the neutralization reaction, nor do they react with water molecules.
As a consequence of ethanoic acid being a weak acid, the line of the titration curve (Figure 18.17) (compared to hydrochloric acid) starts at a higher value of pH and stays higher because most of the hydrogen ions are kept ‘in reserve’ in undissociated ethanoic acid molecules. The dissociation of ethanoic acid gradually occurs as the alkali is added, hence the steady increase in pH with total volume of alkali added.
The equivalence point, where there are equal amounts of ethanoic acid and sodium hydroxide, will be at a pH above 7 due to salt hydrolysis since sodium ethanoate is the salt of a weak acid and strong base.
Ethanoate ions are a stronger base than water molecules and the following equilibrium is established:
CH3COO−(aq) + H2O(l) ! CH3COOH(aq) + OH−(aq)
with the forward reaction heavily favoured.
■ Figure 18.17 The titration curve for the titration of 25.0 cm3 of 0.100 mol dm−3 ethanoic acid with 0.100 mol dm−3 sodium hydroxide
Volume of 0.100 mol dm–3 NaOH added/cm3
pH
123456789
1011121314
05 10 15 20 25 30 35 40 45 500
equivalence point
829055_18_IB_Chemistry_606-642.indd 630 18/05/15 10:55 am
pH levels off abruptly
pH levels show a more gradual change
5. Weak acid (CH3COOH) vs. weak base (NH3)The titration curve for the titration of 25.0cm3 of 0.100moldm−3 CH3COOH with 0.100moldm−3 NH3
72
pH gradually levels off
18 Acids and bases632
Titration of a weak acid against a weak alkaliIf 0.100 mol dm−3 ethanoic acid is titrated against 0.100 mol dm−3 aqueous ammonia solution then a very different titration curve results (Figure 18.20). There is no sharp or abrupt change in pH and hence no vertical section in the titration curve; the pH changes gradually during the titration process. No indicator is suitable for following this type of neutralization. A pH probe and meter are often used to identify the end-point in this type of titration.
■ Figure 18.20 The titration curve for the titration of 25.0 cm3 of 0.100 mol dm−3 ethanoic acid with 0.100 mol dm−3 ammonia
Volume of 0.100 mol dm–3 NH3 added/cm3
pH
123456789
1011121314
05 10 15 20 25 30 35 40 45 500
equivalence point
Simulation of a titrationAn Excel spreadsheet can be constructed with appropriate formulas (to include the effects of dilution of the sample by titrant) to simulate the titration of weak and strong acids and bases (Figure 18.21). Some simulations use a ‘master’ equation to calculate all points on the titration; others use separate equations for different regions of the curve, for example before the equivalence point, at the equivalence point and after the equivalence point. The concentration of different species at a particular pH is calculated from [H+(aq)], and the volume of titrant required to produce that amount of each species is calculated.
■ Figure 18.21 Excel simulation of an acid–base titration and generation of a pH curve
829055_18_IB_Chemistry_606-642.indd 632 18/05/15 10:55 am
5. Strong acid (HCl) vs. weak base (NH3)The titration curve for the titration of 25.0cm3 of 0.100moldm−3 HCl with 0.100moldm−3 NH3
71
18.3 pH curves 631
The relatively flat portions of titration curves are where the pH changes most slowly on addition of acid or alkali. These flat portions are, therefore, where the best buffering action occurs. They are known as the buffer regions.
The production of a titration curve for a weak acid such as ethanoic acid is helpful, as it allows the pKa and hence Ka to be calculated graphically (Figure 18.18) since the pH of the half-neutralized acid (at 12.5 cm3 of alkali) corresponds to the pKa of the acid.
During the titration of ethanoic acid by sodium hydroxide, the hydroxide ions gradually convert ethanoic acid molecules into ethanoate ions, so halfway to the end-point half of the ethanoic acid molecules will have been converted to ethanoate ions.
So specifically for the half-neutralized solution:
[CH3COOH(aq)] = [CH3COO−(aq)]
However, in general:
Ka = [H+(aq)] × [CH3COO−(aq)][CH3COOH(aq)]
Hence
Ka = [H+(aq)] × 11 since the two concentrations are equal
So
Ka = [H+(aq)]
Taking logarithms to the base 10 of both sides:
pKa = pH
Titration of a strong acid against a weak alkaliIf 0.100 mol dm−3 hydrochloric acid, HCl(aq), is titrated against 0.100 mol dm−3 aqueous ammonia, NH3(aq), then the pH changes very little until near the equivalence point, when it changes rapidly (Figure 18.19). The pH levels off again, but at a relatively low pH since aqueous ammonia is a weak base.
■ Figure 18.18 The determination of the pKa of ethanoic acid from its titration curve
Volume of NaOH added/cm3
pH
pKa
14
00
7.8
■ Figure 18.19 The titration curve for the titration of 25.0 cm3 of 0.100 mol dm−3 hydrochloric acid with 0.100 mol dm−3 ammonia
Volume of 0.100 mol dm–3 NH3 added/cm3
pH
123456789
1011121314
05 10 15 20 25 30 35 40 45 500
equivalence point
829055_18_IB_Chemistry_606-642.indd 631 18/05/15 10:55 am
pH gradually levels off
Marginalizer Bilal HameedAcid and base Bilal Hameed
2725
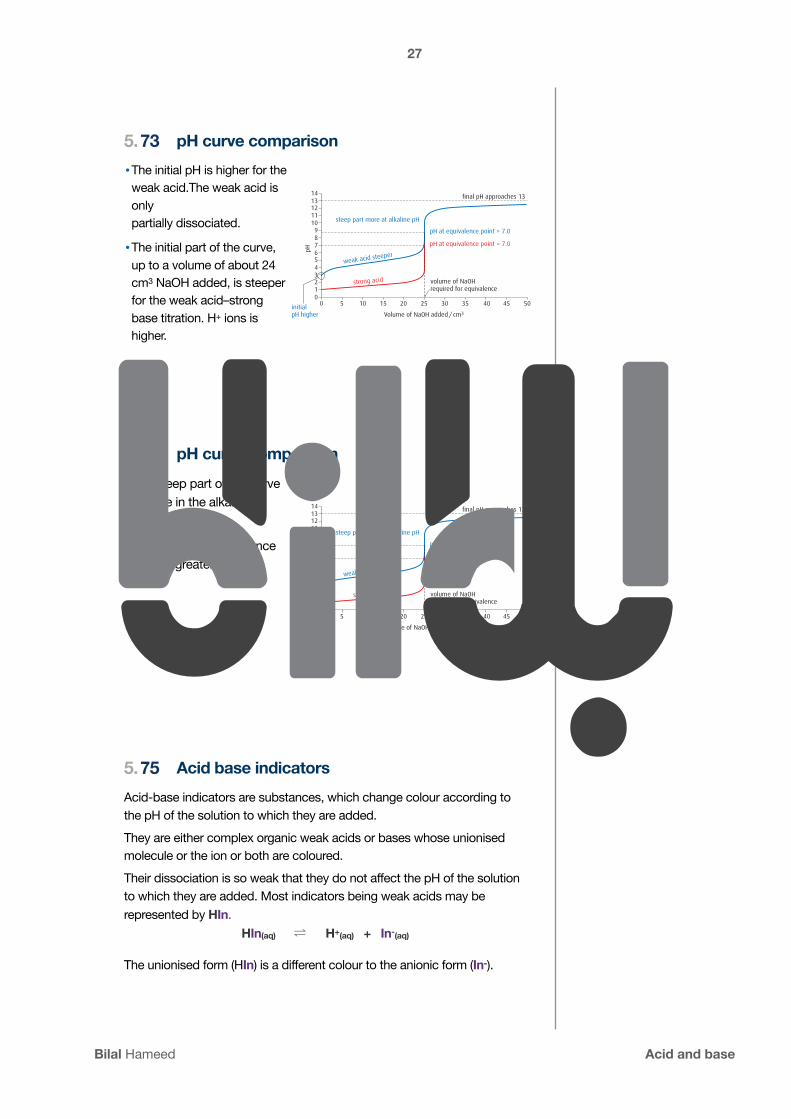
5. pH curve comparison
•The initial pH is higher for the weak acid.The weak acid is only partially dissociated.
•The initial part of the curve, up to a volume of about 24 cm3 NaOH added, is steeper for the weak acid–strong base titration. H+ ions is higher.
73
(),-��68>9H�6C9�76H:H
There are some important di! erences between the strong acid–strong base titration curve and the weak acid–strong base titration curve.r� The initial pH is higher for the weak acid. The weak acid is only
partially dissociated.r� The initial part of the curve, up to a volume of about 24 cm3 NaOH
added, is steeper for the weak acid–strong base titration. Because the weak acid is only partially dissociated, the concentration of H+ ions in the solution is lower, and adding a certain volume of NaOH has a greater relative e! ect on the pH than for a strong acid, in which the concentration of H+ ions is higher.
r� The steep part of the curve is more in the alkaline region.r� The pH at the equivalence point is greater than 7.
9ZiZgb^cVi^dc�d[�eAV�[gdb�V�i^igVi^dc�XjgkZThe pKa value for a weak acid may be determined experimentally by constructing a titration curve.
Consider the above example of the titration of 0.100 mol dm−3 ethanoic acid with 0.100 mol dm−3 NaOH; 25.0 cm3 of NaOH is required to reach the equivalence point. Here we will consider the point in the titration when half this amount of NaOH has been added, i.e. 12.5 cm3.
The equation for the reaction is:
CH3COOH(aq) + NaOH(aq) n CH3COONa(aq) + H2O(l)
When 12.5 cm3 of NaOH has been added, half of the CH3COOH has been converted to CH3COONa, and therefore the concentrations of CH3COOH and CH3COONa are equal. This can be seen if we work out the number of moles of each species:
25.0no. moles of CH3COOH originally in solution = 1000 × 0.1
= 2.50 × 10⁻³ mol
12.5no. moles of NaOH added = 1000 × 0.1 = 1.25 × 10⁻³ mol
=A
e=%
*+,-.&%&&&'&(&)
)('&
%
KdajbZ�d[�CVD=�VYYZY�$�Xb(^c^i^Vae=�]^\]Zg
kdajbZ�d[�CVD=gZfj^gZY�[dg�Zfj^kVaZcXZ
e=�Vi�Zfj^kVaZcXZ�ed^ci�3�,#%
e=�Vi�Zfj^kVaZcXZ�ed^ci�2�,#%
[^cVa�e=�VeegdVX]Zh�&(
hiZZe�eVgi�bdgZ�Vi�Va`Va^cZ�e=
lZV`�VX^Y�hiZZeZg
higdc\�VX^Y
* &% &* )%(*(%'*'% )* *%
;^\jgZ�-#'&� 8dbeVg^hdc�d[�V�lZV`�VX^YÄhigdc\�WVhZ�i^igVi^dc�XjgkZ��WajZ��l^i]�V�higdc\�VX^YÄhigdc\�WVhZ�i^igVi^dc�XjgkZ��gZY�#
Examiner’s tipThis seems to come up a lot in examinations!
5. Acid base indicatorsAcid-base indicators are substances, which change colour according to the pH of the solution to which they are added. They are either complex organic weak acids or bases whose unionised molecule or the ion or both are coloured. Their dissociation is so weak that they do not affect the pH of the solution to which they are added. Most indicators being weak acids may be represented by HIn.
HIn(aq) ⇌ H+(aq) + In-(aq)
The unionised form (HIn) is a different colour to the anionic form (In-).
75
5. pH curve comparison
•The steep part of the curve is more in the alkaline region.
•The pH at the equivalence point is greater than 7.
74
(),-��68>9H�6C9�76H:H
There are some important di! erences between the strong acid–strong base titration curve and the weak acid–strong base titration curve.r� The initial pH is higher for the weak acid. The weak acid is only
partially dissociated.r� The initial part of the curve, up to a volume of about 24 cm3 NaOH
added, is steeper for the weak acid–strong base titration. Because the weak acid is only partially dissociated, the concentration of H+ ions in the solution is lower, and adding a certain volume of NaOH has a greater relative e! ect on the pH than for a strong acid, in which the concentration of H+ ions is higher.
r� The steep part of the curve is more in the alkaline region.r� The pH at the equivalence point is greater than 7.
9ZiZgb^cVi^dc�d[�eAV�[gdb�V�i^igVi^dc�XjgkZThe pKa value for a weak acid may be determined experimentally by constructing a titration curve.
Consider the above example of the titration of 0.100 mol dm−3 ethanoic acid with 0.100 mol dm−3 NaOH; 25.0 cm3 of NaOH is required to reach the equivalence point. Here we will consider the point in the titration when half this amount of NaOH has been added, i.e. 12.5 cm3.
The equation for the reaction is:
CH3COOH(aq) + NaOH(aq) n CH3COONa(aq) + H2O(l)
When 12.5 cm3 of NaOH has been added, half of the CH3COOH has been converted to CH3COONa, and therefore the concentrations of CH3COOH and CH3COONa are equal. This can be seen if we work out the number of moles of each species:
25.0no. moles of CH3COOH originally in solution = 1000 × 0.1
= 2.50 × 10⁻³ mol
12.5no. moles of NaOH added = 1000 × 0.1 = 1.25 × 10⁻³ mol
=A
e=
%
*+,-.&%&&&'&(&)
)('&
%
KdajbZ�d[�CVD=�VYYZY�$�Xb(^c^i^Vae=�]^\]Zg
kdajbZ�d[�CVD=gZfj^gZY�[dg�Zfj^kVaZcXZ
e=�Vi�Zfj^kVaZcXZ�ed^ci�3�,#%
e=�Vi�Zfj^kVaZcXZ�ed^ci�2�,#%
[^cVa�e=�VeegdVX]Zh�&(
hiZZe�eVgi�bdgZ�Vi�Va`Va^cZ�e=
lZV`�VX^Y�hiZZeZg
higdc\�VX^Y
* &% &* )%(*(%'*'% )* *%
;^\jgZ�-#'&� 8dbeVg^hdc�d[�V�lZV`�VX^YÄhigdc\�WVhZ�i^igVi^dc�XjgkZ��WajZ��l^i]�V�higdc\�VX^YÄhigdc\�WVhZ�i^igVi^dc�XjgkZ��gZY�#
Examiner’s tipThis seems to come up a lot in examinations!
Bilal Hameed MarginalizerBilal Hameed Acid and base

28 26
5. Acid base indicators76When the indicator is added to an acid solution the equilibrium will shift backwards increasing the concentration of HIn, and revealing the
When added to an alkaline solution the equilibrium will shift forwards, increasing the concentration of In- and thus reveal the colour of In-.
When the concentration of HIn and In- are equal an intermediate colour will be seen.
HIn(aq) ⇌ H+(aq) + In-(aq)LITMUSred
HIn(aq) ⇌ H+(aq) + In-(aq)LITMUSblue
5. Indicators for strong acid-base titrationAn indicator used for any acid–base titration should ideally change colour at the pH corresponding to the mid-point of the almost vertically straight portion of the titration curve.
For a strong acid/strong base titration, any of the indicators could be used since all of them change colour within the almost vertical straight portion of the titration curve between about pH 4 and pH 11.
78
18 Acids and bases636
Indicators as weak basesMethyl orange (Figure 18.26), unlike most indicators, is a weak base which can be represented as BOH(aq). In aqueous solution the following equilibrium is set up:
BOH(aq) ! B+(aq) + OH−(aq) yellow red base conjugate acid
Application of Le Châtelier’s principle predicts that in alkaline solution the yellow form, BOH(aq), will predominate and in acidic solution the red B+(aq) will predominate (Figure 18.27).■ Addition of an acid: If an excess of an acidic solution is added to a solution of the indicator, the
increase in hydrogen ion concentration will, according to Le Châtelier’s principle, shift the equilibrium above to the right so that the concentration of the conjugate acid, B+(aq), is very high. This means that almost all the indicator molecules will exist as the ionized red form. This shift occurs because the hydrogen ions will combine with hydroxide ions to form water molecules.
■ Addition of an alkali: If an excess of an alkaline solution is added to a solution of the indicator, the hydroxide ion concentration will increase. The reaction will shift to the left to lower their concentration. A relatively high concentration of the base, BOH(aq), will be produced and the solution will be yellow.
■ Figure 18.26 Methyl orange indicator in acidic and alkaline solutions
■ Figure 18.27 The structure of methyl orange in acidic and alkaline conditions
–O3S
CH3
CH3
Na+ N N + H+
– H+N –O3S
CH3
CH3
Na++
N N N
H
Selecting an appropriate indicator for a titration, given the equivalence point of the titration and the end-point of the indicatorAn indicator used for any acid–base titration should ideally change colour at the pH corresponding to the mid-point of the almost vertically straight portion of the titration curve. (However, there is little loss in accuracy if the indicator changes colour anywhere within the range of the almost vertically straight portion of the curve, since the pH change is relatively
large for the addition of a relatively small amount of acid or base.)
For a strong acid/strong base titration, any of the indicators could be used since all of them change colour within the almost vertical straight portion of the titration curve between about pH 4 and pH 11. In other words, the pKa values of suitable indicators must lie between 4 and 11, and preferably be centred around 7.
Two common indicators are methyl orange and phenolphthalein. Methyl orange changes colour over the pH range 3.1 to 4.4 and phenolphthalein changes over the pH range 8.3 to 10.0. Both indicators are suitable for titrations involving a strong acid and a strong base (Figure 18.28).
■ Figure 18.28 Titration curve starting with 100 cm3 of 0.100 mol dm−3 strong acid and adding 1.0 mol dm−3 strong alkali
strong alkalistrong acid
Volume of alkali/cm3
pH
123456789
1011121314
0
strong alkalistrong acid
2
strong alkali
4 6 8 10 12 14 16 18 200
phenolphthalein
methyl orange
829055_18_IB_Chemistry_606-642.indd 636 18/05/15 10:55 am
5.
pH 1 2 3 4 5 6 7 8 9 10 11 12 13 14
METHYL ORANGE
LITMUS
PHENOLPHTHALEIN
Colour changes of some indicators77
CHANGE
CHANGE
CHANGE
METHYL ORANGE Pink 3 - 5 YellowLITMUS Red 6 - 8 Blue
PHENOLPHTHALEIN Colourlesss 8 - 10 Pink
Marginalizer Bilal HameedAcid and base Bilal Hameed

2927
5. Indicators for strong acid-base titrationAn indicator used for any acid–base titration should ideally change colour at the pH corresponding to the mid-point of the almost vertically straight portion of the titration curve.
For a strong acid/strong base titration, any of the indicators could be used since all of them change colour within the almost vertical straight portion of the titration curve between about pH 4 and pH 11.
79
18 Acids and bases636
Indicators as weak basesMethyl orange (Figure 18.26), unlike most indicators, is a weak base which can be represented as BOH(aq). In aqueous solution the following equilibrium is set up:
BOH(aq) ! B+(aq) + OH−(aq) yellow red base conjugate acid
Application of Le Châtelier’s principle predicts that in alkaline solution the yellow form, BOH(aq), will predominate and in acidic solution the red B+(aq) will predominate (Figure 18.27).■ Addition of an acid: If an excess of an acidic solution is added to a solution of the indicator, the
increase in hydrogen ion concentration will, according to Le Châtelier’s principle, shift the equilibrium above to the right so that the concentration of the conjugate acid, B+(aq), is very high. This means that almost all the indicator molecules will exist as the ionized red form. This shift occurs because the hydrogen ions will combine with hydroxide ions to form water molecules.
■ Addition of an alkali: If an excess of an alkaline solution is added to a solution of the indicator, the hydroxide ion concentration will increase. The reaction will shift to the left to lower their concentration. A relatively high concentration of the base, BOH(aq), will be produced and the solution will be yellow.
■ Figure 18.26 Methyl orange indicator in acidic and alkaline solutions
■ Figure 18.27 The structure of methyl orange in acidic and alkaline conditions
–O3S
CH3
CH3
Na+ N N + H+
– H+N –O3S
CH3
CH3
Na++
N N N
H
Selecting an appropriate indicator for a titration, given the equivalence point of the titration and the end-point of the indicatorAn indicator used for any acid–base titration should ideally change colour at the pH corresponding to the mid-point of the almost vertically straight portion of the titration curve. (However, there is little loss in accuracy if the indicator changes colour anywhere within the range of the almost vertically straight portion of the curve, since the pH change is relatively
large for the addition of a relatively small amount of acid or base.)
For a strong acid/strong base titration, any of the indicators could be used since all of them change colour within the almost vertical straight portion of the titration curve between about pH 4 and pH 11. In other words, the pKa values of suitable indicators must lie between 4 and 11, and preferably be centred around 7.
Two common indicators are methyl orange and phenolphthalein. Methyl orange changes colour over the pH range 3.1 to 4.4 and phenolphthalein changes over the pH range 8.3 to 10.0. Both indicators are suitable for titrations involving a strong acid and a strong base (Figure 18.28).
■ Figure 18.28 Titration curve starting with 100 cm3 of 0.100 mol dm−3 strong acid and adding 1.0 mol dm−3 strong alkali
strong alkalistrong acid
Volume of alkali/cm3pH
123456789
1011121314
0
strong alkalistrong acid
2
strong alkali
4 6 8 10 12 14 16 18 200
phenolphthalein
methyl orange
829055_18_IB_Chemistry_606-642.indd 636 18/05/15 10:55 am
5. Indicator: weak acid - strong baseThe indicator needs to change between pH values 6 and 10. Phenolphthalein is a suitable indicator, but methyl orange is not.
81
18.3 pH curves 637
However, the choice of indicator is more limited if a weak acid or a weak base is used in the titration, since the pH range of the almost straight portion is much smaller and fewer indicators change colour completely over this range.
For a strong acid/weak base titration, such as that between 0.1 mol dm−3 aqueous ammonia and 0.1 mol dm−3 hydrochloric acid, the indicator needs to change between pH values 4 and 7. Methyl orange is a suitable indicator, but phenolphthalein is not.
As Figure 18.29 shows, phenolphthalein would not be a suitable indicator because it will change colour at the wrong volume (not at the end-point) and over a large volume change of aqueous ammonia solution. It would therefore be impossible to find the end-point accurately using phenolphthalein as the indicator.
■ Figure 18.29 Titration curve starting with 100 cm3 of 0.100 mol dm−3 strong acid and adding 1.0 mol dm−3 weak alkali
weak alkalistrong acid
Volume of alkali/cm3
pH
123456789
1011121314
0
weak alkalistrong acid
2 4 6 8 10 12 14 16 18 200
phenolphthalein
methyl orange
■ Figure 18.30 Titration curve starting with 100 cm3 of 0.100 mol dm−3 weak acid and adding 1.0 mol dm−3 strong alkali
strong alkaliweak acid
Volume of alkali/cm3
pH
123456789
1011121314
0
strong alkaliweak acid
2
strong alkali
4 6 8 10 12 14 16 18 200
phenolphthalein
methyl orange
For a weak acid/strong base titration, such as that between 0.1 mol dm−3 ethanoic acid and 0.1 mol dm−3 sodium hydroxide, the indicator needs to change between pH values 6 and 10. Phenolphthalein is a suitable indicator, but methyl orange is not.
Figure 18.30 shows that methyl orange would not be a suitable indicator because it will change colour very slowly over a relatively large volume of sodium hydroxide so that it would be very difficult to locate the end-point accurately. In addition, the colour change would occur at the wrong volume.
No indicator is suitable for the titration of a weak acid with a weak base, for example 0.1 mol dm−3 ethanoic acid and 0.1 mol dm−3 aqueous ammonia, since there is no almost straight portion present in the titration curve (Figure 18.31). In other words, the pH changes gradually throughout the titration.
If bromothymol blue, whose pKa is approximately 7, was used as an indicator, it would change colour over a relatively large volume of ammonia. Hence it would not be possible to find the end-point accurately.
829055_18_IB_Chemistry_606-642.indd 637 18/05/15 10:55 am
5. Indicator: for strong acid - strong baseHowever, the choice of indicator is more limited if a weak acid or a weak base is used in the titration, since the pH range of the almost straight portion is much smaller.
The indicator needs to change between pH values 4 and 7.
80
18.3 pH curves 637
However, the choice of indicator is more limited if a weak acid or a weak base is used in the titration, since the pH range of the almost straight portion is much smaller and fewer indicators change colour completely over this range.
For a strong acid/weak base titration, such as that between 0.1 mol dm−3 aqueous ammonia and 0.1 mol dm−3 hydrochloric acid, the indicator needs to change between pH values 4 and 7. Methyl orange is a suitable indicator, but phenolphthalein is not.
As Figure 18.29 shows, phenolphthalein would not be a suitable indicator because it will change colour at the wrong volume (not at the end-point) and over a large volume change of aqueous ammonia solution. It would therefore be impossible to find the end-point accurately using phenolphthalein as the indicator.
■ Figure 18.29 Titration curve starting with 100 cm3 of 0.100 mol dm−3 strong acid and adding 1.0 mol dm−3 weak alkali
weak alkalistrong acid
Volume of alkali/cm3
pH
123456789
1011121314
0
weak alkalistrong acid
2 4 6 8 10 12 14 16 18 200
phenolphthalein
methyl orange
■ Figure 18.30 Titration curve starting with 100 cm3 of 0.100 mol dm−3 weak acid and adding 1.0 mol dm−3 strong alkali
strong alkaliweak acid
Volume of alkali/cm3
pH
123456789
1011121314
0
strong alkaliweak acid
2
strong alkali
4 6 8 10 12 14 16 18 200
phenolphthalein
methyl orange
For a weak acid/strong base titration, such as that between 0.1 mol dm−3 ethanoic acid and 0.1 mol dm−3 sodium hydroxide, the indicator needs to change between pH values 6 and 10. Phenolphthalein is a suitable indicator, but methyl orange is not.
Figure 18.30 shows that methyl orange would not be a suitable indicator because it will change colour very slowly over a relatively large volume of sodium hydroxide so that it would be very difficult to locate the end-point accurately. In addition, the colour change would occur at the wrong volume.
No indicator is suitable for the titration of a weak acid with a weak base, for example 0.1 mol dm−3 ethanoic acid and 0.1 mol dm−3 aqueous ammonia, since there is no almost straight portion present in the titration curve (Figure 18.31). In other words, the pH changes gradually throughout the titration.
If bromothymol blue, whose pKa is approximately 7, was used as an indicator, it would change colour over a relatively large volume of ammonia. Hence it would not be possible to find the end-point accurately.
829055_18_IB_Chemistry_606-642.indd 637 18/05/15 10:55 am
Bilal Hameed MarginalizerBilal Hameed Acid and base

30 28
5. Indicator: weak acid - strong baseThe choice of indicator is more limited if a weak acid or a weak base is used in the titration, since the pH range of the almost straight portion is much smaller and fewer indicators change colour completely over this range.
8218 Acids and bases638
Table 18.6 summarizes the use of phenolphthalein and methyl orange as acid–base indicators. The principles described here can be used to select other suitable indicators for acid–base titrations.
No indicator can be used for an accurate titration of a weak acid with a weak base since the colour change of any indicator is going to be gradual. Such titrations are therefore often performed using a pH probe and meter or a conductivity probe and meter (Figure 18.33).
■ Figure 18.31 Titration curve starting with 100 cm3 of 0.100 mol dm−3 weak acid and adding 1.0 mol dm−3 weak alkali
weak alkaliweak acid
Volume of alkali/cm3
pH
123456789
1011121314
0
weak alkaliweak acid
2 4 6 8 10 12 14 16 18 200
phenolphthalein
methyl orange
■ Table 18.6 The suitability of methyl orange and phenolphthalein as indicators
Alkali Acid IndicatorStrong Strong Methyl orange or phenolphthalein Strong Weak Phenolphthalein (Figure 18.32)Weak Strong Methyl orangeWeak Weak None
■ Figure 18.32 Phenolphthalein in acidic and basic solutions ■ Figure 18.33 Conductivity probe and meter
ToK LinkIs a pH curve an accurate description of reality or an artificial representation? Does science offer a representation of reality?
A pH curve is described by a series of equations based on acid–base equilibria. There is nothing unusual about the mathematical features of a pH curve. The distinctive features that you should be able to identify are the starting pH, the buffer region and its mid-point, the equivalence point pH and the final asymptotic pH. All of these have been explained in the text in terms of chemical reactions and acid–base equilibria equations. The calculations used in the text to model pH curves are artificial representations of reality. They do not provide an exact model of pH curves, and they differ slightly from accurate experimental pH curves.
829055_18_IB_Chemistry_606-642.indd 638 18/05/15 10:55 am
5. pH curves summary84
Titration curves
483
● Titration curvesA titration curve is a graph of pH against volume of the base or acid added. To plot a titration curve, carry out an acid–base titration, adding the base in 5 cm3 portions, and in smaller portions near the end point. Record the pH after each addition.
A typical curve shows the initial pH of the acid or base and the point when neutralisation occurs.
The shape of the curve shows the type of titration.
The vertical region in a titration curve is where there is a rapid change in pH.
The vertical region in the curve occurs at the equivalence point in a titration.
Most titration curves show a base added to an acid but the reverse is also possible.
Equivalence points
01
3
5
7
9
11
13
0 25.0
Strong acid-strong base
titration
Titrationcurve 1
Volume of base added/cm3
pH
01
3
5
7
9
11
13
0 25.0
Weak acid-strong base
(alkali)titration
Titrationcurve 2
Volume of base added/cm3
pH
01
3
5
7
9
11
13
0 25.0
Strong acid-weak base
titration
Titrationcurve 3
Volume of base added/cm3
pH
01
3
5
7
9
11
13
0 25.0
Weak acid-weak base
titration
Titrationcurve 4
Volume of base added/cm3
pH
Figure 23.14
There are four different types of of titration curve and the equivalence points (points where there is a rapid change in pH showing as a vertical region in the curve) are different.
For titration curve 1 the vertical region occurs between pH 3 and pH 10. This is indicative of a strong acid–strong base titration. The initial pH of the acid is 1 which would suggest a strong acid.
For titration curve 2 the vertical region occurs between pH 6 and 10. This is indicative of a weak acid–strong base titration. The initial pH of the acid is almost 3 which would suggest a weak acid.
For titration curve 3 the vertical region occurs between pH 3 and 8. This is indicative of a strong acid–weak base titration. The initial pH of the acid is 1 which would suggest a strong acid.
For titration curve 4 there is no major vertical region. This is indicative of a weak acid-weak base titration. The initial pH of the acid is between 3 and 4 which would suggest a weak acid.
Understanding titration curvesWhen examining or choosing a titration curve, the following four features should be considered.
469839_23_AQA_Chem_462-496.indd 483 3/27/19 2:12 PM
5. pH curves summary83
Titration curves
483
● Titration curvesA titration curve is a graph of pH against volume of the base or acid added. To plot a titration curve, carry out an acid–base titration, adding the base in 5 cm3 portions, and in smaller portions near the end point. Record the pH after each addition.
A typical curve shows the initial pH of the acid or base and the point when neutralisation occurs.
The shape of the curve shows the type of titration.
The vertical region in a titration curve is where there is a rapid change in pH.
The vertical region in the curve occurs at the equivalence point in a titration.
Most titration curves show a base added to an acid but the reverse is also possible.
Equivalence points
01
3
5
7
9
11
13
0 25.0
Strong acid-strong base
titration
Titrationcurve 1
Volume of base added/cm3
pH
01
3
5
7
9
11
13
0 25.0
Weak acid-strong base
(alkali)titration
Titrationcurve 2
Volume of base added/cm3
pH
01
3
5
7
9
11
13
0 25.0
Strong acid-weak base
titration
Titrationcurve 3
Volume of base added/cm3
pH
01
3
5
7
9
11
13
0 25.0
Weak acid-weak base
titration
Titrationcurve 4
Volume of base added/cm3
pH
Figure 23.14
There are four different types of of titration curve and the equivalence points (points where there is a rapid change in pH showing as a vertical region in the curve) are different.
For titration curve 1 the vertical region occurs between pH 3 and pH 10. This is indicative of a strong acid–strong base titration. The initial pH of the acid is 1 which would suggest a strong acid.
For titration curve 2 the vertical region occurs between pH 6 and 10. This is indicative of a weak acid–strong base titration. The initial pH of the acid is almost 3 which would suggest a weak acid.
For titration curve 3 the vertical region occurs between pH 3 and 8. This is indicative of a strong acid–weak base titration. The initial pH of the acid is 1 which would suggest a strong acid.
For titration curve 4 there is no major vertical region. This is indicative of a weak acid-weak base titration. The initial pH of the acid is between 3 and 4 which would suggest a weak acid.
Understanding titration curvesWhen examining or choosing a titration curve, the following four features should be considered.
469839_23_AQA_Chem_462-496.indd 483 3/27/19 2:12 PM
Marginalizer Bilal HameedAcid and base Bilal Hameed

3129
5. Skill checkA 20cm3 sample of 0.200M NH3(aq) was titrated with 0.10 M H2SO4.
(a) Calculate the mol of NH3.
(b) Calculate the mol of H2SO4.
85
5.
8
Answer all the questions in the spaces provided
1 (a) Write an expression for Kw.
.................................................................................................................................... [1]
(b) Use your expression to help you calculate the pH of 0.200 mol dm–3 NaOH(aq).
..........................................................................................................................................
.................................................................................................................................... [2]
(c) The pH of 0.200 mol dm–3 NH3(aq) is 11.3. Explain why this answer differs from youranswer in (b).
..........................................................................................................................................
.................................................................................................................................... [1]
(d) A 20.0 cm3 sample of 0.200 mol dm–3 NH3(aq) was titrated with 0.100 mol dm–3 HCl.On the following axes, sketch how the pH changes during this titration. Mark clearlywhere the end point occurs.
[3]volume of added acid / cm3
pH
14
7
00 10 20 30 40 50 60
2
9701/4/S02
ForExaminer's
Use
Bilal Hameed IONIC EQUILIBRIA WS 1PAGE 172
Skill check(e) On the following axes, sketch how the pH changes during titration. Mark clearly where the end point occurs.
87
5. Skill check(c) Calculate the volume of H2SO4 required for complete neutralisation.
(d) Given that the pH of 0.20 M NH3 is 11.3, deduce the final pH at the equivalence point.
86
Bilal Hameed MarginalizerBilal Hameed Acid and base
32 30
5. Skill check(a) Propanoic acid is weak acid with a Ka of 1.22 x 10⁻⁵ moldm-3. Write an equation for the ionisation of propanoic acid.
(b) Calculate pKa, for propanoic acid.
88
5. Skill checkA mixture of sodium propanoate and propanoic acid act as a buffer solution.
(a) What is mean by the term buffer solution?
(b) Explain how the mixture of sodium propanoate and propanoic acid act as a buffer solution.
(c) Calculate the pH of the solution formed by adding 15.0cm3 of 0.1M sodium hydroxide to 30.0cm3 of 0.1M propanoic acid.
90
5. Skill checkSodium propanoate is made by the reaction of sodium hydroxide with propanoic acid.
(a) Write an equation for the reaction.
(b) If the reaction were carried out by titration using 0.1M solutions of the hydroxide and the acid, state the name of suitable indicator.
89
Marginalizer Bilal HameedAcid and base Bilal Hameed

3331
5. Skill checkLactic acid and sodium lactate are both used as food additives.
A solution of 0.100 moldm-3 lactic acid is titrated against 25.0 cm3 0.100 moldm-3 sodium hydroxide.
(a) Sketch the labeled pH titration curve
(b) Suggest an indicator that is suitable to be used for this titration
91
5. Skill check (c) An equimolar mixture of the lactic acid and sodium lactate is present in a food. These compounds are described as acid regulators. Explain how this mixture can act as a buffer solution.
92
Bilal Hameed MarginalizerBilal Hameed Acid and base


