10-1 Governance and Profitability Around the World Vince Hooper, Ah Boon Sim and Asfandyar Uppal...
23
10- 1 Governance and Profitability Around Governance and Profitability Around the World the World Vince Hooper, Ah Boon Sim and Asfandyar Uppal School of Banking and Finance The University of New South Wales Sydney, NSW 2052 Australia
-
Upload
joanna-day -
Category
Documents
-
view
216 -
download
0
Transcript of 10-1 Governance and Profitability Around the World Vince Hooper, Ah Boon Sim and Asfandyar Uppal...

10-1
Governance and Profitability Around the WorldGovernance and Profitability Around the World
Vince Hooper, Ah Boon Sim and Asfandyar Uppal
School of Banking and Finance
The University of New South Wales
Sydney, NSW 2052 Australia

10-2
Governance and Profitability Around the WorldGovernance and Profitability Around the World
Abstract
The purpose of this paper is to examine the effect of governance environments upon aggregate dividend yield and earnings per share for developed and emerging stock markets over the time period January 1995 to December 2002. Using an augmented version of the dividend growth model and allowing for the control of risk factors, we find that governance environments have a significant influence upon dividend yield and earnings per share. The results have policy implications for government policy setters as improvements to governance environments may induce portfolio equity inflow, which is increasingly being seen as a driving force for economic growth.

10-3
Literature ReviewLiterature Review Return on Equity as Dividend Yield:
Bekaert and Harvey (2000), Errunza and Miller (2000)
La Porta et al (2000). Countries with better investor protections should have higher dividend yields
Earnings-Price ratio is also a fundamental performance valuation ratio [captures both dividends and capital gain]
Klapper and Love (2002) find a high degree of correlation between firm level corporate governance and countries with good effective legal systems
Lombardo and Pagano (2000) argue that the profitability of projects is an positively related to efficiency of legal institutions

10-4
Data Sources: Stock MarketData Sources: Stock Market
50 developed and developing countries in our sample
Stock Market Indices Sourced from Morgan Stanley (MSCI $US Value Weighted). These indices are adjusted for dividends and market capitalization changes
MSCI World Index used as a proxy for the World Market Portfolio
Time Period: January 1995-December 2002

10-5
Data Sources: Accounting RatiosData Sources: Accounting Ratios
Accounting ratios downloaded from Datastream
Price earnings ratio is defined as the “weighted average price/earnings ratio based on 12 month forward”
Dividend yield is defined as the “weighted dividend yield based on the indicated annual dividend”
The yield on domestic 10year government bond (from Datastream) is the local benchmark bonds

10-6
Data Sources: Governance DataData Sources: Governance Data Governance Data is sourced from World Bank [Kaufmann, Kraay and
Mastruzzi 2003 “Governance Matters III: Governance Indicators for 1996-2002”
Four “clusters”:
Voice and Accountability (VA)
Political Stability and Absence of Violence (PS)
Government Effectiveness (GE)
Regulatory Quality (RQ)
Rule of Law (RL)
Control of Corruption (CC)

10-7
MethodologyMethodology
Gordon Model
1 1jj
ji,t
ji,tti,t
)k(
DEP
Tt ,...,1 Ni ,...,1

10-8
Where Et is the expectation conditional on information known at time t, Di,t+j is the dividend paid out by the companies listed in country i at time t+j, and ki,t+j is the per-period risk-adjusted discount factor between time t and t+j relevant for the stream of dividends from country i. A simple version of the Gordon model assumes ki to be constant and
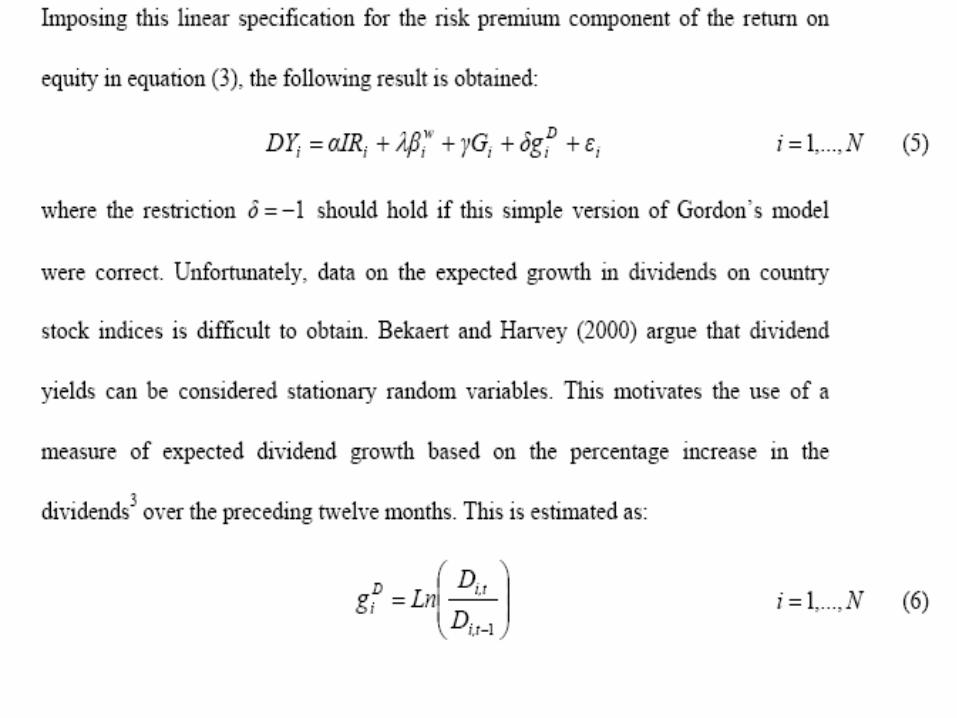
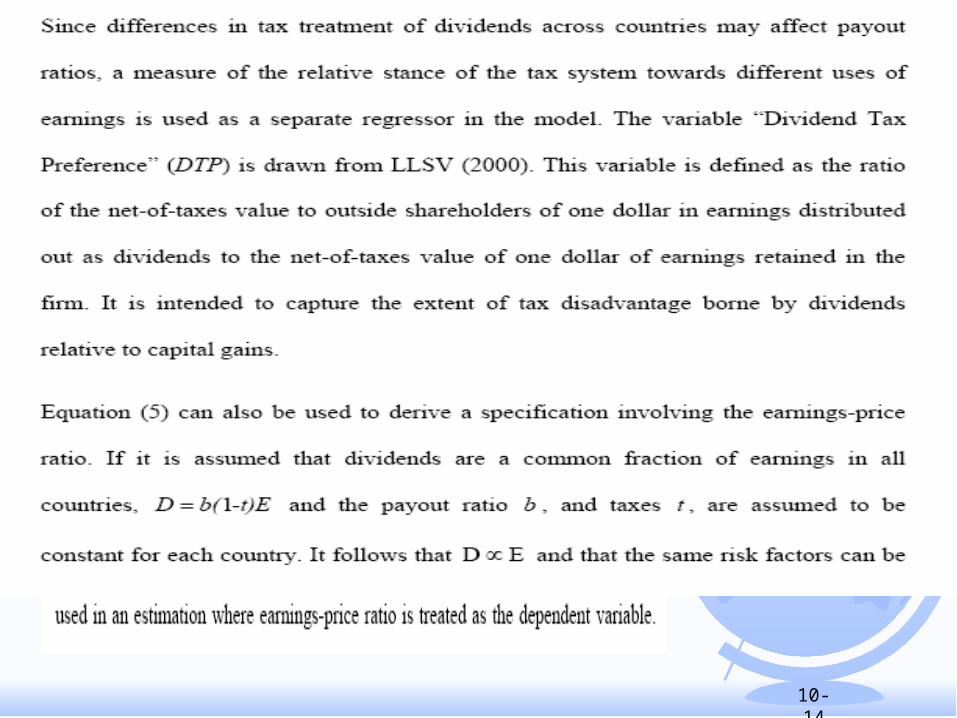
where Di,t is the current dividend and giD is a constant
dividend growth rate specific to country i. Under these assumptions, the expected dividend yield becomes:
jDii,tji,tt )g(D)D(E 1

10-9
[Equation 2]
Diii,t
i,t
i,t gkDYP
D

10-10
To calculate the risk-adjusted required rate of return ki , a model of the equilibrium determination of the rates of return on stocks with different risk characteristics is required. In an international CAPM framework, the systematic risk of stock market index i, is only due to its covariance with the world market [Sharpe (1964)]. When the required rate of return ki on equities also depends on the governance variables ki, may be written as [Equation 3]:
)(G)(βfkiiiii

10-11
10-12

10-13
10-14

10-15

10-16

10-17

10-18
Expected
Sign (1) B1 (2) G i =VA (3) G i =PS (4) G i =GE (5) G i =RQ (6) G i =RL (7) G i =CC (8) B2 (9) Gi =VA (10) Gi =RQ (11) Gi =CC
G i (+) - 1.0385 *** 0.4328 * 0.4250 ** 0.8947 *** 0.4047 0.3708 ** - - - -
(0.0061) (0.0696) (0.0338) (0.0013) (0.1435) (0.0476)
IR (+) 0.1047 *** 0.1872 *** 0.1841 *** 0.1604 *** 0.1998 *** 0.1667 *** 0.1647 *** 0.1046 ** 0.1561 *** 0.1822 *** 0.1358 ***(0.0023) (0.0000) (0.0008) (0.0001) (0.0000) (0.0038) (0.0000) (0.0101) (0.0018) (0.0001) (0.0029)
WRDRET(β w ) (?) 0.0113 0.0019 0.0514 0.0347 0.1317 0.0579 -0.0305 - - - -(0.9737) (0.9949) (0.8676) (0.9076) (0.6475) (0.8603) (0.9202)
g D (-) 0.4722 0.4878 0.5512 0.6929 0.5543 0.6651 * 0.5903 0.4696 0.6109 0.5818 0.7435 *(0.2558) (0.2138) (0.1582) (0.0642) (0.1405) (0.0801) (0.1395) (0.2790) (0.1316) (0.1458) (0.0684)
DTP (+) 1.4913 ** 0.7117 0.7282 0.9378 0.7221 0.8243 0.8895 1.4959 *** 0.6675 0.7718 0.8207(0.0214) (0.2665) (0.2598) (0.1144) (0.2029) (0.1944) (0.1286) (0.0072) (0.2306) (0.1471) (0.1396)
D1*G i (+) - - - - - - - - 1.2199 *** 0.9342 *** 0.4789 ***
(0.0016) (0.0002) (0.0096)
D2*G i (+) - - - - - - - - 0.8797 ** 0.7133 *** 0.1754
(0.0205) (0.0092) (0.3556)
Hausman Test 9.1249 ** 2.3904 21.6882 *** 17.4067 *** 4.4308 1.5272 0.0000 0.9485 4.5009 5.0939 3.8815(0.0104) (0.1221) (0.0000) (0.0000) (0.1091) (0.4660) (1.0000) (0.6224) (0.2122) (0.1651) (0.2746)
Adj. R-square 0.2458 0.4585 0.3897 0.4757 0.5568 0.4265 0.3611 0.2551 0.4940 0.5687 0.4212
This table presents the balanced panel regression results where the dependent variable is the dividend yield on an index. Panel A reports the theoretical specification of the model and Panel B presentsthe model with the use of legal origins dummies. D1 has a value of 1 if a country is of Common law origins and 0 if its origins are Civil law. D2 has a value of 1 if a country has Civil law origins and0 if it is Common law. Column 1 presents the baseline specification and columns 2-7 present the results where each of the governance indicators have been introduced individually into the firstbaseline model (B1). The governance indicators are further classified according to the governance cluster they are constituents of, with three distinct clusters reported. Instrumental variables are usedto control for the effects of measurement errors in the first stage estimation of world betas using SUR. Columns 8-11 present the results for the adjusted specification with the Civil law (D1) andCommon law (D2) dummies introduced into the estimations. All regressors are divided by the standard error of each governance observation before being introduced into the estimation. TheHausman test statistic and adjusted R-square is reported for each regression estimation. P-values of the coefficients are reported in parentheses.
Table 1: Dividend Yields
Panel A Panel B
*, **, *** indicate significance at the 10%, 5% and 1% levels respectively. D1 =1 if a country is of Common law decent and 0 otherwise. D2 =1 if a country is of Civil law decent and 0 otherwise.
Cluster 1 Cluster 2 Cluster 3

10-19
Expected
Sign (1) B1 (2) Gi=VA (3) Gi=PS (4) Gi=GE (5) Gi=RQ (6) Gi=RL (7) Gi=CC (8) B2 (9) Gi=VA (10) Gi=RQ (11) Gi=CC
G i (?) 0.0165 ** 0.0076 0.0050 0.0053 0.0087 0.0045 - - - -
(0.0753) (0.2776) (0.3327) (0.4433) (0.1617) (0.2404)
IR (+) 0.0034 *** 0.0046 *** 0.0049 *** 0.0043 *** 0.0041 *** 0.0048 *** 0.0044 *** 0.0034 *** 0.0053 *** 0.0051 *** 0.0057 ***(0.0000) (0.0000) (0.0006) (0.0000) (0.0000) (0.0001) (0.0000) (0.0000) (0.0000) (0.0000) (0.0000)
WRDRET(β w ) (?) 0.0022 0.0037 0.0045 0.0064 0.0065 0.0048 0.0033 - - - -(0.6985) (0.4632) (0.4207) (0.2707) (0.2563) (0.4041) (0.5458)
g E (-) -0.0313 *** -0.0341 *** -0.0321 *** -0.0347 *** -0.0330 *** -0.0347 *** -0.0330 *** -0.0305 *** -0.0327 *** -0.0325 *** -0.0332 ***(0.0001) (0.0001) (0.0001) (0.0001) (0.0007) (0.0001) (0.0002) (0.0001) (0.0001) (0.0000) (0.0000)
D1*G i (?) - - - - - - - - 0.0134 0.0035 0.0078
(0.1471) (0.4918) (0.2003)
D2*G i (?) - - - - - - - - 0.0209 ** 0.0103 * 0.0142 **
(0.0265) (0.0686) (0.0296)
Hausman Test 0.6198 2.9680 0.2472 0.2572 2.0663 0.0193 0.1061 0.5448 0.4759 1.0822 0.7158(0.7335) (0.2267) (0.8837) (0.8793) (0.5588) (0.8895) (0.9483) (0.7616) (0.4903) (0.7814) (0.8695)
Adj. R-square 0.4402 0.6047 0.5609 0.6204 0.6396 0.5964 0.5471 0.4460 0.6393 0.6579 0.6353
This table presents the balanced panel regression results where the dependent variable is the earnings-price ratio. Panel A reports the theoretical specification of the model and Panel B presents themodel with the use of legal origins dummies. D1 has a value of 1 if a country is of Common law origins and 0 if its origins are Civil law. D2 has a value of 1 if a country has Civil law origins and 0 ifit is Common law. Column 1 presents the baseline specification and columns 2-7 present the results where each of the governance indicators have been introduced individually into the first baselinemodel (B1). The governance indicators are further classified according to the governance cluster they are constituents of, with three distinct clusters reported. Instrumental variables are used to controlfor the effects of measurement errors in the first stage estimation of world betas using SUR. Columns 8-11 present the results for the adjusted specification with the Civil law (D1) and Common law(D2) dummies introduced into the estimations. All regressors are divided by the standard error of each governance observation before being introduced into the estimation. P-values of the coefficientsare reported in parentheses. The Hausman test statistic and adjusted R-square is reported for each regression estimation.
Panel A Panel B
Table 2: Earnings-Price Ratio
*, **, *** indicate significance at the 10%, 5% and 1% levels respectively. D1 =1 if a country is of Common law decent and 0 otherwise. D2 =1 if a country is of Civil law decent and 0 otherwise.
Cluster 1 Cluster 2 Cluster 3

10-20
Figure 1: Description of Global Risk Factors WRDRET: continuous return US dollar return of the MSCI world equity
market in excess of the one-month US treasury bill rate. Source: MSCI Data available through Datastream.
G10FX: log first difference in the weighted average of the foreign exchange value for the US dollar against a subset of the broad index currencies that circulate widely outside the country of issue. Source: Federal Reserve Bank of St.
G7UI: unexpected component of monthly global inflation, derived from an ARIMA model applied to the log difference of the G7 weighted CPI’s, using the shares of the total real gross domestic product. Source: Datastream (mnemonic=G7OCP009F).
OIL: change in the monthly average OPEC oil basket price in US dollars. Source: Datastream (mnemonic= OILOPEC).
G7IP: weighted average of industrial production growth rates in the G7 countries where a measure of relative production shares is used as the weights. Source: Datastream (mnemonic=G7OPR035G).

10-21
Results Table 1Results Table 1
Panel A, all measures of governance are found to be significantly and positively associated with dividend yields (except RL which does not have a positive co-efficient)
Panel B indicates that the quality of governance has a positive impact on dividend yields in both civil and common law countries

10-22
Results Table 2Results Table 2
VA indicator has a positive effect upon Price-Earnings Ratio
All indicators are positive but insignificant
Results generally indicate that quality of governance positively affects the profitability of firms
Panel B highlights the importance of governance in environments with lower levels of investor protection to be more pronounced

10-23
ConclusionConclusion