Digital Marketing Strategies for Heritage Tourism in Wales: Jon Monroe (Visit Wales)
Upload
shon-griffithCategory
view
225download
0
11
Yangtze River Infrastructure Yangtze River Infrastructure DevelopmentDevelopment
Jon Monroe ConsultingJon Monroe Consulting
www.yangtzeriverports.com

Jon Monroe ConsultingJon Monroe Consulting 22
Yangtze River OverviewYangtze River Overview
An Emerging Economic CorridorAn Emerging Economic Corridor
Jon Monroe ConsultingJon Monroe Consulting 33

Jon Monroe ConsultingJon Monroe Consulting 44
We believe a river system is more than the sum of it’s ports.
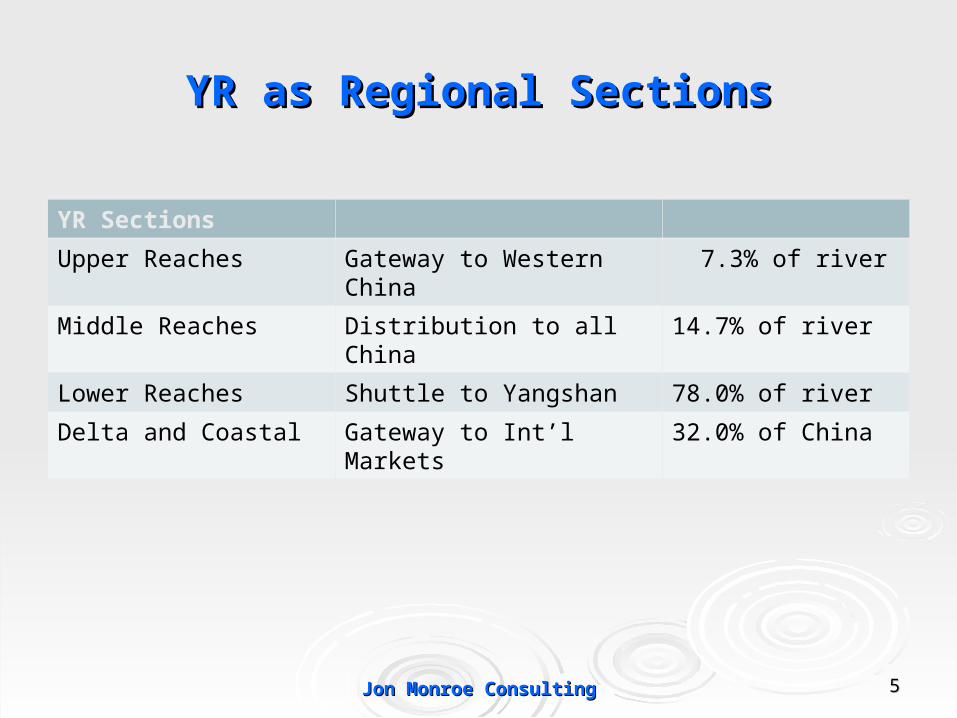
YR as Regional SectionsYR as Regional Sections
YR Sections
Upper Reaches Gateway to Western China 7.3% of river
Middle Reaches Distribution to all China 14.7% of river
Lower Reaches Shuttle to Yangshan 78.0% of river
Delta and Coastal Gateway to Int’l Markets 32.0% of China
Jon Monroe ConsultingJon Monroe Consulting 55

Jon Monroe ConsultingJon Monroe Consulting 66
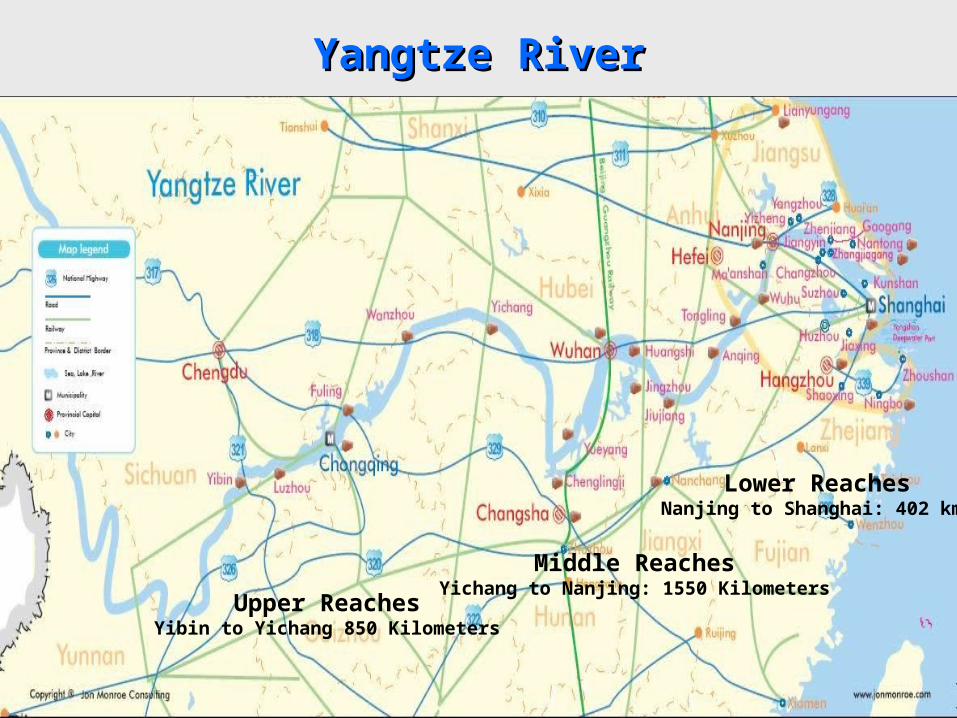
Yangtze RiverYangtze River
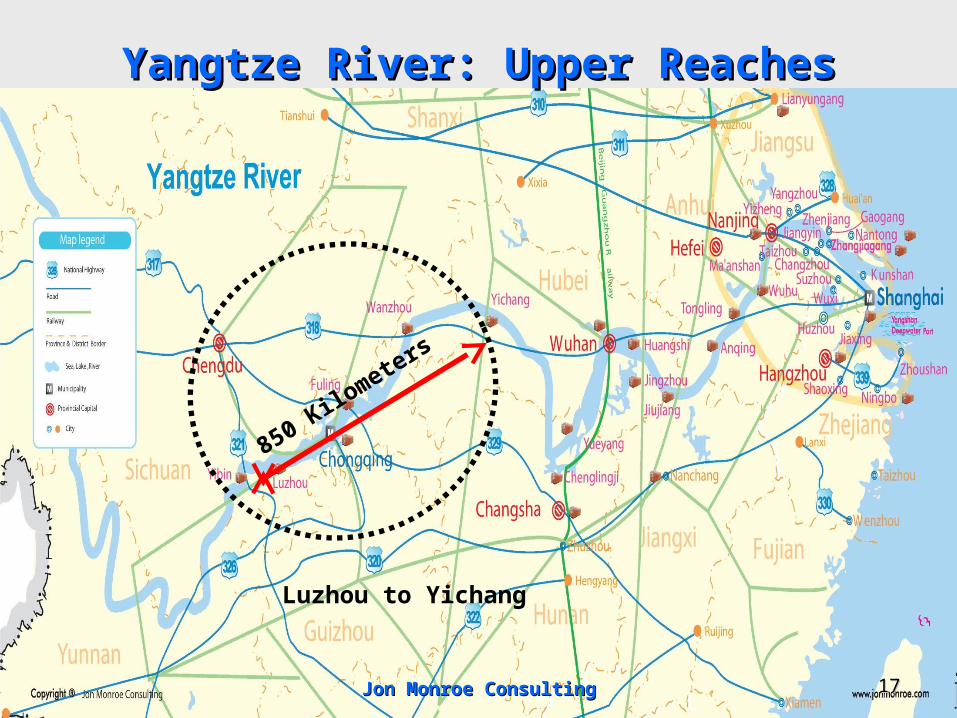
Upper ReachesYibin to Yichang 850 Kilometers
Middle ReachesYichang to Nanjing: 1550 Kilometers
Lower ReachesNanjing to Shanghai: 402 km
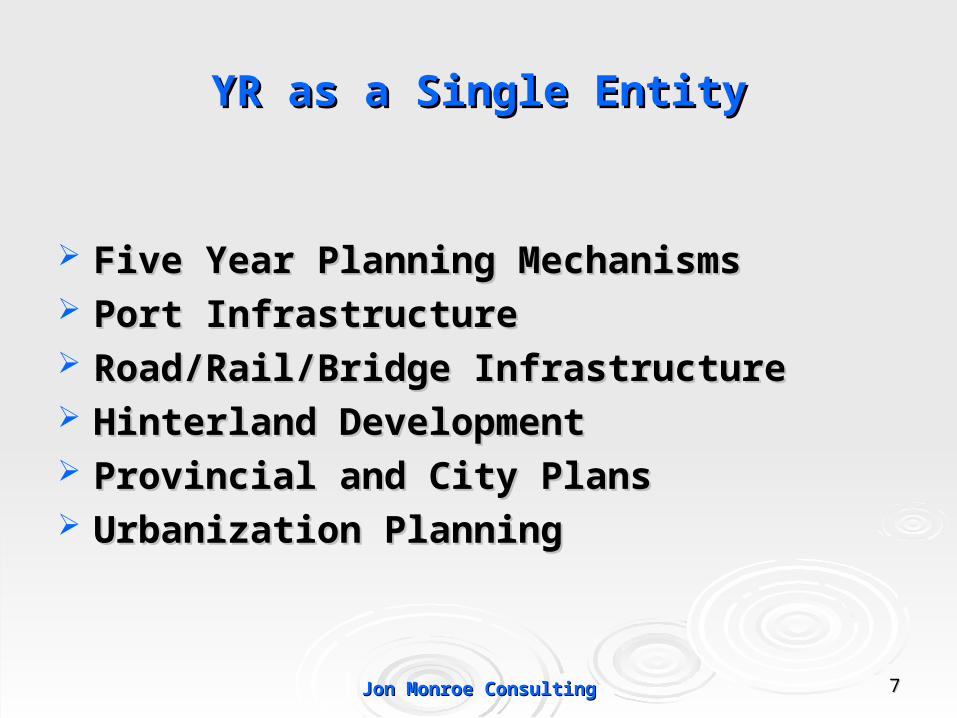
YR as a Single EntityYR as a Single Entity
Five Year Planning MechanismsFive Year Planning Mechanisms Port InfrastructurePort Infrastructure Road/Rail/Bridge InfrastructureRoad/Rail/Bridge Infrastructure Hinterland DevelopmentHinterland Development Provincial and City PlansProvincial and City Plans Urbanization PlanningUrbanization Planning
Jon Monroe ConsultingJon Monroe Consulting 77

SichuanPop: 84.3 Mil
GDP:1.05 trillion RMBCity: Chengdu
Port: Luzhou, Yibin
ChongqingPop: 30.9 mil
GDP: 411 billion RMBCity: MunicipalityPort: Chongqing
JiangxiPop: 43.4 mil
GDP:547 billion RMBCity: Nanchang
Port:Jiujiang
HunanPop: 63.42 mil
GDP: 914.5 billion RMBCity: ChangshaPort:Yueyang
JiangsuPop: 71.1 mil
GDP: 2.56 trillion RMBCity: Nanjing
Port: Nanjing, Lianyungang
ZhejiangPop: 43.43 mil
GDP:1.86 trillion RMBCity: Hangzhou
Port: Ningbo
ShanghaiPop: 17 mil
GDP: 1.2 trillion RMBCity: Municipality
Port: Shanghai
AnhuiPop: 60.7 mil
GDP: 735 billion RMBCity: Hefei
Port: Tongling, Ma’anshan
HubeiPop: 58.25 mil
GDP: 915 billion RMBCity: Wuhan
Port: Wuhan, Yichang
Yangtze River Basin• Seven Provinces: 424.6 mil• Two Municipalities: 48.0 mil
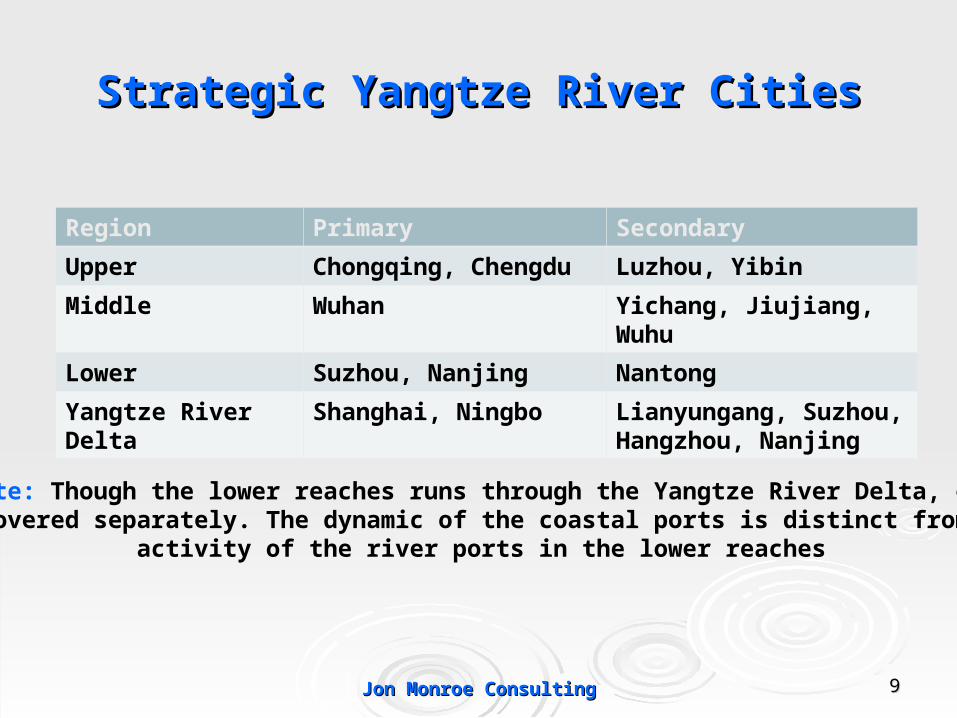
Strategic Yangtze River CitiesStrategic Yangtze River Cities
Region Primary Secondary
Upper Chongqing, Chengdu Luzhou, Yibin
Middle Wuhan Yichang, Jiujiang, Wuhu
Lower Suzhou, Nanjing Nantong
Yangtze River Delta Shanghai, Ningbo Lianyungang, Suzhou, Hangzhou, Nanjing
Jon Monroe ConsultingJon Monroe Consulting 99
Note: Though the lower reaches runs through the Yangtze River Delta, eachis covered separately. The dynamic of the coastal ports is distinct from the
activity of the river ports in the lower reaches

Key YR Economic RegionsKey YR Economic Regions
Economic Region Location Coverage Comments
Shanghai Metro Circle Yangtze River Delta
Shanghai, Jiangsu, Zhejiang
Covers all YRD
SuXiChang Metro Circle Lower Reaches
Jiangsu Suzhou-Wuxi
Nanjing Metro Circle Lower Reaches
Jiangsu, Anhui Extends YRD to Anhui
Wuhan Metro Circle Middle Reaches
Hubei and beyond
Primary Economic Corridor MR
Chengdu – Chongqing Upper Reaches
Chongqing-Sichuan
Primary Economic Corridor UR
Xuzhou Metro Circle N. Jiangsu Jiangsu, Anhui, Henan, Shandong
Developing Economic Corridor
Hangzhou Metro Circle Zhejiang Zhejiang
Jon Monroe ConsultingJon Monroe Consulting 1010
Jon Monroe ConsultingJon Monroe Consulting 1111
Yangtze RiverYangtze River
Upper ReachesYibin to Yichang 850 Kilometers
Middle ReachesYichang to Nanjing: 1550 Kilometers
Lower ReachesNanjing to Shanghai: 402 km

Top 10 Yangtze River PortsTop 10 Yangtze River PortsRk Port 2008 2009 % 2010
1 Suzhou Ports 2,448,809 2,723,913 11.2 3,644,000 33.8%
Taicang 1,450,495 1,513,161 4.3 2,211,500 46.1%
Zhangjiagang 814,220 870,312 6.9 1,088,810 25.1%
Changshu 305,300 340,440 11.5 343,690 1.5%
2 Nanjing 1,280,265 1,200,326 -6.2 1,415,610 17.9%
3 Jiangyin 502,200 699,733 39.3 1,001,000 43.0%
4 Wuhan 473,797 563,700 19.0 648,800 15.1%
5 Chongqing 482,893 465,400 -3.6 500,070 7.4%
6 Nantong 443,300 350,600 -20.9 462,000 31.8%
7 Zhenjiang 292,400 280,700 -4.0 257,740 -11.9%
8 Yangzhou 267,968 220,943 -17.6 287,350 30.0%
9 Wuhu 164,106 99,525 -39.4 142,630 43.3%
10 Jiujiang 80,927 100,666 24.4 120,570 19.8%
Others 423,899 493,553 16.4 697,332 41.3%
Total 6,981,610 7,199,059 3.1 9,177,102 27.4%Jon Monroe ConsultingJon Monroe Consulting
1212

Yangtze River 12Yangtze River 12thth 5 Year Plan Summary 5 Year Plan Summary
Gov’t will spend rmb 36bil/US$ 5.6bil on Yangtze Gov’t will spend rmb 36bil/US$ 5.6bil on Yangtze River under 12River under 12thth 5 Year Plan (vs rmb 13.2 bill in 11 5 Year Plan (vs rmb 13.2 bill in 11thth plan)plan)
Devlopment of YR Port ClustersDevlopment of YR Port Clusters Shift to Regional CooperationShift to Regional Cooperation More investment in Hydroelectric power on riverMore investment in Hydroelectric power on river Continue Dredging and standardization of container Continue Dredging and standardization of container
vesselsvessels Expand Hinterlands, especially railExpand Hinterlands, especially rail
Jon Monroe ConsultingJon Monroe Consulting 1313

YR Container Port ProjectionsYR Container Port Projections
2008 TEU 2009 TEU % 2020 TEU CAGR
Upper Reaches 549,130 526,081 -4.2% 5,430,000 23.64%
Middle Reaches 973,924 1,059,988 8.84% 9,300,000 21.83%
Lower Reaches 5,458,556 5,612,920 2.83% 40,360,000 19.64%
YR Sub Total 6,981,610 7,198,989 3.10% 55,090,000 20.48%
Coastal Ports 42,470,000 39,240,000 -7.6% 88,900,000 7.72%
Total 49,451,610 46,438,989 -6.1% 143,990,000 10.84%
Jon Monroe ConsultingJon Monroe Consulting 1414
By 2020, YR & Delta design capacity will be greater than all of China throughput in 2009
2020 projections based upon current port plans for new construction & expansion

Upper ReachesUpper Reaches
““Go West”Go West”
Jon Monroe ConsultingJon Monroe Consulting 1515

Jon Monroe ConsultingJon Monroe Consulting
Upper Reaches Fact SheetUpper Reaches Fact Sheet
Includes the area from Yibin to YichangIncludes the area from Yibin to Yichang Chongqing can be reached by vessels of 1500 DWT Chongqing can be reached by vessels of 1500 DWT Expect the draft to increase to allow 2500 DWT Expect the draft to increase to allow 2500 DWT
vessels to reach Chongqing vessels to reach Chongqing Most cities on a hill due to rising waters of RiverMost cities on a hill due to rising waters of River Major market in the Chongqing-Chengdu corridor Major market in the Chongqing-Chengdu corridor
reaching more than 100 million peoplereaching more than 100 million people Transit to Shanghai by barge is 7-9 daysTransit to Shanghai by barge is 7-9 days Increased investment in 12Increased investment in 12thth 5 Year Plan 5 Year Plan
Jon Monroe ConsultingJon Monroe Consulting 1717
Yangtze River: Upper ReachesYangtze River: Upper Reaches
850 Kilometers
Luzhou to Yichang

Upper Reaches CitiesUpper Reaches Cities
Jon Monroe ConsultingJon Monroe Consulting 1818
Chongqing
Chengdu
Yibin 3 Gorges Dam Yichang
260km
263km 650km
177km
123km Luzhou
299km

Upper Reaches: Key River PortsUpper Reaches: Key River Ports
Port 2008 Ton 2009 Ton % 2008 TEU 2009 TEU %
Yibin 7.72 mil 8.52 mil 10.4% N/A N/A N/A
Luzhou 11.21 mil 11.64 mil 3.8% 66,237 60,681 -8.4%
Chongqing 14.71 mil 13.0 mil -11.6% 434,797 416,400 -4.2%
Fuling 2.41 mil 5.5 mil 128% 30,086 28,000 -7%
Wanzhou 8.22 mil 8.78 mil 6.9% 18,010 21,000 16.6%
Total 44.27 mil 44.33 mil 7.2% 549,130 526,081 -4.2%
Jon Monroe ConsultingJon Monroe Consulting 1919
Source: Respective Port Authorities

Jon Monroe ConsultingJon Monroe Consulting 2020
Upper Reaches: Infrastructure Upper Reaches: Infrastructure ChallengesChallenges
Source: Jon Monroe Consulting

Jon Monroe ConsultingJon Monroe Consulting 2121
Source: Jon Monroe Consulting
6 to 8 moves per hour vs 32+

Jon Monroe ConsultingJon Monroe Consulting 2222
Source: Jon Monroe Consulting

SIPG Chongqing Chayuan TerminalSIPG Chongqing Chayuan Terminal
Source: Jon Monroe Consulting
Jon Monroe ConsultingJon Monroe Consulting

Upper Reaches ProjectionsUpper Reaches Projections Companies are relocating westward to the upper reaches of the Companies are relocating westward to the upper reaches of the
Yangtze River; Examples: Foxconn, Hewlett Packard, Apple Computer, Yangtze River; Examples: Foxconn, Hewlett Packard, Apple Computer, Amazon, APL and MaerskAmazon, APL and Maersk
Upper reaches container traffic is expected to grow ten times 2009 Upper reaches container traffic is expected to grow ten times 2009 throughput by 2020throughput by 2020
Three port groups driving this growth; Sichuan Port Group, Three port groups driving this growth; Sichuan Port Group, Chongqing Port Group and Shanghai International Port GroupChongqing Port Group and Shanghai International Port Group
Financial crisis will expedite this movement as companies focus on Financial crisis will expedite this movement as companies focus on costcost
Most upper reaches container movement is direct to Shanghai via Most upper reaches container movement is direct to Shanghai via either Waogaoqiao or Yangshan Ports either Waogaoqiao or Yangshan Ports
Upper reaches infrastructure is being rapidly constructed to support Upper reaches infrastructure is being rapidly constructed to support port; rail intermodal movement might not be for some timeport; rail intermodal movement might not be for some time
Chongqing Government will subsidize logistics companies who move Chongqing Government will subsidize logistics companies who move into one of the development zonesinto one of the development zones
Jon Monroe ConsultingJon Monroe Consulting 2424

Middle ReachesMiddle Reaches
““Booming Central China”Booming Central China”
Jon Monroe ConsultingJon Monroe Consulting 2525
Jon Monroe ConsultingJon Monroe Consulting 2626
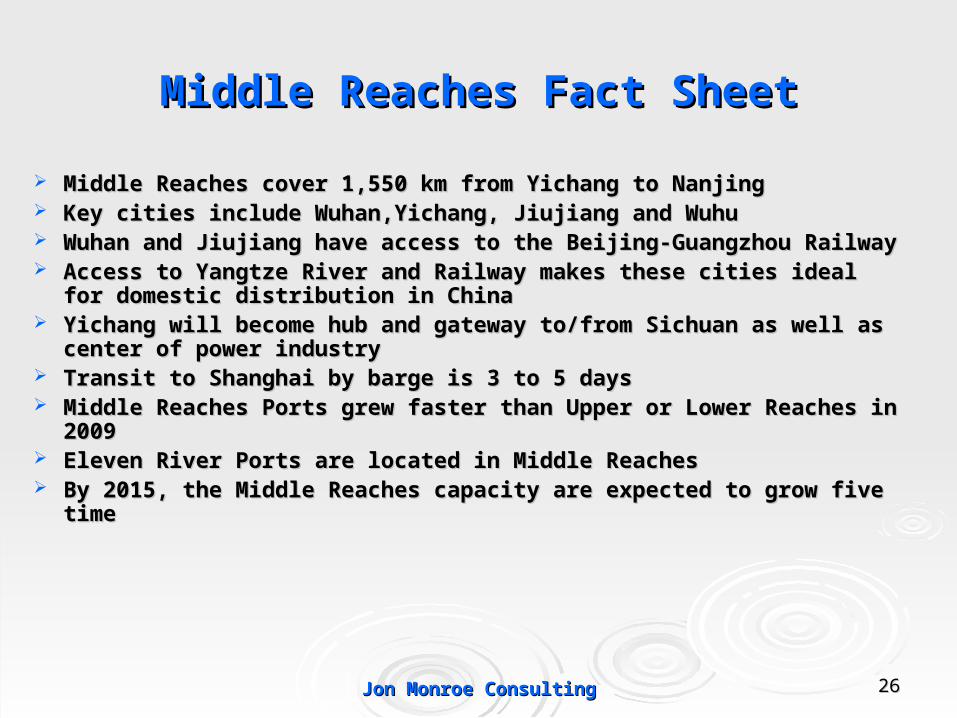
Middle Reaches Fact SheetMiddle Reaches Fact Sheet
Middle Reaches cover 1,550 km from Yichang to NanjingMiddle Reaches cover 1,550 km from Yichang to Nanjing Key cities include Wuhan,Yichang, Jiujiang and Wuhu Key cities include Wuhan,Yichang, Jiujiang and Wuhu Wuhan and Jiujiang have access to the Beijing-Guangzhou RailwayWuhan and Jiujiang have access to the Beijing-Guangzhou Railway Access to Yangtze River and Railway makes these cities ideal for Access to Yangtze River and Railway makes these cities ideal for
domestic distribution in Chinadomestic distribution in China Yichang will become hub and gateway to/from Sichuan as well as Yichang will become hub and gateway to/from Sichuan as well as
center of power industrycenter of power industry Transit to Shanghai by barge is 3 to 5 daysTransit to Shanghai by barge is 3 to 5 days Middle Reaches Ports grew faster than Upper or Lower Reaches in Middle Reaches Ports grew faster than Upper or Lower Reaches in
20092009 Eleven River Ports are located in Middle ReachesEleven River Ports are located in Middle Reaches By 2015, the Middle Reaches capacity are expected to grow five timeBy 2015, the Middle Reaches capacity are expected to grow five time

Jon Monroe ConsultingJon Monroe Consulting 2727
Middle ReachesMiddle Reaches
Yichang to Nanjing: 1,550 km

Middle Reaches Key CitiesMiddle Reaches Key Cities
Jon Monroe ConsultingJon Monroe Consulting 2828
Yichang
300km
44km
Wuhan
WuhuHefei
Nanchang
Jiujiang
142km
415k
m
469km
240km
133km376km
3 Gorges Dam
To Nanjing
Yangtze River

Middle Reaches: Key River PortsMiddle Reaches: Key River Ports
Port 2008 Ton 2009 Ton % 2008 TEU 2009 TEU %
Yichang 33.32 mil 35.38 mil 6.2% 42,496 44,455 4.6%
Wuhan 55.92 mil 54.09 mil -3.3% 473,637 563,700 19%
Jujiang 61.82 mil 82.84 mil 34% 80,927 100,666 24.3%
Wuhu 55.14 mil 57.09 mil 3.6% 164,106 99,525 -39.4%
Sub Total 206.19 mil 229.39 mil 11.2% 761,166 808,346 6.2%
Others 211.12 mil 218.57 mil 3.5% 212,000 251,642 18.6%
Total 417.32 mil 447.96 mil 7.3% 973,924 1,059,988 8.8%
Jon Monroe ConsultingJon Monroe Consulting 2929
Source: Respective Port Authorities

Wuhan PortWuhan Port
Jon Monroe ConsultingJon Monroe Consulting 3030
Yangsi Terminal Yangluo Terminal
Source: Jon Monroe Consulting

Jon Monroe ConsultingJon Monroe Consulting 3131

Middle Reaches ProjectionsMiddle Reaches Projections Middle Reaches represents the longest stretch of the river, winding Middle Reaches represents the longest stretch of the river, winding
through four provinces; Hubei, Hunan, Jiangxi & Anhuithrough four provinces; Hubei, Hunan, Jiangxi & Anhui This includes eleven port cities; Hubei (4), Hunan (1), Jiangxi (1) and This includes eleven port cities; Hubei (4), Hunan (1), Jiangxi (1) and
Anhui (5)Anhui (5) Middle Reaches is expected to grow five times 2009 by 2015, a CAGR Middle Reaches is expected to grow five times 2009 by 2015, a CAGR
of 32.75%of 32.75% Four port cities are instrumental to Middle Reaches growth; Yichang, Four port cities are instrumental to Middle Reaches growth; Yichang,
Wuhan, Jiujiang and WuhuWuhan, Jiujiang and Wuhu Two cities are the best positioned strategically to develop the Middle Two cities are the best positioned strategically to develop the Middle
Reaches and Central China; Yichang and WuhanReaches and Central China; Yichang and Wuhan Wuhan will dominate Middle Reaches and the rapidly developing Wuhan will dominate Middle Reaches and the rapidly developing
supporting rail and road infrastructure will support make Wuhan a supporting rail and road infrastructure will support make Wuhan a major distribution hub for Central Chinamajor distribution hub for Central China
Expect growth in the middle reaches during the 12Expect growth in the middle reaches during the 12 thth Five Year Plan Five Year Plan (2011 – 2015)(2011 – 2015)
Jon Monroe ConsultingJon Monroe Consulting 3232

Lower ReachesLower Reaches
““Shuttle for Eastern Manufacturing”Shuttle for Eastern Manufacturing”
Jon Monroe ConsultingJon Monroe Consulting

Lower Reaches Fact SheetLower Reaches Fact Sheet
Lower reaches cover 402 km from Nanjing to ShanghaiLower reaches cover 402 km from Nanjing to Shanghai The lower reaches has the highest density of river ports with ten The lower reaches has the highest density of river ports with ten
ports located on the YRports located on the YR The lower reaches ports represents 78% of the container The lower reaches ports represents 78% of the container
throughput of the Yangtze River throughput of the Yangtze River In 2008, Taicang Terminal passed Nanjing to become the largest In 2008, Taicang Terminal passed Nanjing to become the largest
container port on the Yangtze River and lower reachescontainer port on the Yangtze River and lower reaches The majority of container throughput in most lower reaches The majority of container throughput in most lower reaches
ports moves direct to Shanghai terminals supporting Shanghai ports moves direct to Shanghai terminals supporting Shanghai as a shipping centeras a shipping center
Nanjing, Nantong and Taicang have international direct calls to Nanjing, Nantong and Taicang have international direct calls to Hong Kong, Taiwan, Japan, Korea and SE AsiaHong Kong, Taiwan, Japan, Korea and SE Asia
Lower reaches container capacity is expected to triple 2009 Lower reaches container capacity is expected to triple 2009 throughput by 2015 throughput by 2015
Jon Monroe ConsultingJon Monroe Consulting 3434

Jon Monroe ConsultingJon Monroe Consulting 3535
Lower ReachesLower Reaches
Nanjing to Shanghai: 402 km

Lower Reaches Key CitiesLower Reaches Key Cities
Jon Monroe ConsultingJon Monroe Consulting 3636
Nantong
Nanjing
To Shanghai52
km
90km
192kmZhangjiagang
Taicang
Suzhou
87km
Yangtze River
From Wuhu
82km
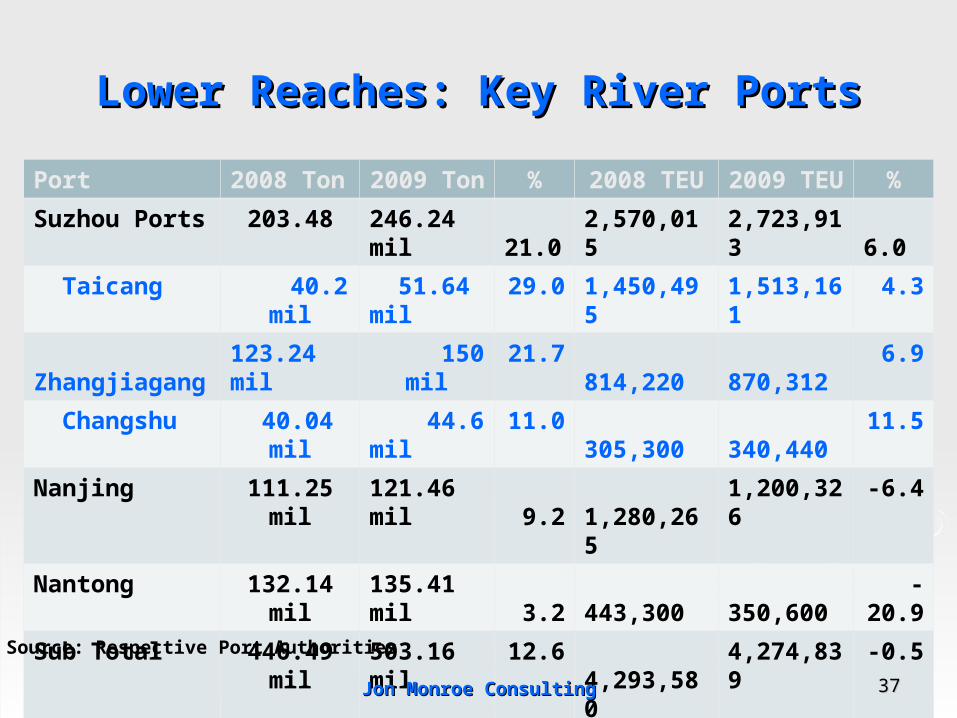
Lower Reaches: Key River PortsLower Reaches: Key River Ports
Port 2008 Ton 2009 Ton % 2008 TEU 2009 TEU %
Suzhou Ports 203.48 246.24 mil 21.0 2,570,015 2,723,913 6.0
Taicang 40.2 mil 51.64 mil 29.0 1,450,495 1,513,161 4.3
Zhangjiagang 123.24 mil
150 mil
21.7 814,220 870,312 6.9
Changshu 40.04 mil 44.6 mil 11.0 305,300 340,440 11.5
Nanjing 111.25 mil 121.46 mil 9.2 1,280,265 1,200,326 -6.4
Nantong 132.14 mil 135.41 mil 3.2 443,300 350,600 -20.9
Sub Total 446.49 mil 503.16 mil 12.6 4,293,580 4,274,839 -0.5
Other 285.6 mil 334.36 mil 17.0 1,164,976 1,338,081 14.8
Total 732.09 mil 837.53 mil 14.4 5,458,556 5,612,920 2.8
Jon Monroe ConsultingJon Monroe Consulting 3737
Source: Respective Port Authorities

Taicang TerminalTaicang Terminal
Jon Monroe ConsultingJon Monroe Consulting 3838

Lower Reaches Projections - 1Lower Reaches Projections - 1
The lower reaches of the Yangtze River runs through a single The lower reaches of the Yangtze River runs through a single province, Jiangsu, encompassing ten river portsprovince, Jiangsu, encompassing ten river ports
The top four ports along the Yangtze River, by TEU throughput, are The top four ports along the Yangtze River, by TEU throughput, are Taicang, Nanjing, Zhangjiagang and Jiangyin, all located in the lower Taicang, Nanjing, Zhangjiagang and Jiangyin, all located in the lower reachesreaches
The lower reaches container activity accounted for 78% of total The lower reaches container activity accounted for 78% of total Yangtze River container activityYangtze River container activity
Suzhou Port as a combined port group, is the largest container and Suzhou Port as a combined port group, is the largest container and general cargo port along the Yangtze River general cargo port along the Yangtze River
In 2008, Taicang surpassed Nanjing to become the largest container In 2008, Taicang surpassed Nanjing to become the largest container port along the Yangtze Riverport along the Yangtze River
Jon Monroe ConsultingJon Monroe Consulting 3939

Lower Reaches Projections - 2Lower Reaches Projections - 2
In 2009, Zhangjiagang surpassed Nantong to become the In 2009, Zhangjiagang surpassed Nantong to become the largest general cargo port along the Yangtze Riverlargest general cargo port along the Yangtze River
Most of the manufacturing activity in the lower reaches has Most of the manufacturing activity in the lower reaches has been contained in South Jiangsubeen contained in South Jiangsu
As manufacturing activity moves north in Jiangsu Province, As manufacturing activity moves north in Jiangsu Province, Nantong becomes a more viable port, putting it in a more Nantong becomes a more viable port, putting it in a more strategic position relative to the other Yangtze River portsstrategic position relative to the other Yangtze River ports
The close proximity of the ten lower reaches ports will create a The close proximity of the ten lower reaches ports will create a competitive environment due to the overlapping hinterlands competitive environment due to the overlapping hinterlands
Logistics facilities are moving from Shanghai to lower reaches Logistics facilities are moving from Shanghai to lower reaches cities like Nanjing, Suzhou and Kunshan cities like Nanjing, Suzhou and Kunshan
Jon Monroe ConsultingJon Monroe Consulting 4040

Yangtze River DeltaYangtze River Delta
““An economic engine…..An economic engine…..
& &
Gateway to the World”Gateway to the World”
Jon Monroe ConsultingJon Monroe Consulting

Jon Monroe ConsultingJon Monroe Consulting 4242
Yangtze River Delta Fact SheetYangtze River Delta Fact Sheet The YRD accounts for 21.4% of China’s GDP with only 11.1% of The YRD accounts for 21.4% of China’s GDP with only 11.1% of
the population and 2.2% of land areathe population and 2.2% of land area The YRD embraces Shanghai Municipality and 15 cities of The YRD embraces Shanghai Municipality and 15 cities of
Zhejiang and Jiangsu ProvincesZhejiang and Jiangsu Provinces YRD cities are promoting regional integration for growth and YRD cities are promoting regional integration for growth and
economic activityeconomic activity Most of the manufacturing sector along the Yangtze River has Most of the manufacturing sector along the Yangtze River has
settled in this areasettled in this area Five Metro Circles have been developed to drive YRD cities Five Metro Circles have been developed to drive YRD cities
integration: Shanghai, SuXiChang, Nanjing, Xuzhou and integration: Shanghai, SuXiChang, Nanjing, Xuzhou and HangzhouHangzhou
Rail, road and bridge infrastructure has been completed to Rail, road and bridge infrastructure has been completed to support this integration including four major bridges; Donghai, support this integration including four major bridges; Donghai, SuTong, Hangzhou Bay and Zhoushan Cross Sea BridgeSuTong, Hangzhou Bay and Zhoushan Cross Sea Bridge
Two largest Yangtze River ports, Taicang and Zhangjiagang; Two largest Yangtze River ports, Taicang and Zhangjiagang; and two largest coastal ports in China, Shanghai and Ningbo and two largest coastal ports in China, Shanghai and Ningbo are all located in YRD are all located in YRD

Yangtze River Delta Economic IndicatorsYangtze River Delta Economic Indicators
Indicator 2008 2009 2010
YRD GDP (billion RMB) 6,520.91 7,179.39 8,460.00
China GDP (billion RMB) 30,067.00 33,535.30 39,500.00
YRD % 21.7% 21.4% 21.4%
YRD FDI (billion USD) 45.27 45.76 50.62
China FDI (billion USD) 92.40 90.03 105.70
YRD % 48.9% 50.8% 47.9%
Jon Monroe ConsultingJon Monroe Consulting 4343
Source: China National Statistics Bureau
Note: GDP stated in RMB and FDI stated in USD

Jon Monroe ConsultingJon Monroe Consulting 4444Jon Monroe ConsultingJon Monroe Consulting

Yangtze River Delta: Key Coastal PortsYangtze River Delta: Key Coastal Ports
Port 2008 Ton 2009 Ton % 2008 TEU 2009 TEU
%
Shanghai 582.0 mil 592.0 mil 1.7% 28.01 mil 25.0 mil -10.7%
Ningbo 520.47 mil 577.57 mil 11.0% 10.93 mil 10.5 mil - 3.9%
Sub Total 1,102.47 mil 1,169.57 mil 6.0% 38.94 mil 35.5 mil -11.2%
Others 226.55 mil 261.08 mil 15.2% 3.53 mil 4.4 mil 25.7%
Total 1329.02 mil 1,430.65 mil 7.6% 42.47 mil 39.2 mil -7.6%
Jon Monroe ConsultingJon Monroe Consulting 4545

Jon Monroe ConsultingJon Monroe Consulting 4646
NantongNanjing
Shanghai
ZhenjiangChangzhou
Suzhou
Yangtze River
YangzhouTaizhou
Wuxi
JingHang Canal
Ningbo
HuzhouJiaxing
Shaoxing
Hangzhou
Wenzhou
Yancheng
Lianyungang
Xuzhou
Taizhou
YRD Coastal
To Shandong Province
Zhoushan
Hangzhou Bay Bridge
Taihu Lake
Yellow Sea
East China Sea
16 YRD Cities
25 YRD Cities
Suqian Huai’an
+
+ +
QuzhouJinhua
Lishui
To Jiangxi Province
To AnhuiProvince

Jon Monroe ConsultingJon Monroe Consulting 4747
Major City ClusterYangtze River Delta 130+ million people GDP 3.9 Tril yuan
Emerging City Cluster Middle Reaches Yangtze River 58 million people GDP 1 Tril yuan
Emerging City ClusterChongqing-Sichuan115 million people GDP 1.2 Tril yuan
Yangtze River CorridorYangtze River Corridor

Where Are We?Where Are We? Mfg costs going up in YRDMfg costs going up in YRD Focusing on cooperative development among YRD CitiesFocusing on cooperative development among YRD Cities Approximately 70% of the traffic along Yangtze River Approximately 70% of the traffic along Yangtze River
moves within YRDmoves within YRD Expect more cooperation between YRD cities and cities Expect more cooperation between YRD cities and cities
in the upper and middle reaches of Yangtze Riverin the upper and middle reaches of Yangtze River More companies will locate in YRD as a base to access More companies will locate in YRD as a base to access
central and Western Chinacentral and Western China Expect larger vessels to call Nanjing and move direct to Expect larger vessels to call Nanjing and move direct to
foreign portsforeign ports
Jon Monroe ConsultingJon Monroe Consulting 4848

SummarySummary
Jon Monroe ConsultingJon Monroe Consulting 4949

Yangtze River SummaryYangtze River Summary
Yangtze River may well become the world’s largest economic corridor Yangtze River may well become the world’s largest economic corridor by 2020by 2020
China’s central planning will encourage western movement and China’s central planning will encourage western movement and cooperation as well as competition among city’s and portscooperation as well as competition among city’s and ports
The river can be regionalized into four sections: upper, middle, lower The river can be regionalized into four sections: upper, middle, lower and delta & coastaland delta & coastal
Rapid urbanization and an improved infrastructure will drive this Rapid urbanization and an improved infrastructure will drive this process process
Port development capacity may well exceed demandPort development capacity may well exceed demand By 2020, China will have the most sophisticated manufacturing and By 2020, China will have the most sophisticated manufacturing and
transportation infrastructure in the world connecting ports and cities transportation infrastructure in the world connecting ports and cities via rapid rail, road and air networks.via rapid rail, road and air networks.
This will be supported by a shift from dependence on exports to a This will be supported by a shift from dependence on exports to a more balanced trade flow and a strong domestic economymore balanced trade flow and a strong domestic economy
Jon Monroe ConsultingJon Monroe Consulting 5050

www.yangtzeriverports.comwww.yangtzeriverports.com 5151
Thank YouThank You