1 XSIF—2010 Primer Stock Fundamental Analysis. 2 Valuation Approaches 1.Discounted CF: Value stock...
109
1 XSIF—2010 Primer Stock Fundamental Analysis
-
Upload
nathaniel-floyd -
Category
Documents
-
view
216 -
download
0
Transcript of 1 XSIF—2010 Primer Stock Fundamental Analysis. 2 Valuation Approaches 1.Discounted CF: Value stock...

1
XSIF—2010 Primer
Stock FundamentalAnalysis

2
Valuation Approaches
• Valuation Approaches
1. Discounted CF: Value stock based on the PV of the expected CF: dividends, FCF, or FCFE.
2. Relative Valuation: P/E, P/BV, P/CF, or P/S.
• Note: Both require estimating k and g.

3
Discounted Cash Flow
• Dividends:– Model
– Gordon:
– 2-stage or 3-stage growth model
1tt
t
)k1(
)g1(DV
gk
DV 1

4
Discounted Cash Flow• Cash Flow Model:• Free cash flow to equity: Cash flow left after meeting obligations to
capital suppliers: debt and preferred.– Model
– Constant Growth:
• where: g = growth in FCFE
– 2-stage or 3-stage growth model
1tt
t
)k1(
)g1(FCFEV
gk
FCFEV 1

5
Relative Valuation
• P/E or Multiplier Approach:
• Gordon P/E:
• Example: Expected D/E = .5, k = .12, g = .08, then P/E = 12.5.
• Note: Small changes in k or g have large impact on P/E.
EPSMonth12Expected
icePrMarketCurrent
E
P
gk
E/D
E
P 11

6
Relative Valuation
• P/CF
• Constant Growth: P/CF:
• CF = EBDITDA (typically used)
CFMonth12Expected
icePrMarketCurrent
CF
P
gk
CF/D
CF
P 11

7
Relative Valuation
• P/BV
• P/S:
BVEndYearExpected
icePrMarketCurrent
BV
P
ShareperSalesExpected
icePrMarketCurrent
S
P

8
Points on Relative Valuation
• Comparative analysis: company to industry (or comparable companies) and to market
• Comparative and time-series analysis: compare company, industry, and market over time.

9
g, k, and eps
• Both the Dividend Discounted Cash Flow and Relative Valuation Approaches depend on estimating g and k.
• Both models also need to be compared to an estimated earnings or eps.

10
Estimating g
• In discounted dividend model and the P/E model, g is the growth rate in dividends.
• The growth rate in dividends will equal the growth rate in EPS if the D/E is constant.
• If D/E are increasing (decreasing) over time, then growth rate in DPS will be greater (less) than the growth rate in EPS.

11
Estimating g: Historical
• Historical Growth Rates:
• Calculate historical growth rate in dividends or earnings.
• Remember: More is better and recent is relevant.

12
Estimating g: Historical
• Historical: Geometrical:
• Example:
1D
Dg
)g1(DD
n/1
0
n
n0n
%87.14105.0$
20.0$g
1D
Dg
10/1
10/1
1998
2008

13
Estimating g: Historical
• Linear Regression:
– where:
• Log linear form:
– where:
tbaEPS
t
EPSb
tbaEPSln
EPS%Averageb

14
Estimating g: Sustainable Growth
• Sustainable Growth Rate:
• Estimate:
iE
Iifg
ROE)RR(g
ROEE
REg

15
Estimating g: Sustainable Growth
• Estimating ROE:
1. Estimate ROE directly: • Historical Average• Regression
2. Use DuPont System (or Extended System):
E
A
A
S
S
EROE
Equity
Assets
Assets
Sales
Sales
IncomeNetROE

16
Estimating g: Sustainable Growth• Estimating ROE:• Comparative Analysis: Compare the ratios of the
company, industry (or comparable companies), and market.
• Set up Bloomberg table:
Year
Firm
E/S S/A A/E ROE
Industry
E/S S/A A/E ROE
Market
E/S S/A A/E ROE
1980
:
2007
Mean
σ

17
Estimating g: Sustainable Growth
• From your comparison, you can determine ROE to be above or below the industry or market.
• By comparing ratio, you may get some insight on explain relative ROE.
• Note: Bloomberg provides sustainable growth rates.

18
Estimating k• Estimate k by examining fundamental
risk factors
• Fundamental risk factors:– Liquidity (Internal) Risk = LR– Business Risk = BR– Financial Risk = FR– Exchange-Rate Risk = ER– Market or External Liquidity Risk = ELR
RPRk f

19
Estimating k• Methodology: 1. Conduct a relative analysis of each risk:
Company, industry, and market.
2. Compare historical RP of company, industry, and market.
3. Based on analysis, determine if the company’s RP should be greater, equal or less than the industry and market.

20
Liquidity Risk• Do a comparative analysis of liquidity
ratios:
• Liquidity Ratios:
CL
CARatioCurrent
CL
ceivablesRe.Sec.MktCashRatioQuick
CL
.Sec.MktCashRatioCash

21
Liquidity Risk
• Liquidity Ratios:
ceivablesReAccountsAverage
SaleAnnualNetTurnoversceivableRe
TurnoverceiverRe.Av
365PeriodCollectionAverage
InventoryAverage
SoldGoodsofCostTurnoversInventory
TurnoverInventoryAnnual.Av
365TimegsinocesPrInventory.Av

22
Liquidity Risk• Comparative Analysis: Compare the ratios of the company,
industry (or comparable companies), and market.• Set up Bloomberg Table.• Determine if the company has more or less liquidity risk than
industry, and market.
Year
Firm
CR QR CR RT CP IT IP
Industry
CR QR CR RT CP IT IP
Market
CR QR CR RT CP IT IP
1980
:
2007
Mean
σ

23
Business Risk• Measure:
• Profitability Ratios: – Gross Profit Margin = Gross Profit/Sales
– Operating Profit Margin = Operating Profit/Sales
– Net Profit Margins = Net Income/Sales
• Do a comparative analysis
• Look at the variability of the margins.

24
Business Risk
• Measure
1. Coefficient of Variation (CV) in operating income:
– CV = σ(operating income)/μ(operating income)
2. Coefficient of Variation (CV) in operating income:
– CV = σ(Sales)/μ(Sales)

25
Business Risk• Analysis of Business Risk – Points1. Companies with a high operating leverage have high
operating profit margins. As a result, their earnings vary more with sales – implies high unlevered beta.
2. High operating leverage companies tend to have higher earnings in economic expansion and lower in economic slowdowns.
3. Steel Companies have high operating leverages and operating margins. They should have higher CV
4. Retail Companies tend to have lower operating leverages and margins and therefore should have lower CV.
5. Sales of cyclical sectors – auto or steel – will be more volatile than noncyclicals – hospital services.

26
Operating Leverage: When a project has multiple methods of producing, the business risk of a capital budgeting project is determined in part by the project’s operating leverage.
• Operating leverage relates to the mix of fixed (capital) and variable inputs (labor) used to produce the product. It exist whenever there are multiple methods of producing a product. This allows the firm a choice of spending more on fixed inputs and less on variable or vice versa.
• When there is more fixed inputs relative to variable, then the project’s profit is more sensitive to sales and vice versa.
Business Risk

27
• Operating Leverage is characterized by the slope of profit/sales graph of the project. Consider a small wine seller who is evaluating two alternative processes for producing wine: Process A which would cost $120,000 to buy and install and would have a variable cost of $0.57/bottle; Process B which would cost $30,000 to buy and install and would have a variable cost of $0.72/bottle.
070,27943./000,120$SalesEB
S)43(.SmOperating
43.)AVCP(m
00.1$icePr
unit/57.0$CostVariableAverage
000,120$CostFixed
:AocessPr
TVCSalesvenueReNetTotal
SalesUnit SalesUnit
$ $TVCSalesvenueReNetTotal
000,120$
CostFixed
000,30$
CostFixed
43.m
28.m
143,10728./000,30$SalesEB
S)28(.SmOperating
28.)AVCP(m
00.1$icePr
unit/72.0$CostVariableAverage
000,30$CostFixed
:BocessPr
070,279 143,107
Business Risk

28
Financial Risk• Financial risk is uncertainty due to debt.
• Because of the fixed cost on debt, companies with high debt/equity ratios will find that in economic expansion, the net earnings available to shareholders will increase by a greater proportion and in economic downturns the proportion available will decrease by a larger proportion.
• Plus, the higher the debt/equity ratio the greater the possibility of default and bankruptcy.

29
Financial Leverage: When a firm has some debt financing, the debt portion of the financing cost are fixed rather than variable.
• Shareholders’ variability in realized return will vary more, the greater the proportion of assets financed by debt.
• Shareholders’ return, Re, in an all equity firm is the same as the firm’s realized return, RA.
• Shareholders’ return in a leveraged firm is the return realized after the payment to bondholders.
Financial Risk

30
Financial Leverage:• Consider an investment valued at $100M that could be
financed with all equity or leveraged with $50M in equity (E) financing and $50M in debt (L) financing. Assume no taxes and the firm pays kd = 10% on debt.
• Given different possible returns from the project, RA, the Re
for leverage financing will vary more than all-equity financing alternative.
• This can be seen comparing the changes in Re for changes in RA for the two financing alternatives.
Financial Risk

31
Financial Leverage:
iabilityvargreaterR
RE/L
)E/L(R)E/A(RRE
LRARR
A
e
dAe
dAe
%10%10%30%50%20%20
%10%10%20%50%15%15
%10%10%10%50%10%10
%10%10%0%50%5%5
%10%10000
RRRRRRR
1E/L:Financing0E/L:Financing
edeedeA
%10
0
%10
%20
%30
%10 %20%15
eR
AR%5
1E/L
0E/L
Financial Risk

32
Financial Risk• Measures of Financial Risk:• Balance-sheet ratio:
EquityDebt
DebtTL.LiabCurrentA/DTotal
AssetsTotal
DebtTLA/DTL
StockeferredPrCommon
)sObligationLease(PVTaxesDeferredDebtTLE/D
Equity
DebtTLE/DLT

33
Financial Risk• Measures of Financial Risk:• Coverage Ratios:
Interest
CFCoverageCF
ExpensesLeaseInterest
EarnigsInterestsLeaseEBITCoverageInterest
esargChInterestDebt
EBITCoverageInterest
• Note: Retail chains could have low L-T D/E, but because of leases and payables have high total D/A.

34
Financial Risk
• Bankruptcy Risk:• Determine ratio or set of ratios that
provide the best prediction of bankruptcy.
• Altman Z-Score:• Z = f(S/A, EBIT/A, Mkt. Value of
Stock/BV of Debt, RE/A)

35
Exchange-Rate Risk
• ER risk depends on what proportion of sales and earnings are generated outside the U.S. and the variability of exchange rates.
• Study the company’s hedging policy.

36
External Liquidity Risk
• External liquidity measure the marketability of the company’s stock.
• Marketability: Ease of speed of trading a security with little change in price.
• Measures: 1. Number of Shares
2. Market value of stock
3. Trading Volume
4. Trading Turnover

37
External Liquidity Risk• External Liquidity Measures:
1. Number of Shares
2. Market value of stock• [(Hi price-low Price)/2](no. of shares)
3. Trading Volume
4. Trading Turnover = Proportion of outstanding shares traded during a period of time.
• Example: 705 m shares traded in year; 1,020 shares outstanding; Turnover = 705/1020 = .70.
• 70% annual turnover
5. Bid-Ask Spread
6. Institutional Ownership

38
External Liquidity Risk
• External Liquidity Points:
1. Foreign stocks may lack external liquidity.
2. Smaller Cap companies may lack external liquidity.
3. External liquidity information can be found in Bloomberg.

39
Fundamental Risk Analysis• Compare the various ratios measuring for LR, BR, FR,
ERR, ELR for the company, industry, and market.
• Determine if the ratios are higher or lower than the norm or trend:
– Below-Average or Above-Average LR
– Below-Average or Above-Average BR
– Below-Average or Above-Average FR
– Below-Average or Above-Average ERR
– Below-Average or Above-Average ELR
• From fundamental risk comparison determine if– RP of Company >=< RP of Industry
– RP of Company >=< RP of Market

40
Fundament Risk Analysis
• Range of market RP = 3%-8%• The company tends to have fundamental risk
ratios that indicate it has less risk than the market.
• Estimate the company’s RP to be between 2%-7%.
• Note: The company’s beta should be less than 1.

41
Fundament Risk Analysis: k Estimate• Range of market RP = 3%-8%
• The company tends to have fundamental risk ratio that indicate it has less risk than the market.
• Estimate the company’s RP to be between 2%-7%.
• Note: The company’s beta should be less than 1.
• If Rf = 4%, and market estimate is 5%, then the company would have
k = Rf + RP = 4% + 4% = 8%

42
k Estimate: SML
• Market Model, SML:
• Market RP = 3%-7%
• Look at Relation between: – Rf and RP
– Economy or market and RP
]RR(E[Rk fMf

43
k Estimate: SML
• Example:
• Current Market Risk Premium = 4%
• Rf = 5%
• Adjusted ß = .90
%6.8)9(.]04[.05.k
]RR(E[Rk fMf

44
k Estimate: SML• Estimate ß1. Historical Regression
• Poor regression results2. Adjusted Beta: Vasicheck Technique
3. Adjust Beta up or down based on your fundament risk analysis.
MRk

45
Estimating Future EPSApproach 1: From Bloomberg Data:
1. Operating Income = Rev. – Cost of Goods Sold – SGA
2. Pretax Income = Operating Income – Interest Exp. – Net Forn. EX Losses – Net Non-operating Losses
3. Income Before XO Items = Pretax Income – Income Tax
4. Net Income = Income before XO Item – Net XO Loss – Net Tax Effect of XO Loss – Minority Interest
EBIT
EBT
EAT
n
EATEPS

46
Estimating Future EPSApproach 1: Using Bloomberg Data; Estimation Model
• Estimate the proportional changes in revenue (sales, S), cost of goods sold, SGA, interest expenses (Int), net FX losses, and income taxes.
– S1 = (1+g)S0
– CGS1 = (1+g)CGS0
– Int1 = (1+g)Int0
– Etc.

47
Fundamental Stock Analysis
Forecast Reason
Annual Sales Growth Rate
9.00% Continue increasing trend
% Δ in COGS 10.00%Significant increase based on commodity price increases
% Δ in S,G,&A 6.00% Maintain current percentage to sales
% Δ in Interest 10.00%Increase due to increasing debt to asset ratio
Foreign Exchange Loss (G)
-Continue trend of minimum exchange-rate losses (gains)
Net Non-Operating Loss (G)
539.00 No change in level
Tax Rate 31.00% No change in rate
Kraft

48
Fundamental Stock AnalysisPeriod F2007 F2008
Revenue 37,241 40,593 Sales Growth 8.40% 9.00%Cost of Goods Sold (Revenue) 24,604 27,064 % Δ in COGS 12.27% 10.00% COGS/Revenue 66.07% 66.67%Selling, General & Administrative Expense 7,767 8,233 % Δ in S,G,&A 8.09% 6.00% S,G,&A/Revenue 20.86% 20.28%Operating Income 4,870 5,295 Operating Margin 13.08% 13.04%Interest Expense 604 664 % Δ in Interest 18.43% 10.00%Foreign Exchange Loss (G) - - Net Non-Operating Loss (G) 539 539 Pretax Income 3,727 4,092 Income Tax Expense 1,137 1,268 Effective Tax Rate 30.51% 31.00%Income Before XO Items 2,590 2,823 XO Loss (Gain) Pretax - - Tax Effect on XO Items - - Minority Interest - - Net Income 2,590 2,823 EPS 1.64 1.84 Number of Shares 1,532.00 1,532.00
Kraft

49
Fundamental Stock Analysis
Oracle
Forecast Reason
Annual Sales Growth Rate 23.00%Increase in sales primarily due to acquisitions
% Δ in COGS 11.00% Continuation of increasing cost trend
% Δ in S,G,&A 13.00% Increase in sales force and bonuses
% Δ in Interest 9.00% Reflects increase in new debt
Foreign Exchange Loss (G) (41.00) Continuation of current level
Net Non-Operating Loss (G) (250.00)
Continuation of current level
Tax Rate 30.00% No change

50
Fundamental Stock Analysis
Oracle
Period Four Quarters Four QuartersEnding Ending
2/29/2008 2/28/2009Revenue 21,074 25,921 Sales Growth 23.83% 23.00%Cost of Goods Sold (Revenue) 4,797 5,325 % ? in COGS 19.95% 11.00% COGS/Revenue 22.76% 20.54%Selling, General & Administrative Expense 8,954 10,118 % ? in S,G,&A 22.37% 13.00% S,G,&A/Revenue 42.49% 39.03%Operating Income 7,268 10,478 Operating Margin 34.49% 40.42%Interest Expense 361 393 % ? in Interest 9.39% 9.00%Foreign Exchange Loss (G) (41) (41) Net Non-Operating Loss (G) (241) (250) Pretax Income 7,189 10,376 Income Tax Expense 2,069 3,113 Effective Tax Rate 28.78% 30.00%Income Before XO Items 5,120 7,263 XO Loss (Gain) Pretax - - Tax Effect on XO Items - - Minority Interest 33 30 Net Income 5,087 7,233 EPS 0.98 1.41 Number of Shares 5,148.00 5,148.00

51
Estimating Future EPSApproach 2:
1. Revenue2. m = Operating Profit Margin = Operating
Income/Revenue3. Operating Income = m Revenue4. Pretax Income = Operating Rev – Interest – FX Loss5. Income Before XO Item = [Operating Rev – Interest –
FX Loss – Net Nonoperating Losses](1-t)– where: t = effective tax rate– t = Income tax expense/Pretax Income
6. Net Income = Income before XO Item – Net XO Loss – Net Tax Effect of XO Loss – Minority Interest
Sales
EBIT
EBT
EAT

52
Estimating Future EPSApproach 2: Using Bloomberg Data: Estimation Model1. Estimate the proportional changes in Revenue:
– S1 = (1+g)S0
– S2008 = (1+g)S2007
– g = .09 – S2008 = (1.09)$37,241– S2008 = $40,593
2. Estimate Operating Profit Margin:– Kraft 2007: m = 13.08– Kraft Forecast: m = 13.04
3. Operating Income = m S1– Operating Income 2008 = .1304($40,593) = $5,295
Kraft

53
Estimating Future EPSApproach 2: Using Bloomberg Data: Estimation Model4. Estimate interest expenses, net FX losses, and Net Non-Operating Losses
– Int1 = (1+g)Int0
– FXL1 = (1+g)FXL0
– NNOL1 = (1+g)NNOL0
5. Pretax Income = Operating Inc. – Int – FXL - NNOL• Forecast Pretax Income = $5295 – 664 – 0 = $4,092
6. Estimate effective tax rate, t: • t = Income tax expense/Pretax Income– t = .31– Net Income = Pretax Income(1-t) – Net Income = $4,092(1-.31) = $2,823– (excludes XO loss and XO tax)
7. Estimate n = 1,532 (no change)– EPS = Net Income/n = $2,823/1,523 = $1.84
Kraft

54
Estimating Future EPS
• Approach 3:1. Estimate the proportional changes in
revenue:– S1 = (1+g)S0
– S2008 = (1+g)S2007
– g = .09 2. Estimate Revenue (Sales, S)
– S2008 = (1.09)$37,241– S2008 = $40,593
Kraft

55
Estimating Future EPS
Approach 3:
3. Estimate mn: mn = Net Operating Profit Margin = Net Income/Revenue
• Estimate • m2007 = 2,590/37,241 = .069547• Estimate: No change
4. Net Income2008 = mnS2008
• Net Income = .069547 ($40,593) = $2,823
5. Estimate n: No Change– EPS = $2,823/1,532 = $1.84
Kraft

56
Points on Estimating EPS
• Sales forecast:– Macro analysis: Run regressions of sales against an
explanatory variable: PCE Medical
– %ΔSales = a + b (%ΔPCE Medical)
– Conduct Micro analysis: Study Annual Report, analyst opinion.
• Cost of Goods Sold Forecast:– Study relation between COGS and inflation or
commodity price increases.

57
Points on Estimating EPS• Administrative Expense Forecast:
– Check Annual Report– Check trends
• Interest Expense forecast:– Check interest rates– Check credit condition– Debt/Equity trends and plans
• FX Loss Forecast:– Check global exposure– Determine direct investment and FX exposure compared to
exports and import and FX exposure.– Check Hedging policy

58
Qualitative Analysis of Profit Margin • In estimating operating or net operating profit
margins, one needs to consider qualitative factors related to the firm’s competitive position and strategy and determining its SWOT.

59
Qualitative Analysis of Profit Margin • Competitive Strategy:1. Brand Names2. Investment in technology to lower cost3. Investment in delivery systems4. Low-Cost Leader: Economies of scale,
proprietary technology, access to raw material, etc.
5. Differentiated Products: Unique marketing, distribution system.

60
Qualitative Analysis of Profit Margin • SWOT1. Strengths: What is there competitive advantage
• Strong R&D, strong financial resources, strong buy image, low-cost producers, high quality producer.
2. Weaknesses: Where competitors have exploitable advantages
• Foreign competition, poor financial resources, • Question: Is the company doing anything about its weakness.
3. Opportunities: External factors that favor the company
• Shrinking competition, favorable exchange rate, new product, new market, etc.
4. Threats: External Factors that hurt the company• Slow economy, government regulations, new entrants, new
technology that makes company’s product obsolete, etc.
61
Qualitative Analysis of Profit Margin
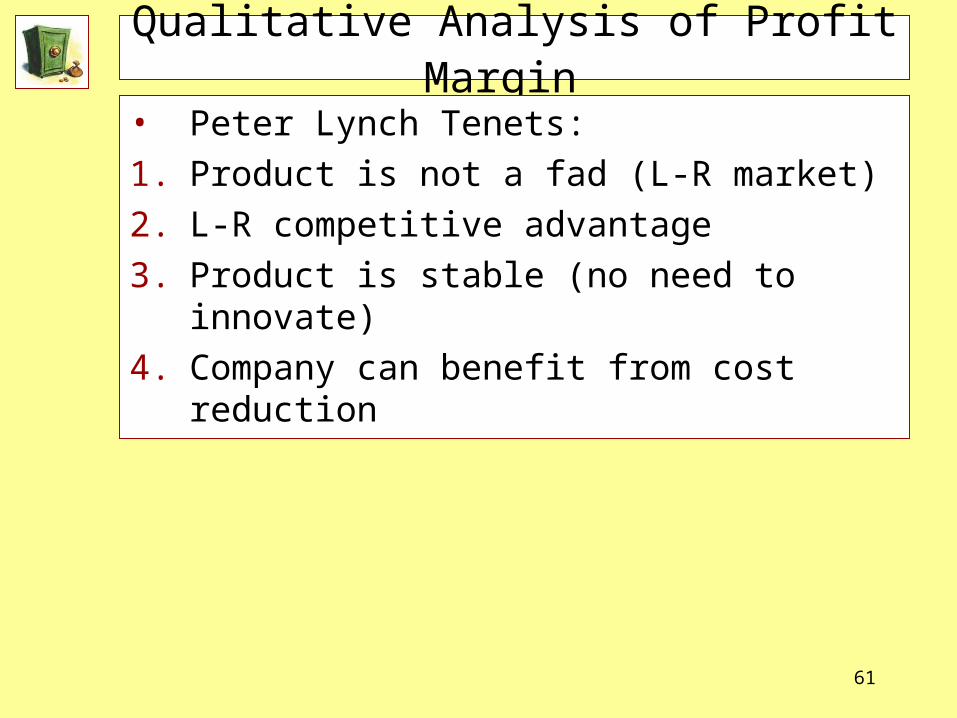
• Peter Lynch Tenets:
1. Product is not a fad (L-R market)
2. L-R competitive advantage
3. Product is stable (no need to innovate)
4. Company can benefit from cost reduction

62
Qualitative Analysis of Profit Margin
• Warren Buffet Tenets:
1. Business Tenets:• Business is simple
• Consistent operating history
• Favorable L-R prospects (the product is needed)
2. Management Tenets: Management is rationale
3. Financial Tenets:• Focus on ROE not EPS
• Look for good ROE with little or no debt
• Look for high profit margins
• Look at free CF
4. Market Tenets: What is the value of the business:• Look at Economic value added model

63
Qualitative Analysis of Profit Margin
• Kraft: Qualitative Analysis• SWOT:
– Strengths: staple products, diversified, – Weaknesses: commodity prices– Opportunities: international markets – Threats: effected by consumer demand and trends
• Comparative Advantages: – #1 food manufacturer in the U.S. & #2 largest worldwide– Management of rising commodity prices– New sales initiative– Launched a 3 year growth strategy
• Debt Outstanding:– Debt maturing in 2011, 2014, and 2018– Refinancing strategy
Kraft

64
KRAFT (KFT) Reasons to BuyKraft makes products that are staples in American households. No matter what condition the economy is in, these products will still be demanded (Nabisco Cookies, Oscar Meyer sandwich meats, Post cereal, etc.)Leader in industry: They are the largest food manufacturer in the U.S. and 2nd largest worldwide; international sales comprise nearly 33% of overall revenue. They have also been able to manage rising commodity prices by passing this along to consumers and strategically manage the increase in fixed expenses. Diversification: Well diversified in food processing and manufacturing compared to competitors Management: Piloting a new sales initiative to give store managers a single point of contact for Kraft that will create more opportunities to showcase the products consumers want and can ensure will always be in stock Management: Launched a 3 year growth strategy (2007-2010) to improve product diversity, boost sales, and reduce costs Maturing Debt: Company has a lot of debt outstanding that is maturing in 2011, 2014, and 2018. Kraft will have to reissue debt to finance this2008/Future Financial Goals of Kraft Improve annual discretionary cash flow by $1 billion in the next few years, delivering cash flow equal to 100 percent of net income as a long-term goal. Reduce primary working capital to 11 percent of net revenue, from 14 percent today. Reduce capital spending to below 3 percent of net revenue from 3.3 percent in 2007. Improve return on invested capital by an average of 80 basis points per year. Future Strategic Governing Rewire the Organization for Growth: Kraft is reinforcing a mindset of candor, courage, and action throughout the company and trying to strike a balance between decision-making globally and locally Reframe Categories: Kraft is reframing their categories to make them more relevant to consumers and identify key consumer trends that have a big impact on our business. The categories are now going to reflect, health & wellness, quick meals, snacks, and premium divisionsExploit Sales Capabilities: piloting new sales initiativesReduce costs without compromising quality: Kraft is taking stock of what they do best which allows them to work more closely & efficiently with suppliers, customers, & consumers

65
Oracle (ORCL)Overview oWorlds largest enterprise software companyoDevelops, manufactures, markets, distributes and services database and middleware software as well as applications software oIn the past three years Oracle has invested over $25 billion to acquire many companies, products, services and technologies, including the acquisition of PeopleSoft, Inc., Siebel Systems, Inc. and Hyperion Solutions CorporationoOracle is organized into two businesses, software and services, which are further divided into five operating segments.oThe software business is comprised of two operating segments: (1) new software licenses and (2) software license updates and product support. oThe services business is comprised of three operating segments: (1) consulting, (2) On Demand and (3) education. oSoftware and services businesses represented 79% and 21% of total revenues, respectively, in fiscal 2007 and 80% and 20% of total revenues, respectively, in both fiscal 2006 and fiscal 2005.oNew software licenses revenues represents 33% of total revenues in FY 2007Recent NewsoOracle is acquiring BEA, the largest independent maker of middleware, which helps different types of programs share information. While BEA has lost sales to larger rivals Oracle and International Business Machines Corp., revenue from maintenance, or customer- support contracts, has increased. This acquisition is being funded by $5 billion new debt offer. oOracle sold $1.25 billion of 5-year 4.95 percent notes priced to yield 222 basis points more than U.S. Treasuries of similar maturity; $2.5 billion of 10-year 5.75 percent bonds that offered an extra yield of 215 basis points; and $1.25 billion of 30-year 6.5 percent bonds with a spread of 212 basis pointsoEDS and Oracle today announced they have extended their strategic alliance to develop and market software and solutions for tax and revenue agencies around the worldoOn March 22, 2007, Oracle filed a lawsuit in U.S. Federal District Court in the Northern District of California against SAP. Among the claims made against SAP are violations of the Federal Computer Fraud and Abuse Act and California Computer Data Access and Fraud Act, Unfair Competition, Intentional and Negligent Interference with Prospective Economic Advantage and Civil Conspiracy.Risk FactorsoWeak economyoAnalysts estimate may not be met because of poor prediction methods oIncreased competition may pressure pricing model changesoPeopleSoft’s Customer Assurance Program may expose the company to substantial liabilities if triggered. The aggregate potential CAP obligation as of May 31, 2007 was $3.2 billion. Oracle expects the aggregate potential CAP obligation to decline substantially until fiscal year 2008 when a significant number of these provisions begin to expire. The last CAP obligation will expire on December 31, 2008

66
Comparative Analysis of EPS
• In forecast sales, operating profit margins, and effective tax rate to forecast EPS, one should also do a comparative analysis of the firm with the industry and market.
• Plot margins, sales, growth rates, and other components to analyze trends.

67
Comparative Analysis of EPS
• Set up tables showing the parameters for the company, industry, and market over time.
Year
Firm
Margin
Gross Operating Net
Industry
Margin
Gross Operating Net
Market
Margin
Gross Operating Net
1980
:
2007
Mean
σ
• Analyze the relative trends

68
EPS FORECAST
Notes:
• Compare your forecast to the analysts’ estimates.
• Analysts’ forecast of EPS, sales, etc are provided by Bloomberg.
• Once you’ve made an annual forecast, look at the quarterly data to see how it tracks and whether or not your sales or profit margins are over or underestimated.

69
Valuation: Discounted Cash Flow
• Dividends:– Model
– Gordon:
– 2-stage or 3-stage growth model
1tt
t
)k1(
)g1(DV
gk
DV 1

70
Valuation: Discounted Cash Flow
• Requires estimating g and k.
• If g > k, then you need to use a 2-stage or 3-stage growth model.
• Assignment: Estimate the value of Kraft.

71
Valuation: Discounted Cash FlowESTIMATE OF RATE OF RETURN USING
THREE-STAGE GROWTH MODEL
Year EPS d/e Dividend
1 $4.00 .40 $1.60
2 4.50 .45 2.03
Growth = .10 3 5.00 .50 2.50
4 5.75 .55 3.16
5 6.50 .60 3.90
6 6.50(1.09) .60 4.25
Transitional 7 6.50(1.09)(1.08) .60 4.59
8 6.50(1.09)(1.08) (1.07)
.60 4.91
Steady State 9 6.50(1.09)(1.08) (1.07)(1.06) = 8.68
.60 5.21
Example of 3-Stage Growth Model Estimate

72
Valuation: Discounted Cash Flow
• If k = .10, then the value of the stock would be $77.40.
Pk k k k k k
k kkk
k
0 2 3 4 5 6
7 8 8
40160
1
2 03
1
2 50
1
316
1
3 90
1
4 25
1
4 59
1
4 91
1
5 2106
110
$77.. .
( )
.
( )
.
( )
.
( )
.
( )
.
( )
.
( )
..
( ). .
Example of 3-Stage Growth Model Estimate
• If the stock is priced at $77.40, then k = 10%.

73
Note: Wells Fargo Evaluation System
• Step 1: An analysts estimates the rate of return on a stock using the three-period DCF model. This requires estimating D1, e, and g for the next 5 years, determining the length of the transitional period, and estimating the steady state growth rate. Given this model, the analyst solves for ke given the current market price of the stock.

74
Wells Fargo Evaluation System
• Step 2: The analyst estimates the beta of the stock. Example: For the above stock, suppose the analyst estimates its beta to be 1.2.
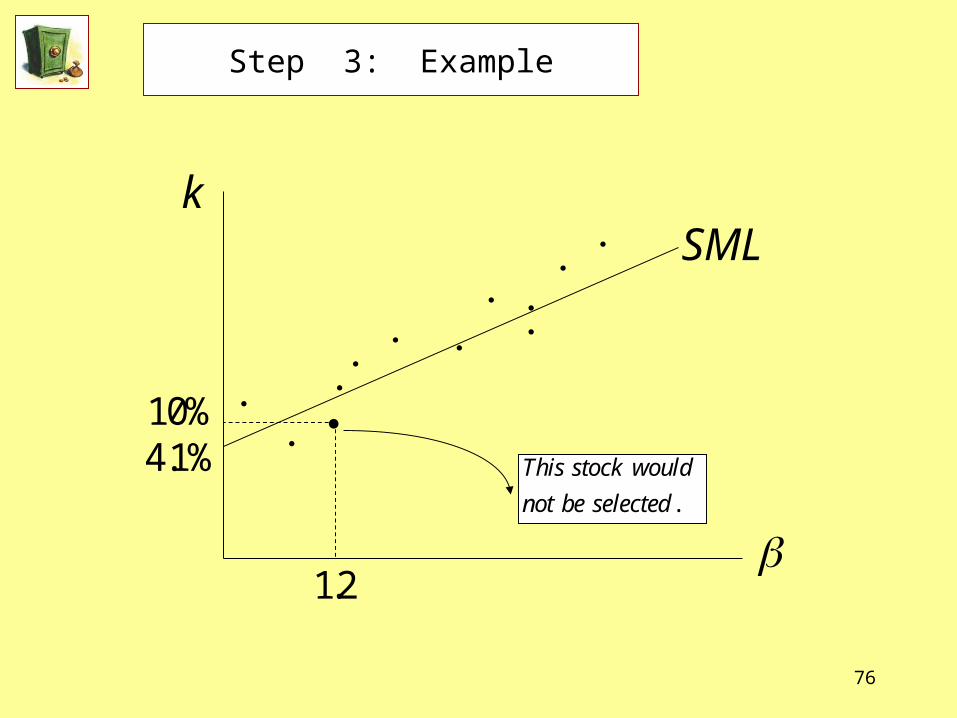
• Step 3: Take the estimated k and beta combinations for all stocks being analyzed and run a cross-sectional regression to generate an ex ante SML.

75
Step 3: Example
ESTIMATION OF SML CROSS-SECTIONAL MODEL WITH 10 STOCKS*
Stock Return
Beta SML Return Excess Return
1 10% 1.2 12.74% -2.74%
2 8 .8 9.86 -1.86
3 15 1.4 7.18 .82
4 22 1.2 12.74 9.26
5 6 .9 10.58 -4.58
6 18 1.6 15.62 2.38
7 16 1.8 17.06 -1.06
8 12 1.0 11.30 .70
9 4 1.2 12.74 -8.74
10 16 .8 9.86 6.14
Estimated SML: ri = 4.1 + 7.2 i
76
Step 3: Example
k
SML
10%
12.
4 1%. This stock would
not be selected .

77
Wells Fargo Evaluation System
• Step 4: Accept stocks into the portfolio with positive excess returns (i.e., k and beta coordinates above the estimated SML) and reject stocks with negative excess returns (i.e., those with coordinates below the line).

78
Relative Valuation: Multiplier Approach
• P/E Multiplier Approach 1: Compare Forecasted EPS with Bloomberg’s Best P/E
1. Estimate EPS for next year (12-months out)2. Using the current price, calculate you P/E based
on your forecast.3. Compare your P/E to P/E based on analysts’
forecasted EPS.4. Use Bloomberg to find Best P/E

79
Relative Valuation: Multiplier Approach
• P/E Multiplier Approach 1:– Current Price = $30.90– Our Estimate of EPS = $1.84– Our P/E = $30.90/$1.84 = 16.79– Analyst estimate of EPS = $1.50– Their P/e $30.90/$1.50 = 20.60
• Based on this, we would buy.• Note: we could simply compare our forecasted
EPS with Best EPS forecast.
Kraft

80
Relative Valuation: Multiplier Approach
• P/E Multiplier Approach 2: Forecast P/E
1. Do a macro analysis of company’s P/E with industry and market.
0
10
20
30
40
50
60
70
PE Ratio - S&P 500
PE Ratio - Company
PE Ratio - Industry

81
Relative Valuation: Multiplier Approach
• P/E Multiplier Approach 2: Forecast P/E2. Note trends, Ranges in P/E, Recent Trends, etc.3. Consistency: Determine if the trends are
consistent with your analysis.• For example, if the company has a higher growth
rate, then its P/E should be higher. See if that is the case by reviewing your historical growth, DuPont ratios, etc.
• If the company has more financial risk or business risk, then its k should be lower and therefore its P/E lower. See if that is the case by reviewing the comparative ratios measuring fundamental risks.

82
Relative Valuation: Multiplier Approach
• P/E Multiplier Approach 2: Forecast P/E
4. Project P/E• Based on your analysis determine if the
company P/E should be higher or lower than the market.
• If there is a forecast of the market P/E and industry P/E (Best P/E from Bloomberg), then adjust your company P/E relative to the industry and market.

83
Relative Valuation: Multiplier Approach
• P/E Multiplier Approach 2: Forecast P/E
5. Forecast P/E internally:• Use Gordon model• Use your estimates of g, k, D/E for next year.• Note: k > g requirement for using Gordon.
6. Compare Projected P/E with internally forecasted P/E, select one or use both.

84
Relative Valuation: Multiplier Approach
• P/E Multiplier Approach 2: Forecast P/E
7. Determine stock’s intrinsic value (V)• Estimate next year’s EPS
• Multiply current EPS by your estimated growth rate, g.
• You could use your estimate EPS.
• Take projected P/E and/or Forecasted P/E• Determine Value (s):• V = (P/E) E(EPS)

85
Relative Valuation: Multiplier Approach
• P/E Multiplier Approach 2: Forecast P/E1. Comparison of P/E
• Industry P/E = 18.31• S&P 500 P/E = 23.88• Kraft P/E = 16.71
2. Trend: • Kraft was below its historical P/E average of 19.47.• The industry and market were below their historical
averages.
3. Internal estimate of Kraft’s was 15.59 (based on a cross-sectional multiple regression model).
Kraft

86
• A cross-sectional regression model was used to estimate Kraft’s P/E. In estimating the model, we regressed the 2007 P/E ratios of 439 S&P 500 stocks against their average retention ratios (RR), growth ratios (g), and betas (ß):
• Using this equation, we forecasted no changes in Kraft’s retention ratios, growth ratios, and betas from its historical averages. Substituting Kraft’s historical parameter values (RR, g, and ß) into the regression equation, we obtained an equilibrium P/E for Kraft of 15.59.
)84.1()23.1()68.2()40.1(
63.3g02.11RR45.1246.7e/P
)(C)g(C)RR(CCe/P
iiiii
ii3i2i10i
Kraft
Relative Valuation: Multiplier Approach

87
Relative Valuation: Multiplier Approach
• P/E Multiplier Approach 2: Forecast P/E
4. Selected a baseline P/E for Kraft of 15.5
5. Considered three P/E cases: 14.5, 15.5 and 16.5.
6. Based on our estimated EPS of $1.84, the intrinsic values were:
• V = (14.5)($1.84) = $22.68• V = (15.5)($1.84) = $28.52• V = (16.5)($1.84) = $30.38
Kraft

88
Criterion of the Investment Decision
• Two Approaches
1. Compare estimated IV with market price• If IV > PMkt then Buy• If IV < PMkt then Sell
• Use discounted CF or P/E approach in valuation

89
Criterion of the Investment Decision
• Two Approaches
2. Compare expected rate of return with k• E(R) can be estimated as an E(HPY) or from
the Gordon Model or 2-stage or 3-stage growth model
• E(HPY):
Mkt
Mkt
Mkt
Mkt
P
)PIV()g1(EPS)E/D()R(E
P
)PIV()D(E)R(E

90
Criterion of the Investment Decision
• Two Approaches2. Compare expected rate of return with k
• Gordon: Solve for k
• Let k be the estimate of E(R)
• 2-Stage or 3-Stage: See Wells Fargo Model
gP
Dk
gk
DP
Mkt
1Mkt

91
Criterion of the Investment Decision
Market Price = $38
IV = $26.86, 28.32, $30.30
09.kEstimated
084.)R(E
06.38$
)5)(.84.1($)R(E
gP
)E/D(EPS)R(E
gP
Dk
Mkt
Mkt
Kraft IV < PMkt
Therefore Don’t Buy
E(R) < k
Therefore Don’t Buy

92
Other Valuation Approaches
• P/BV
• Points:1. Measure good for companies with consistent
accounting practices.2. Good for comparison of companies in the same
industry; may not be good for inter-industry comparison
3. P/BV = f(ROI – WACC) (i > k)4. Do historical comparison of P/BV for company,
competitors, and market (plot P/BV ag. time).
BVEndYearExpected
icePrMarketCurrent
BV
P

93
Other Valuation Approaches
• P/CF:
• Points:1. What CF should be used?
2. Common CF = EBDITA
3. Do relative comparisons of company, industry, and market (plot P/CF ag. time)

94
Other Valuation Approaches
• P/S:
• Points:1. Sales drive most ratios2. Sales are not as subject to accounting
manipulation.3. P/S may be good for foreign stocks4. Do comparative analysis (plot P/S ag. Time)
ShareperSalesExpected
icePrMarketCurrent
S
P

95
Other Valuation Approaches
• Economic Value Added, EVA
• EVA = EBIT(1-t) – (WACC) (Assets)– Take oil well company that made a one-time
only investment of $6m, with: i = .30, ke = .24, D/E = .5, kd = .08, WACC = .144, EBIT = $12m + .3($6m) = $13.8m, Assets = $50m + $6m = $56m.
– EVA = $13.8m(1-.4) – (.144)($56m) = $.216 m
– If i = .24, then EVA = 0.

96
Growth Duration Model
• Growth Duration Model• Companies with extraordinary growth rates
will not grow at those rate for an extended time. They will eventually run out of potentially high return investments.
• Finding how long a company will grow at extraordinary rate or equivalently how long it will take to reach a steady-state rate is important, especially for determining 2-stage and 3-stage models.

97
Growth Duration Model
• Growth Duration Model• One duration model is based on assuming that
the current P/E of a growth stock will eventually converge to a value that is proportional to the market P/E, with the proportion being based on earnings and the same steady-state growth as the market.
• Growth duration is found by determining the implied time it would take for the proportional P/E to converge.

98
Growth Duration Model• Growth Duration Model• Model:
• P(0) = current price• E(0) = current earnings• G = Estimated growth rate in earnings
(sustained)• D = Dividend yield
MM
MM
DG1
DG1(ln
)0(E/)0(P
)0(E/)0(P(ln
T

99
Growth Duration Model
Walgreens:• P(0)/E(0) = 39
• G = 13%
• D = 1%
years31.8
02.07.1
01.13.1(ln
25
39ln
DG1
DG1(ln
)0(E/)0(P
)0(E/)0(P(ln
T
MM
MM
S&P 500:• P(0)/E(0) = 25
• G = 7%
• D = 2%
Assignment: Find T for Kraft

100
Growth Duration Model
• Use of Growth Duration Model
• Investment Criterion: – If you think the actual growth duration is
greater than the implied, then buy.– If you think the actual growth duration is
less than the implied, then don’t buy.
• Use Growth Duration model to estimate T for use in 2-stage or 3-stage growth models.
– Used in the Well-Fargo Model.

101
When to Sell
• Your job does not end, once you’ve estimated the IV and made your buy recommendation.
• After you buy a stock, the next question is when do you sell it.
• Answer: The answer to when to sell should be based on the research (or convictions) that convinced you to buy the stock in the first place.

102
When to Sell
• The key drivers you have identified for buying the stock need to be monitored and updated.
• If the key drivers weaken, it is time to reevaluate and possibly sell.
• As a rule: When the stock approaches its IV, it may be time to sell and reinvest the funds it another underpriced stock.

103
When to Sell
• Rule:
• If you know why you bought the stock, then you’ll be able to recognize when to sell it.

104
Points on Fundamental Analysis
• An efficient market is difficult to outsmart.• Sometimes it is the stock of a small company
or one that is neglected that may provide an opportunity.
• In U.S. (and other countries), there is information/data overload – blessing and curse.
• May be opportunity for finding underpriced stocks by looking globally.

105
Points on Fundamental Analysis
• Global Investments:• May be opportunity for finding underpriced
stocks by looking globally.• Currency risk• Political risk• External market risk (not as marketable)• Transaction cost higher (bid-ask spreads
bigger)• Lack of accounting standards • Valuation differences: use P/S

106
Web Sites
• www.finra.org
• www.businessweek.com
• www.yahoo.com
• www.zacks.com
• www.cfonews.com
• www.valueline.com
• www.moneycentral.msn.com
• www.fool.com
• www.nyssa.org links
• www.dnb.com
• www.hoovers.com
• www.sec.gov (EDGAR)
• www.invescopowershares.com ETFs

107
Web Sites
• www.nabe.com NABE
• www.stats.bls.gov Government data source link
• www.census.gov
• www.conference-board.org

Web Sites• Useful financial information sites:
– www.Finance.Yahoo.com
– http://www.hoovers.com
– http://www.bloomberg.com
– http://www.businessweek.com
– http://www.ici.org
– http://seekingalpha.com
– http://bigcharts.marketwatch.com
– http://www.morningstar.com
– http://free.stocksmart.com
– http://online.wsj.com/public/us
– http://finra.org
– www.pinksheets.com
– www.nasdaq.com
108

Web Sites
• To monitoring several stocks, interest rates, and other market information download MarketBrowser: – http://www.marketbrowser.com.
109