1 Why India is Important for the European Fine Chemicals Industry Gautam Mahajan Inter-Link Services...
67
1 Why India is Important for the European Fine Chemicals Industry Gautam Mahajan Inter-Link Services Private Limited [email protected] +91 9810060368
-
Upload
polly-lawrence -
Category
Documents
-
view
214 -
download
0
Transcript of 1 Why India is Important for the European Fine Chemicals Industry Gautam Mahajan Inter-Link Services...
1
Why India is Important for the European Fine Chemicals Industry
Gautam MahajanInter-Link Services Private Limited
[email protected]+91 9810060368
2
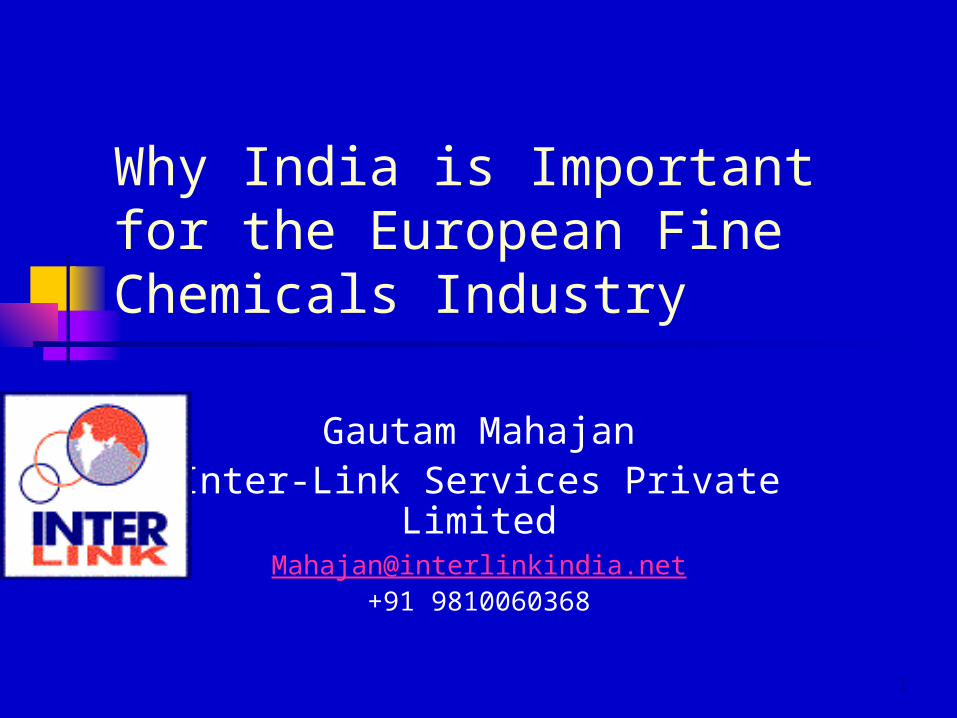
Fine Chemicals
Pharma Intermediates Active Pharma Intermediates
(API) Contract biopharma Agrochemical intermediates Others

3
The changing business dynamics in India• Europe and India: dynamics
• Opportunities to invest in, sell to and buy from in India
• India and China competition• Using India to balance supply constraints
• The changing business dynamics in India
• India Trade• The growth of the chemicals business
and trends in India• Using India as a supply base for other
countries
4
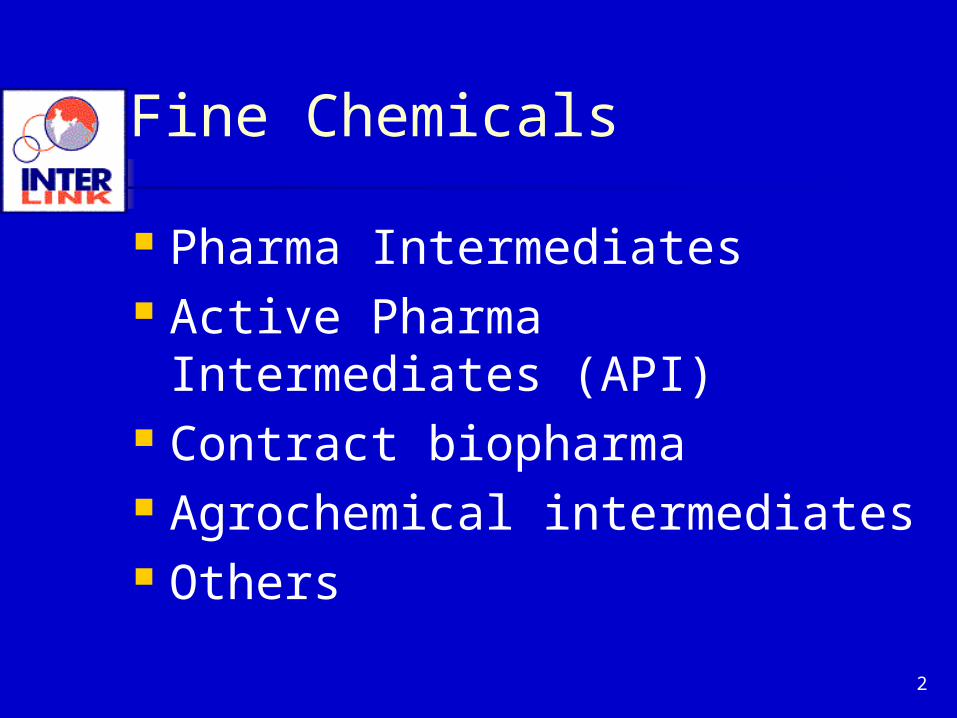
First, we’ll discuss:
• Europe and India: Dynamics
• Opportunities to invest in, sell to and buy from in India
• India and China competition
• Using India to balance supply constraints

5
Fine Chemicals: Market Size
US: €17.18 billion in 2005 €23.10 billion in 2011 est.
Europe: € 8.43 billion in 2005 €10.46 billion in 2009 est.
India: >€ 1 billion

6
EU Chemicals
In 2004, 29% of EU chemicals exported compared to: 19% for the USA and
19% for Japan Only 18% of the EU chemicals demand
was imported from the non-EU regions*
*In 2003, India-China imports were 8%, estimated to increase to 30% in 2008-09

7
European Fine Chemicals profitability under pressure
Profitability eroding: Intense Asian competition New chemical entity (NCE)
approvals rate reduced

8
Threats and Opportunities
Globalisation Higher Exports from Asia India China Symbiosis Asia driven acquisitions could
be exit option offer services across the value
chain
9
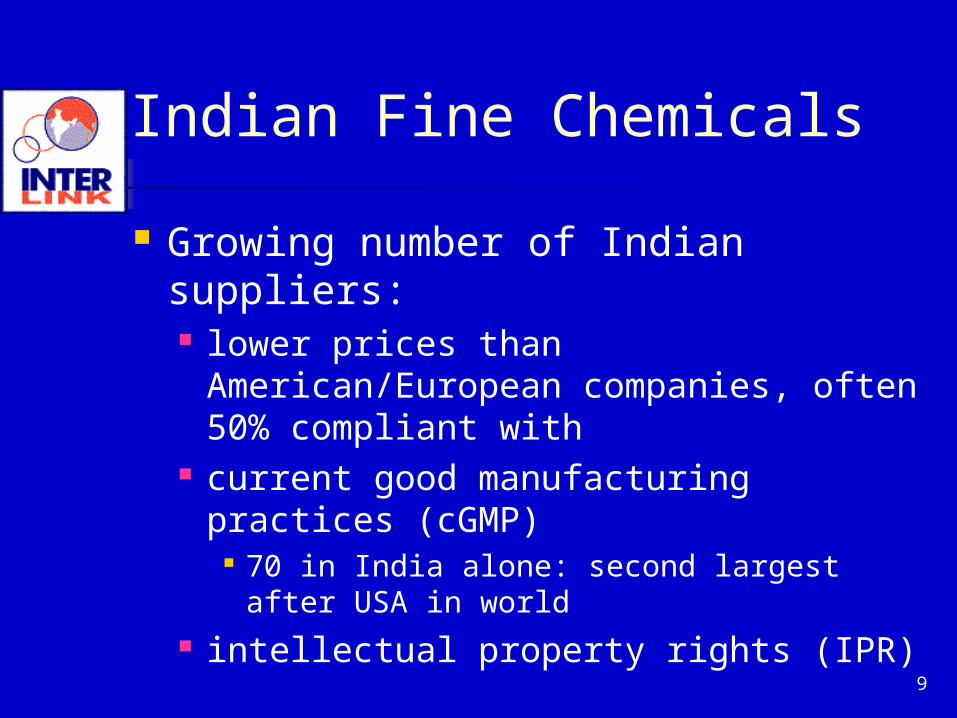
Indian Fine Chemicals
Growing number of Indian suppliers: lower prices than American/European
companies, often 50% compliant with current good manufacturing practices
(cGMP) 70 in India alone: second largest after
USA in world intellectual property rights (IPR)

10
Active Pharma Intermediates
Indian API 3rd largest in world (€1.6 bn in 2005) and will
grow to €3.63 bn by 2010, CAGR 19.3 %
India will become second largest API manufacturer (overtake Italy) by 2010*
* Italy's Chemical Pharmaceutical Generic Association (CPA)
report
11
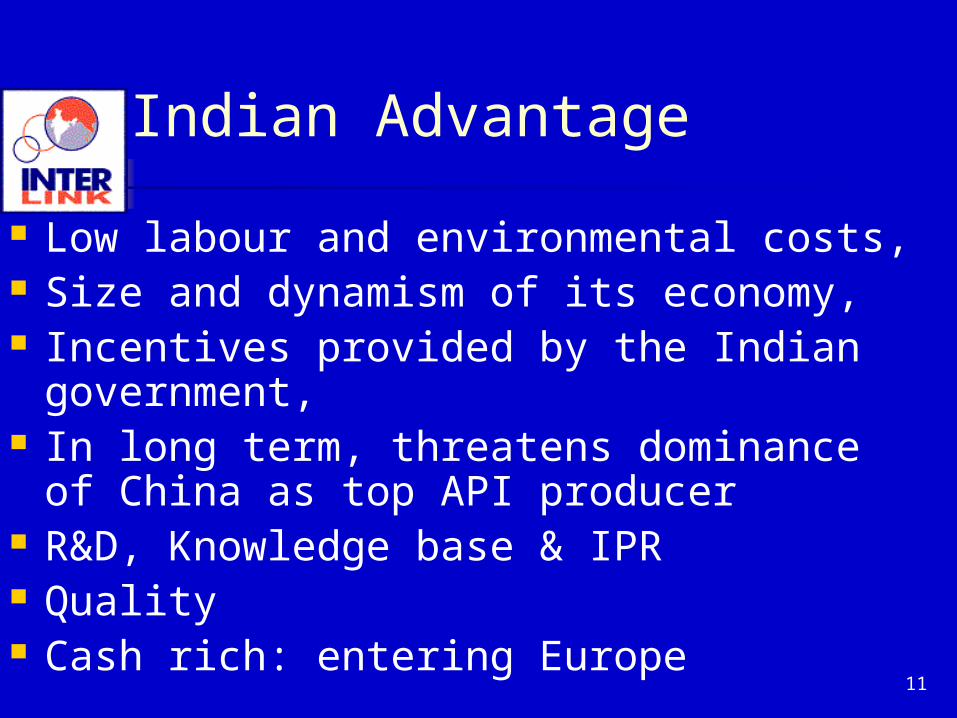
Indian Advantage
Low labour and environmental costs, Size and dynamism of its economy, Incentives provided by the Indian
government, In long term, threatens dominance of
China as top API producer R&D, Knowledge base & IPR Quality Cash rich: entering Europe
12
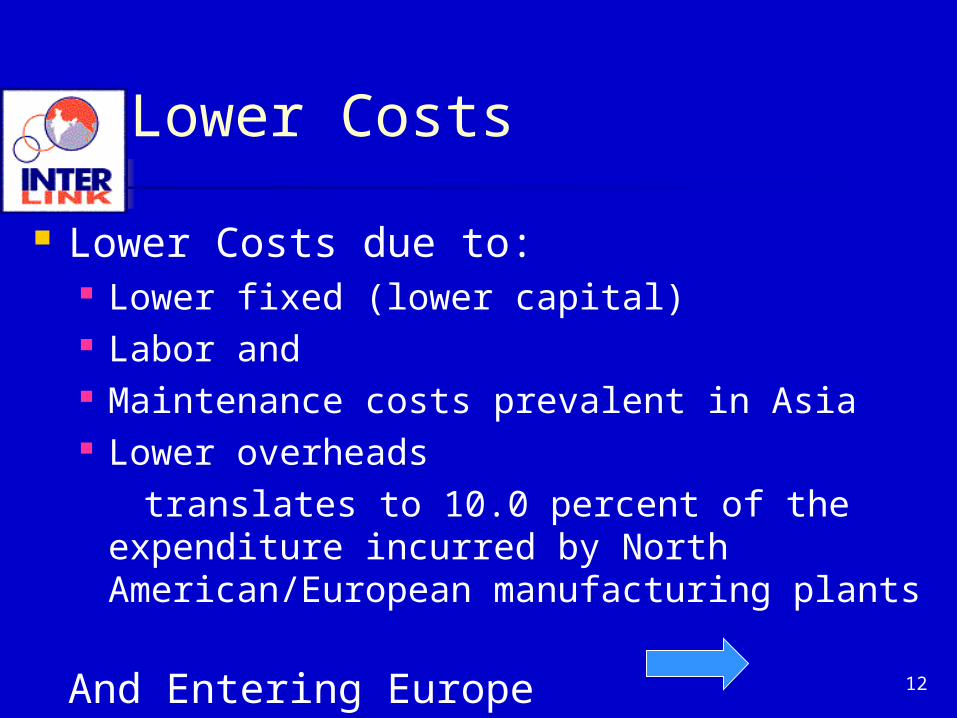
Lower Costs
Lower Costs due to: Lower fixed (lower capital) Labor and Maintenance costs prevalent in Asia Lower overheads translates to 10.0 percent of the
expenditure incurred by North American/European manufacturing plants
And Entering Europe

13
Examples of Indian Acquisitions
Nicholas Piramal Avecia Pharmaceutical Pfizer, Inc. (Morpeth, UK)
$350 mn supply agreement with Pfizer 7 year agreement for process development
and scale-up services to Pfizer Rhodia's (Paris) inhalation anesthetics
business
14
Examples of Indian Acquisitions
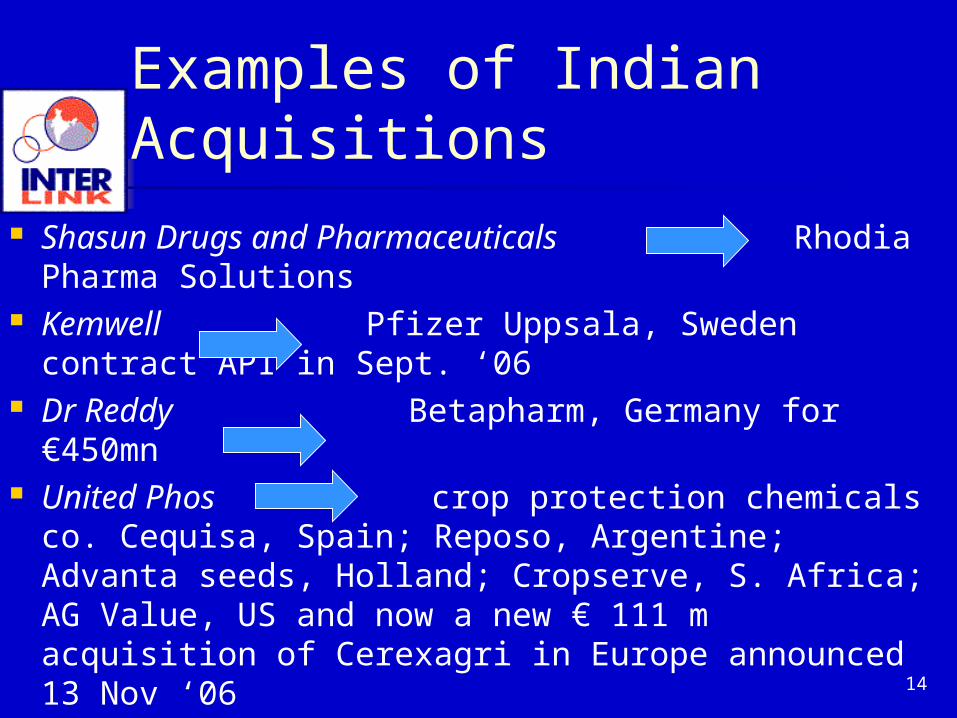
Shasun Drugs and Pharmaceuticals Rhodia Pharma Solutions
Kemwell Pfizer Uppsala, Sweden contract API in Sept. ‘06
Dr Reddy Betapharm, Germany for €450mn
United Phos crop protection chemicals co. Cequisa, Spain; Reposo, Argentine; Advanta seeds, Holland; Cropserve, S. Africa; AG Value, US and now a new € 111 m acquisition of Cerexagri in Europe announced 13 Nov ‘06

15
Examples of Indian Acquisitions
Dishman Pharmaceuticals and Chemicals
CarbonGen and AMCIS, Switzerland for high-potency actives
I03S, Ltd. ( ozone chemistry), Synprotec, a contract research company

16
Backward Integration in China
Indian producers backward–integrating in China Example: Dishman has two projects:
a $10-million investment for producing quaternary compounds and intermediates and
an API plant

17
Example: Matrix Labs
Matrix Laboratories Concord Biotech specializing in fermentation and biocatalytic
backward-integrate into China, acquired a 58% stake in Mchem Group
43% stake in Swiss API technology firm Explora Laboratories
Ventures with South Africa's Aspen Pharmacare Belgium generics company Docpharma NVBUT US generic drugmaker Mylan: €573.4mn to
acquire a controlling stake in Matrix

18
Indian Companies setting up in Europe/America
Denisco Nancy, France, API Dallas, Texas customer support office
“Customers in North America face tight margins and fierce competitive pressure for time-to-market. Our ability to quickly, safely and efficiently produce pharmaceutical lab samples, and then rapidly ramp up for commercial-level volumes, will help lighten these pressures,” said Venkat Ram, president of Denisco Chemicals.

19
Indian Companies setting up in Europe/America
G Amphray in Holland and now in Mexico
Bilcare, India's largest research-based pharmaceuticals packaging company, has bought UK-based clinical trials services provider DHP in Sept. 2006
20
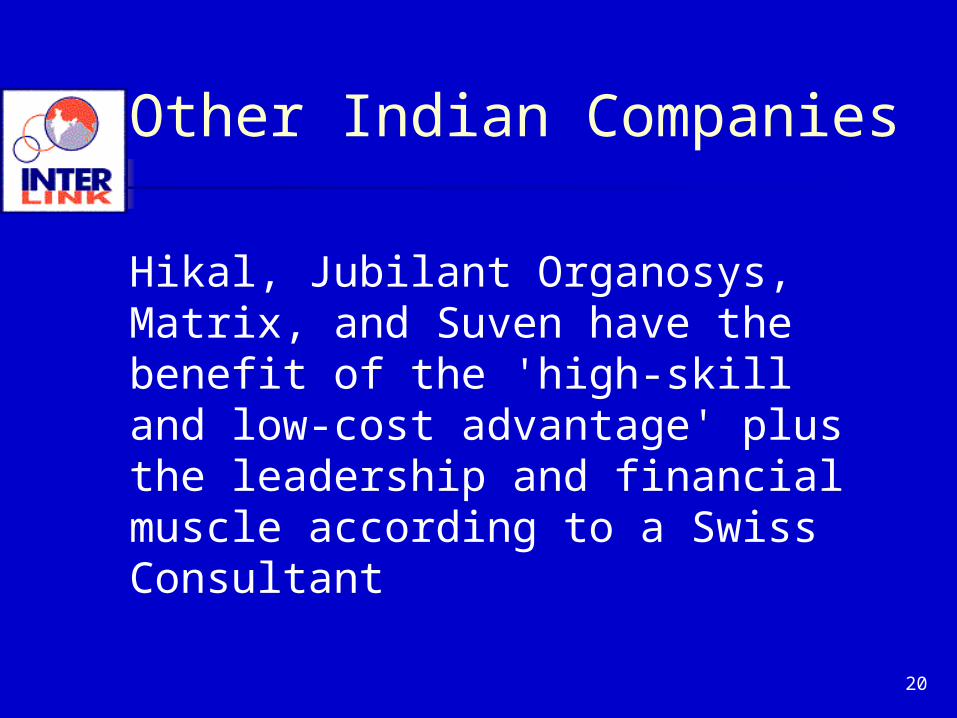
Other Indian Companies
Hikal, Jubilant Organosys, Matrix, and Suven have the benefit of the 'high-skill and low-cost advantage' plus the leadership and financial muscle according to a Swiss Consultant
21
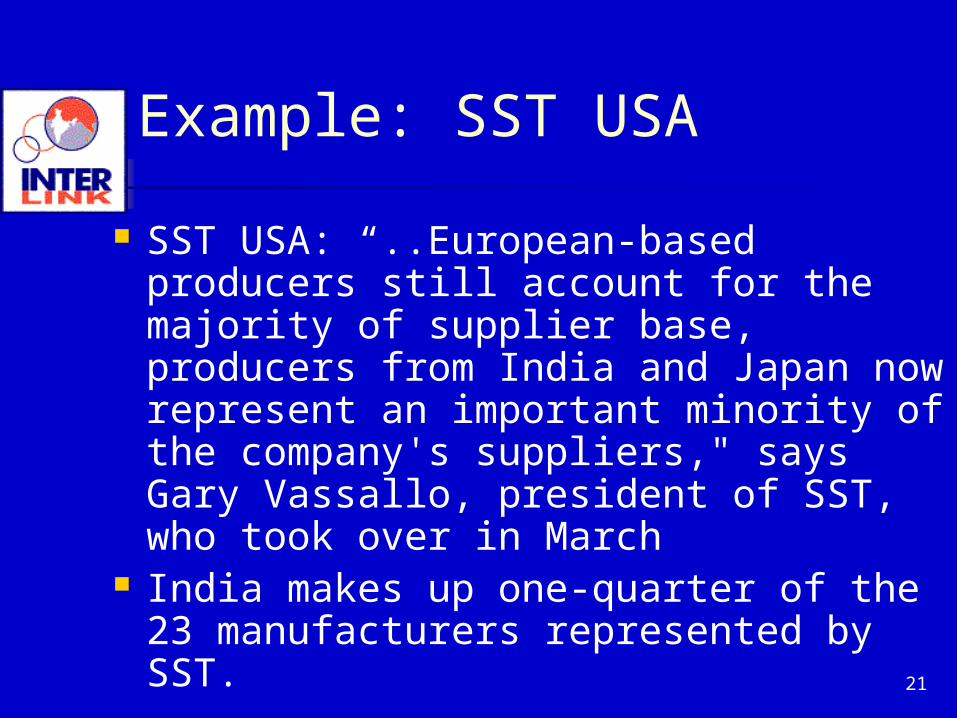
Example: SST USA
SST USA: “..European-based producers still account for the majority of supplier base, producers from India and Japan now represent an important minority of the company's suppliers," says Gary Vassallo, president of SST, who took over in March
India makes up one-quarter of the 23 manufacturers represented by SST.

22
Therefore,
Supplies from India and China forcing US and European companies to redefine their business models:"Apart from the issues of quality, speed, and value, the two key requisites for success are a position in India or China (a manufacturing subcontracting arrangement is good and an affiliate company is better) and an attractive toolbox of technologies,"
Degussa custom manufacturing j. v. with Lynchem in China
*says Pollak.

23
Fine Chemicals Economics
Fine chemicals production economics favor China and India based operations. Annual unit labor costs are a fraction of the
West’s: €3,000 in India €4,000-€6,100 China versus €40,400 in West Europe or €15,300 in Poland, a good proxy for the
Central and Eastern European region

24
Unit Labor Costs¹*
0
10
20
30
40
50
60
70
Swiss. Italy Poland India ChinaCoastal
ChinaInner
K Euro/ p/y
65
42
15
2.5 4.5 3
¹Includes fringe/other benefits
*Source: Arthur D. Little

25
Productivity Ratio*
0
1
2
3
4
5
6
7
8
West India China
This ratio is calculated dividing value added – (net sales less raw material costs )-- by total direct labor wage costs. Note that even with lower labor costs, productivity is higher in Asia *Source: Arthur D. Little
2.5 - 4
7-9
6-8

26
Transformation Costs*
02468
101214161820
Swiss Italy Poland India ChinaCoastal
ChinaInner
~20 ~1
8 ~15
~7 ~8 ~6.5
Euro/Kg
*Source: Arthur D. Little
27
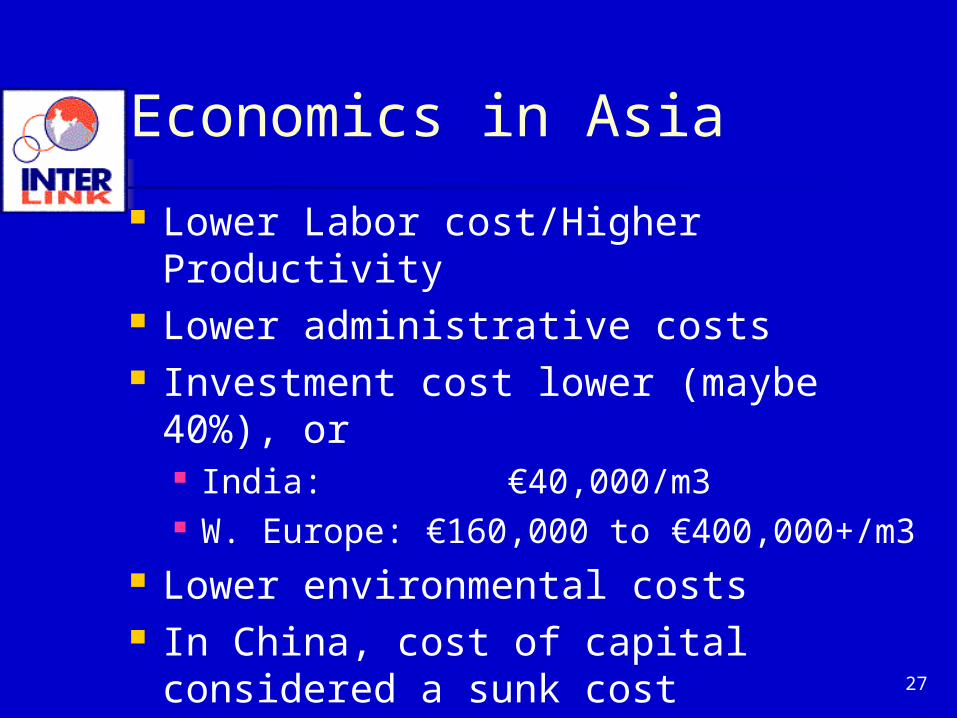
Economics in Asia
Lower Labor cost/Higher Productivity Lower administrative costs Investment cost lower (maybe 40%),
or India: €40,000/m3 W. Europe: €160,000 to €400,000+/m3
Lower environmental costs In China, cost of capital considered a
sunk cost

28
Economics in Asia
Raw materials maybe higher in India and China Higher solvent loss due to climate Higher energy costs Higher costs due to logistics, infrastructure and
other inefficiencies
Overall: Cost advantage of Asian suppliers increases with the complexity of the molecule, the longer and more complex the synthesis, and the higher the manpower and reactor volume
requirements.
29
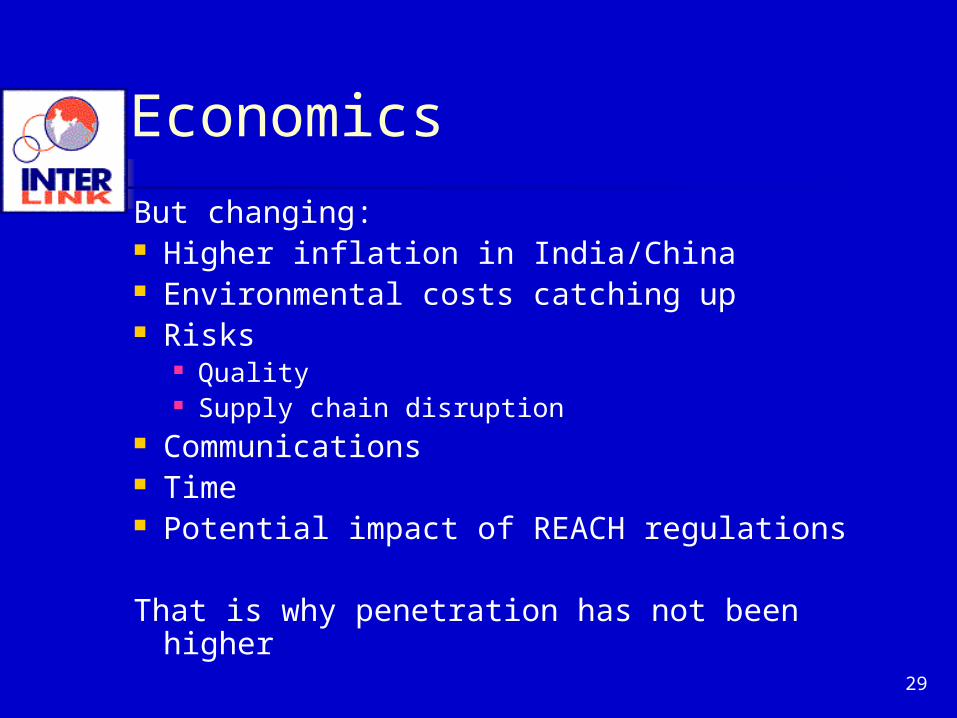
Economics
But changing: Higher inflation in India/China Environmental costs catching up Risks
Quality Supply chain disruption
Communications Time Potential impact of REACH regulations
That is why penetration has not been higher
30
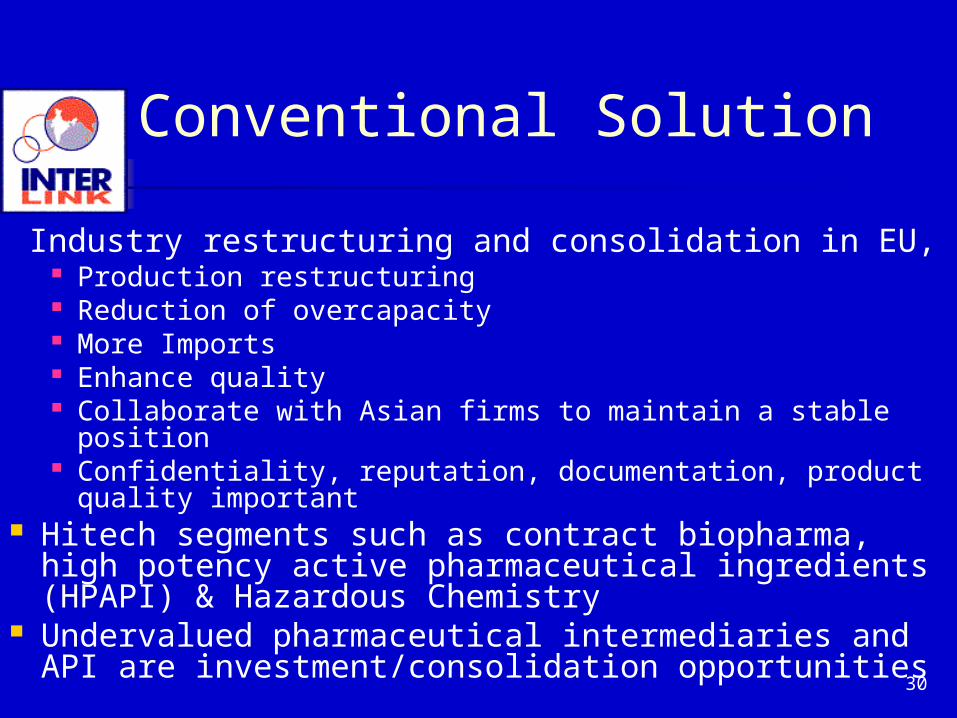
Conventional Solution
Industry restructuring and consolidation in EU, Production restructuring Reduction of overcapacity More Imports Enhance quality Collaborate with Asian firms to maintain a stable
position Confidentiality, reputation, documentation, product
quality important Hitech segments such as contract biopharma, high
potency active pharmaceutical ingredients (HPAPI) & Hazardous Chemistry
Undervalued pharmaceutical intermediaries and API are investment/consolidation opportunities
31
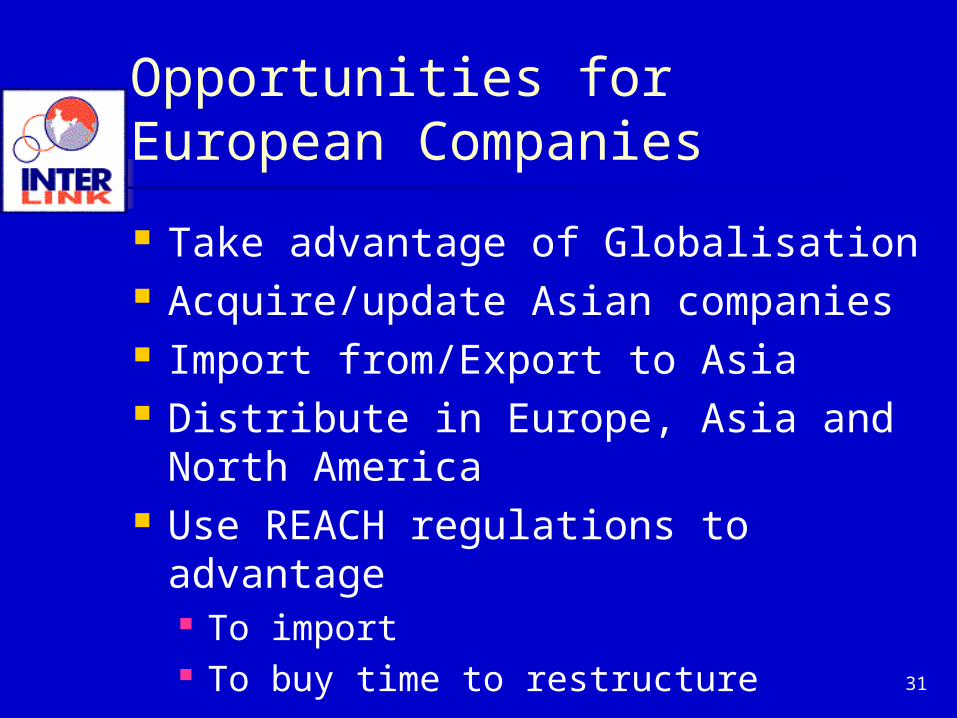
Opportunities for European Companies
Take advantage of Globalisation Acquire/update Asian companies Import from/Export to Asia Distribute in Europe, Asia and
North America Use REACH regulations to
advantage To import To buy time to restructure

32
Acquire/Update Indian Companies
Degussa long-term agreement Hikal
Solvay Pharma got FDA approval for Bavla facility Expanded its facilities in Naroda, India, for
cGMP manufacture of quaternary ammonium and phosphonium compounds and certain bulk drugs.

33
Acquire/Update Indian Companies
Albany Molecular Research USA expanding Indian R&D center, + scale-up lab for APIs and intermediates.
Aceto Corporation USA (a distributor) to buy or build its pharma quality assurance, and analytical labs, and to be Indian logistics center.
Sigma-Aldrich Corporation USA building a manufacturing plant in Bangalore

34
Galaxy Surfactants Ltd.

35
The changing business dynamics in India• Europe and India: dynamics
• Opportunities to invest in, sell to and buy from in India
• India and China competition• Using India to balance supply constraints
• The changing business dynamics in India• India Trade
• The growth of the chemicals businessand trends in India
• Using India as a supply base for other countries
36
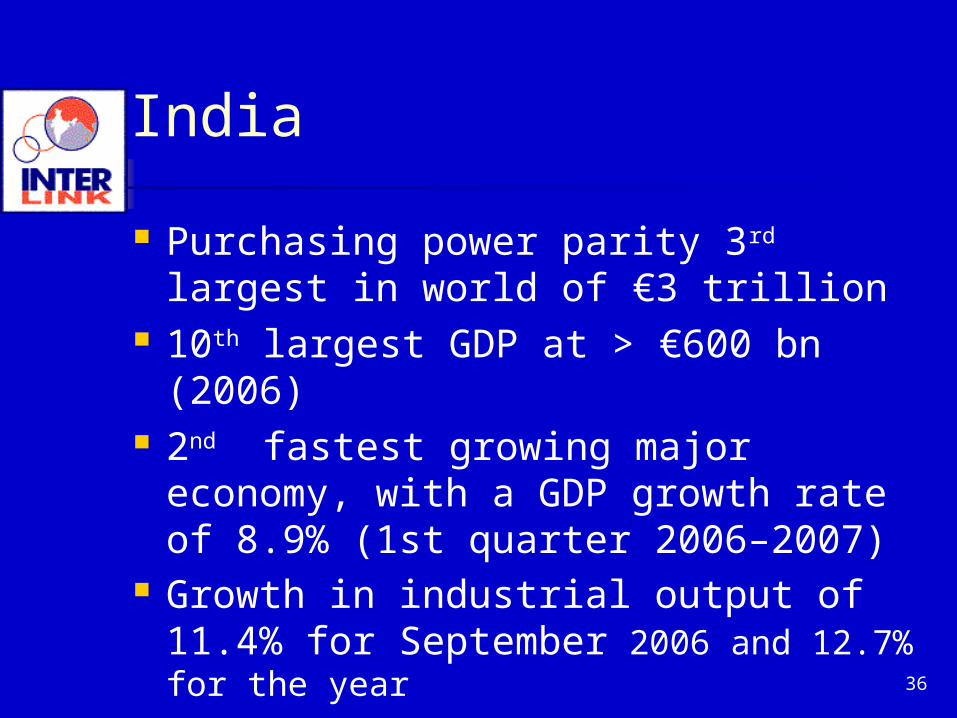
India
Purchasing power parity 3rd largest in world of €3 trillion
10th largest GDP at > €600 bn (2006)
2nd fastest growing major economy, with a GDP growth rate of 8.9% (1st quarter 2006–2007)
Growth in industrial output of 11.4% for September 2006 and 12.7% for the year

37
Growth in other Industries
Car sales up 22% in September Indian Engineering & Construction
industry 8.5% CAGR in 5 years, increasing rapidly
Manufacturing to grow from €39 bn in 2003 to €242 bn in 2015
Telephones grew from 14.5 million in 1997 to 120 million in 2006
IT industry has had 29% CAGR in 5 years

38
India
India:FTA with ThailandTrading partner status AseanWorking on EU special relationNAFTA?
India as a base for value added marketing into Asia and Middle East/Africa
India as a source of manufactured goods, not just services and knowledge (and R&D)

39
India – Sustained High Growth India adds:
€36 billion in incremental output (around a tenth of the levels of the US) to world
Annual contribution will rise to €282 billion by 2025 and €1.8 trillion by 2050
By 2050, 1/3 of global economic growth from India
India and China together will account for 2/3
India's economic growth will bring several benefits to Western economies
R&D facilities in India will help reduce costs and improve productivity
Low cost geography and its scientific talent pool, India will provide value added services, globally
Special Economic Zones to give distinct thrust to exports – Tax benefits, export incentives etc.

40
India Merchandise Trade with World
41
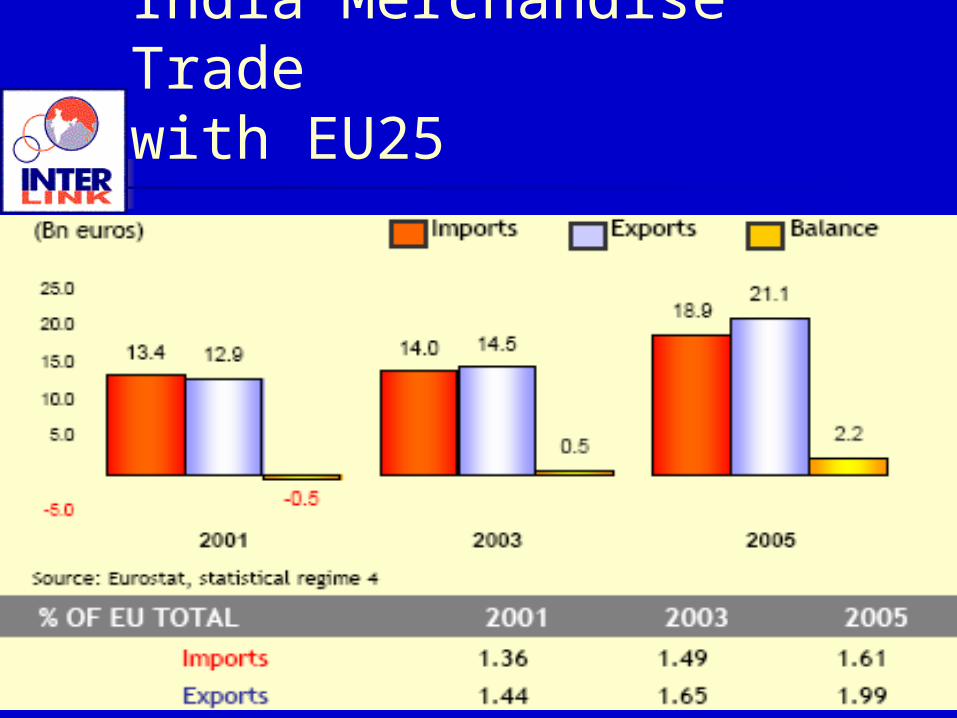
India Merchandise Trade with EU25
42
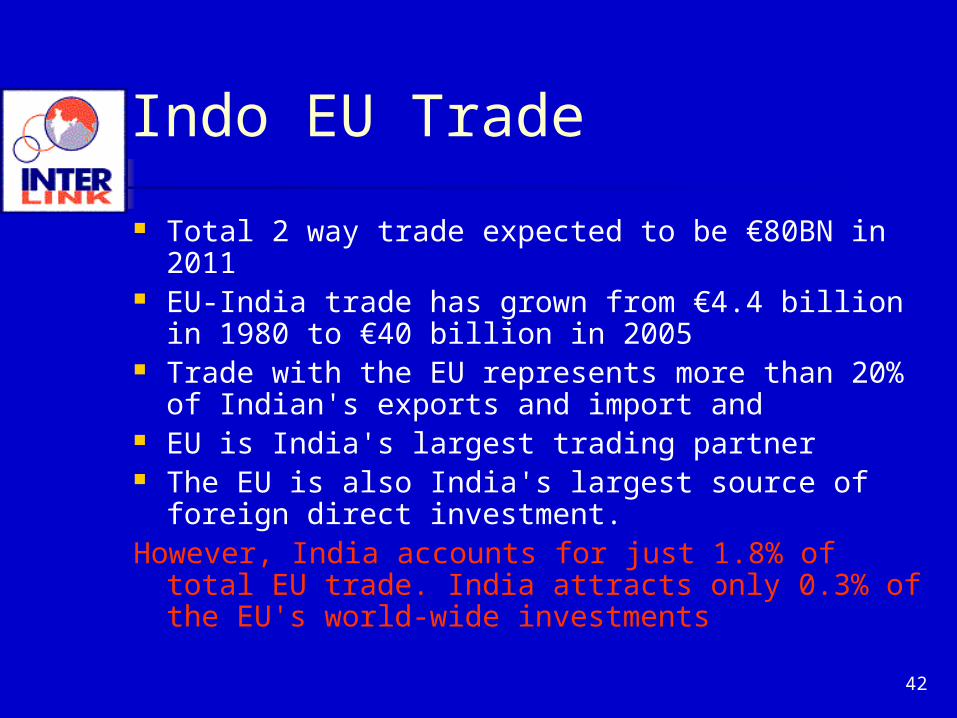
Indo EU Trade
Total 2 way trade expected to be €80BN in 2011 EU-India trade has grown from €4.4 billion in
1980 to €40 billion in 2005 Trade with the EU represents more than 20% of
Indian's exports and import and EU is India's largest trading partner The EU is also India's largest source of foreign
direct investment. However, India accounts for just 1.8% of total EU
trade. India attracts only 0.3% of the EU's world-wide investments
43
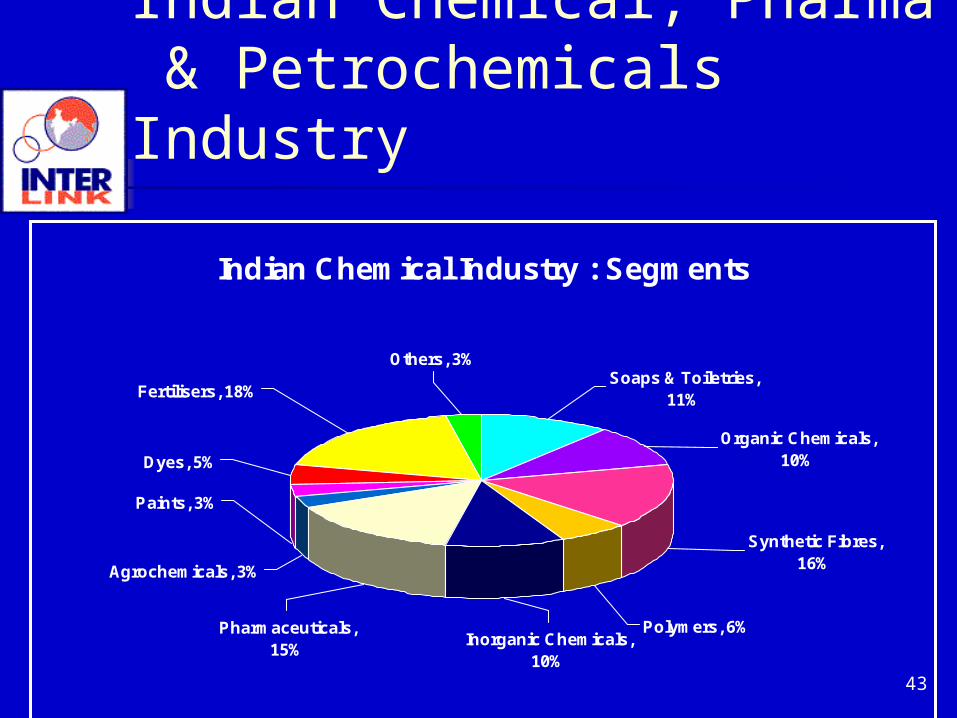
Indian Chemical, Pharma & Petrochemicals Industry
Indian Chemical Industry : Segments
Others, 3%Soaps & Toiletries,
11%
Organic Chemicals, 10%
Synthetic Fibres, 16%
Polymers, 6%Inorganic Chemicals,
10%
Pharmaceuticals, 15%
Agrochemicals, 3%
Paints, 3%
Dyes, 5%
Fertilisers, 18%
44
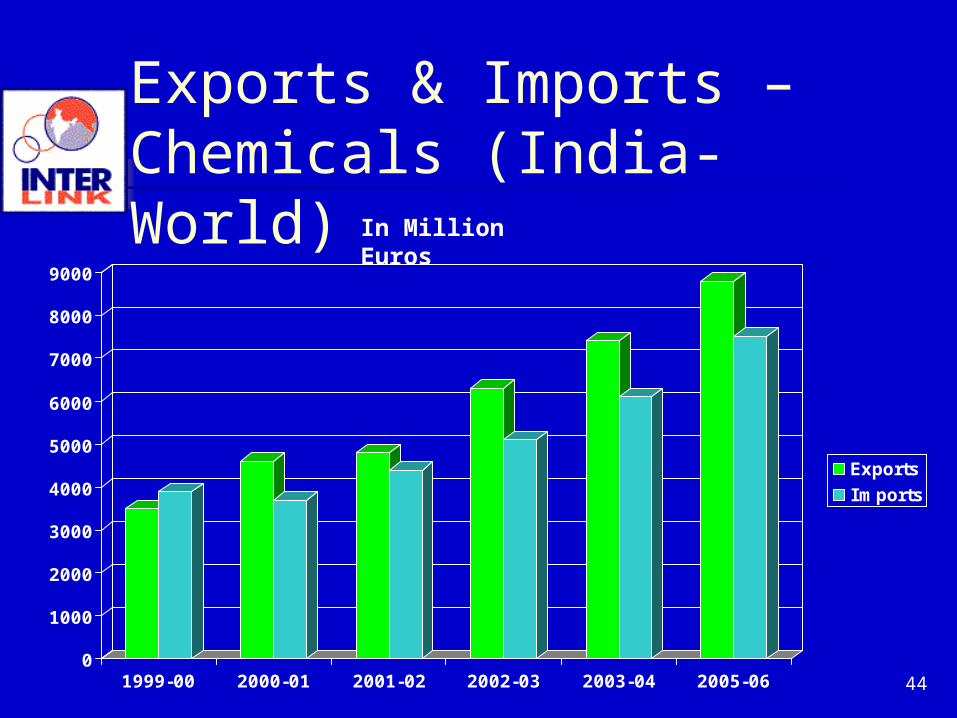
0
1000
2000
3000
4000
5000
6000
7000
8000
9000
1999-00 2000-01 2001-02 2002-03 2003-04 2005-06
ExportsImports
In Million Euros
Exports & Imports – Chemicals (India-World)

45
India: Chemicals
Organic Chemicals: 1.53% of EU organic chemicals exported to India
which are 18.63% of India’s needs China, EU are top suppliers to India. India is 11th ranked importer from EU
Inorganic Chemicals: 1.54% of EU inorganic chemicals exported to
India which are 6.26% of India’s needs Inorganic Chemicals suppliers Morocco, South
Africa India ranks 11th as importer from EU
46* These figures include production from unorganized sector, which is estimated at 26% of the production.
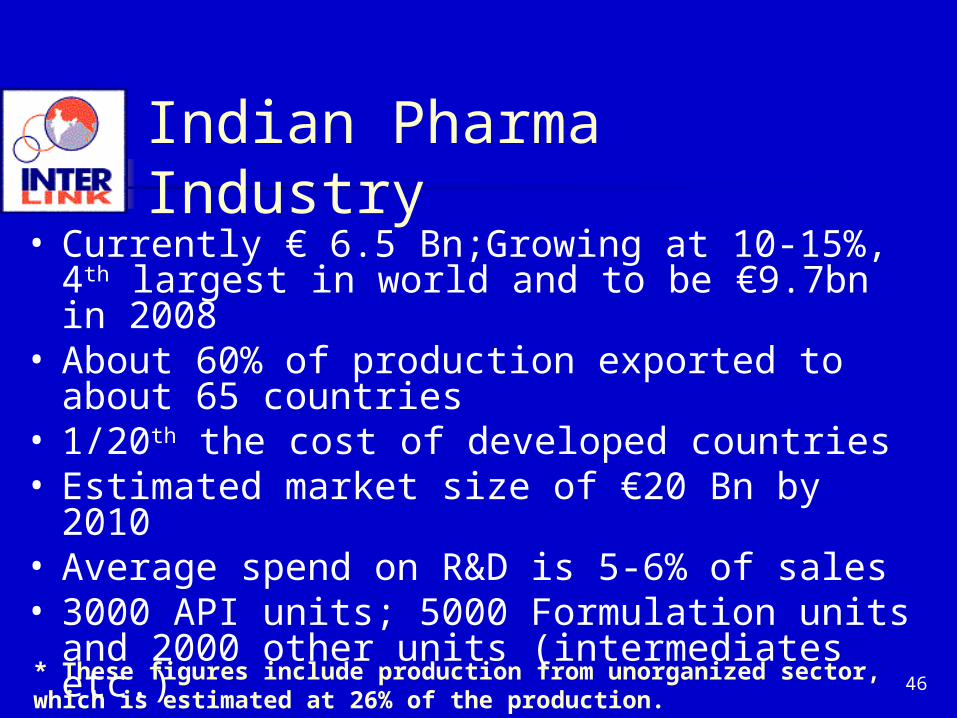
• Currently € 6.5 Bn;Growing at 10-15%, 4th largest in world and to be €9.7bn in 2008
• About 60% of production exported to about 65 countries
• 1/20th the cost of developed countries• Estimated market size of €20 Bn by 2010• Average spend on R&D is 5-6% of sales• 3000 API units; 5000 Formulation units and 2000
other units (intermediates etc.)
Indian Pharma Industry

47
Indian Pharma Industry
Exports are over €3.8 billion. India among top five bulk drug makers. Indian owned companies are 65% increased
from 25% Exports growing by 20% Medicinal plants trade > €725M. 170 biotechnology companies in R&D and
manufacture of genomic drugs, business growing exponentially.
Sequencing genes and delivering genomic information for big Pharmaceutical companies is the next boom industry in India.

48
Indian Pharma Industry
India's bulk drug and pharmaceutical industry grown into a highly sophisticated one, meeting the International standards of Production, Technology and Quality Control
The progress of the Drug industry has rendered the country self-sufficient in National Health Care, has reversed the trend of Indian foreign trade profile from a predominantly importing country to a highly visible exporter to global marketing
49
Indian Pharma Industry
Indian pharmaceutical companies: filed 104 out of 251 new Drug Master Filings made in the US in April- June 2006, largest number of DMFs by any country
India has largest contract research business in pharma industry (2005: $100-120 Mn) and growing at 20-25 per cent per year. About 35 per cent is new drug discovery and 65 per cent is in clinical trials.
Cost saving for a multinational company moving R&D to India is 30-50%
Indian domestic Pharma companies are going global with a direct presence in multinational locations in the world.
50
Pharma Industry
Bulk Drugs, € 1.6 bn, growing at 20%
Formulations, € 5.5 bn, growing at 15%
Imports > € 1.4 bn
Exports € 2.5 bn in 2003, 40% of India’s pharma manufacturing Now € 3.8 bn

51
India’s Pharma Intermediates
Distinctive focus on: Late stage Intermediates Complex Synthetic APIs
Move Towards: Custom Synthesis Low delivered prices Increasing technical & managerial
sophistication

52
Performance of Chemicals during 2001-02 to 2004-05 (000 MT)
Group2001-02
2002-03
2003-04
2004-05
Growth(%) CAGR
Total major Chemicals
Capacity 8012 8334 8750 8933 3.69
Production 5963 6612 7066 7375 7.34
Capacity Utilisation (%) 74.4 79.3 80.8 82.6
Imports 743 724.6 930 914 7.15
Exports 277 435 478 721 37.56
Consumption 6429 6902 7518 7568 5,59
Source: Report 2005-06 Ministry of Chemicals & Fertilizers Govt. of India
Chemicals Industry

53
2001-02 to 2004-05(000 MT)
Group 2001-02 2002-03 2003-04 2004-05 Growth(%) CAGR
Total major Petrochemicals
Capacity 7017 7162 7423 7915 4.1
Production 6235 6553 7006 7348 5.63
Capacity Utilisation (%) 88.9 9 1.5 94.4 92.8
Imports 669 691 830 841 7.93
Exports 698 969 1039 1257 21.66
Consumption 6206 6275 6797 6932 3.76 Source: Annual Report 2005-06 Ministry of Chemicals & Fertilizers (Govt. of India)
Indian Petrochemicals

54
Year Production Imports Exports Demand
2001-02 9,808 1,157 1,150 9,815
2002-03 10,932 997 871 11,058
2003-04 11,269 875 918 11,226
2004-05 13,546 728 844 13,430
2005-06 13,574 - - -
Organic Pigments ‘000 Tons
55
Indian Specialty & Fine Chemicals Industry > €4 Billion/Year Will be one of top-two exporters in low cost countries 2002: Exports valued at €1.6 Billion Growing @15%-20% annually Manufacturing hub for technology – intensive production Better than China in product quality & R&D facilities Specialty chemicals as antioxidants, food additives, and
pigments Pharmaceutical and Agrochemical Industries consume more
than 70% of the fine chemicals produced Performance chemicals being developed in India. Growing
demand from manufacturers of products such as sunscreens and Biocides
Manufacturing for Fine & Specialty chemicals shifting from developed countries to developing countries such as India.
Indian Specialty & Fine Chemicals Market
56
Why India is Important for the European Fine Chemicals IndustryThe changing business dynamics in India
The growth of the fine chemicals businessand trends in India: Knowledge and R&D base
Opportunities to invest in, sell to and buy from in India
India and China competition
Using India to balance supply constraints
Using India as a supply base for other countries

57
Confused European Dynamics* Some European Companies:
GrowingGrowing Others: On the FenceOn the Fence And Some: ExitingExiting
Understand and React to Change
Cos. Trading at Low MultiplesFew Customers for Used Plants
* Marc Hannebert

58
European Growth Drivers
Generics New Molecules (R&D) Speed of Generisation
India is great at these

59
Who is your Customer?
Taking Pharma Intermediate Cos. as an example:
Consumer Final Drug Producer Some one else Insurance Companies?Provide Value Added solution to end
CustomerMove down and up Value Chain, convert
commodities to specialties through soft factors (Roger LaForce)

60
Lessons
European Fine Chemicals Cos. have Customer Base
Change Production Base to India Source Contract Buy someone Use India for R&D: REACH labs in
India
61
Lessons
Build Global Strategy: USA, Asia, and the world
Understand and react to change Try to Europeanise India
Upgrade As economy grows
Insurance companies

62
Lessons
Indian Companies Use Production & R&D base to your
advantage Get closer to Customer
Buy someone close to the customer, or with a customer base
Buy a distribution co. Manage expensive European logistics
Globalise: Backward/Forward Integration Indianise Europe
63
Drivers in India
India low Cost Driven by Government to deliver
low cost health care solutions to the poor Low cost/affordable drugs
Avoid Insurance company syndrome Lobby of people vs. Lobby of insurance companies/drug
companies Example: AIDS drugs

64
India and Specialties
Opportunity for European companies to sell
For Indian companies to develop low cost alternatives

65
We conclude, India is important:
Very cheap source of fine chemicals Growing & important R&D centre Growing market for European companies to tap India is Entering Europe Growing competitor Opportunity for European manufacturers to re-
locate and source from India and to sell in India Sub contract Or source and sell through specialists like Azelis
66
Therefore, understanding India, build a Global Strategy
Used to be in many industries:“What is your China Strategy?”
It is not only that but your Indian and Asian strategy, and your Global strategy
Ignore India at your own risk!

67
THANK YOU
Gautam MahajanInter-Link Services Pvt. Ltd.K 185 Sarai Jullena New Delhi [email protected]+91 98100 60368, Fax +91 11 26929055