1 What is Operations Management @ NU 4 Distribution Companies $1,311M Cap 32,000 Interruptions...
14
1 What is Operations Management @ NU 4 Distribution Companies $1,311M Cap 32,000 Interruptions 67,000 Trouble Calls 40,000 miles of infrastructure 2 + million customers Transmission CL&P & YG WMECo PSNH $428M Exp
-
date post
20-Dec-2015 -
Category
Documents
-
view
218 -
download
1
Transcript of 1 What is Operations Management @ NU 4 Distribution Companies $1,311M Cap 32,000 Interruptions...

1
What is OperationsManagement
@ NU
4 Distribution Companies$1,311M Cap
32,000 Interruptions
67,000 Trouble Calls
40,000 miles of infrastructure 2 + million customers
Transmission
CL&P & YG
WMECo
PSNH
$428M Exp

2
Diagram of Integrated Electric System
Electric Generation
Transformer12,500 – 25,000v
Transmission Lines115,000 – 345,000 v Substation
Industrial User120 – 34,500 v
Commercial User120 – 480 v
Residential User120 - 240 v
Distribution Lines2,400 to 34,500 v

3
Diagram of Integrated Gas System
GateGate

4
Mai
nten
ance
Operations Construction
Engineering
Design
Planning
CustomerService
Key Macro-Level OperationsManagement
Functions @ NU
Many other support/logistics functions help make this work e.g……• Purchasing/inventory/stores• Human Resources• Accounting• IT• etc., etc.

5
Key Operations Management Terminology
Peak Demand (kW)Customer Usage (kWHr)Delivery EfficiencyDelivery CostDelivery RevenuesCapitalOperations and Maintenance ExpenseCustomer Satisfaction

6
How Does Operations ManagementFit Into NU
Business/Financial Model ?
Revenues - Expenses = Net Income
Operations Management
Sales X rates PSNH & WMECo +
+ “other” - = YG + CL&P +
Transmission
Operations ExpensesMaintenance Expenses
Capital Expenses
Other Expenses

7
NU Uses Operational Performance Indicators (KPIs) to Measure and
Drive Operations Management
• High level KPIs are consistent across Operating Companies
• 4 Main Areas of Focus Safety Operations Customer Financial
• Total of 71 KPIs
• Targets set annually …. results reviewed monthly
• Lower level KPIs exist with Operating Companies and functions
• Short term and long term corrective actions expected where performance falls below targets.
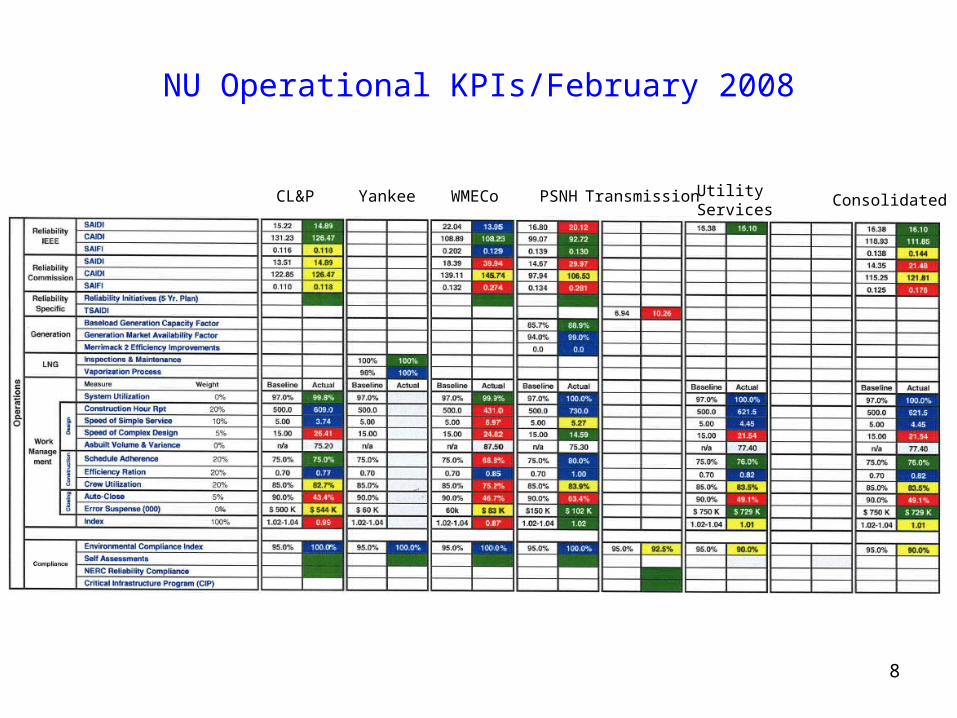
8
NU Operational KPIs/February 2008
CL&P Yankee WMECo PSNH Transmission Utility Services
Consolidated

9
CL&P - SAIDI (IEEE)
5.42 5.85
6.4 8.8
Data
Jan 07 Jan 00 Mar 07 Apr 07 May 07 Jun 07 Jul 07 Aug 07 Sep 07 Oct 07 Nov 07 Dec 07
CL&P YTD Actual 5.76 11.29 22.26 28.26 42.29 61.78 81.71 96.64 106.80 118.19 126.03 136.92
CL&P YTD Target 9.05 16.35 25.63 33.58 45.04 65.67 85.53 104.37 117.75 131.07 144.44 155.00
CL&P Month Actual 5.76 5.53 10.97 6.00 14.02 19.48 19.91 14.93 10.17 11.39 7.85 10.89
CL&P Month Target 9.05 7.30 9.28 7.95 11.46 20.63 19.86 18.84 13.38 13.32 13.37 10.56
Division Operations
Central Division-YTD Actual 4.95 9.84 18.12 22.94 34.45 49.22 62.59 75.25 82.59 96.84 101.49 110.90
Target 7.47 16.96 23.95 34.17 41.25 60.67 77.29 98.72 113.22 128.61 140.01 147.41
Eastern Division-YTD Actual 6.24 15.75 27.55 37.64 46.15 66.30 94.71 102.45 112.11 124.11 134.08 147.11
Target 13.33 19.52 29.14 38.36 56.09 75.63 91.83 107.67 120.83 136.89 149.08 166.59
Southern Division-YTD Actual 7.07 10.50 19.04 25.54 51.98 68.28 89.05 106.86 114.33 124.75 134.26 147.74
Target 7.93 14.20 25.20 31.67 44.46 67.21 93.04 117.33 127.78 138.74 155.50 165.21
Western Division-YTD Actual 5.11 9.34 23.98 27.13 38.92 64.74 82.76 103.94 119.26 128.14 135.85 144.27
Target 7.65 14.63 24.46 30.28 39.38 60.47 82.03 96.91 111.65 122.44 136.12 144.23
0.0
20.0
40.0
60.0
80.0
100.0
120.0
140.0
160.0
180.0
Jan 07 Jan 00 Mar 07 Apr 07 May 07 Jun 07 Jul 07 Aug 07 Sep 07 Oct 07 Nov 07 Dec 07
Min
ute
s
CL&P YTD Actual CL&P YTD Target
Good
0.0200.0
Jan07
Jan00
Mar07
Apr 07 May07
Jun07
Jul 07 Aug07
Sep07
Oct 07 Nov07
Dec07
Min
ute
s
CL&P YTD Actual CL&P YTD Target
Strategic Priority
An Individual KPI (i.e. SAIDI)

10
Each Year “Operational Plans” are Developed and Executed at NU by Operating Company/Business Unit
to Manage Operations Performance
5 Year Enterprise Plan
1 YearOperational Plan
Execution of Operational Plan
• Spring development• 5 Year focus• Strategic/major initiatives• 5 year initiatives to
• identify major risks • address business
environment changes• major KPI trend issues
• Fall development• “Next Year” focus• Compatible with 5 year Enterprise Plan• Tactical
• Set Operational KPIs• Initiatives to achieve KPIs

11
CL&P Main Priorities for 2008 Goal Initiatives Measures
3. Meet customer and regulator expectations for reliability
Implement year 2 of the Long Term (5 year) Reliability Plan
• Maintain a distribution system that is safe for employees and customers by completing the remainder of the A. B. Chance cutout replacement program and replacing cap and pin insulators in identified CL&P substations in 2008
• Manage acute reliability problems by completing specifically identified reliability work in the towns of Stamford, Waterbury and Meriden; including the development of projects to expand distribution capacity to supply expected significant new load growth in downtown Stamford. Also replace or rejuvenate cable in identified direct buried developments with a history of extensive complaints and disruptive failures
• Manage aggregate CL&P SAIDI performance by identifying and completing cost effective capital reliability work that will net at least 7 minutes of SAIDI improvement helping to offset the impact of declining SAIDI performance due to trees and aging infrastructure.
• Complete 2008 capital related regulatory commitments (Stamford, Waterbury, Meriden)
• Manage capital program consistent with rate case funding
Improve performance of system maintenance program
• Finalize Maintenance Program Upgrade Plan, including the establishment of due dates, based on approved funding
• Based on finalized plan, perform specified maintenance in 2008
• Complete all other 2008 actions specified in Maintenance Program Upgrade plan
Utilize human performance techniques to manage risk and minimize outage events
Prepare for and support the 2008 NERC audit
Implement a comprehensive self assessment program to identify and correct procedure compliance weaknesses
SAIDI (IEEE) of 150.00 minutes
CAIDI (IEEE) of 133.77 minutes
SAIFI (IEEE) of 1.121
Meet Long Term Reliability Plan milestones
Meet regulatory related reliability commitments
Finalize Maintenance Program Upgrade Plan by March 31, 2008
Complete specified maintenance in accordance with plan
Complete all other 2008 Maintenance Program Upgrade Plan actions
Receive NERC audit report with “no audit findings”
Complete four self assessments
Correct procedural inadequacies and/or compliance weaknesses identified through self assessments based on procedure timelines

12
Major Events & Changes for Electric Utilities in New England/Last 50 Years
Intensified “D” regulation
Nuclear Construction
M & As
Integrated G & T planning T planning only
Vertically integrated utilities Utilities Segmented
Dropping energy costsRising energy costs
High sales growth Low sales growth
Year 1955 1965 1967 1973 1979 1985 1990 2003 2008
Major Events Northeast (NU Oil 3 Mile Hurricane Hurricane Northeast GlobalBlackout 1 Formed) Embargo Island Gloria Bob, Blackout 2 Warming/
Restructuring RGGI
Power Pool Development/FERC Influence
Ch
an
ges in
Uti
lity
En
vir
on
men
t
Mostly stand alone utilities
No Nuclear Construction
?
Energy Efficiency Emphasis

13
So ….. Operations Management Areas of Focus Have Had to Change With The Times (1955 – 2008)
1. Adapt to growing influence of power pools and FERC
2. Adapt to lack of integrated generation and transmission planning
3. Cope with increasing regulation (especially D segment)
4. Higher total energy costs = higher customer expectations
5. Manage an aging infrastructure (post WWII expansion)
6. Control delivery costs to offset higher energy costs and slower revenue growth
7. Take the lead in energy efficiency
8. Become “players” in legislative/regulatory decisions

14
Key Operations Management Challenges Facing Distribution Utilities Today
1. Safety
2. Meeting increasing customer performance expectations
3. Managing an aging distribution delivery infrastructure
4. Managing increasing costs between rate cases
5. Managing areas of environmental risk
6. Planning for worker attrition
7. Reacting to changing laws and regulations
8. The goal is to accomplish items above while meeting Shareholder expectations for increased income over time