1 · Web viewVADEQ sampled hazardous air pollutants in Winchester City and Frederick County at...
54
Commonwealth of Virginia Department of Environmental Quality FINAL REPORT OF THE SPECIAL AMBIENT AIR SAMPLING PROJECT IN WINCHESTER, VA
Transcript of 1 · Web viewVADEQ sampled hazardous air pollutants in Winchester City and Frederick County at...
Commonwealth of VirginiaDepartment of Environmental Quality
FINAL REPORTOF THE SPECIAL AMBIENT AIR SAMPLING
PROJECT IN WINCHESTER, VA
Division of Air QualityOffice of Air Quality Planning & Monitoring
October 2006

This report was prepared by:
James Dinh, Brian King, Baxter Gilley, and Crystal Sorensen
Some information in this report was quoted from the National Air Toxic Assessment (NATA), Toxicology Data Network (TOXNET), Occupational Safety and Health Administration (OSHA), Agency for Toxic Substances and Disease Registry (ATSDR), and Hazardous Substances Data Bank (HSDB), and the Virginia Annual Reports.
Acknowledgment:
We would like to acknowledge and thank EPA Region III, the Lord Fairfax District of the Health Department, Frederick County Board of Supervisors, Winchester City Council, Division of Consolidated Laboratory Services (DCLS), Alan Anthony, Valley Regional Staff, General Electric (GE) in Winchester, Winchester City and Frederick County Courthouse, and the Clearbrook Fire Department.
We would like to extend a special thank you to David Taylor for all his dedication and contribution to this special study.
2

TABLE OF CONTENTS
1.0. Background p. 42.0. Objectives p. 43.0. Summary p. 44.0. Ambient Air Sampling Activities p. 4
4.1. Stakeholder Committee p. 44.2. Pollutant Sources p. 54.3. Sampling Locations p. 64.4. Target Pollutants p. 144.5. Sampling Frequency p. 154.6. Sampling Method p. 15
4.6.1. Sampling Method TO-154.6.2. Sampling Method TO-11A4.6.3. Sampling Method IO-34.6.4. Hexavalent Chromium Sampling Method
4.7. Sampling Equipment p. 16
4.7.1. Particulate Matter Sampler – Toxic Metals4.7.2. Air Canister Sampler – Volatile organic Compounds4.7.3. Carbonyl Sampler – Aldehyde and Ketone Compounds4.7.4. Hexavalent Chromium Sampler4.7.5. NovaLynx Portable Weather Station
5.0. Laboratory Analysis p. 176.0. Data Assessment p. 18
6.1. Particulate Matter PM-10 Sampling p. 186.2. Metals Sampling p. 206.3. Carbonyl Sampling p. 246.4. Volatile Organic Compounds Sampling p. 286.5. Hexavalent Chromium Sampling p. 35
7.0. Data Comparison with NATA p. 368.0. Conclusion p. 37
3

1.0. BACKGROUND:
In 2004, to respond to citizens’ health concerns about possible unusual cancer rate compared to surrounding localities, the Virginia Department of Environmental Quality (VADEQ) had applied for a special grant to establish and operate a comprehensive Air Toxics monitoring network in the Winchester area. The US Environmental Protection Agency (EPA) Region III awarded VADEQ funding for the study. The project enabled VADEQ to perform ambient air sampling in the target area for possible unusual concentrations of toxic compounds. The collected data and subsequent data analyses might provide some answers to the citizens’ health concerns.
2.0. OBJECTIVES:
In order to better understand the air quality and health aspect of selected ambient air toxic pollutants in Winchester City and Frederick County, this project had the following three objectives:
To establish any correlation between cancer rates and averages to target compound concentrations.
To develop a baseline of air quality concentrations for the area that could be used for future evaluation for the progress of an emission control program.
To assess the validity of the 1999 National Air Toxic Assessment (NATA) findings.
3.0. SUMMARY:
This report summarizes the sampling activities from air toxics monitoring conducted from January 2005 to June 2006 in Winchester and data analyses performed by the Valley Regional Office and the Office of Planning & Monitoring. VADEQ sampled hazardous air pollutants in Winchester City and Frederick County at three sites: the General Electric Plant, the Winchester Court House, and the Clearbrook Fire Station. The analyses indicated that the pollutants in the air samples collected at the three Winchester sites were not significantly different from other monitored locations in Virginia. A follow up health assessment conducted by the Lord Fairfax District of the Health Department will be beneficial. The study also established a baseline of air quality concentrations for Winchester, which will be useful for future evaluations, and allowed DEQ to evaluate the results of the 1999 NATA study.
4.0. AMBIENT AIR SAMPLING ACTIVITIES:
4.1. STAKEHOLDER COMMITTEE:
In order to obtain optimal results for the project, a stakeholder committee was formed with representatives of the following agencies and localities:
City of Winchester: Mr. Steve Bauserman
Frederick County: Ms. Barbara Van Osten
4

Department of Health / Lord Fairfax District: Dr. Diane HelentjarisMr. Kelly Vanoviv
VADEQ: Ron Phillips (Valley Regional Office)David A. Taylor (Valley Regional Office)Barry Brandon (Valley Regional Office)James Dinh (Air Quality Monitoring)Brian King (Air Quality Monitoring)Baxter J. Gilley (Air Quality Monitoring)
4.2. POLLUTANT SOURCES:
Winchester is in the highly populated Northern Virginia area. It has numerous point sources (facilities including medical, industrial and commercial), on-road mobile sources (motor vehicles), off-road vehicles and equipment (farm activities), and agricultural pesticides within its boundaries. Mobile sources (on-road and off-road) from several highways and interstates such as: I-81, I-66, and Route 50 contribute a large portion of ambient volatile organic compounds (VOC) in the area. Agricultural activities also account for a number of Hazardous Air Pollutants (HAPs) that might be an important factor affecting the area air quality. Furthermore, some of the industries have been shut down and remain abandoned which may potentially add to environmental concerns. Some social / economic factors such as: poor living conditions, crowded inhabitants, smoking and heavy drinking habits, could also contribute to low overall health statistics.
5
The representative of the Lord Fairfax District of the Health Department, Dr. Helentjaris, has agreed that the area had less cancer of all kinds than the state average but slightly higher for breast and ovarian cancers. She also advised the committee that social / economic factors should also be considered in the study. The stakeholder committee has mutually agreed on the limited scope of the project. It should be viewed as the first study for the area.
4.3. SAMPLING LOCATIONS:
The main objectives for the project are to provide data for both the limited health assessment for the city of Winchester, Virginia, and data for comparison to the results of the 1999 NATA review. In order to maximize special coverage to attaining the main objectives, VADEQ operated three air toxics monitoring stations. Selection of the three toxic stations was made based on optimum spatial coverage, availability of sampling locations, and primary wind direction through the city. The historic wind data for the Winchester area indicated the primary wind direction is southwest.
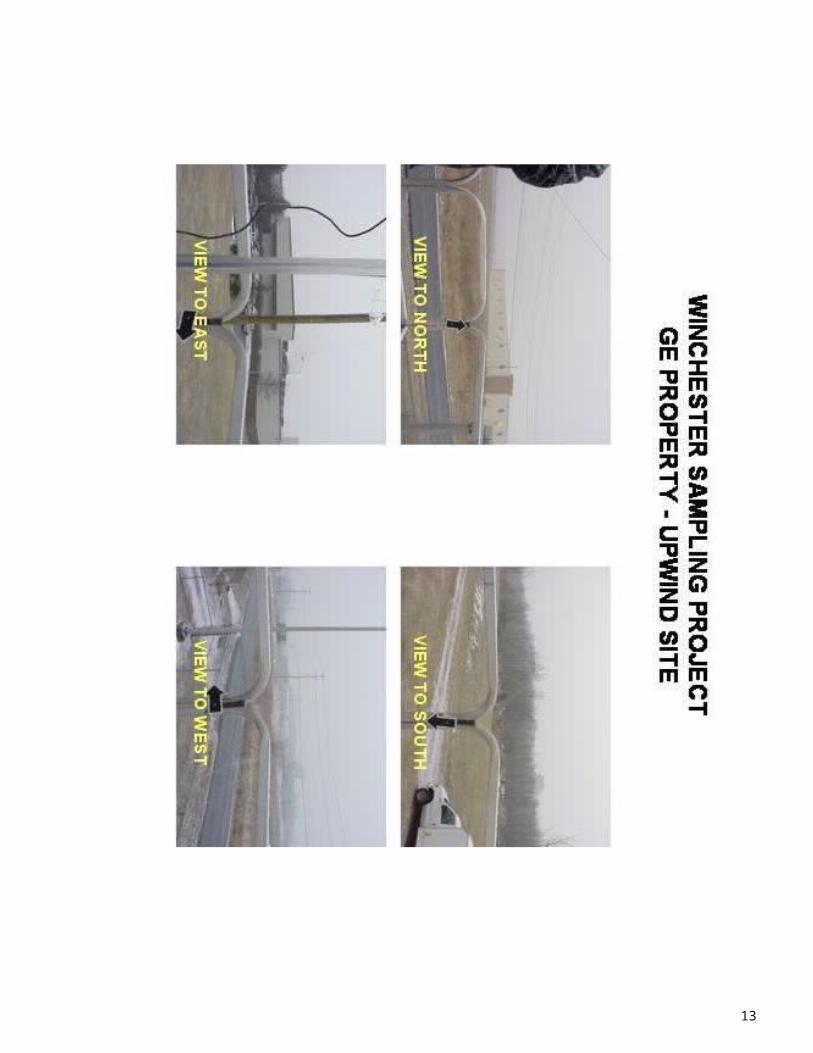
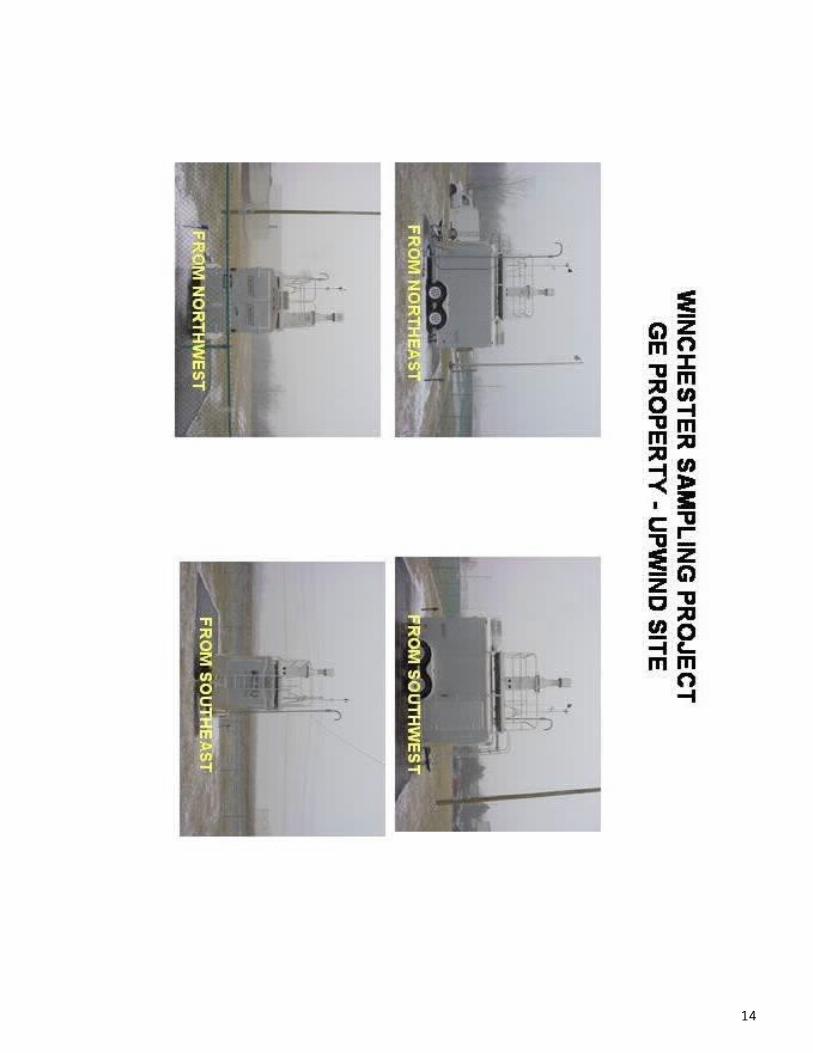
Site 1 : The first site is an upwind site, located on the South end of Winchester City. This site was setup as a baseline for air toxics concentration for the study. It is located at the General Electric (GE) Plant approximately 3 miles south of urban Winchester. The following are Air Quality System (AQS) site information and its coordinates:
- AQS # 51-069-0011.- N 39o 7.90’ W 78o 11.96’- Suburban / Industrial site- Address: 125 Apple Valley Rd.
Winchester, VA 22602
Site 2: A central site was installed at the Winchester Court House in downtown Winchester. This site measures maximum concentrations of pollutants from potential industrial / commercial air toxics in the area. The following are Air Quality System (AQS) site information and its coordinates:
- AQS # 51-840-0002- N 39o 11.13’ W 78o 9.78’- Urban / Residential site- Address: 5 North Kent Street.
Winchester, VA 22601
Site 3 : A downwind site was chosen to measure the transport of air toxics concentration leaving the Winchester area. This site is located at the Clearbrook Fire Station, approximately 5 miles north of urban Winchester. The following are Air Quality System (AQS) site information and its coordinates:
- AQS # 51-069-0012- N 39o 15.39’ W 78o 5.41’- Suburban / Industrial site- Address: 1256 Brucetown Rd...
Clearbrook, VA 22624
6

Map of Winchester sampling locations
7

8

9

10

11

12
13
4.4. TARGET POLLUTANTS:
In order to assess the impact of motor vehicle and industrial related emissions in the area, VADEQ collected ambient air samples and subsequently analyzed the collected sample for a limited number of Hazardous Air Pollutants (HAPs). Selection of these target HAPs was based on availability and capacity of the current sampling and analytical systems. These HAPs are identified in the draft Integrated Urban Air Toxics Strategy (UATS). The target pollutants list is also a subset of the 188 toxics identified in Section 112 of the Clean Air Act (CAA) that are thought to have the greatest impact on the public and the environment in urban areas.
These target HAPs were grouped into four compound categories based on sampling requirement. The categories included volatile organic compounds (VOC), carbonyls, toxic metals, and Hexavalent Chromium.
LIST OF VOC:
CAS # AQS # Pollutant Names Other Names
115-07-1 43205 Propylene 75-71-8 43823 Dichlorodifluoromethane (Freon-12)74-87-3 43801 Chloromethane (Methyl Chloride)76-14-2 43208 1,2-dichloro-1,1,2,2-tetrafluoroethane (Freon-114)75-01-4 43860 Vinyl Chloride (chloroethene)106-99-0 43218 1,3-Butadiene74-83-9 43819 Bromomethane (Methyl Bromide)75-00-3 43812 Ethyl chloride (Chloroethane)75-69-4 43811 Trichlorofluoromethane (Freon-11)75-35-4 43826 1,1-Dichloroethene75-09-2 43802 Methylene chloride (Dichloromethane)76-13-1 43207 1,1,2-trichloro-1,2,2-trifluoroethane (Freon-113)540-59-0 43838 trans-1,2-Dichloroethene75-34-3 43813 1,1-Dichloroethane (Ethylene dichloride)540-59-0 43839 cis-1,2-Dichloroethene100-54-3 43231 Hexane69-66-3 43803 Chloroform (Trichloromethane)141-78-6 43209 Ethyl Acetate109-99-9 46401 Tetrahydrofuran107-06-2 43815 1,2-Dichloroethane (Ethylene Dichloride)71-55-6 43814 1,1,1-trichloroethane (Methyl Chloroform)71-43-2 45201 Benzene56-23-5 43804 Carbon Tetrachloride110-87-7 43248 Cyclohexane78-87-5 43829 1,2-Dichloropropane 25-27-4 43828 Bromodichloromethane79-01-6 43824 Trichloroethylene (Trichloroethene)142-82-5 43232 Heptane542-75-6 43831 cis-1,3-dichloropropene 542-75-6 43830 trans-1,3-dichloropropene 9-00-5 43820 1,1,2- Trichloroethane 108-88-3 45202 Toluene 124-48-1 43832 Dibromochloromethane
14

106-93-4 43843 1,2-Dibromoethane (Ethylene Dibromide)127-18-4 43817 Tetrachloroethene (perchloroethylene) 108-90-7 45801 Chlorobenzene100-41-4 45203 Ethylbenzene 108-38-3 45109 m & p-Xylene 75-25-2 43806 Bromoform100-42-5 45220 Styrene 79-34-5 43818 1,1,2,2- Tetrachloroethane 95-47-6 45204 o-Xylene 622-96-8 45213 1-Ethyl-4-methylbenzene (4-ethyltoluene) 108-67-8 45207 1,3,5- Trimethylbenzene 95-63-6 45208 1,2,4- Trimethylbenzene 541-73-1 45806 1,3-Dichlorobenzene 106-46-7 45807 1,4-Dichlorobenzene (p-Dichlorobenzene) 95-50-1 45805 1,2-Dichlorobenzene (o-Dichlorobenzene) 120-82-1 45810 1,2,4- Trichlorobenzene 87-68-3 43844 Hexachloro-1,3-buadiene
LIST OF CARBONYL COMPOUNDS:
CAS # AQS # Pollutant Names Other Names
75-07-0 43503 Acetaldehyde50-00-0 43502 Formaldehyde107-02-8 43505 Acrolein
LIST OF TOXIC METALS:
7440-38-2 82103 Arsenic and compounds7440-41-7 82105 Beryllium and compounds7440-47-3 82112 Chromium compound7439-92-1 82128 Lead and compounds7440-02-0 82136 Nickel and compounds
HEXAVALENT CHROMIUM
4.5. SAMPLING FREQUENCY:
Sampling occurred every sixth day for all target pollutants. Collocated samples were collected every twelve days.
4.6. SAMPLING METHODS:
The measurement goal of the VADEQ is to estimate the concentration in units of micrograms per cubic meter (μg/m3), and parts per billion of volume (ppbV) of air toxic compounds of particulates and gases. This is accomplished by four separate collection media:
Summa & Silco Canister for VOC sampling Dinitrophenylhydrazine (DNPH) treated cartridges for Carbonyls sampling Quartz filter (PM-10 high volume sampling) for Toxic metals sampling
15

Sodium Bicarbonate treated filters (PM-10 low volume sampling) for Hexavalent Chromium sampling.
4.6.1. Sampling Method TO-15:
VADEQ selected sampling method TO-15 to collect ambient air samples for VOC monitoring. This method is a standardized method for the determination of Volatile Organic Compounds (VOC) in the air. This method can be applied with a higher confidence to reduce the uncertainty in risk assessments in environments. The sample is collected in specially-treated stainless steel (Summa) or Silica lined (Silco) canisters and analyzed by Gas Chromatography Mass Spectrometry (GC/MS). Sample collection can be conducted in two sampling modes: passive and pressurized. VADEQ adopted the pressurized sampling mode, which requires an additional pump to provide positive pressure to the sample canister.
4.6.2. Sampling Method TO-11A:
VADEQ selected sampling method TO-11A to collect ambient air samples for Carbonyl compounds (aldehydes and ketones) monitoring. This method is a standardized method for the determination of Formaldehyde in ambient air using adsorbent cartridge followed by High Performance Liquid Chromatography (HPLC). The atmosphere is sampled by introduction of time-weighted average (TWA) air samples into a commercially available dinitrophenylhydrazine (DNPH) impregnated silica gel cartridges.
4.6.3. Sampling Method IO-3
VADEQ selected sampling method IO-3 to collect ambient air samples for toxic metals sampling. This method is used for analyzing the elemental metal components in ambient air particulate matter collected on high volume PM-10 Quartz filter. The collected PM-10 sample is analyzed by Inductively Coupled Plasma / Mass Spectrometry (ICP/MS)
4.6.4. Hexavalent Chromium Sampling Method:
VADEQ has modified the California 39 and ERG sampling methods for Hexavalent Chromium sampling. For the project, a Rupprecht & Patershnick Partisol 2025 sampler was selected due to our vast experience with the instrument and its availability. We have converted the sampler from the form of a PM2.5 sampler to a Partisol-Plus PM-10 Sampler by removing the WINS impactor and installing a Pass Thru tube. Division of Consolidated Laboratory Services (DCLS) analyzed the elemental metal component in ambient air particulate matter collected on low volume PM-10’s 47mm Sodium Bicarbonate treated cellulose filter.
4.7. SAMPLING EQUIPMENT:
The specific equipment to be used in the Winchester special study project is as follows:
4.7.1. Particulate Matter Sampler - Toxic Metals (Method IO-3)
VADEQ used the high flow PM-10 Particulate Sampler to collect whole air samples for Air Toxic Metal sampling. The sampler is made by Wedding and Associates Inc. in Fort Collins, Colorado.
16

4.7.2. Air Canister Sampler - Volatile Organic Compounds (Method TO-15)
VADEQ used the RM ESI 910 PC Air Canister Sampler to collect whole air samples for VOC sampling. The sampler is made by RM Environmental System Inc., in Van Nuys, California.
4.7.3. Carbonyl Sampler - Aldehyde and Ketone Compounds (Method TO-11A)
VADEQ used the ATEC 8000 Carbonyl Sampler to collect whole air samples for Carbonyls sampling. The sampler is made by Atmospheric Technology Inc., in Calabasas, California.
4.7.4. Hexavalent Chromium Sampler
VADEQ has modified the R&P 2025 Particulate Sampler to collect whole air samples for Hexavalent Chromium sampling. The sampler is made by Rupprech & Patashrick Co. Inc. in Albany, New York. We have made some changes to the California method 39 in order to utilize our existing R&P 2025 particulate samplers. The R&P 2025 has been modified by replacing the 2.5 Wells impactor with a 2025 Pass Thru Adapter Tube (55-005052) thus allowing the collection of particles approximately 10 µm and smaller. The use of the modified R&P was due to cost savings, availability, and existing expertise with this type of sampler.
4.7.5. NovaLynx Portable Weather Station
VADEQ used the portable weather station, NovaLynx 110-WS-18, with temperature, barometric pressure, wind speed, and direction to collect meteorological data. The station includes a 6 foot tripod mast and weatherproof suitcase for the rechargeable battery operated data logger.
5.0. LABBORATORY ANALYSIS:
VADEQ selected the Division of Consolidated Laboratory Service (DCLS) to provide the analysis of the collected samples. The following are the selected analysis methods DCLS used to analyze the collected samples for the project:
VOC analysis: EPA Method TO 15
Carbonyl analysis: EPA Method TO 11A
Metal analysis: Combination of EPA Method IO 3.1 and IO-3.5
Hexavalent Chromium: California Method 39
In order to achieve optimal results, DCLS changed some procedures from the published methods. The deviations from the methods are listed in the Standard Operation Procedures (SOPs) for Laboratory Analyses.
17

6.0. DATA ASSESSMENT:
6.1. Particulate Matter PM-10 Sampling:
PM-10 filter samples collected at the three sampling sites were weighed to determine gravimetric concentrations. PM-10 is particulate matter with an aerodynamic diameter less than or equal to a nominal 10 micrometers. These particulates can penetrate the thoracic region of the human respiratory system. In addition to health effects, it can impair atmospheric visibility, has an effect on climate, and contributes to acidic dry deposition. PM-10 sampling results can be used to evaluate the overall air quality in the area.
In order to comply with the national Ambient Air Quality Standards, PM-10 concentrations must be less than the following limits:
Annual Arithmetic Mean1: 50 µg/m3
24-hour concentration2: 150 µg/m3
1: Based on 3-year average of annual averages2: Based on 3-year average of annual 98th percentile values
PM-10 samples were collected from February 9, 2005 through February 28, 2006, at all three sites and weighed by AQM for gravimetric concentrations. Results of the collected samples for 65 sampling dates were submitted to the EPA database, Air Quality System (AQS), and evaluated.
** (Detailed concentration reports will be available upon request).
The following is a summary statistical analysis of PM-10 data of filter samples collected at the three sampling sites in Winchester City and Frederick County:
PM-10 gravimetric concentration (µg/m3)
GE South (Upwind)
Courthouse(Central)
Courthouse - Collocated
Clearbrook(Downwind)
Minimum 3.05 3.17 3.36 2.67
Maximum 38.70 38.25 41.43 87.03
Median 16.80 18.77 19.21 25.37
Average 18.65 19.08 20.40 30.77
Standard Deviation
8.25 8.02 8.56 17.99
The above results show that the Winchester PM-10 gravimetric concentration data is lower than the allowable annual standards for PM-10 concentration. PM-10 measured at the upwind site and central site, GE Property and Courthouse respectively, has a similar statistical distribution. The Clearbrook site (downwind from Winchester) has an elevated average concentration when compared with the other two sites. The higher than normal average concentration at this location was primarily due to the operation of a nearby quarry. As a result, PM-10 sampling is continuing at this location, as
18

requested by the Virginia Valley Regional Office, to obtain a three year average of the annual average concentration.
EXAMPLE OF FOUR HIGH PM10 CONCENTRATION DAYS
0.010.020.030.040.050.060.070.080.090.0
100.0
GE CB CH GE CB CH GE CB CH GE CB CH
5/10/05 6/9/05 8/14/05 8/26/05
μg/m
3
GE (General Electric), CB (Clearbrook), CH (Courthouse)
In order to determine the possible source of PM-10, we used meteorological data in the evaluation of samples collected on August 26, 2005, and September 13, 2005. PM-10 concentrations measured at Clearbrook (North) were higher than the other two sites and the wind direction was primarily from a southerly direction (e.g. GE to Winchester City).
GE(South)
Courthouse(Central)
Clearbrook(North) Wind direction
August 26, 2005 24.76 µg/m3 13.17 µg/ m3 81.65 mg/ m3Southeast / Southwest
September 13, 2005 21.40 µg/ m3 23.72 µg/ m3 50.80 µg/ m3Southeast / Southwest
The above observations indicate that PM-10 particulate matter in Winchester was influenced by local sources.
Comparisons were also conducted between the Winchester data and PM-10 data collected in 2005, from various PM10 sites in the Virginia network. Results indicate that PM-10 data collected at the GE (South) and the Courthouse (Central) sites were comparable to other sites in Virginia, while the Clearbrook site had higher average concentrations (due to local industrial activities).
19

GE
Courthouse
Clearbrook
Carroll
Culpepper
Fair Fax
Frederick
King W
illiam
Rockingham
Warren
Charlottesville
Norfolk
Max 39 38 87 35 41 48 38 49 42 42 39 47
Aver. 18.6 19.1 30.8 17.2 18.7 19.4 18.9 22.5 20.8 18.5 21.5 19.5
6.2. Metals Sampling:
DCLS analyzed the collected PM-10 samples for the following metals: Arsenic (As), Beryllium (Be), Cadmium (Cd), total Chromium (Cr), Manganese (Mn), Nickel (Ni), and Lead (Pb). These target metals are a combination of individual metals and metal compounds. They may build up in biological systems and become a significant health hazard. These metals can have a variety of effects on biological systems including, organ failure, behavioral changes, abnormal neurological and physiological development and decreased birth rate.
The following is the statistical report for the project’s metals sampling:
Winchester Special project - Metals Statistical Analysis Report
GE (South) Results (ng/ m3) no blank filter correction Results with blank
correction
Be Cr Mn Ni As Cd Pb Cr Ni
Minimum 0.00 2.21 0.66 0.85 0.15 0.00 1.01 0.06 0.06
Maximum 0.28 17.24 7.70 8.72 2.37 0.58 39.71 14.86 7.91Median 0.02 2.97 3.13 1.41 0.87 0.14 4.55 0.60 0.61Average 0.05 3.35 3.18 1.73 0.88 0.17 7.12 1.02 0.92
Standard Deviation 0.09 1.87 1.54 1.09 0.45 0.12 7.51 1.90 1.09
20

Courthouse (Central)
Results (ng/ m3) no blank filter correction Results with blank correction
Be Cr Mn Ni As Cd Pb Cr Ni
Minimum 0.00 2.09 1.22 0.98 0.05 0.00 1.11 0.00 0.18
Maximum 0.28 32.97 8.63 17.10 2.78 4.15 24.57 30.58 16.29Median 0.03 3.10 4.05 1.63 0.89 0.14 3.87 0.76 0.86Average 0.04 3.67 4.20 2.11 0.91 0.21 5.24 1.41 1.46
Standard Deviation 0.06 3.83 1.79 2.11 0.48 0.52 5.02 3.80 2.27
Clearbrook (North)
Results (ng/ m3) no blank filter correction Results with blank correction
Be Cr Mn Ni As Cd Pb Cr Ni
Minimum 0.00 2.46 0.63 0.75 0.08 0.01 0.83 0.09 0.35Maximum 0.33 5.36 12.06 8.26 6.01 0.69 10.71 3.00 7.47Median 0.03 3.09 4.31 2.20 0.91 0.15 3.54 0.73 1.41Average 0.04 3.30 4.94 2.55 1.17 0.18 3.92 0.93 1.77
Standard Deviation 0.07 0.69 2.48 1.26 1.03 0.13 1.98 0.69 1.25
** (Detailed concentration reports will be available upon request).
Chromium and Nickel analyses have shown significant concentrations measured in the project blank samples while the others were neglectable. Therefore, the above blank data for Cr and Ni should be considered when performing risk evaluations.
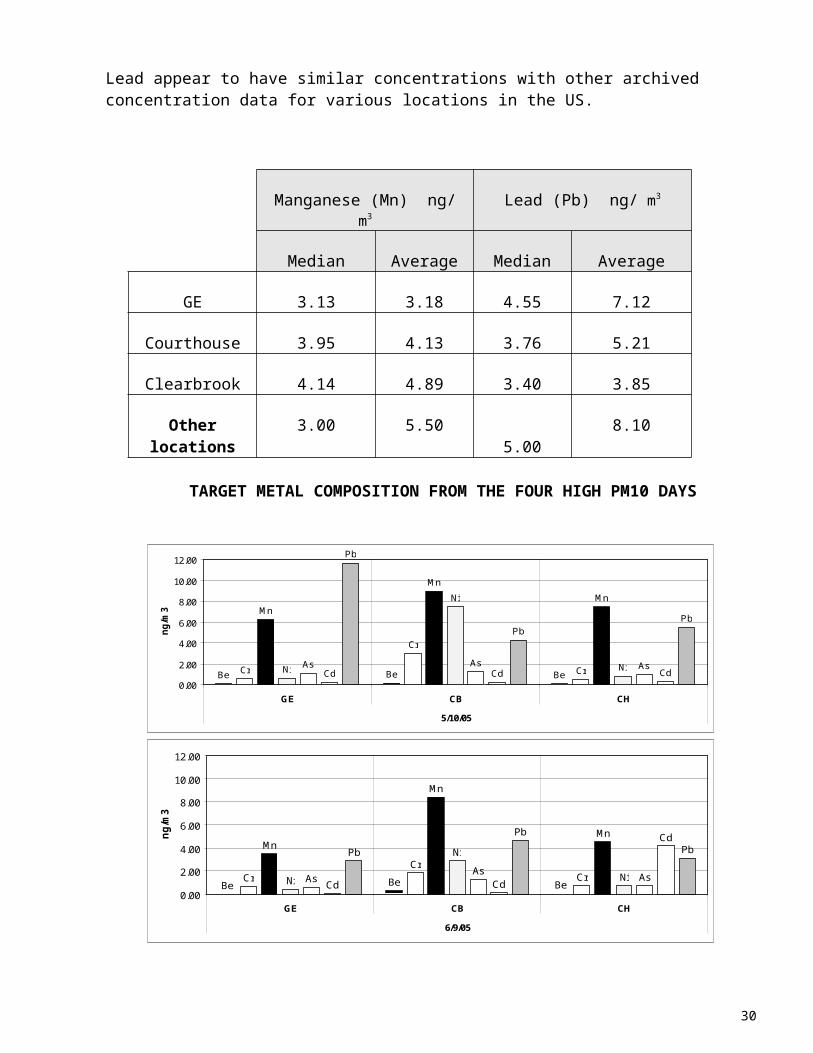
From the above table, Manganese and Lead consistently had the largest contributions to the overall metal composition of the particulates collected. The other five metals varied in concentration from site to site and from one sampling date to another. One major source of Manganese is combustion of fuel additives, thus the high portion of Manganese could be the result of heavy traffic from I-81. Historically, a common source of Lead is found in paint. Lead based paints were used because of its characteristic to resist corrosion. It is not uncommon to find this type of paint in industrial and old housing areas. Smelters are another source of Lead that is used to recover the metal from batteries, radiator repair shops, and firing ranges. Manganese and Lead appear to have similar concentrations with other archived concentration data for various locations in the US.
Manganese (Mn) ng/ m3 Lead (Pb) ng/ m3
Median Average Median Average
GE 3.13 3.18 4.55 7.12
Courthouse 3.95 4.13 3.76 5.21
21
Clearbrook 4.14 4.89 3.40 3.85
Other locations 3.00 5.50 5.00 8.10
TARGET METAL COMPOSITION FROM THE FOUR HIGH PM10 DAYS
Be Be BeCr
Cr
Cr
Mn
Mn
Mn
Ni
Ni
NiAs As AsCd Cd Cd
Pb
PbPb
0.00
2.00
4.00
6.00
8.00
10.00
12.00
GE CB CH
5/10/05
ng/m
3
Be Be BeCr
CrCr
Mn
Mn
Mn
Ni
Ni
NiAsAs As
Cd Cd
CdPb
Pb
Pb
0.00
2.00
4.00
6.00
8.00
10.00
12.00
GE CB CH
6/9/05
ng/m
3
Cr Cr Cr
Mn Mn Mn
Ni Ni NiAs As AsCd Cd
Pb
Pb
Pb
0.00
2.00
4.00
6.00
8.00
10.00
12.00
GE CB CH
8/14/05
ng/m
3
22

CrCr
Cr
Mn
Mn
Mn
Ni
Ni
NiAs As As
Cd Cd
Pb Pb
Pb
0.00
2.00
4.00
6.00
8.00
10.00
12.00
GE CB CH
8/26/05
ng/m
3
Total Target Metals Contributionto PM10
General Electric 5/10/2005 Cr 0.0022%
As 0.0044%
Cd 0.0008%
Pb 0.0480%PM10 99.92%
Be 0.0003%
Mn 0.0256%
Ni 0.0025%
Total Target Metals Contributionto PM10
Clearbrook 5/10/2005
Cr 0.0041%
As 0.0016%
Pb 0.0058%
Cd 0.0003%
PM10 99.97%
Be 0.0001%
Mn 0.0122%
Ni 0.0102%
23

Total Target Metals Contributionto PM10
Court House 5/10/2005
Cr 0.0019%
As 0.0037%
Cd 0.0011%
Pb 0.0212%
Ni 0.0032%
Mn 0.0285%
Be 0.0003%
PM10 99.94%
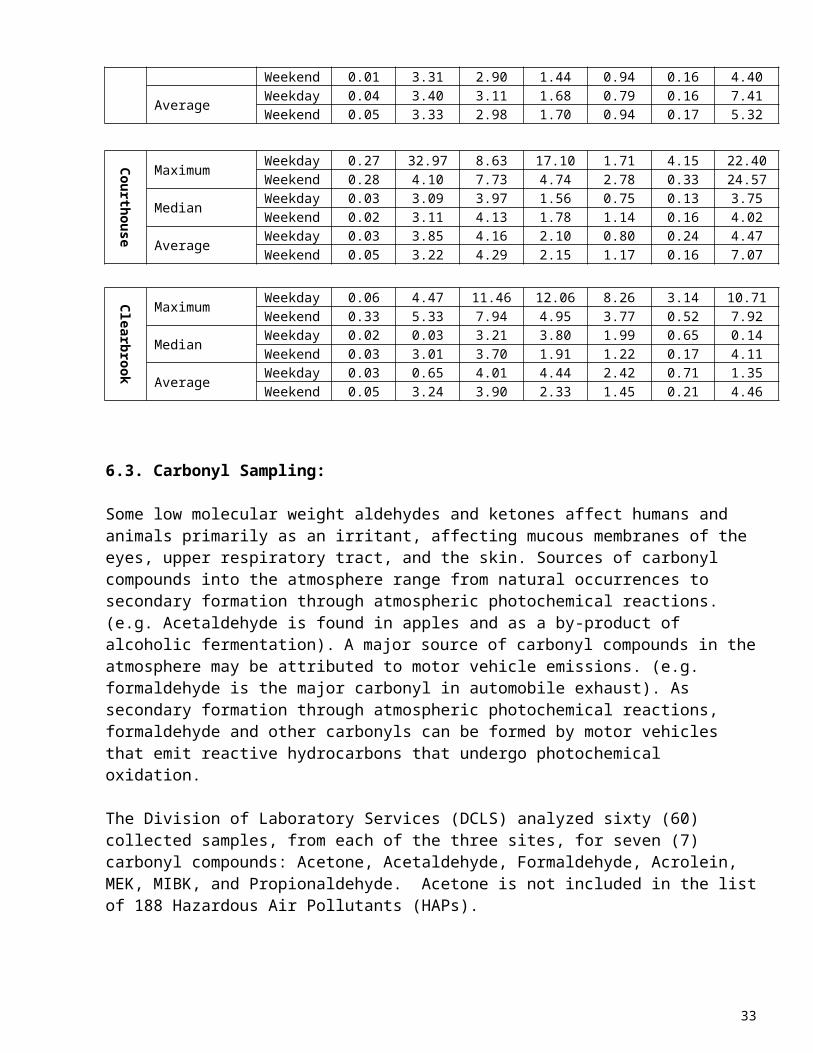
The following table illustrated the comparison of metals measured during the week to evaluate the affect of traffic patterns and city activities. The average concentration of the detected metals during the weekdays was not higher than those during the weekend. The comparison suggested that traffic and daily activities are not the major factors for the target metals emission in the area.
Be Cr Mn Ni As Cd Pb
GE
Maximum Weekday 0.28 17.24 7.68 8.72 1.88 0.45 39.71Weekend 0.27 6.41 7.70 3.83 2.37 0.58 22.43
Median Weekday 0.02 2.98 3.10 1.40 0.69 0.13 4.01Weekend 0.01 3.31 2.90 1.44 0.94 0.16 4.40
Average Weekday 0.04 3.40 3.11 1.68 0.79 0.16 7.41Weekend 0.05 3.33 2.98 1.70 0.94 0.17 5.32
Courthouse
Maximum Weekday 0.27 32.97 8.63 17.10 1.71 4.15 22.40Weekend 0.28 4.10 7.73 4.74 2.78 0.33 24.57
Median Weekday 0.03 3.09 3.97 1.56 0.75 0.13 3.75Weekend 0.02 3.11 4.13 1.78 1.14 0.16 4.02
Average Weekday 0.03 3.85 4.16 2.10 0.80 0.24 4.47Weekend 0.05 3.22 4.29 2.15 1.17 0.16 7.07
Clearbrook
Maximum Weekday 0.06 4.47 11.46 12.06 8.26 3.14 10.71Weekend 0.33 5.33 7.94 4.95 3.77 0.52 7.92
Median Weekday 0.02 0.03 3.21 3.80 1.99 0.65 0.14Weekend 0.03 3.01 3.70 1.91 1.22 0.17 4.11
Average Weekday 0.03 0.65 4.01 4.44 2.42 0.71 1.35Weekend 0.05 3.24 3.90 2.33 1.45 0.21 4.46
6.3. Carbonyl Sampling:
Some low molecular weight aldehydes and ketones affect humans and animals primarily as an 24

irritant, affecting mucous membranes of the eyes, upper respiratory tract, and the skin. Sources of carbonyl compounds into the atmosphere range from natural occurrences to secondary formation through atmospheric photochemical reactions. (e.g. Acetaldehyde is found in apples and as a by-product of alcoholic fermentation). A major source of carbonyl compounds in the atmosphere may be attributed to motor vehicle emissions. (e.g. formaldehyde is the major carbonyl in automobile exhaust). As secondary formation through atmospheric photochemical reactions, formaldehyde and other carbonyls can be formed by motor vehicles that emit reactive hydrocarbons that undergo photochemical oxidation.
The Division of Laboratory Services (DCLS) analyzed sixty (60) collected samples, from each of the three sites, for seven (7) carbonyl compounds: Acetone, Acetaldehyde, Formaldehyde, Acrolein, MEK, MIBK, and Propionaldehyde. Acetone is not included in the list of 188 Hazardous Air Pollutants (HAPs).
** (Detailed concentration reports will be available upon request).
Beside Acrolein and Methyl Isobutyl Ketone (MIBK), DCLS found five other target pollutants almost in every sample. Acrolein was not found in all samples since its level of concentration was lower than the Method Detection Limit (MDL). MIBK was occasionally found in the collected samples.
The following tables compare the average concentrations of the five abundant Carbonyl compounds found in Winchester with three existing Urban Air Toxic sampling sites in Virginia.
Winchester Special Project - Carbonyl Compounds Statistical Analysis Report
Acetaldehyde Acetone Propionaldehyde75-07-0 67-64-1 123-38-6
VN VP VS VN VP VS VN VP VS# sample 60 60 60 60 60 60 60 60 60# Detection 60 60 60 60 60 60 56 58 56Minimum 0.29 0.59 0.43 0.47 0.46 0.88 0.07 0.11 0.09Maximum 1.94 2.27 1.79 3.45 7.60 3.47 0.77 0.55 0.60Median 1.05 1.40 1.03 1.77 1.98 1.75 0.20 0.27 0.21Average 1.06 1.37 1.06 1.83 2.18 1.91 0.22 0.27 0.22Standard Deviation 0.35 0.39 0.32 0.77 1.11 0.71 0.11 0.09 0.10
Formaldehyde MEK MIBK
50-00-0 78-93-3 108-10-1VN VP VS VN VP VS VN VP VS
# sample 60 60 60 60 60 60 60 60 60# Detection 60 60 60 49 48 54 1 8 0Minimum 0.14 0.63 0.55 0.13 0.15 0.12 0.09 0.04 0.00Maximum 7.45 8.61 7.21 0.67 1.81 0.50 0.09 0.20 0.00Median 1.89 2.66 1.95 0.28 0.35 0.29 0.09 0.11 Average 2.36 3.08 2.49 0.31 0.41 0.30 0.09 0.11 Standard Deviation 1.56 1.72 1.49 0.11 0.27 0.11 0.05
25

Winchester Project Other Locations in VA - 2005
CASS# Target Compound South Central North Fairfax Richmond VA Beach
50-00-0 Formaldehyde 2.36 3.08 2.49 2.85 2.84 2.68
75-07-0 Acetaldehyde 1.06 1.37 1.06 1.08 1.08 0.73
123-38-6 Propionaldehyde 0.22 0.27 0.22 0.24 0.27 0.16
67-64-1 Acetone 1.83 2.18 1.91 1.41 1.58 0.70
78-93-3 Methyl Ethyl Ketone (MEK) 0.31 0.41 0.30 0.26 0.27 0.16
Lee Park (Fairfax) Math & Science (Richmond) (NOAA) Norfolk
CASS# Target Compound 2002 2003 2004 2002 2003 2004 2002 2003 2004
50-00-0 Formaldehyde 2.18 2.24 2.49 2.96 2.15 2.62 5.33 1.94 2.16
75-07-0 Acetaldehyde 0.75 0.90 0.83 0.83 0.88 0.91 1.13 0.84 0.76
123-38-6 Propionaldehyde 0.03 0.25 0.25 0.03 0.13 0.24 0.10 0.23 0.26
67-64-1 Acetone 1.03 1.81 1.40 1.33 1.93 1.52 0.93 1.60 1.10
78-93-3 Methyl Ethyl Ketone (MEK) 0.18 0.29 0.22 0.22 0.29 0.25 0.23 0.26 0.21
These Winchester carbonyl compounds, Formaldehyde, Acetaldehyde, Acetone, Methyl Ethyl Ketone, and Propionaldehyde, have similar concentration levels with those measured at Lee District Park (Fairfax County), Math & Science Center (Richmond City), NOAA site (Norfolk), and the Tidewater Regional Office (Virginia Beach).
Formaldehyde
0.00
0.50
1.00
1.502.00
2.50
3.00
3.50
Winchester (South)
Winchester (Central)
Winchester (North)
Lee Park (Fairfax)
Math & Science (Richmond)
Vbeach
ppbV
26

Acetaldehyde
0.000.200.400.600.801.001.201.401.60
Winchester (South)
Winchester (Central)
Winchester (North)
Lee Park (Fairfax)
Math & Science (Richmond)
Vbeach
ppbV
The following table illustrates the comparison of target carbonyls measured during the week to evaluate the affect of traffic patterns and city activities. The average concentration of the detected carbonyls during the weekdays was similar to those during the weekend. The comparison suggested that traffic and daily activities are not the major factors for the target carbonyls emission in the area.
Acetaldehyde Acetone Formaldehyd
e MEK Propionaldehyde
GE Weekday 1.06 1.96 2.48 0.27 0.22
Weekend 1.06 1.80 2.52 0.24 0.18
Courthouse Weekday 1.36 2.22 3.08 0.36 0.26
Weekend 1.40 2.06 3.08 0.24 0.26
Clearbrook Weekday 1.09 1.90 2.40 0.28 0.22
Weekend 0.98 1.67 2.27 0.19 0.18
Unit of concentration: Part per billions of Volume (ppbV)
27

6.4. Volatile Organic Compounds Sampling:
There are 33 published Hazardous Air Pollutant (HAPs) in the list of the project’s 51 Target Volatile Organic Compounds (VOC). These HAPs are known or suspected to cause cancer or other serious health effects, such as reproductive effects or birth defects, or adverse environmental effects.
List of the target volatile HAPs
CASS# Target Compound CASS# Target Compound CASS# Target Compound
74-87-3 Chloromethane 107-06-2 1,2-Dichloroethane 127-18-4 Tetrachloroethene
75-01-4 Vinyl Chloride 71-55-6 1,1,1-trichloroethane 108-90-7 Chlorobenzene
106-99-0 1,3-Butadiene 71-43-2 Benzene 100-41-4 Ethylbenzene
74-83-9 Bromomethane 56-23-5 Carbon Tetrachloride 108-38-3 m&p-Xylene75-00-3 Ethyl Chloride 78-87-5 1,2-Dichloropropane 75-25-2 Bromoform
75-35-4 1,1-Dichloroethene 79-01-6 Trichloroethylene 100-42-5 Styrene
75-09-2 Methylene Chloride 542-75-6 cis-1,3-dichloropropene 79-34-5 1,1,2,2-Tetrachloroethane
75-34-3 1,1-Dichloroethane 542-75-6 t-1,3-dichloropropene 95-47-6 o-Xylene
1634-04-4 MTBE 79-00-5 1,1,2-Trichloroethane 106-46-7 1,4-Dichlorobenzene
100-54-3 Hexane 108-88-3 Toluene 120-82-1 1,2,4-Trichlorobenzene
69-66-3 Chloroform 106-93-4 1,2-Dibromoethane 87-68-3 Hexachloro-1,3-butadiene
DCLS used the EPA TO-15 method to analyze 53 collected canister samples at the GE Property site, the project’s upwind site. Only 23 target compounds, which had concentrations above the method Detection Limit (MDL), were detected from the collected samples. Among those compounds, there were 9 frequently detected pollutants (# Detection >=9). ** (Detailed concentration reports will be available upon request).
Unit of concentration: Part per billions of Volume (ppbV)
CASS# Target Compound # Detection Minimum Maximum Mean Median Standard Deviation
115-07-1 Propylene 4 0.40 2.31 1.08 0.80 0.8575-71-8 Dichlorodifluoromethane 49 0.27 0.80 0.52 0.51 0.1174-87-3 Chloromethane 52 0.32 0.79 0.57 0.57 0.10
76-14-21,2-dichloro-1,1,2,2-tetrafluoroethane 5 0.09 0.30 0.20 0.25 0.10
75-01-4 Vinyl Chloride 1 0.09 0.09 0.09 0.0975-00-3 Ethyl Chloride 9 0.09 0.56 0.24 0.15 0.1875-69-4 Trichlorofluoromethane 45 0.08 2.63 0.34 0.26 0.3675-09-2 Methylene Chloride 18 0.08 0.21 0.12 0.10 0.0576-13-1 1,1,2-trichloro-1,2,2-trifluoroethane 35 0.08 0.23 0.11 0.09 0.03100-54-3 Hexane 3 0.10 0.19 0.13 0.11 0.0571-55-6 1,1,1-trichloroethane 1 0.09 0.09 0.09 0.0971-43-2 Benzene 30 0.08 0.36 0.16 0.14 0.0656-23-5 Carbon Tetrachloride 22 0.08 0.61 0.13 0.10 0.11110-87-7 Cyclohexane 2 0.13 0.21 0.17 0.17 0.0678-87-5 1,2-Dichloropropane 1 0.41 0.41 0.41 0.4125-27-4 Bromodichloromethane 1 0.09 0.09 0.09 0.09
28

79-01-6 Trichloroethylene 1 0.09 0.09 0.09 0.09108-88-3 Toluene 40 0.08 1.68 0.24 0.16 0.26127-18-4 Tetrachloroethene 3 0.08 0.14 0.10 0.09 0.03108-38-3 m&p-Xylene 3 0.09 0.12 0.10 0.10 0.0295-63-6 1,2,4-Trimethylbenzene 1 0.08 0.08 0.08 0.0895-50-1 1,2-Dichlorobenzene 1 0.18 0.18 0.18 0.1887-68-3 Hexachloro-1,3-butadiene 3 0.08 0.28 0.15 0.09 0.11
DCLS used the EPA TO-15 method to analyze 75 collected canister samples at the Winchester Courthouse site, the project’s central site. Only 39 target compounds, which had concentrations above the method Detection Limit (MDL), were detected from the collected samples. Among those compounds, there were 13 frequently detected pollutants (# Detection >=9).
** (Detailed concentration reports will be available upon request).
CASS# Target Compound # Detection Minimum Maximum Mean Median Standard
Deviation
115-07-1 Propylene 3 0.29 0.62 0.48 0.54 0.1775-71-8 Dichlorodifluoromethane 71 0.26 0.94 0.55 0.54 0.1174-87-3 Chloromethane 73 0.30 0.97 0.57 0.53 0.14
76-14-21,2-dichloro-1,1,2,2-tetrafluoroethane 4 0.09 0.12 0.11 0.11 0.02
75-01-4 Vinyl Chloride 2 0.09 0.09 0.09 0.09 0.0075-00-3 Ethyl Chloride 21 0.11 2.42 0.69 0.41 0.6975-69-4 Trichlorofluoromethane 65 0.15 1.53 0.39 0.29 0.2775-09-2 Methylene Chloride 43 0.08 0.22 0.12 0.10 0.04
76-13-11,1,2-trichloro-1,2,2-trifluoroethane 44 0.07 0.24 0.11 0.09 0.04
75-34-3 1,1-Dichloroethane 2 0.09 0.09 0.09 0.09 0.001634-04-4 MTBE 2 0.15 0.84 0.50 0.50 0.49100-54-3 Hexane 8 0.08 0.25 0.15 0.16 0.06141-78-6 Ethyl Acetate 2 0.21 6.31 3.26 3.26 4.3171-55-6 1,1,1-trichloroethane 1 0.08 0.08 0.08 0.0871-43-2 Benzene 54 0.10 0.48 0.23 0.21 0.1056-23-5 Carbon Tetrachloride 29 0.08 0.19 0.11 0.10 0.03110-87-7 Cyclohexane 1 0.12 0.12 0.12 0.1278-87-5 1,2-Dichloropropane 2 0.47 1.58 1.03 1.03 0.7879-01-6 Trichloroethylene 2 0.02 0.23 0.13 0.13 0.15142-82-5 Heptane 5 0.06 0.12 0.09 0.09 0.02542-75-6 cis-1,3-dichloropropene 1 0.10 0.10 0.10 0.10542-75-6 trans-1,3-dichloropropene 1 0.19 0.19 0.19 0.199-00-5 1,1,2-Trichloroethane 2 0.09 0.09 0.09 0.09 0.00
108-88-3 Toluene 73 0.09 2.90 0.49 0.35 0.46106-93-4 1,2-Dibromoethane 1 0.32 0.32 0.32 0.32127-18-4 Tetrachloroethene 3 0.07 0.10 0.09 0.10 0.02100-41-4 Ethylbenzene 14 0.06 0.17 0.11 0.11 0.03108-38-3 m&p-Xylene 21 0.08 0.53 0.20 0.14 0.13100-42-5 Styrene 2 0.08 0.18 0.13 0.13 0.0779-34-5 1,1,2,2-Tetrachloroethane 3 0.08 0.08 0.08 0.08 0.0095-47-6 o-Xylene 14 0.03 0.18 0.11 0.11 0.04622-96-8 1-Ethyl-4-methylbenzene 2 0.10 0.25 0.18 0.18 0.11108-67-8 1,3,5-Trimethylbenzene 2 0.04 0.10 0.07 0.07 0.0495-63-6 1,2,4-Trimethylbenzene 23 0.07 0.52 0.18 0.16 0.09
29
541-73-1 1,3-Dichlorobenzene 2 0.09 0.64 0.37 0.37 0.39106-46-7 1,4-Dichlorobenzene 2 0.12 0.62 0.37 0.37 0.3595-50-1 1,2-Dichlorobenzene 2 0.11 0.31 0.21 0.21 0.14120-82-1 1,2,4-Trichlorobenzene 2 0.27 0.36 0.32 0.32 0.0687-68-3 Hexachloro-1,3-butadiene 3 0.09 0.38 0.21 0.16 0.15
DCLS used the EPA TO-15 method to analyze 59 collected canister samples at the Clearbrook Fire station site (the project’s downwind site). Only 25 target compounds, which had concentrations above the method Detection Limit (MDL), were detected from the collected samples. Among those compounds, there were 10 frequently detected pollutants (# Detection >=9).
** (Detailed concentration reports will be available upon request).
CASS# Target Compound # Detection Minimum Maximum Mean Median Standard Deviation
115-07-1 Propylene 3 0.27 0.44 0.38 0.44 0.1075-71-8 Dichlorodifluoromethane 59 0.30 0.91 0.52 0.51 0.1074-87-3 Chloromethane 59 0.32 0.89 0.54 0.53 0.1175-00-3 Ethyl Chloride 23 0.10 1.28 0.55 0.53 0.3475-69-4 Trichlorofluoromethane 54 0.17 1.86 0.31 0.27 0.2275-09-2 Methylene Chloride 24 0.08 0.20 0.11 0.10 0.0476-13-1 1,1,2-trichloro-1,2,2-trifluoroethane 37 0.07 0.17 0.10 0.10 0.02
1634-04-4 MTBE 1 0.12 0.12 0.12 0.12100-54-3 Hexane 1 0.15 0.15 0.15 0.1569-66-3 Chloroform 1 0.14 0.14 0.14 0.14141-78-6 Ethyl Acetate 15 0.52 30.03 7.21 4.77 8.2171-55-6 1,1,1-trichloroethane 1 0.09 0.09 0.09 0.0971-43-2 Benzene 31 0.08 0.37 0.19 0.18 0.0756-23-5 Carbon Tetrachloride 23 0.08 0.16 0.10 0.09 0.02110-87-7 Cyclohexane 1 0.09 0.09 0.09 0.0978-87-5 1,2-Dichloropropane 4 0.16 0.33 0.24 0.24 0.08142-82-5 Heptane 1 0.12 0.12 0.12 0.12108-88-3 Toluene 58 0.09 11.02 1.45 0.85 2.09127-18-4 Tetrachloroethene 3 0.09 0.10 0.09 0.09 0.01100-41-4 Ethylbenzene 1 0.09 0.09 0.09 0.09108-38-3 m&p-Xylene 3 0.08 0.09 0.09 0.09 0.0195-47-6 o-Xylene 2 0.09 0.10 0.10 0.10 0.01108-67-8 1,3,5-Trimethylbenzene 1 0.07 0.07 0.07 0.0795-63-6 1,2,4-Trimethylbenzene 4 0.09 0.16 0.12 0.11 0.0387-68-3 Hexachloro-1,3-butadiene 1 0.08 0.08 0.08 0.08
The following tables illustrate the comparison of target Volatile Organic Compounds (VOC) measured at the three sites during the week to evaluate the affect of traffic patterns and city activities.
30

Comparison at the GE property site:
Beside Propylene, the average concentrations of the detected VOC during the weekdays at the GE property site (upwind station) were similar to those during the weekend. Propylene is not listed as HAP and is introduced into the atmosphere from natural and man-made sources, including emissions from vegetation, burning of organic material, and incomplete combustion of fossil fuels. This comparison suggested that highway traffic and daily activities are not the major factors for the target VOC emission in the Southside of Winchester.
Weekdays vs. Weekend at GE site (Unit of concentration: ppbV)
CASS# Target CompoundMaximum Mean Median
Weekday Weekend Weekday Weekend Weekday Weekend
115-07-1 Propylene 0.91 2.31 0.66 1.50 0.66 1.5075-71-8 Dichlorodifluoromethane 0.80 0.65 0.54 0.48 0.51 0.4974-87-3 Chloromethane 0.79 0.76 0.57 0.56 0.56 0.57
76-14-21,2-dichloro-1,1,2,2-tetrafluoroethane 0.30 0.25 0.19 0.25 0.19 0.25
75-01-4 Vinyl Chloride 0.09 0.09 0.09 75-00-3 Ethyl Chloride 0.56 0.53 0.22 0.28 0.15 0.1875-69-4 Trichlorofluoromethane 2.63 0.36 0.36 0.27 0.27 0.2575-09-2 Methylene Chloride 0.21 0.18 0.13 0.12 0.10 0.1076-13-1 1,1,2-trichloro-1,2,2-trifluoroethane 0.23 0.15 0.11 0.10 0.09 0.10100-54-3 Hexane 0.19 0.13 0.11 71-55-6 1,1,1-trichloroethane 0.09 0.09 0.09 71-43-2 Benzene 0.36 0.22 0.16 0.15 0.13 0.1556-23-5 Carbon Tetrachloride 0.61 0.14 0.13 0.13 0.10 0.13110-87-7 Cyclohexane 0.21 0.17 0.17 78-87-5 1,2-Dichloropropane 0.41 0.41 0.41 25-27-4 Bromodichloromethane 0.09 0.09 0.0979-01-6 Trichloroethylene 0.09 0.09 0.09 108-88-3 Toluene 1.68 0.25 0.27 0.15 0.17 0.16127-18-4 Tetrachloroethene 0.09 0.14 0.09 0.14 0.09 0.14108-38-3 m&p-Xylene 0.12 0.10 0.10 95-63-6 1,2,4-Trimethylbenzene 0.08 0.08 0.08 95-50-1 1,2-Dichlorobenzene 0.18 0.18 0.18 87-68-3 Hexachloro-1,3-butadiene 0.28 0.15 0.09
Comparison at the Courthouse site:
There were 12 target compounds that were not detected during the weekend despite being found during weekdays. Among these compounds, Ethyl Acetate had elevated average concentrations. Ethyl Acetate was not included in the list of 188 HAPs and was only detected twice during the sampling period. It is used as a solvent in adjuvant for resinous, polymeric coatings glues, nail polish removers, confectionery, perfumes, and fruits. Beside that, the average concentration of the other detected VOC during the weekdays at the Winchester Courthouse site (central station) was similar to those during the weekend.
31

Weekdays vs. Weekend at Courthouse site (Unit of concentration: ppbV)
CASS# Target CompoundMaximum Mean Median
Weekday Weekend Weekday Weekend Weekday Weekend
115-07-1 Propylene 0.62 0.54 0.46 0.54 0.46 0.54
75-71-8 Dichlorodifluoromethane 0.94 0.75 0.56 0.54 0.54 0.55
74-87-3 Chloromethane 0.97 0.89 0.56 0.58 0.53 0.54
76-14-21,2-dichloro-1,1,2,2-tetrafluoroethane 0.12 0.11 0.11
75-01-4 Vinyl Chloride 0.09 0.09 0.09
75-00-3 Ethyl Chloride 2.42 1.96 0.74 0.60 0.44 0.41
75-69-4 Trichlorofluoromethane 1.53 1.35 0.38 0.42 0.30 0.29
75-09-2 Methylene Chloride 0.22 0.18 0.12 0.10 0.10 0.09
76-13-11,1,2-trichloro-1,2,2-trifluoroethane 0.24 0.13 0.11 0.09 0.09 0.09
75-34-3 1,1-Dichloroethane 0.09 0.09 0.09
1634-04-4 MTBE 0.84 0.50 0.50
100-54-3 Hexane 0.25 0.20 0.15 0.17 0.14 0.17
141-78-6 Ethyl Acetate 6.31 3.26 3.26
71-55-6 1,1,1-trichloroethane 0.08 0.08 0.08
71-43-2 Benzene 0.47 0.48 0.22 0.25 0.19 0.23
56-23-5 Carbon Tetrachloride 0.19 0.12 0.11 0.10 0.10 0.10
110-87-7 Cyclohexane 0.12 0.12 0.12
78-87-5 1,2-Dichloropropane 1.58 1.03 1.03
79-01-6 Trichloroethylene 0.02 0.23 0.02 0.23 0.02 0.23
142-82-5 Heptane 0.12 0.10 0.09 0.09 0.09 0.09
542-75-6 cis-1,3-dichloropropene 0.10 0.10 0.10
542-75-6 trans-1,3-dichloropropene 0.19 0.19 0.19
79-00-5 1,1,2-Trichloroethane 0.09 0.09 0.09
108-88-3 Toluene 2.90 2.00 0.52 0.42 0.38 0.29
106-93-4 1,2-Dibromoethane 0.32 0.32 0.32
127-18-4 Tetrachloroethene 0.10 0.09 0.10
100-41-4 Ethylbenzene 0.17 0.11 0.11 0.09 0.11 0.09
108-38-3 m&p-Xylene 0.53 0.15 0.25 0.11 0.23 0.11
100-42-5 Styrene 0.08 0.18 0.08 0.18 0.08 0.18
79-34-5 1,1,2,2-Tetrachloroethane 0.08 0.08 0.08
95-47-6 o-Xylene 0.18 0.13 0.11 0.08 0.11 0.07
622-96-8 1-Ethyl-4-methylbenzene 0.25 0.10 0.25 0.10 0.25 0.10
108-67-8 1,3,5-Trimethylbenzene 0.10 0.04 0.10 0.04 0.10 0.04
95-63-6 1,2,4-Trimethylbenzene 0.52 0.30 0.19 0.15 0.16 0.11
541-73-1 1,3-Dichlorobenzene 0.09 0.64 0.09 0.64 0.09 0.64
106-46-7 1,4-Dichlorobenzene 0.12 0.62 0.12 0.62 0.12 0.62
32
95-50-1 1,2-Dichlorobenzene 0.11 0.31 0.11 0.31 0.11 0.31
120-82-1 1,2,4-Trichlorobenzene 0.36 0.32 0.32
87-68-3 Hexachloro-1,3-butadiene 0.38 0.16 0.24 0.16 0.24 0.16
Comparison at the Clearbrook site:
Besides m&p- Xylene that was detected during the weekend, there were 10 target compounds that were detected during the weekdays. Among the commonly detected compounds, Ethyl Acetate had elevated average concentrations during the weekdays. This compound was not found in every sample during the sampling period. Elevated average concentration of this compound during the weekdays could be caused by fruit ripeness and fruit processing activities in the Winchester area.
The average concentration of the other detected VOC during the weekdays at the Clearbrook property site (downwind station), was slightly higher than those during the weekend (e.g. Toluene). Moreover, the detection of 10 additional compounds during weekdays suggested that I-81 traffic, transport, and some agricultural activities affected the toxic distribution in the Clearbrook and the surrounding areas.
Weekdays vs. Weekend at Clearbrook site (Unit of concentration: ppbV)
CASS# Target CompoundMaximum Mean Median
Weekday Weekend Weekday Weekend Weekday Weekend
115-07-1 Propylene 0.27 0.44 0.27 0.44 0.27 0.4475-71-8 Dichlorodifluoromethane 0.91 0.67 0.52 0.52 0.51 0.5374-87-3 Chloromethane 0.89 0.62 0.55 0.53 0.54 0.5375-00-3 Ethyl Chloride 1.14 1.28 0.53 0.59 0.53 0.5375-69-4 Trichlorofluoromethane 1.86 0.35 0.32 0.28 0.27 0.2875-09-2 Methylene Chloride 0.20 0.17 0.12 0.11 0.10 0.10
76-13-1 1,1,2-trichloro-1,2,2-trifluoroethane 0.17 0.15 0.10 0.11 0.10 0.10
1634-04-4 MTBE 0.12 0.12 0.12 100-54-3 Hexane 0.15 0.15 0.15 69-66-3 Chloroform 0.14 0.14 0.14 141-78-6 Ethyl Acetate 30.03 0.94 8.18 0.92 5.46 0.9271-55-6 1,1,1-trichloroethane 0.09 0.09 0.09 71-43-2 Benzene 0.30 0.37 0.18 0.22 0.18 0.1856-23-5 Carbon Tetrachloride 0.16 0.13 0.10 0.10 0.09 0.10110-87-7 Cyclohexane 0.09 0.09 0.09 78-87-5 1,2-Dichloropropane 0.33 0.24 0.24 142-82-5 Heptane 0.12 0.12 0.12 108-88-3 Toluene 11.02 2.03 1.68 0.79 0.83 0.86127-18-4 Tetrachloroethene 0.10 0.09 0.10 0.09 0.10 0.09100-41-4 Ethylbenzene 0.09 0.09 0.09 108-38-3 m&p-Xylene 0.09 0.09 0.0995-47-6 o-Xylene 0.10 0.10 0.10 108-67-8 1,3,5-Trimethylbenzene 0.07 0.07 0.07 95-63-6 1,2,4-Trimethylbenzene 0.11 0.16 0.10 0.16 0.10 0.1687-68-3 Hexachloro-1,3-butadiene 0.08 0.08 0.08
33

Comparison with data collected at other locations:
The following table includes annual average concentrations of VOC, which were detected at the three Ambient Air Toxics Sampling sites in Virginia. These sampling sites were located at Lee District Park (Franconia - Fairfax County), Math & Science Center (Richmond City), and the NOAA facility (Norfolk City).
(Unit of concentration: ppbV)
Lee Park (Fairfax) Math & Science (Richmond) (NOAA) Norfolk
CASS# Target Compound 2002 2003 2004 2002 2003 2004 2002 2003 2004
75-71-8 Dichlorodifluoromethane 0.58 0.52 0.53 0.56 0.53 0.53 0.57 0.53 0.52
74-87-3 Chloromethane 0.62 0.53 0.51 0.60 0.53 0.52 0.63 0.53 0.51
75-00-3 Ethyl Chloride 0.01 0.01 0.00 0.01 0.00 0.00 0.00 0.01 0.00
75-69-4 Trichlorofluoromethane 0.29 0.25 0.25 0.28 0.26 0.25 0.27 0.25 0.25
75-09-2 Methylene Chloride 0.16 0.08 0.09 0.37 0.09 0.10 0.16 0.09 0.09
76-13-1 1,1,2-trichloro-1,2,2-trifluoroethane 0.09 0.08 0.08 0.08 0.08 0.08 0.08 0.08 0.08
71-55-6 1,1,1-trichloroethane 0.04 0.03 0.02 0.03 0.03 0.02 0.03 0.03 0.02
71-43-2 Benzene 0.23 0.24 0.20 0.25 0.28 0.25 0.27 0.25 0.22
56-23-5 Carbon Tetrachloride 0.09 0.08 0.09 0.08 0.08 0.08 0.08 0.08 0.08
78-87-5 1,2-Dichloropropane 0.01 0.00 0.00 0.00 0.00 0.00 0.00 0.00 0.00
108-88-3 Toluene 0.29 0.32 0.28 0.47 0.46 0.42 0.36 0.39 0.53
127-18-4 Tetrachloroethene 0.05 0.04 0.04 0.03 0.03 0.03 0.03 0.03 0.03
108-38-3 m&p-Xylene 0.14 0.12 0.12 0.14 0.15 0.17 0.19 0.18 0.20
95-63-6 1,2,4-Trimethylbenzene 0.04 0.05 0.05 0.05 0.08 0.08 0.07 0.10 0.10
87-68-3 Hexachloro-1,3-butadiene 0.00 0.01 0.00 0.00 0.01 0.00 0.00 0.01 0.00
The following table illustrates the comparison between average concentration of the detected VOC in Winchester and the annual average concentration of those detected at the three Ambient Air Toxics Sampling sites in Virginia in 2005. These sampling sites are located at Lee District Park (Franconia - Fairfax County), Math & Science Center (Richmond City), and Tidewater Regional Office (VA Beach).
34

Winchester Project Other Location in VA - 2005
CASS# Target Compound South Central North Fairfax Richmond VA Beach
75-71-8 Dichlorodifluoromethane 0.52 0.55 0.52 0.49 0.49 0.50
74-87-3 Chloromethane 0.57 0.57 0.54 0.49 0.49 0.50
75-00-3 Ethyl Chloride 0.24 0.69 0.55 0.01 0.01 0.00
75-69-4 Trichlorofluoromethane 0.34 0.39 0.31 0.23 0.24 0.23
75-09-2 Methylene Chloride 0.12 0.12 0.11 0.07 0.07 0.07
76-13-1 1,1,2-trichloro-1,2,2-trifluoroethane 0.11 0.11 0.10 0.08 0.08 0.08
71-55-6 1,1,1-trichloroethane 0.09 0.08 0.09 0.02 0.02 0.02
71-43-2 Benzene 0.16 0.23 0.19 0.21 0.24 0.22
56-23-5 Carbon Tetrachloride 0.13 0.11 0.10 0.08 0.07 0.07
78-87-5 1,2-Dichloropropane 0.41 1.03 0.24 0.00 0.02 0.00
108-88-3 Toluene 0.24 0.49 1.45 0.29 0.41 0.46
127-18-4 Tetrachloroethene 0.10 0.09 0.09 0.04 0.03 0.65
108-38-3 m&p-Xylene 0.10 0.20 0.09 0.12 0.15 0.19
95-63-6 1,2,4-Trimethylbenzene 0.08 0.18 0.12 0.05 0.07 0.08
87-68-3 Hexachloro-1,3-butadiene 0.15 0.21 0.08 0.00 0.00 0.00
(Unit of concentration: ppbV)
The comparisons show VOC measured at the three sampling sites in Winchester had similar distributions with those detected at other locations in Virginia with the exception of Ethyl Chloride and 1,2-Dicloropropane. 1,2-Dichloropropane was not frequently detected (# Detection <9) during the sampling period and Ethyl Chloride has not been classified as a carcinogen by EPA . The comparison implies that Winchester has the same VOC emission profiles with other cities such as Richmond, Norfolk, VA Beach and Franconia.
6.5. Hexavalent Chromium Sampling:
DCLS analyzed 50 filter samples collected at the Winchester Courthouse site by California Method 39. Hexavalent Chromium, or Chrome VI, is a manmade pollutant and produced by the chemical industry. Chrome VI is used for chrome plating, paints, inks, anti-corrosion coatings, textiles, copying machines toners, leather tanning, and wood preserving. Hexavalent Chromium could affect human skin as both sensitizer and irritant. It is considered a known carcinogen. Chronic inhalation of the compound increase risk of lung cancer. Tobacco use might increase one’s exposure to higher levels of chromium, since tobacco contains chromium.
35

The following is the statistical analysis results from the reported data for Chrome VI. The unit of concentration is nanogram per cubic meter (ng/ m3) (1 ng equals 1/1,000,000,000 of a gram).
# sample Minimum Maximum Median Average STD
50 0.000 0.471 0.042 0.061 0.078
** (Detailed concentration reports will be available upon request).
Average atmospheric concentrations of chromium from more than 2,100 monitoring stations ranged from 0.005 µg/ m3 to 0.525 µg/ m3 (ATSDR 2000). Also, a 1990 study reported an average concentration of Chrome VI ranging from less than 0.001 µg/ m3 to 3 µg/ m3 (ATSDR 2000). The average concentration of Chrome VI measured at the Courthouse sampling site is less than 0.001 µg/ m3.
7.0. DATA COMPARISON WITH 1999 NATA:
National-scale Air Toxic Assessment (NATA) is a US EPA project, which used the 1999 air toxics inventories and modeling approach to assess ambient air toxics, emission source types, and locations. The NATA 1999 includes 177 air pollutants (a subset of the air toxics on the Clean Air Act's list of 187 air toxics plus diesel particulate matter (diesel PM).
For the 1999 national-scale assessment, EPA provided a limited number of air toxics with estimated concentrations at the county level.
The following table is for the comparison of the monitored data with values of pollutants reported in the NATA 1999 for Winchester City and Frederick County. With the exception of Acetaldehyde, Formaldehyde, Chrome VI, Carbon Tetrachloride, and Toluene measured in Clearbrook, concentrations are comparable with those estimated by NATA 1999. NATA 1999 underestimated Acetaldehyde, Formaldehyde, Carbon Tetrachloride, and Chrome VI. The higher than normal average concentration of Toluene at Clearbrook was affected by several high daily concentrations detected during the sampling project.
Data Comparison with NATA 1999 estimates (µg/ m3)
Winchester Project SitesNATA 1999 Wincheste
r City
NATA 1999
Frederick County
CASS# Target Compound South Central North Total mean Total mean
74-87-3 Chloromethane 1.180 1.180 1.120 1.203 1.202
75-09-2 Methylene Chloride 0.432 0.402 0.394 0.403 0.23771-43-2 Benzene 0.496 0.737 0.602 0.997 0.606
56-23-5 Carbon Tetrachloride 0.788 0.675 0.627 0.270 0.270
108-88-3 Toluene 0.908 1.857 5.471 3.464 0.973
36

108-38-3 m&p-Xylene * 0.448 0.878 0.376 1.684 0.705
50-00-0 Formaldehyde 2.903 3.779 3.057 1.014 0.690
75-07-0 Acetaldehyde 1.911 2.473 1.904 1.037 0.8067440-47-3 Chromium VI na 0.0000607 na 0.0000176 0.0000176
* NATA 1999 Xylenes are all isomers consists of o, m&p Xylene
8.0. CONCLUSION:
The special grant provided by the USEPA Region III has enabled VADEQ to collect valuable information on the quality of air in Winchester City and its surrounding areas. VADEQ and the stakeholders viewed this project as an important first step in the study of air quality and health aspect of selected ambient air toxic pollutants in the Winchester City / Frederick County.
The collected data established a baseline of air quality concentrations for the Winchester area. The information will be useful for future evaluation for the progress of an emission control program. Furthermore, based on the collected data of the project, VADEQ has found the following conclusions for this project:
Metals
PM-10 emissions in Winchester, with the exception of the Clearbrook site, were in line with other locations in Virginia. Despite Clearbrook being influenced by local industrial activities, and the relatively elevated readings, the Clearbrook site was not in exceedance of the EPA’s guidelines. VADEQ has decided to continue monitoring for PM-10 at this site at the request of Valley Regional Office.
Manganese (Mn) and Lead (Pb) were the greatest contributors towards the total metal composition in the PM-10 samples collected. Manganese and Lead appear to have similar concentration with other archived concentration data for various locations in the US. Average concentration of Lead measured at the three sites in Winchester was much lower than the allowable concentration of 1.5 µg/ m3.
Traffic and daily activities do not appear to be the major factors for the target metal emissions in the study area.
Carbonyls:
Out of seven target compounds, there were five abundant Carbonyl compounds found in Winchester: Formaldehyde, Acetaldehyde, Acetone, Methyl Ethyl Ketone, and Propionaldehyde. These Carbonyls have similar level of concentration with those measured in other locations in Virginia.
Traffic and daily activities do not appear to be the major factors for the target carbonyls emission in the study area.
37

Volatile Organic Compounds:
From the list of 51 targeted Volatile Organic Compounds (VOC), there were only 9 to 13 frequently detected VOC at the three sampling sites in Winchester. The measured, average concentration of the detected VOC, were comparable to those sampled at Richmond, Norfolk, VA Beach and Franconia.
Several high readings of Ethyl Acetate concentration measured during the weekdays at Clearbrook elevated its average concentration result. Fruit ripeness and fruit processing activities in the area could be the cause.
The GE Property was planned as the project primary upwind site. VOC data analysis found highway traffic and daily activities are not the major factors for the target VOC emission in the Southside of Winchester.
In contrast, city traffic and daily activities affected the VOC profile in the Winchester city and I-81 traffic, transport, and some agricultural activities also influenced the VOC emission in the Clearbrook and its surrounding areas. However, the level of VOC concentration was in line with other locations in Virginia.
Hexavalent Chromium:
Detected levels of Hexavalent Chromium indicate that it is not a problem in Winchester City based on OSHA 8 Hour time weighted average (TWA).
Average concentration of Winchester Chrome VI is at the low side of the National average atmospheric concentration of 0.001 µg/m3.
Based on site concentrations and meteorological data it would appear that the results are controlled by local activity rather than transport from other locations.
By comparison, the collected data has allowed VADEQ to evaluate results of the 1999 NATA. NATA underestimated concentration of Acetaldehyde, Formaldehyde, Carbon Tetrachloride, and Chrome VI. Estimates of the other available compounds compare favorably to the observed values.
Despite the fact that the project data was not significantly different than other monitored sites, any additional data analysis and a subsequent Health Assessment may be beneficial. The additional task could be a major project depending on its scope. The Lord Fairfax District of the Health Department, a member of the Project Stakeholders, has agreed to be the lead agency for the assessment. If requested by the Health Department, VADEQ will provide the detailed data and any available QA information for the Health Assessment task. In the future, should new technology become available and additional funding provided, VADEQ may conduct further studies on Semi Volatile Organic Compounds (SVOC), Agricultural compounds / Pesticides, and PM2.5 speciation.
38