1 Virginia Tech Vortex-Induced Vibrations Project A. H. Nayfeh, M.R. Hajj, and S. A. Ragab...
35
1 Virginia Tech Vortex-Induced Vibrations Project A. H. Nayfeh, M.R. Hajj, and S. A. Ragab Department of Engineering Science and Mechanics, Virginia Polytechnic Institute and State University, Blacksburg, VA 24061-0219 e-mail: [email protected] R. M. Sexton Starmark Offshore Inc. Danville, VA e-mail: [email protected]
-
Upload
alexina-golden -
Category
Documents
-
view
213 -
download
0
Transcript of 1 Virginia Tech Vortex-Induced Vibrations Project A. H. Nayfeh, M.R. Hajj, and S. A. Ragab...

1
Virginia Tech Vortex-Induced Vibrations Project
A. H. Nayfeh, M.R. Hajj, and S. A. Ragab Department of Engineering Science and Mechanics,
Virginia Polytechnic Institute and State University, Blacksburg, VA 24061-0219
e-mail: [email protected]
R. M. SextonStarmark Offshore Inc.
Danville, VAe-mail: [email protected]

2
Vortex-Induced VibrationsIntroduction
• Offshore Drilling, Production, and Export Riser Systems
• Interaction Between Fluid Forces and Riser Motions
• Ultimate Solution
– Numerical simulation of the fluid flow and riser’s response
– Fluid and riser are treated as a single dynamical system
– Formidable task, high Reynolds number and long riser
• Reduced-Order Model

3
Objectives
• Develop a practical and reliable engineering method for the prediction of Vortex-Induced Vibrations (VIV) on offshore slender structures• Develop technical breakthrough in the basic understanding and calculation of VIV and Fluid-Structure Interaction (FSI) for offshore slender structures, such as vertical risers, flexible risers, steel catenary risers, tendons, mooring lines, pipelines, etc• Develop software modules to calculate and simulate VIV on marine slender structures, including hydrodynamic coefficients and fatigue damage • Calibrate theoretical calculations with (a) existing data from participants, (b) new laboratory measurements, and (c) offshore measurement programs • Stimulate worldwide academic and industry research in the VIV area • Train a new cadre of undergraduate and graduate students in the VIV area for possible research and employment

4
Deliverables
• Software modules to calculate and simulate VIV on marine slender structures, including hydrodynamic coefficients and fatigue damage
• Technical papers and documents
• Short courses, seminars, and discussion of the project results
• Consulting expertise
• Hold international conferences on VIV

5
Project Philosophy
• Focus recent breakthroughs in – CFD: RANS, LES, DNS – Laboratory and field measurements– Nonlinear dynamics and control – Generation of design models using identification techniques – Structural dynamics – High-order spectral methodsto understand and quantify the VIV problem
• Execute the project in phases that are dependent on participants’ technical input and funding levels • Encourage VIV experts to participate and to share knowledge in an effort to stimulate worldwide research
6
Organization
• The project will be directed by the Virginia Tech Nonlinear Vibrations and Fluid Mechanics Laboratories
• An advisory/steering committee representing participating organizations
• Joint-Industry Project (JIP) participants • The project liaison is Starmark Offshore Inc. (SOI)
• Other experts and specialists

7
Approach
• Use detailed fluid-structure-control simulations to generate a database that will be used to develop and calibrate finite-degree-of- freedom models for the design and analysis of VIV problems• Combine
– Time Histories of Lift, Drag, Motion Obtained by• CFD (RANS, LES, DNS)
• Finite Elements
• Full scale and model scale experiments
• Field Measurements
– Nonlinear Dynamics– Higher-Order Spectral Methods– Nonlinear Identification Techniques
• Validation - Physics
8
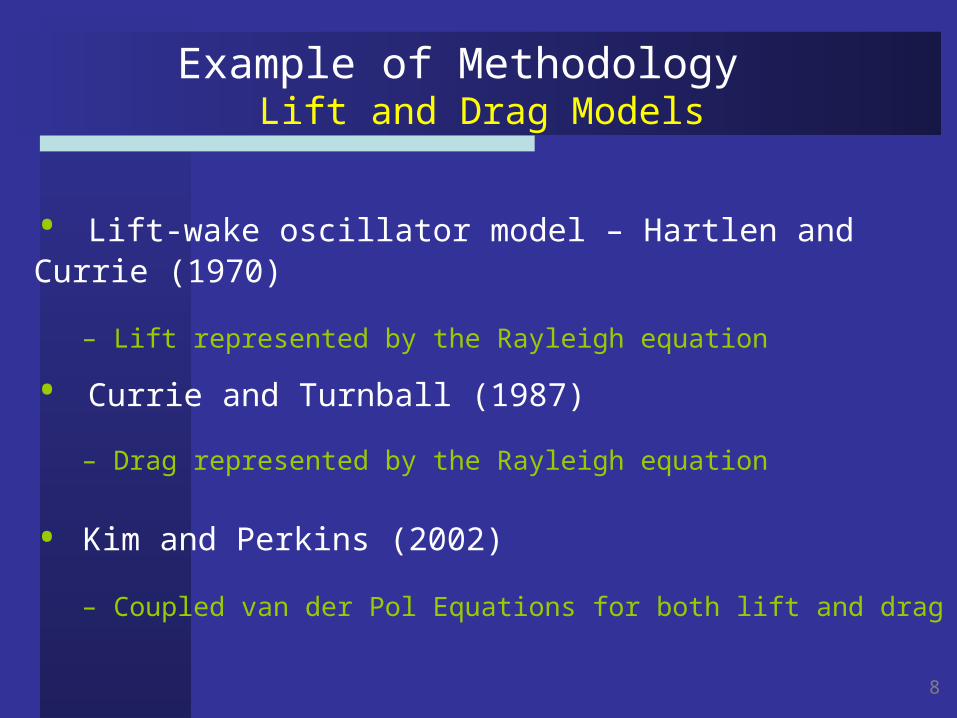
Example of Methodology Lift and Drag Models
• Lift-wake oscillator model – Hartlen and Currie (1970)
– Lift represented by the Rayleigh equation
• Currie and Turnball (1987)
– Drag represented by the Rayleigh equation
• Kim and Perkins (2002)
– Coupled van der Pol Equations for both lift and drag

9
Lift and Drag Model for a Stationary Cylinder in a Uniform Flow
• RANS solutions of the flow field
• Higher-Order Spectral Moments
– Amplitude and phase Information
• Perturbation Techniques
– Approximate solutions
• Parameter identification in the governing equations
• Validation-Physics
10
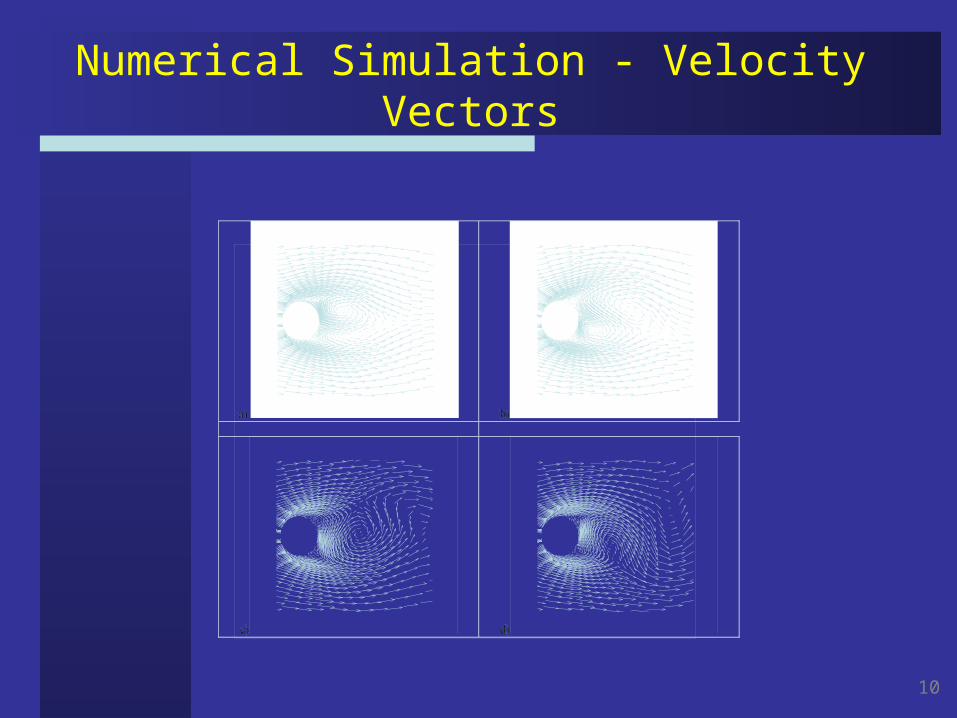
Numerical Simulation - Velocity Vectors

11
Numerical Simulation - Velocity Vectors

12
Numerical Simulation - Vorticity

13
Lift and Drag Spectra
•Lift frequency at vortex shedding•3f in lift spectra•2f and 4f in drag spectra
Flutter
Lift Drag

14
Lift Modeling & Approximate Solution
Rayleigh equation:
Van der Pol equation:
2 2 0s v vl l l l l
32
1cos( ) cos(3 3 )
32 2v
s ss
l a a
2 3 0s r rl l l l
3 1cos( ) cos(3 3 )
32 2r s
s sl a t a t

15
Phase Measurement with Auto-Trispectrum
*1lim ( ) ( )xx T
P E X f X fT
• Auto-Power Spectrum:
• Auto-Trispectrum:
Phase of auto-trispectrum can be used to determine whether the Rayleigh or the van der Pol equation should be used to model the lift.
* * *
s s
1lim ( ) ( ) ( ) ( )
where
for
Phase of auto-trispectrum (3 ) 3 ( )
xxxx l k i jT
l k i j
k i j
T E X f X f X f X fT
f f f f
f f f f

16
Lift CFD Solution
1 3cos( ) cos(3 )s sl a a
1(3 ) 3 ( )
2s s
Trispectrum representation of the steady-state lift
where
Therefore, the lift should be modeled with the van der Pol equation
2 2 0s v vl l l l l
17
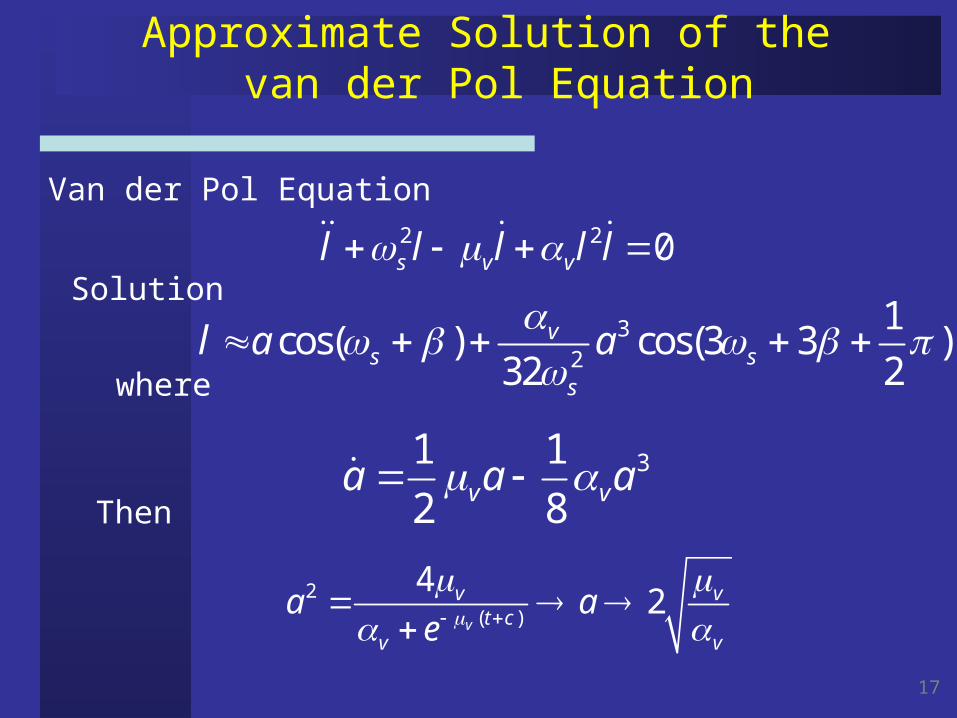
Approximate Solution of the van der Pol Equation
2 2 0s v vl l l l l
32
1cos( ) cos(3 3 )
32 2v
s ss
l a a
31 1
2 8v va a a
Van der Pol Equation
Solution
where
Then
2( )
42
v
v vt c
v v
a ae

18
Identification
1 3cos( ) cos(3 )s sl a a
3
1 3 22 and
32v v
v s
aa a a
CFD
Approximate Solution of van der Pol Equation
Therefore
Solving these equations yields2
2313
1
32 1and
4s
v v v
aa
a
32
1cos( ) cos(3 3 )
32 2v
s ss
l a a

19
Trispectrum of CFD Steady-State Lift
Table 1: Lift parameters as a function of the Reynolds Number.
Re f a1 a3 200 0.193 0.6184 0.0044
1,000 0.2295 1.205 0.039 2,000 0.2368 1.394 0.052
10,000 0.2391 1.793 0.049 20,000 0.2368 1.728 0.055 40,000 0.2510 1.465 0.040
100,000 0.2538 1.056 0.021 1,000,000 0.2550 1.321 0.033

20
Lift Modeling
The van der Pol equation gives the right phase relation for modeling the lift
Re = 20000 Re = 100000

21
Drag Modeling
Drag Spectra have components at 2 f and 4 f and a very small component at f
2 2is proportional toeither or ord l l ll
* *1lim (2 ) ( ) ( )dll T
B E D f L f L fT
3
2
Therefore
Cross-Bispectrum
therefore21
1 221
2m
kd d k l k l
a
Because the phase of the cross-bispectrum is
2where is verysmallk

22
Identified Drag Parameters
Re dm k1 k2
200 1.1896 0.0389 -0.0006
1000 1.2900 0.139 0.00000
2000 1.3600 0.175 0.00000
10000 1.5600 0.060 -0.0045
20000 1.435 0.067 -0.0068
40000 1.3200 0.0786 0.00000
100000 0.9650 0.0696 -0.0053
1000000 0.9708 0.0871 -0.0000
Table 2: Drag parameters as a function of Re

23
Drag Modeling
Re = 20000 Re = 100000
211 22
1
2m
kd d k l k l
a

24
Validation - PhysicsLift Spectra
CFD Model

25
Validation - PhysicsDrag Spectra
CFD Model
26
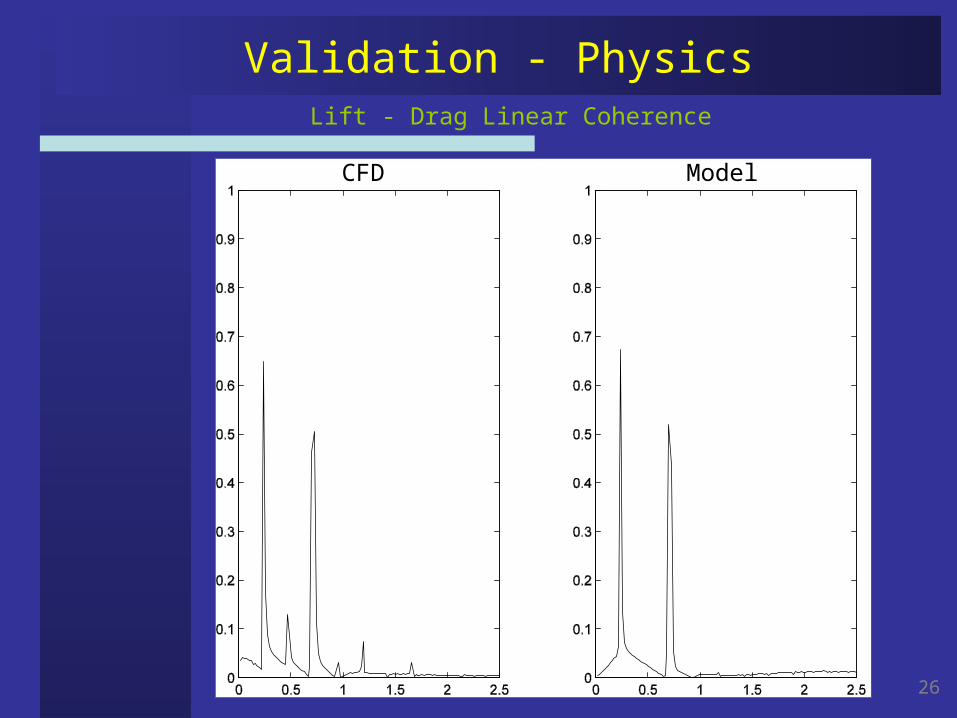
Validation - PhysicsLift - Drag Linear Coherence
CFD Model
27
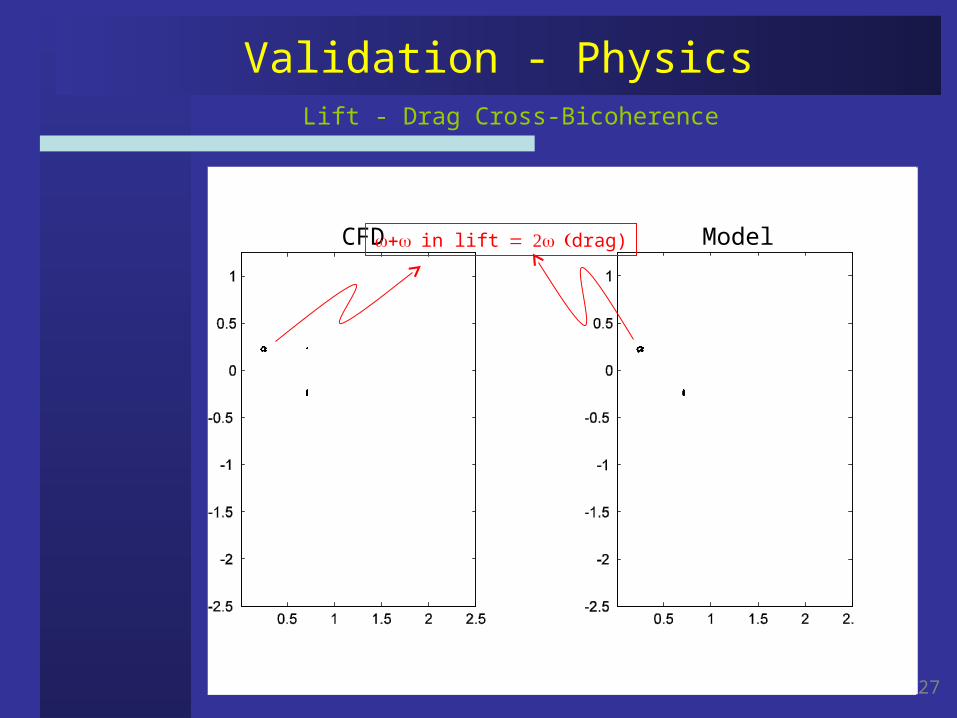
Validation - PhysicsLift - Drag Cross-Bicoherence
CFD Modelin liftdrag)

28
Validation - PhysicsLift Auto-Tricoherence
CFD Model
in lift

29
Technical Plan
• A Stationary Cylinder in a Uniform Flow Field– Collect CFD and experimental data for many Reynolds
numbers– Compute the shedding frequency and the amplitudes of the
first and third harmonics using the FFT– Compute the mean and amplitudes of the harmonics in the
drag using the FFT– Use the methodology described earlier to build an
extensive database for • the shedding frequency • the parameters for the van der Pol oscillator• the mean drag• the coefficients in the drag formula

30
An Infinite Cylinder Oscillating Transversely to a Uniform Flow
• Specify a transverse harmonic motion of the form
• Modified van der Pol oscillator
• Select the Reynolds number, • Run CFD code, calculate the flow field, including the
pressure• Integrate pressure to calculate lift and drag coefficients• Calculate the spectra of the lift and drag using the FFT• Inspect the spectra to ascertain whether the F is a
linear or a nonlinear function
cos( )y A t
2 2 ( , , )s v vl l l l l F y y y , andA

31
An Infinite Cylinder Oscillating Transversely to a Uniform Flow-Continued
• Calculate the different orders of spectral moments between y
and l to determine the function F• Solve the modified van der Pol oscillator
• Compare the results with the CFD results to identify the
coefficients • Compare the spectrum of the drag coefficient with that of the lift
to ascertain how to modify the unforced drag model• Repeat the process for many Reynolds numbers and amplitude
and frequency of the cylinder velocity
2 2 ( , , )s v vl l l l l F y y y

32
Technical Plan-Continued
• An infinite cylinder oscillating in-line to a uniform flow• Interaction of transverse motion of a cylinder with a uniform flow• Interaction of in-line motion of a cylinder with a uniform flow• Interaction of transverse and in-line motions of a cylinder with a
uniform flow• Finite-element method analysis coupled with local van der Pol
oscillators • Reduced-order model with local van der Pol models • Correlation of vortices in a sheared flow• Multimode interactions in flexible risers
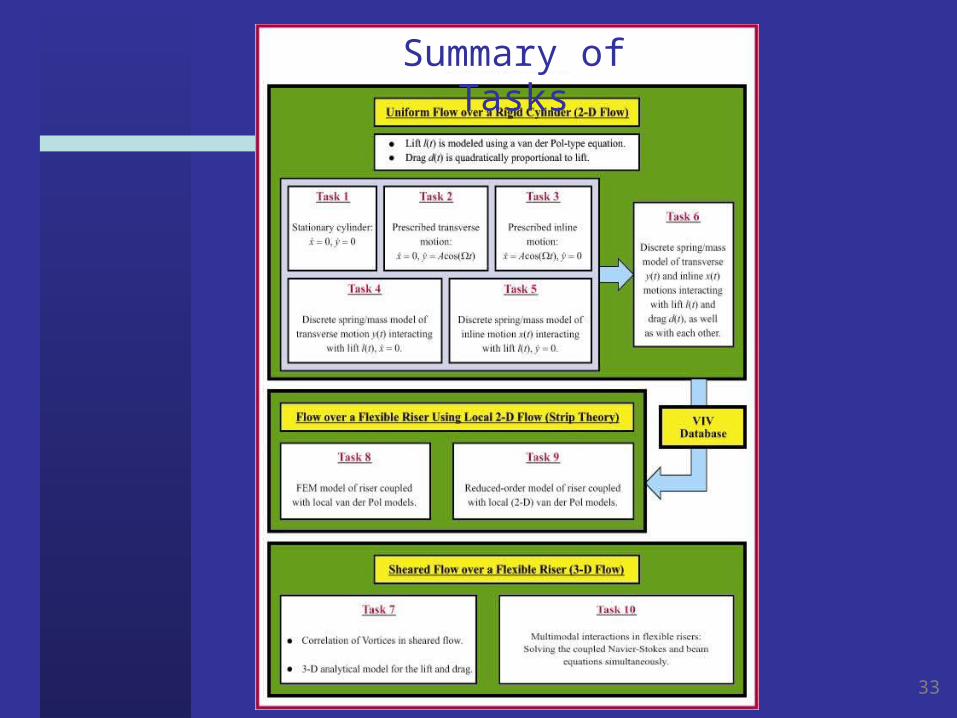
33
Summary of Tasks

34
A 96-Node Cluster for Computation and Visualization
• Typically simulations and visualizations are run independently– A simulation run gathers data, which is stored, processed and then
visualized on a target system such as a CAVE facility
– Simulation errors are expensive. Simulation runs last weeks and if the visualization system detects an error, the simulation has to be re-run
• Recommendation: Combine simulation and visualization into a single cluster system– This permits real-time visualization of data from the simulation.
– A human-in-the-loop interface can be used to detect errors and correct them in real-time
– This enables run-time steering of complex software systems as opposed to the “watching a movie” environment presented by current visualization technologies.
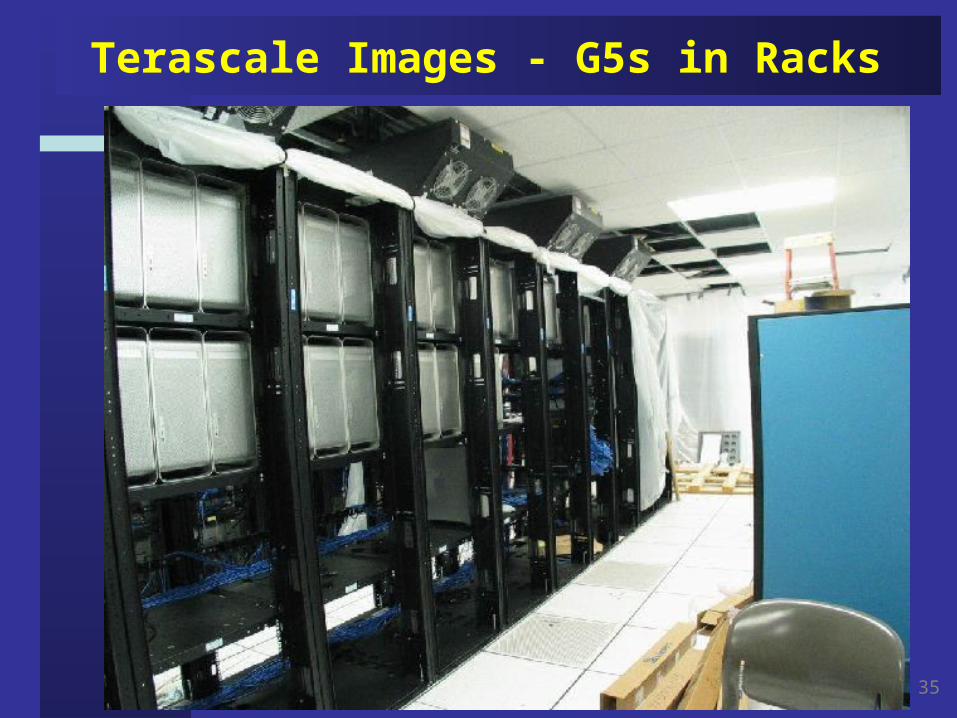
35
Terascale Images - G5s in Racks


![[Nayfeh a.H., Chin C.-m.] Perturbation Methods](https://static.fdocuments.us/doc/165x107/577cd1261a28ab9e7893bd4c/nayfeh-ah-chin-c-m-perturbation-methods.jpg)