
1 Unit 2: PSY 6450 Traditional Performance Appraisal Performance Measurement Performance Assessment...
69
1 Unit 2: PSY 6450 Traditional Performance Appraisal Performance Measurement Performance Assessment Task Clarification Schedule: Monday and Wednesday: Lecture Monday, 9/22, Exam
-
Upload
bernard-carr -
Category
Documents
-
view
217 -
download
2
Transcript of 1 Unit 2: PSY 6450 Traditional Performance Appraisal Performance Measurement Performance Assessment...

1
Unit 2: PSY 6450
Traditional Performance Appraisal
Performance Measurement
Performance Assessment
Task Clarification
Schedule:Monday and Wednesday: LectureMonday, 9/22, Exam

2
Unit 2 Aamodt: traditional performance appraisal Daniels chapter: measurement & performance
matrix Pampino et al. article: great example of
performance assessment, multiple component intervention, and social validity assessment. Only problem is the short-term nature of the study.
Anderson et al. article: great example of task clarification and importance of feedback
Komaki: Tool to assess effective supervisors and managers from an operant perspective

3
Additional Readings
I have included six references for additional readings that I highly recommend if you are interested in pursuing any of the topics Alyce’s hit list
I have also included “Major Take-Home Points” in the study objectives, or the World According to Alyce Hopefully this will help explain why I chose the articles I
did and tie the material together for you There’s a lot of different topics covered
SO1: Why it is important to determine the reason for evaluation Performance is assessed for a number of
reasons (administrative reasons, performance improvement)
Various performance appraisal methods are appropriate for some purposes, not for others. Employee comparison methods such as forced
choice and ranking: good for administrative purposes, not good for performance improvement
360-degree evaluation: good for performance improvement, not good for administrative purposes
4(Start with traditional performance appraisal: two very good articles in the 2011 JOBM IO/OBM special issue: DeNisi and Gravina & Siers administrative – pay increases, promotions, termination)
5
Traditional Performance Appraisal: Who does it? 90% of appraisals are done by supervisors Others, however, may also participate in the
appraisal Peers Subordinates/Direct reports (upward feedback) Customers Employee himself or herself (rather rare)
28% of large companies use some form of multi-source evaluations
(start with some data re the source of the appraisal; that is who actually does the appraisal)

6
SO2: Different results There is often little agreement when different
sources evaluate an employee Supervisors and peers: .34 correlation Supervisors and subordinates: .22 correlation Supervisors and the employee: .22 correlation Peers and subordinates: .22 correlation Peers and the employee: .19
(start with some data re the source of the appraisal; not subordinates, more commonly called direct reports,)

SO2: Two reasons why results may differ Those groups see different aspects of the person
’s performance The supervisor may see the results, but not see how
the person interacts with peers, direct reports and customers
The employee may interact very differently with the supervisor than with peers and subordinates
This is why we have our current graduate students evaluate our applicants to our graduate programs
7(why are the evaluations so different?, to get an accurate evaluation, tap into different sources)

8
SO3: Peer assessments 3A. In general, when peers are similar and know
the person well peer ratings have good reliability and validity Reliability - different peers rate the employee the same
way; Inter-observer agreement Validity - predict future success of employees
3B. However, employees react worse to negative feedback from peers than from supervisors/experts
9
SO4: Main obstacle to peer assessments Acceptance by employees - we don’t like to do
this WMU faculty merit system: Union vs. admin.
Not enough money to go around; many just split $$
How would you like to be given the responsibility for evaluating your peers - the other students advised by your faculty advisor - and have rewards (i.e.,assistantships, grades in classes, opportunities for practica and projects) based on that?

10
SO5: Ratings by subordinates 5A. Not surprisingly, accurate subordinate ratings can be
hard to obtain. Why?Employees fear a backlash, particularly if there are only a few of them and the supervisor is likely to be able to identify them.
5B. Data also indicate that feedback/ratings from subordinates brings about the greatest performance change when compared to feedback/ratings by supervisors and peers (quite interesting!)
(used in 360 degree feedback programs; quite popular right now; however, subordinate rating systems are not common or well-regarded by managers.; same problem with getting evaluations of faculty advisors)

11
360 degree feedback (NFE) A manager/supervisor
Rates himself Is rated by his manager/supervisor Is rated by his peers Is rated by his subordinates
What percentage of managers saw themselves as others saw them?
Only 10%!
Overrating was most noteworthy on what scale?
People
(NFE, devastating, but why is this good news for us?; use for administrative purposes is increasing, but there are some problems with this – Aamodt advised, it is best used for development purposes; coaching with a coach who is not the manager’s supervisor)

12
SO6 Self-assessment 6A: Main problem?
Inflation: we think we are better than we are 6B: Self-ratings correlate
only moderately with actual performance poorly with subordinate ratings poorly with management ratings
NFE, but interesting cross-cultural data Ratings of Japanese, Korean, & Taiwanese workers
suffer from strictness (modesty) Ratings from workers in the US, mainland China, India,
Singapore, and Hong Kong suffer from leniency
(Dr. Oah, deadlines)
13
SO6 Self-assessments, cont. 6C: Little agreement between supervisory and self-
assessments. What are the important implications of this from a behavioral perspective?
If employees believe they are performing better than the supervisor believes, then they will not get the rewards they feel they deserve from the supervisor.
Thus, employees will not believe that rewards are contingent upon their performance. Because of that, it is likely to hurt performance, cause dissatisfaction, and cause strained relations with the supervisor.

14
Common types of appraisal methods (NFE) Employee comparison methods
Evaluate employees by comparing them against each other rather than against a standard
Objective performance Ratings
Graphic rating scales, most common Behavioral checklists Less common in Appendix (due to complexity): (a)
behaviorally anchored rating scales, (b) forced choice rating scales, (c) mixed standard scales, (d) behavioral observation scales
(Aamodt does a superb job of presenting the different types and discussing strengths and weaknesses of each)

15
SO8: Why use employee comparisons?
To reduce leniency Forces variance or variability into the ratings With graphic scales, not uncommon for a supervisor
to rate employees pretty much the same: everyone is a 5 or a 6 on a 7 point scale, making it difficult to make personnel decisions.
(rank order, paired comparison, and forced distribution; I want to look at ranking and forced distribution in detail))
16
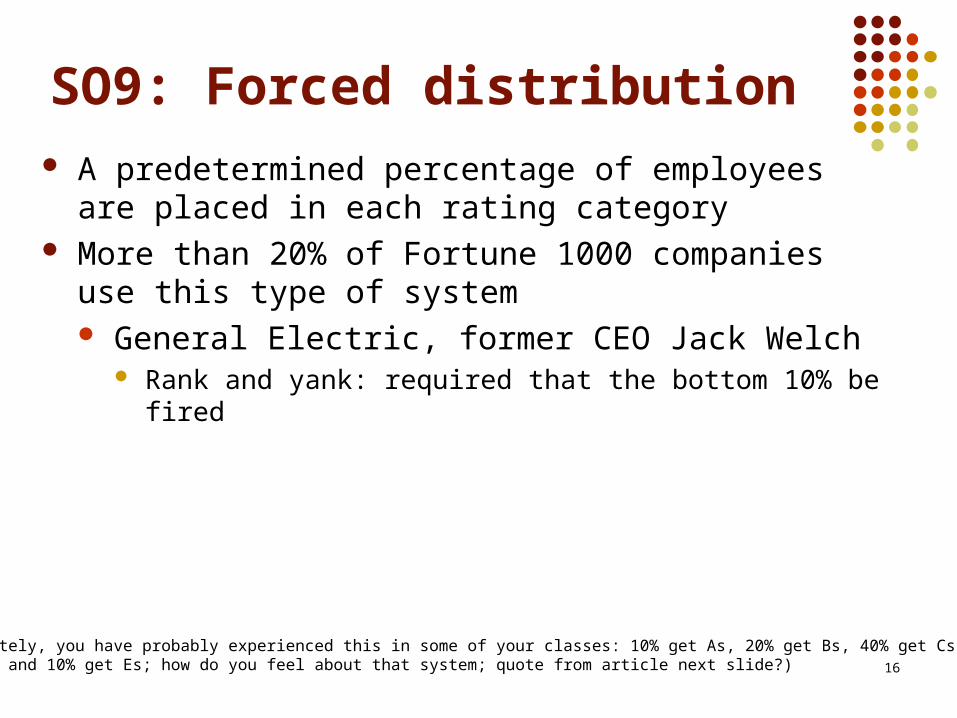
SO9: Forced distribution A predetermined percentage of employees are placed in
each rating category More than 20% of Fortune 1000 companies use this type
of system General Electric, former CEO Jack Welch
Rank and yank: required that the bottom 10% be fired
(unfortunately, you have probably experienced this in some of your classes: 10% get As, 20% get Bs, 40% get Cs, 20% get Ds and 10% get Es; how do you feel about that system; quote from article next slide?)
17
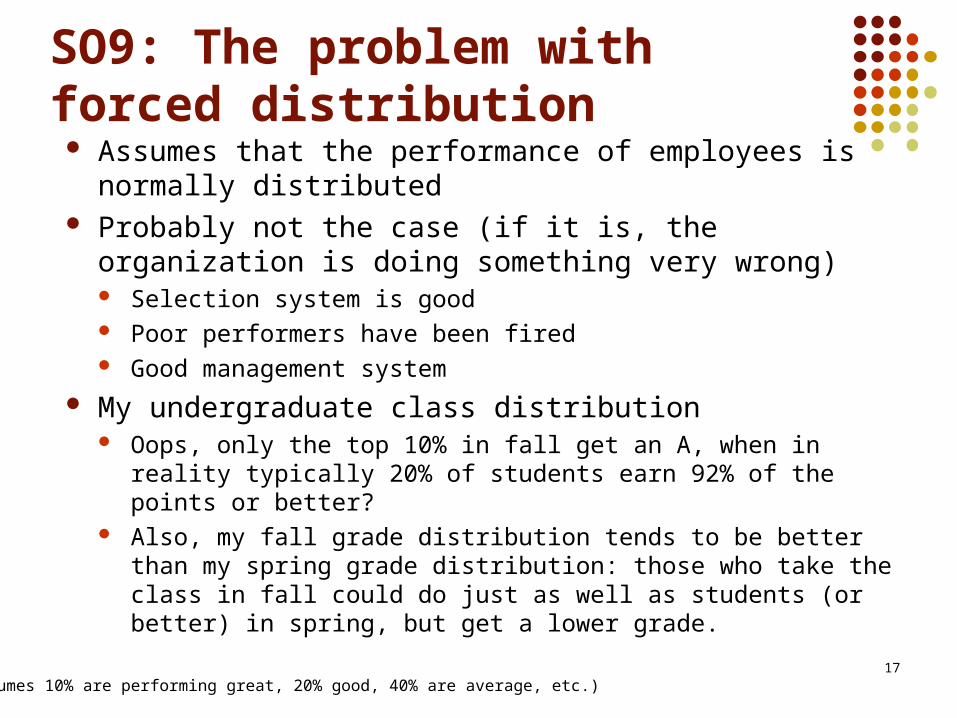
SO9: The problem with forced distribution Assumes that the performance of employees is normally
distributed Probably not the case (if it is, the organization is doing
something very wrong) Selection system is good Poor performers have been fired Good management system
My undergraduate class distribution Oops, only the top 10% in fall get an A, when in reality typically
20% of students earn 92% of the points or better? Also, my fall grade distribution tends to be better than my spring
grade distribution: those who take the class in fall could do just as well as students (or better) in spring, but get a lower grade.
(assumes 10% are performing great, 20% good, 40% are average, etc.)

18
SO9: Forced distribution
Article about Yahoo In 2013 Yahoo adopted a ranking system based on the
bell curve Author calls it the “third rail of human resource
management”
(quote next)
Quote from article
19
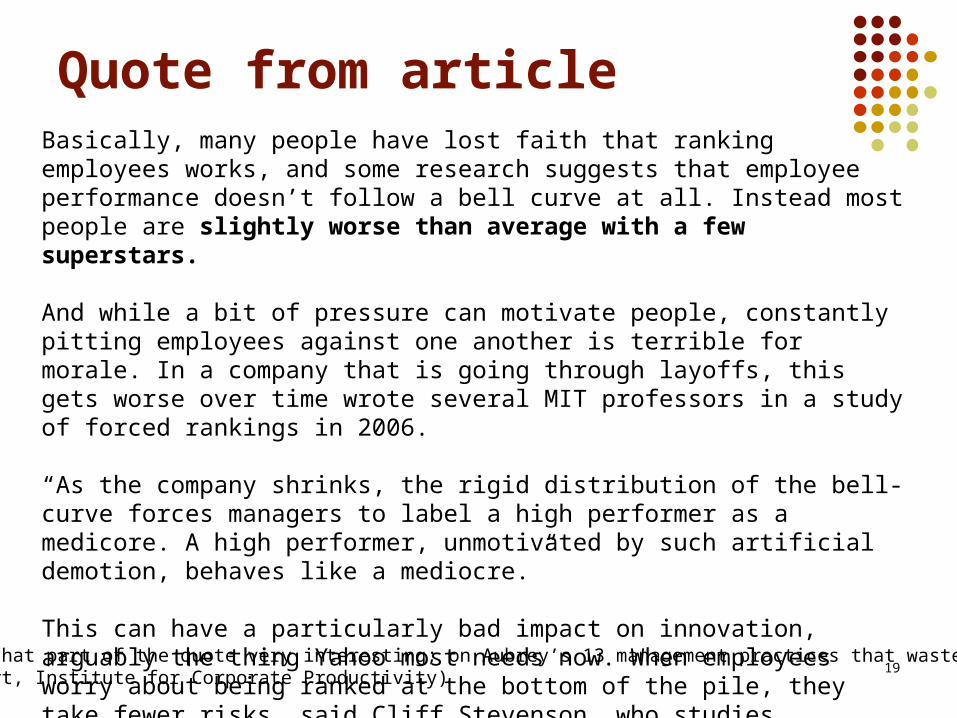
Basically, many people have lost faith that ranking employees works, and some research suggests that employee performance doesn’t follow a bell curve at all. Instead most people are slightly worse than average with a few superstars.
And while a bit of pressure can motivate people, constantly pitting employees against one another is terrible for morale. In a company that is going through layoffs, this gets worse over time wrote several MIT professors in a study of forced rankings in 2006.
“As the company shrinks, the rigid distribution of the bell-curve forces managers to label a high performer as a medicore. A high performer, unmotivated by such artificial demotion, behaves like a mediocre.”
This can have a particularly bad impact on innovation, arguably the thing Yahoo most needs now. When employees worry about being ranked at the bottom of the pile, they take fewer risks, said Cliff Stevenson, who studies workforce issues for i4cp.
(I find that part of the quote very interesting; on Aubrey’s 13 management practices that waste timeand effort, Institute for Corporate Productivity)

20
SO9: Forced distribution
Yet another caution! Two major lawsuits have been brought against
companies because minority groups were disproportionately ranked in the low category
Ford and Goodyear dropped them

21
SO10: What’s the problem with employee comparisons?
May create a false impression that differences between individuals are actually larger than they are because you do not get actual performance data
Six employees, rank ordered1. Jan2. Shakira3. Paul4. Mike5. Susan6. John
Actual performancedifference betweenJan and Mike or evenSusan may be verysmall, yet look big.Can affect salaryincreases, promotions,etc.
(employee comparisons in general: ranking, forced distribution are types: limited $ for merit increases, promotions - across depts – Is #3 in one dept. comparable in performance to #3 in another? Also, competitive systems; only one person can be #1; sabotage or at least decrease willingness to cooperate/help )

22
SO11: Main problem with graphic rating systems
Leniency and halo Leniency: supervisors rate employees better than they
should Halo: a rating in one area of performance affects ratings
in other areas Person has good social skills, supervisor rates him/her higher on
performance than the supervisor should
(in general, rating errors, but the two most common: pressures on raters: how would you like to be the supervisor who gives one of your direct reports a poor evaluation, placing the employee in jeopardy of being fired, given MI ’s unemployment rate right now?)

23
SO12: Behavioral checklists Behavioral checklists and scales are assumed to be more
accurate because they are less vague, and target “objective” behaviors that are readily observable but they are not more accurate
Why? Still are based on subjective judgments Completed once a year
That is also why we should not consider them adequate from a behavioral perspective Objective measures of behavior/performance Over time as behavior/performance occurs on the job
(only 5% of variance between individuals when rated is due to the type of performance appraisal – That means, the type of performance appraisal format really does not matter; one form is not better than another, people just think they are)

24
SO13: Which method is better?
Research suggests that none is better than another
Methods that are complicated and time consuming to develop have only occasionally been found to be better than uncomplicated, inexpensive graphic rating scales.
(this is important; behaviorally anchored rating scales; reasons – still once a year, still subjective)
Known this for years: Landy & Farr, 1980.

25
Dissatisfaction with performance appraisal (NFE) Companies tend to switch frequently from one type
of form to another Recall performance appraisal was the third-ranked topic
addressed in JAP IBM abandoned employee ranking in favor of graphic
scales, then returned to ranking a few years ago Made the front page of the Wall Street Journal: ranking was
THE way to go
Why do you think IBM may have made the switch?
(nothing to do with reliability or validity)
26
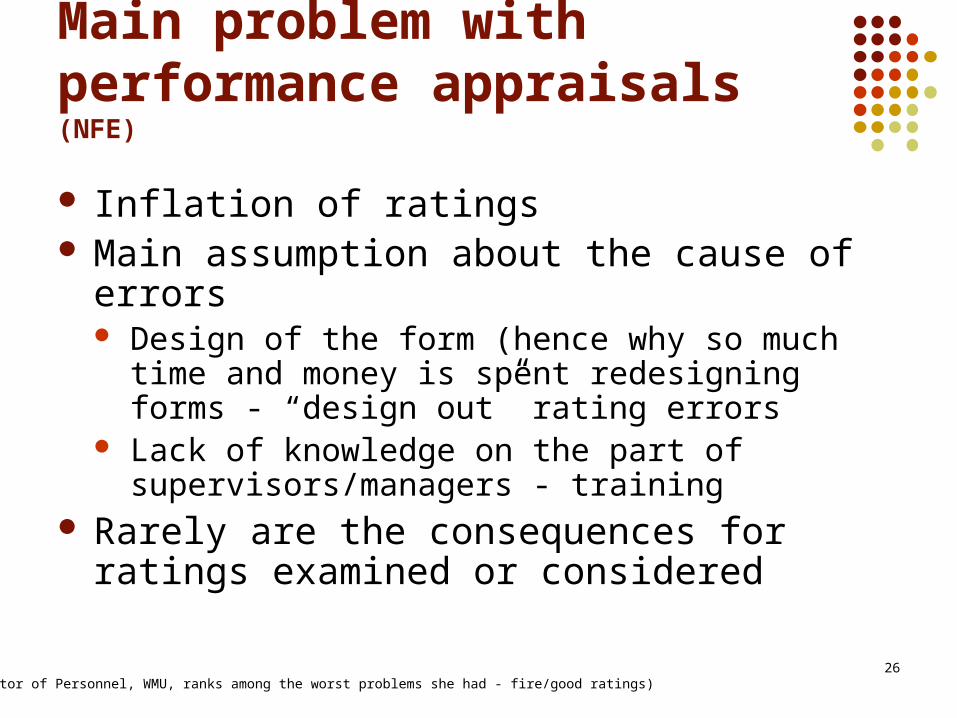
Main problem with performance appraisals (NFE)
Inflation of ratings Main assumption about the cause of errors
Design of the form (hence why so much time and money is spent redesigning forms - “design out” rating errors
Lack of knowledge on the part of supervisors/managers - training
Rarely are the consequences for ratings examined or considered
(Director of Personnel, WMU, ranks among the worst problems she had - fire/good ratings)

27
Consequences for inflated ratings (NFE) No rewards for accuracy; no sanctions for
inaccurate ratings (how does the organization know if the ratings are accurate or inaccurate - a problem)
Most common reason
High ratings are necessary to get salary increases, promotions and other rewards for employees and now even more importantly, to prevent employees from losing their jobs
Avoids aversive interactions with subordinates Ratings of subordinates reflect the competence
of the supervisors as a supervisor/manager

28
SO14: Legal issues (NFE)
Performance appraisals are subject to federal and state EEO laws, and more and more cases are being filed.
Protected classes under Title VII of the Civil Rights Act of 1964?
African Americans, Hispanics, Asians, Native Americans,and females.
(on click; Aamodt gives a very nice list of the factors that will increase the likelihood that you will “win” a legal challenge – note those well – but too many for you to memorize; but, next slide)
29
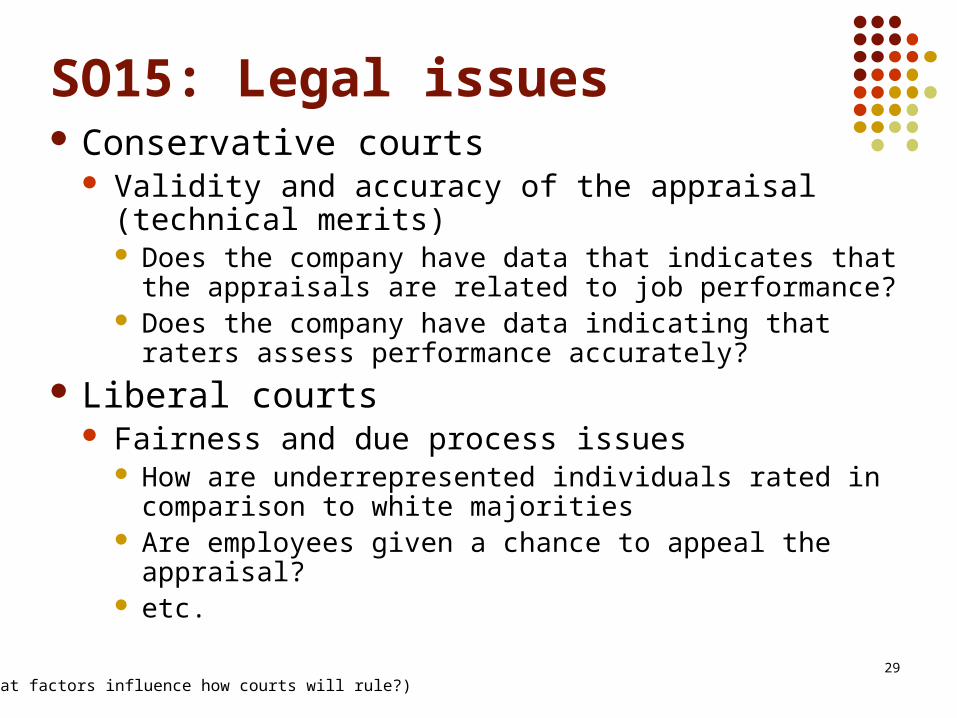
SO15: Legal issues Conservative courts
Validity and accuracy of the appraisal (technical merits) Does the company have data that indicates that the
appraisals are related to job performance? Does the company have data indicating that raters
assess performance accurately? Liberal courts
Fairness and due process issues How are underrepresented individuals rated in
comparison to white majorities Are employees given a chance to appeal the appraisal? etc.
(what factors influence how courts will rule?)
30
For your entertainment only: Actual statements
His men would follow him anywhere, but out of morbid curiosity
I would not allow this employee to breed Works well when under constant supervision and
cornered like a rat in a trap He would be out of his depth in a parking lot puddle This young lady has delusions of adequacy This employee is depriving a village somewhere of
an idiot
(see next slide as well)

31
What some others say*
“By only infrequently rating personnel we only infrequently demotivate them” (Blogger, 2008)
A 1994 survey by the Society for Human Resource Management found that 90% of appraisal systems were not successful (Shellhardt, 1994)
“The best way to double the effectiveness of the typical annual performance appraisal is to do it once every two years” (Daniels, 2009)
*All taken from Daniels, A. (2009). Oops! 13 management practicesthat waste time and money (and what to do about them). Atlanta: Performance Management Publications.

32
Unit 2: Part 2
Performance Matrix
Functional Assessment
Task Clarification

33
Skip to SO19 Performance Matrix
Of SOs 16-18, only SO16 is for the exam I am not going to cover that in lecture - unless
someone has a question about it
34
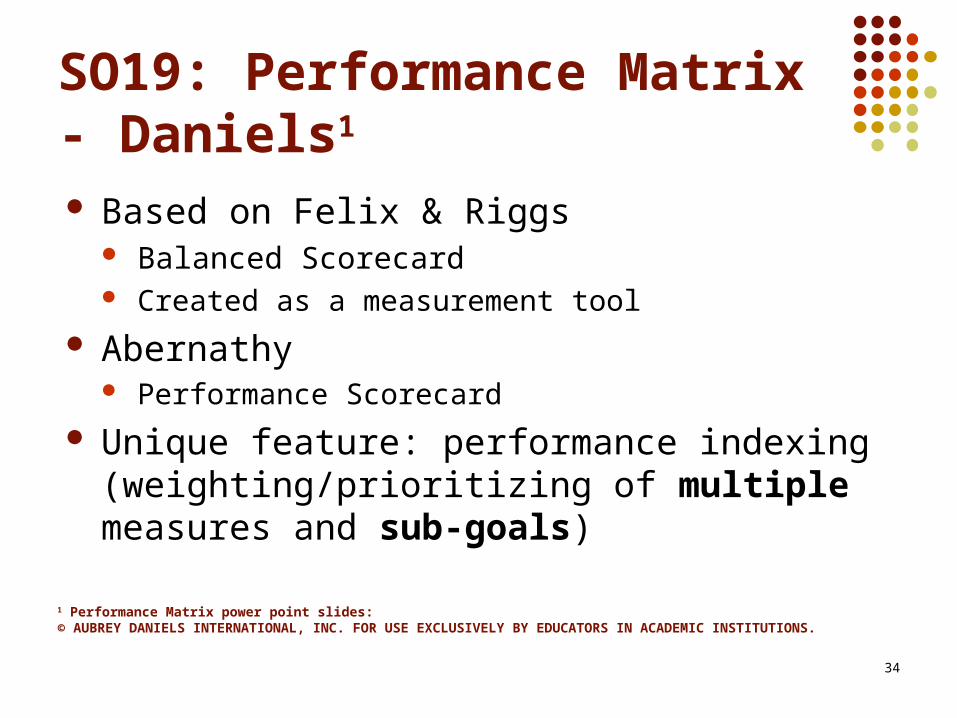
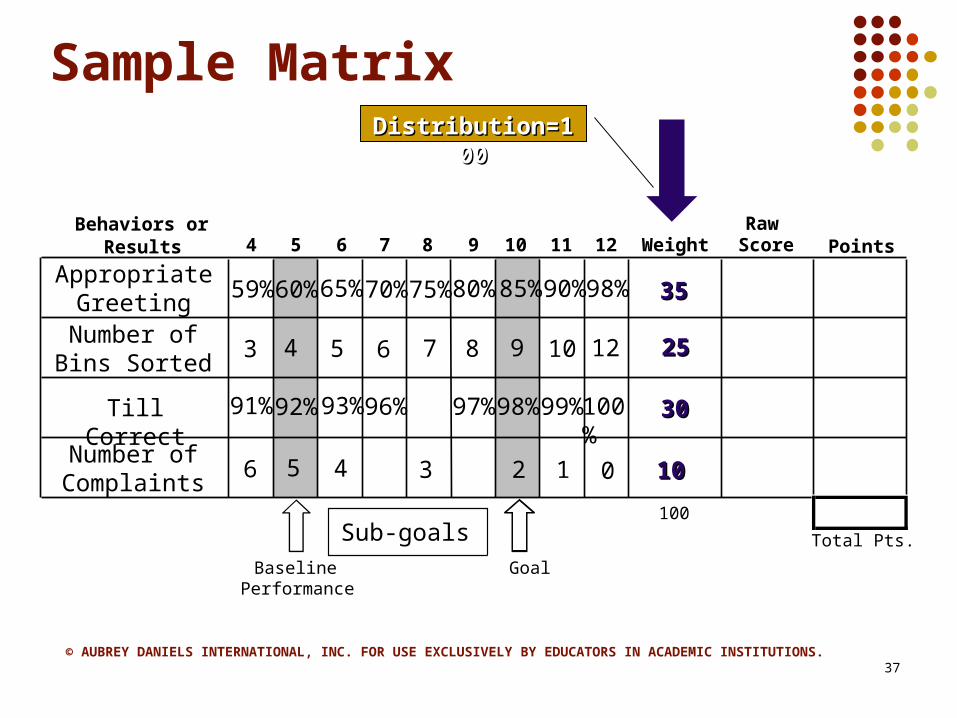
SO19: Performance Matrix - Daniels1
Based on Felix & Riggs Balanced Scorecard Created as a measurement tool
Abernathy Performance Scorecard
Unique feature: performance indexing (weighting/prioritizing of multiple measures and sub-goals)
1 Performance Matrix power point slides:© AUBREY DANIELS INTERNATIONAL, INC. FOR USE EXCLUSIVELY BY EDUCATORS IN ACADEMIC INSTITUTIONS.
35
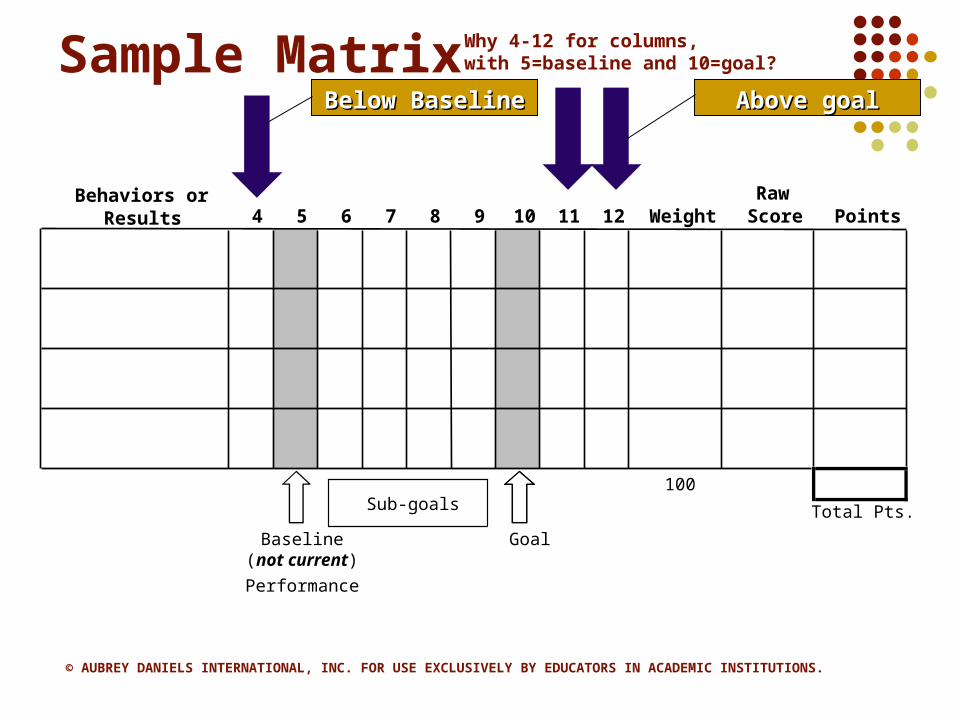
Sample Matrix
Behaviors or Results 4 5 6 7 8 9 10 11 12 Weight
Raw Score Points
100
Total Pts.
Baseline (not current)
Performance
Sub-goals
Goal
© AUBREY DANIELS INTERNATIONAL, INC. FOR USE EXCLUSIVELY BY EDUCATORS IN ACADEMIC INSTITUTIONS.
Why 4-12 for columns, with 5=baseline and 10=goal?
Above goalAbove goalBelow BaselineBelow Baseline

36
Sample Matrix: Postal Worker
Behaviors or Results 4 5 6 7 8 9 10 11 12 Weight
Raw Score Points
100
Total Pts.
Baseline Performance
Sub-goalsGoal
60% 65% 70% 75% 80%59%Appropriate
Greeting90%85% 98%
Number of Bins Sorted
3 4 5 6 7 8 10 129
Till Correct 91% 92% 93% 96% 97% 98% 99%100%
Number of Number of ComplaintsComplaints11 6 5 4 3 12 0
1Note: number of complaints, less is better
37
Sample Matrix
Behaviors or Results 4 5 6 7 8 9 10 11 12 Weight
Raw Score Points
100
Total Pts.
Baseline Performance
Sub-goalsGoal
60% 65% 70% 75% 80%59%Appropriate
Greeting90%85% 98%
Number of Bins Sorted
3 4 5 6 7 8 10 129
Till Correct 91% 92% 93% 96% 97% 98% 99%100%
Number of Complaints
6 5 4 3 12 0
Distribution=100Distribution=100
3535
3030
2525
1010
© AUBREY DANIELS INTERNATIONAL, INC. FOR USE EXCLUSIVELY BY EDUCATORS IN ACADEMIC INSTITUTIONS.

38
Sample Matrix: What would the points be?
Behaviors or Results 4 5 6 7 8 9 10 11 12 Weight
Raw Score Points
100
Total Pts.
Baseline
Performance
Sub-goalsGoal
60% 65% 70% 75% 80%59%Appropriate
Greeting90%85% 98%
Number of Bins Sorted
3 4 5 6 7 8 10 129
Till Correct 91% 92% 93% 96% 97% 98% 99%100%
Number of Complaints
6 5 4 3 12 0
Actual Actual performanceperformance
35
30
25
10
70%70%
95%95%
99
11
© AUBREY DANIELS INTERNATIONAL, INC. FOR USE EXCLUSIVELY BY EDUCATORS IN ACADEMIC INSTITUTIONS.
?
?
?
?
39
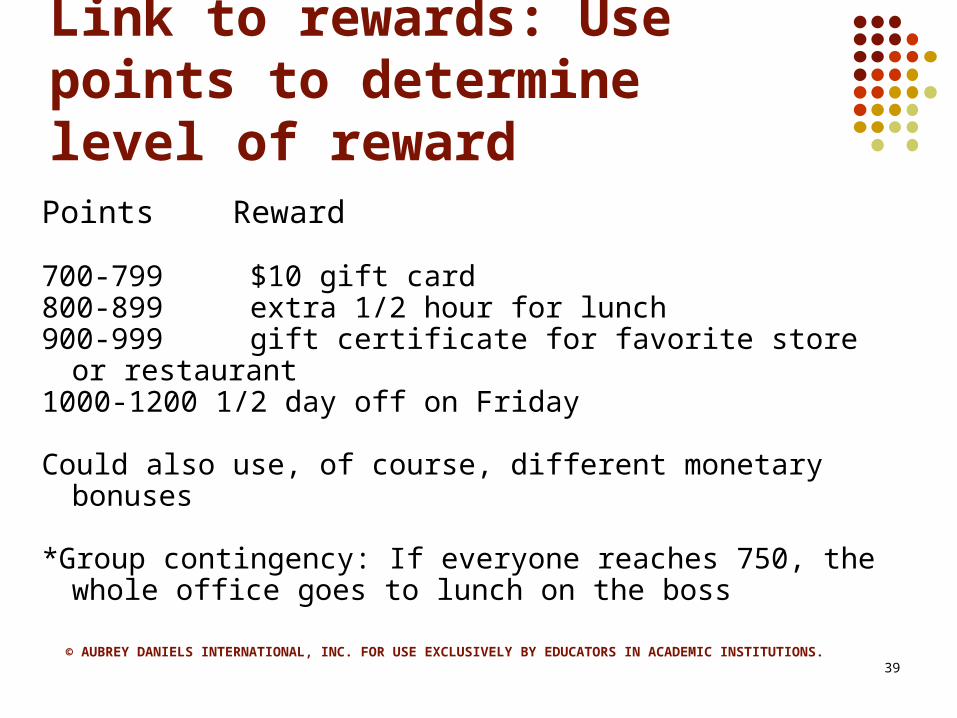
Link to rewards: Use points to determine level of rewardPoints Reward
700-799 $10 gift card800-899 extra 1/2 hour for lunch900-999 gift certificate for favorite store or restaurant1000-1200 1/2 day off on Friday
Could also use, of course, different monetary bonuses
*Group contingency: If everyone reaches 750, the whole office goes to lunch on the boss
© AUBREY DANIELS INTERNATIONAL, INC. FOR USE EXCLUSIVELY BY EDUCATORS IN ACADEMIC INSTITUTIONS.

40
Skipping to SOs 21&22: Lecture study objectives, intro The Pampino et al. article used a functional assessment
(the Performance Diagnostic Checklist by Austin) to determine what interventions were needed
Functional assessments have received more attention lately, although most practitioners and, many researchers have used some type of assessment to determine what their interventions should be
The term “functional assessment” comes from Iwata’s work in DD and autism - determination of what is controlling self-injurious behavior What are the functional causes of the behavior?

41
Functional Assessment, intro In OBM, the term has become more transparent due to Austin’s PDC
and Wilder’s publications, but these type of analyses have existed for many years in both OBM and I/O - just not called “functional assessment” An “ABC” analysis is a functional assessment Mager & Pipe, 1970, flowchart to determine whether a performance
problem was a training problem or a consequence problem Petrock, 1978, balance of consequences
Brown, 1982, included balance of consequences in his book Daniels & Rosen, 1982, modified it into “PIC/NIC”
These all focused on the consequences of behavior, without expanding the analysis to management and organizational level systems analysis Brethower was the first to do that in his 1972 systems analysis book with
his Total Performance System diagram and concept - but it “didn’t catch on” until years later

42
SO21: Three types of functional assessment Informant
Interviews, questionnaires, rating scales or some other “indirect” (verbal) method: a bit suspect as are all verbal reports
Descriptive Direct observation of the employees: generally considered to be
more reliable than informant Functional analysis (note, not assessment)
Experimental analysis - the systematic manipulation of specific antecedents and consequences that may affect the target behavior: most reliable, but often difficult in organizational settings Good example, Pampino, Wilder, & Binder (2005) to determine
why foremen were entering wrong job codes In OBM, most common is to combine informant and
descriptive

43
SO22: Three popular functional assessment procedures in OBM
Gilbert’s Behavioral Engineering Model, 1978 Earliest one that “caught on” and is still very popular
Binder’s Six Boxes (very nice workshop CalABA, 2013)
Directly derived from Gilbert, but copyrighted Gives Gilbert credit, by the way
Austin’s Performance Diagnostic Checklist Based on expert consultant analyses of case studies (his
dissertation); interesting how similar it is to Gilbert’s NFE Rummler’s Human Performance System
Very similar to Gilbert’s BEM
(all systems oriented, that is they don’t just target the antecedents and consequences of behavior, but also look at systems variables)

44
Gilbert’s BEM (nfe)Information Instrumentation Motivation
Environmental
Supports
DataRelevant & frequent feedbackDescriptions of what is expectedClear and relevant guides
ResourcesTools and materials designed to match human factors
Incentives Adequate contingent $$ incentives Nonmonetary incentives Career development
Person’s
Repertory of
Behavior
KnowledgeTraining for exemplary performancePlacement
CapacityWork scheduling for peak performance ProsthesisSelection
MotivesAssessment of motives to workRecruitment of people to match job

45
Gilbert’s BEM (NFE)
Information Instrumentation Motivation
Environmental
Supports
DataRelevant & frequent feedbackDescriptions of what is expectedClear and relevant guides
ResourcesTools and materials designed to match human factors
Incentives Adequate contingent $$ incentives Nonmonetary incentives Career development
Person’s
Repertory of
Behavior
KnowledgeTraining for exemplary performancePlacement
CapacityWork scheduling for peak performance ProsthesisSelection
MotivesAssessment of motives to workRecruitment of people to match job
Binder’s Six Boxes
Expectations&
Feedback
1
Tools&
Resources
2
Consequences&
Incentives
3
Skills&
Knowledge
4
Selection &Assignment“Capacity”
5
Motives &Preferences“Attitudes”
6
(click for binder)
46
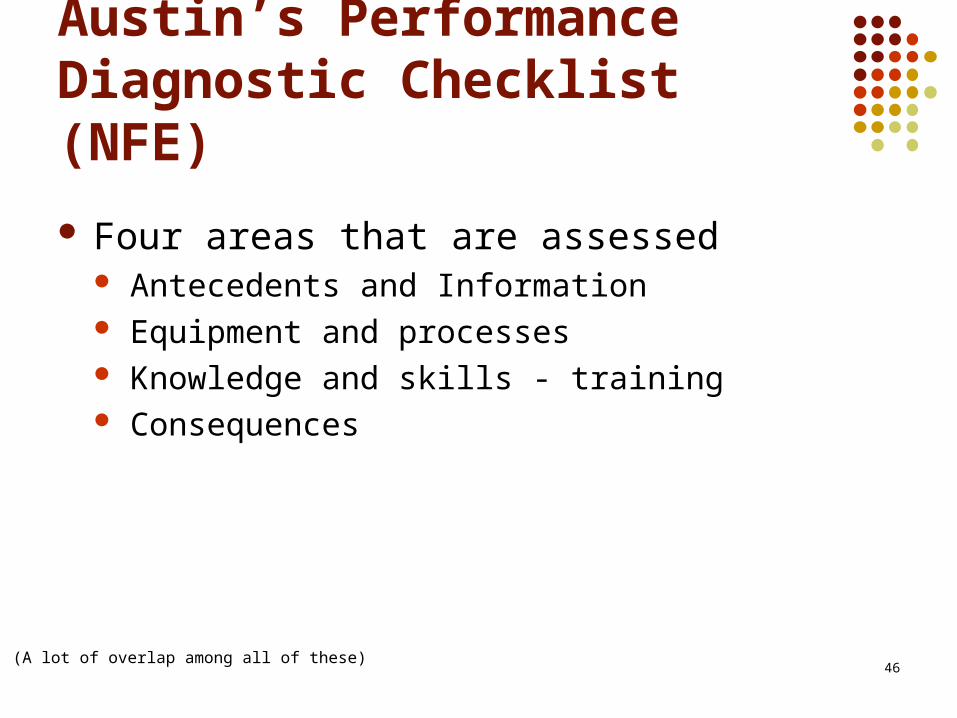
Austin’s Performance Diagnostic Checklist (NFE)
Four areas that are assessed Antecedents and Information Equipment and processes Knowledge and skills - training Consequences
(A lot of overlap among all of these)

47
NFE: Comparison of Assessment Procedures
No one has compared the relative effectiveness of different types of assessment procedures*
There have been studies published focusing on the use of, in particular, the PDC to determine barriers to performance, but none of these compared the use of the PDC to any other procedure or determined whether its use resulted in a better or more efficient determination of the barriers than even an “arm chair” analysis
My guess is none is going to be found to be better than the others, given that most of them do target the same variables (which is a good thing; that shows we have consensus on what those variables are)
However, I could be very wrong about that Heather’s class: Mager & Pipe vs. PDC, antecedents vs. consequences Nate Bechtel’s dissertation
(cont. on next slide)
*Johnson, Casella, McGee, & Lee (2014)

48
NFE: Comparison of Assessment Procedures I would suggest, nonetheless, that from an organizational/systems
perspective, the assessment tools that include an analysis of processes, would be better than those that don’t include such an analysis
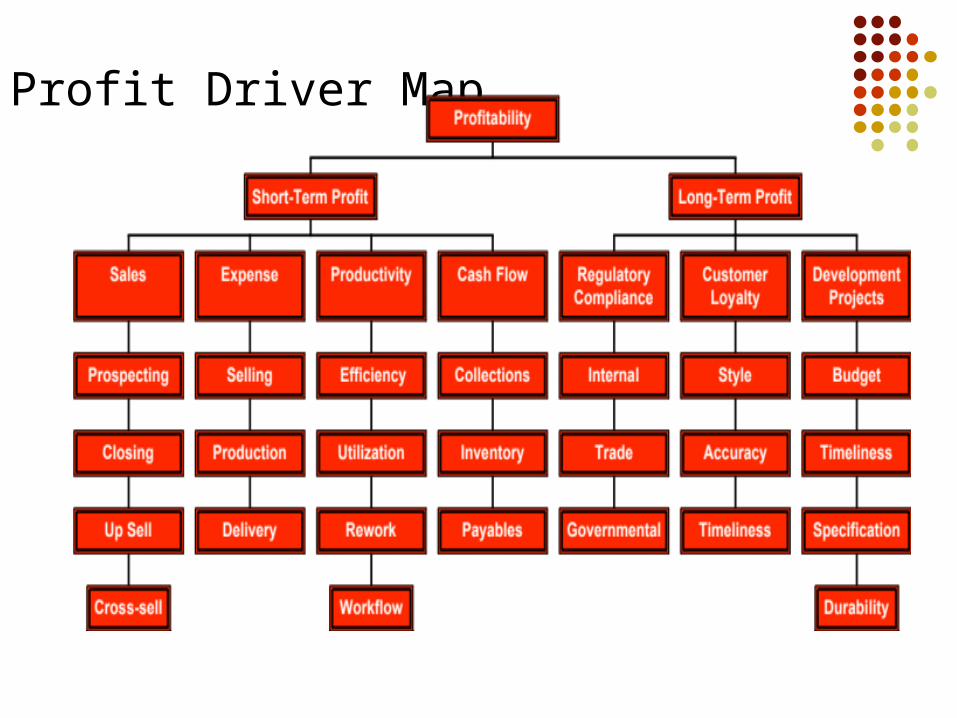
And, I would like to see someone use/develop an assessment tool that is based on the systems analysis that Bill Abernathy first presented at ABAI in 2005 and later published in articles below. The seven employee drivers or organizational success: expense control,
productivity, sales, cash flow, regulatory compliance, customer satisfaction, and special projects
Profit driver map
(profit driver map, next slide – just FYI; it’s exquisite)
Abernathy, W. B. (2010). A comprehensive performance analysis method. Performance Improvement, 49(5), 5-17.Abernathy, W. B. (2013). Behavioral approaches to business and industrial problems: Organizational Behavior Management. In G. Madden (Ed.), APA Handbook of behavior analysis, Vol. 2 (pp 501-521).
Profit Driver Map

Pampino et al.
SOs 23, 24, 25A, & 26 on your own
50
In other words, I am only going to cover 25B!
51
SO25B intro: Lotteries Pampino et al. used a monthly lottery where each of 5 employees
had an opportunity to win $20.00 based on the number of lottery tickets they earned for each shift
(U5) Gaetani et al. used state lottery tickets to decrease cash shortages in a retail beverage chain
(U8) Green et al. used a lottery to increase extent to which human service staff conducted scheduled training with consumers in residential facility for individuals with DD and profound handicaps
(U8) Green et al. used a lottery for staff to make supervisory observations of performance more acceptable for both the staff and supervisor
(lotteries have been used in a number of studies; appear effective; benefit? Cost effective -Which certainly has advantages in human service settings – several articles in this class demonstrating effectiveness of lotteries; in factone of the very first articles in OBM, Pedalino & Gamboa used a lottery system to increase attendance – based on the best poker hand – reallycool study! 1974, JAP )
52
SO25B What influences the effectiveness of lotteries?
What factors could influence how effective a lottery is?
1. Amount of money/strength of reward2. Frequency of lottery: the more frequent the better3. Number of eligible employees (affects chances)
(how/why? clearly, however, be careful – “gambling” issue”; bible belt)

Anderson et al.Task Clarification
Task clarification improves performance moderately
When combined with feedback, much better!
53(really should come as no surprise; task clarification is an antecedent intervention)
54
Anderson et al. article, one of Hantula’s first studies
Fun study, because it was done in a student-run university bar
“Cleaning was an ancillary requirement and also pre-empted time that could be spent with peers or studying. The result was a conspicuous, pervasive accumulation of grease and various sticky materials on virtually every surface. Garbage areas were strewn with debris.”
University officials said the bar had been a near-impossible management situation for years, and the State Board of Health threatened closure.
(again, I am just going to go over a few selected SOs)
Anderson et al. overview 30 student employees 11 work areas, each with a separate task list Each task list had 5-10 Yes/No items on it Assistant managers scored the cleanliness of
each area after line employees finished work Task clarification: checklists were posted in
relevant areas Feedback: Individual line graphs, coded by
number, were publicly posted
55
56
SOs 28 and 30: Effects of task clarification and task clarification plus feedback
Task clarification increased task completion 13% over baseline
Task clarification plus feedback increased task completion 62% over baseline
(last slide on this study, not covering SO29 in lecture)

Komaki
The OSTI:
Operant Supervisory
Taxonomy & Index
57

Intro: Komaki’s Operant Supervisory Taxonomy & Index (OSTI)
This is the only supervisory/managerial assessment tool based on behavioral principles that is available in the literature
Komaki and colleagues published a series of three articles and a book containing research results from field studies First article – development and psychometric
soundness of the OSTI Second article – the one I have assigned Third article – the one I mention in the SOs as one of
my all time favorite articles; sailboat regatta
58(companies, consulting firms, have own assessment questionnaires, but proprietary; research;Judi is now retired, but was one of the best field researchers in OBM)

Intro: Komaki’s OSTI
Most recent article, JOBM 2011, summarizes all of the research, discusses an in-basket assessment procedure, and then the results of a training program for managers/supervisors
Full reference is in the study objectives In my personal opinion, this should be required reading for
all students who study OBM Finally, also the book:
Komaki, J. L. (1998). Leadership from an operant perspective. London: Routledge.
I chose to use one of Komaki’s earlier study that provides more detail about the actual assessment tool for this class
59

Intro: Komaki’s OSTI Leadership consists of more than supervisory
behavior but clearly one function of a leader is to be an effective supervisor
As I indicate in the SOs, many non-behavioral theories exist Trait theories: general traits that make a person an
effective supervisor (see Aamodt, chapter 12) Situational theories: factors that interact with the
traits/characteristics of the person (see Aamodt, chapter 12)
60

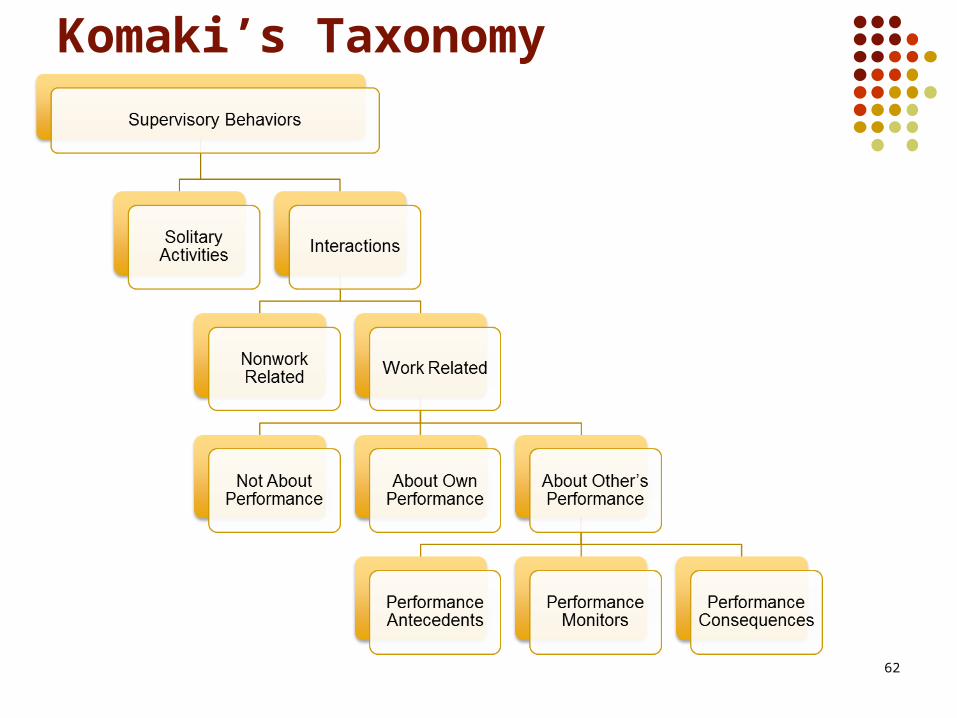
Intro: Komaki’s OSTI Komaki’s analysis is based on the extent to
which supervisors: Provide antecedents (task clarification and clear
expectations for performance) Monitor performance (measure and collect information
about the performance of direct reports) Provide consequences for performance
61
Komaki’s Taxonomy
62
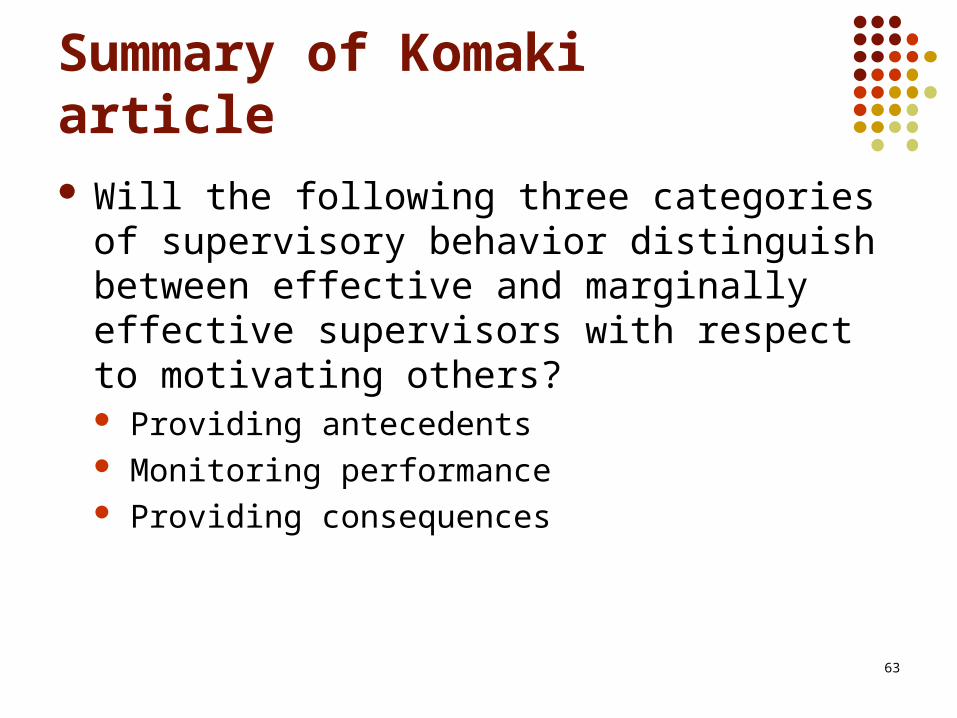
Summary of Komaki article Will the following three categories of supervisory
behavior distinguish between effective and marginally effective supervisors with respect to motivating others? Providing antecedents Monitoring performance Providing consequences
63
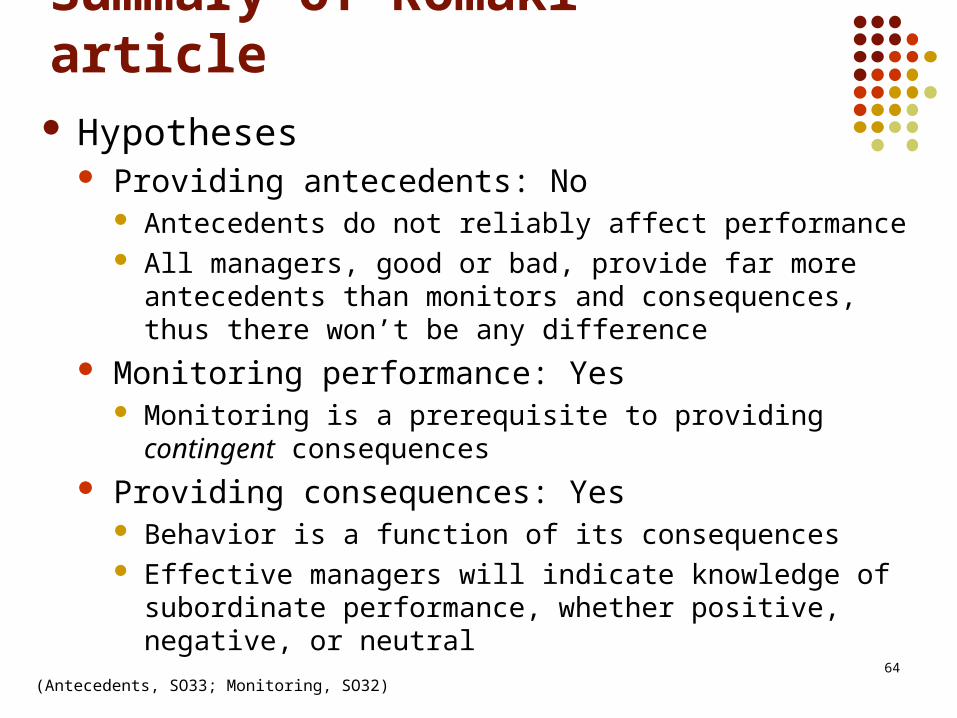
Summary of Komaki article Hypotheses
Providing antecedents: No Antecedents do not reliably affect performance All managers, good or bad, provide far more antecedents than
monitors and consequences, thus there won’t be any difference
Monitoring performance: Yes Monitoring is a prerequisite to providing contingent
consequences Providing consequences: Yes
Behavior is a function of its consequences Effective managers will indicate knowledge of subordinate
performance, whether positive, negative, or neutral
64
(Antecedents, SO33; Monitoring, SO32)

Komaki article method Participants
24 managers at a medical insurance firm Design
Extreme or contrasted groups design 12 managers in the top 28% of managers at the firm 12 managers in the bottom 28% of managers at the firm
Identification of Effective and Marginal Managers Division VPs ranked and rated all managers on how well
they motivated others Identification of Knowledgeable and Marginal Mgrs.
Division VPs ranked and rated all managers in terms of technical expertise
65(knowledge ranking/rating really cool – were supervisory behaviors NOT related to technical expertise; they shouldn ’tbe; supervisory skills and technical expertise are different)

Komaki results Managers spent only ~13% of their time dealing
with the performance of others (SO36)* This is important to remember when we intervene –
managers have many other responsibilities, thus time management and the labor-intensiveness of our interventions becomes an important issue
Effective managers monitored performance significantly more than marginal managers (SO31) Effective managers used work sampling rather than self-
report or a secondary source (i.e., “is Mary doing the accounts well?”) when monitoring performance
66
*In other studies, bank managers spent ~15% of their time dealingwith the performance of others; newspaper managers spent ~14%

Komaki results Performance monitoring was not related to technical
expertise (as predicted) (SO37) Implication: Just because you are an expert in your field
doesn’t mean you are a good manager Performance consequences did not distinguish
between effective and marginal supervisors Results may mean that it is not the number of
consequences provided, but whether contingent consequences are provided, which performance monitoring makes possible
Performance monitoring may be an establishing operation for employees that makes consequences more reinforcing or punishing (more on this next unit)
67(if a supervisor monitors your performance, it makes his/her consequences more effective)

Results, subsequent studies, NFE
When performance monitoring was sufficient, consequences did distinguish between effective and marginal managers
In a sailboat regatta, both performance monitoring and consequences by skippers were significantly related to race results
In an Australian police force, both performance monitoring and consequences by patrol sergeants were significantly related to higher-performing teams
In a national movie theater management company, managers who monitored work were perceived as more fair Workers rated managers as more positive and less negative when they monitored work and provided consequences
than when managers only monitored work or only provided consequences (simulated study in a post office)
68
Performance
Attitudes and perceptions
THE END
Questions?
69


![AMD Radeon™ HD 6450 - HISdigital1]… · Use of this copyright protection technology must be ... latest documentation. ii AMD Radeon™ HD 6450 ... 4.1 AMD Radeon HD 6450 Connections](https://static.fdocuments.us/doc/165x107/5b2d59c87f8b9ab66e8bd1cc/amd-radeon-hd-6450-1-use-of-this-copyright-protection-technology-must.jpg)


![CSCU Psychology Transfer Pathway - ct Pathway Documents.2017.… · 41 PSY 205, 206, 207 (Adolesc Dev) PSY 363 (Adol Psy) [PSY Elective #2] 42 PSY 208 (Adult Dev) PSY 364 (Adult Dev)](https://static.fdocuments.us/doc/165x107/5fd698b16564d4287628efd2/cscu-psychology-transfer-pathway-ct-pathway-documents2017-41-psy-205-206.jpg)
