
1 Uncoordinated Management of Karnafuli River Basin Emaduddin AHMAD, PEng. Executive Director,...
15
1 Uncoordinated Management of Karnafuli River Basin Emaduddin AHMAD, PEng. Executive Director, Institute of Water Modelling 21 March, 2009 5 World water Forum Session 6.2.3
-
Upload
jeffry-hopkins -
Category
Documents
-
view
218 -
download
6
Transcript of 1 Uncoordinated Management of Karnafuli River Basin Emaduddin AHMAD, PEng. Executive Director,...

11
Uncoordinated Management of Karnafuli River Basin
Emaduddin AHMAD, PEng.
Executive Director, Institute of Water Modelling21 March, 2009
5 World water ForumSession 6.2.3

22
Management of Karnafuli River Basin
Total basin area: 12,500 sq. km. (approx.)
I N D I A
Kaptai HydroPower Plant
Creation of two lakes after 1962Lake area: 780 sq.km.
3500cumec

33
Chittagong

44
Paper &Rayon mill
Port
City
F. Factory
WTP
Kaptai dam
PowerPlant
PowerPlant
0
500
1,000
1,500
2,000
2,500
3,000
3,500
4,000
Jan Feb Mar Apr May jun Jul Aug Sep Oct Nov Dec
Infl
ow
& R
elea
se (
MC
M)
Average Inflow Average Release
80% inflow in monsoon66% release in monsoon
Hydropower
Flood alleviation
Flow augmentation
Salinity control
Navigation
Hydropower
Flood alleviation
Flow augmentation
Salinity control
Navigation

55
Paper &Rayon mill
Port
City
F. Factory
WTP
Kaptai dam
PowerPlant
PowerPlant
Rangamati
Nannerchar Langadu
Barkal
Baghaichari
Current practice and issues in Karnafuli Basin management
Fringe area inundation / drying
Water flow for effluent discharge and navigation
Water availabilityAdditional Power generation
Cooling water depth
Salinity control
Water quality
Flood-free environment and adequate irrigation water
Siltation
Drainage potential
Optimum dam release and sustainable river flow can resolve many of these issues. Mathematical models provide required analytical
basis in an integrated way to make appropriate decisions.
34.14
32.3131.09
29.57
27.74
25.91
28.35
29.87
32.92
35.0535.97
35.05
24
26
28
30
32
34
36
38
Jan Feb Mar Apr May Jun Jul Aug Sep Oct Nov Dec
Re
se
rvo
ir le
vel m
, PW
D
Highest allow able w ater level Low est allow able w ater level
Rule curve for reservoir operation
Upstream issues
Downstream issues
After 46 years of operation
70
75
80
85
90
95
100
105
110
115
Nov-94 Jan-95 Feb-95 Apr-95 May-95 Jul-95 Sep-95 Oct-95 Dec-95 Feb-96
Res
ervo
ir L
evel
, F
t (M
SL
)
70
75
80
85
90
95
100
105
110
115
Nov-94 Jan-95 Feb-95 Apr-95 May-95 Jul-95 Sep-95 Oct-95 Dec-95 Feb-96
Res
ervo
ir L
evel
, F
t (M
SL
)

66
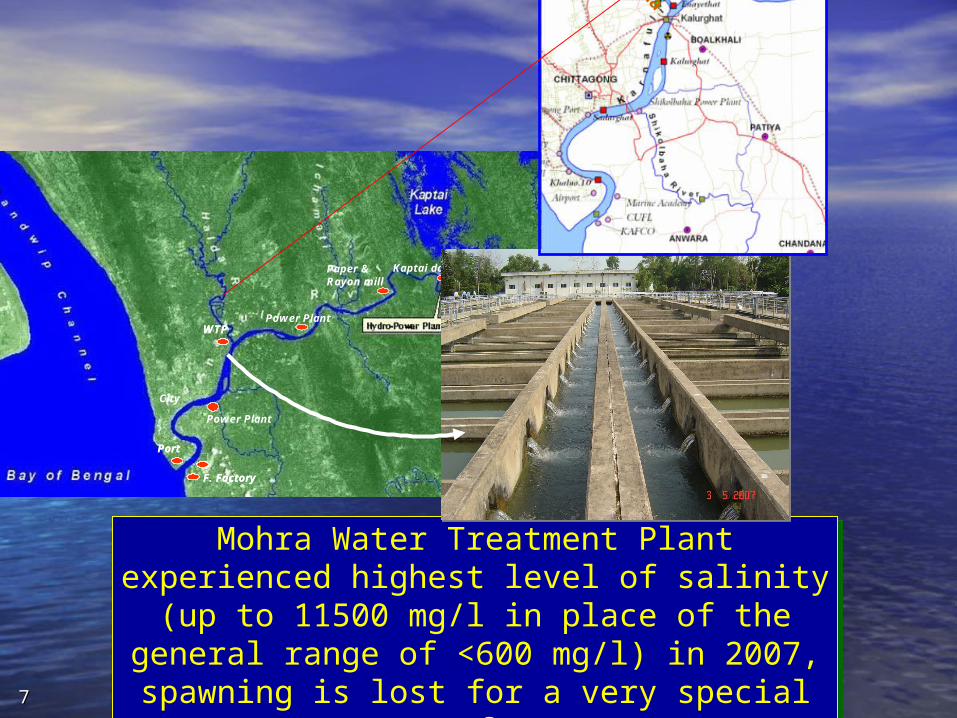
Salinity level at the Mohra Water Treatment Plant
Causes of Salinity Build-up at Halda outfall (Mohara)Decrease in freshwater flow from upstreamHigh tide level
0
2000
4000
6000
8000
10000
12000
29-Dec-06 08-Jan-07 18-Jan-07 28-Jan-07 07-Feb-07 17-Feb-07 27-Feb-07 09-Mar-07 19-Mar-07 29-Mar-07 08-Apr-07
Ch
lori
de (
mg
/l)
Raw (min) Raw (max) Treated (min) Treated (max)
January-March, 2007
Allowable limit: 600 mg/l
77
Mohra Water Treatment Plant experienced highest level of salinity (up to 11500 mg/l in place
of the general range of <600 mg/l) in 2007, spawning is lost for a very special type of carp
Mohra Water Treatment Plant experienced highest level of salinity (up to 11500 mg/l in place
of the general range of <600 mg/l) in 2007, spawning is lost for a very special type of carp
Paper &Rayon mill
City
F. Factory
Port
Kaptai dam
Power Plant
Power Plant
WTP
Paper &Rayon mill
City
F. FactoryF. Factory
PortPort
Kaptai dam
Power Plant
Power Plant
WTPWTPHalda

88
Adverse effect of uncoordinated dam releaseAdverse effect of uncoordinated dam release
•Salinity at Mohora Treatment Plant rose to 12000 Salinity at Mohora Treatment Plant rose to 12000 ppm resulting closure of treatment plant causing ppm resulting closure of treatment plant causing enormous suffering to people of port cityenormous suffering to people of port city
•The rare species of carp at Halda (requiring specific The rare species of carp at Halda (requiring specific level of salinity) has been disappearing since last few level of salinity) has been disappearing since last few yearsyears
All these require an ensured supply of fresh waterAll these require an ensured supply of fresh waterfrom reservoir during January to April (even by from reservoir during January to April (even by resheduling the power generation – but it did not resheduling the power generation – but it did not happen) happen) Similar event occurred this year due to release of
flow in earlier months with no regards for urban water supply. An institution to negotiate with appropriate tool is absent.

99
Reservoir Operation ModelA Decision Support System (DSS) for Optimum Reservoir
Operation
A comprehensive database of all hydrological, reservoir
and powerhouse data
A GIS interface for generating inundation maps
A reservoir inflow prediction model
Integration of the tools to build a Decision
Support System (DSS) for reservoir operation
ROM
Elevation-storage curve
Rule curves
Rainfall
Evaporation
Input
Initial lake water level
Power house data
Tail rating curves
Output
Lake water level
Spillway release
Generation
Tail water level
Inundation map of lake
Turbine release
A comprehensive database of all hydrological, reservoir
and powerhouse data
A GIS interface for generating inundation maps
A reservoir inflow prediction model
Integration of the tools to build a Decision
Support System (DSS) for reservoir operation
ROM
Elevation-storage curve
Rule curves
Rainfall
Evaporation
Input
Initial lake water level
Power house data
Tail rating curves
Elevation-storage curve
Rule curves
Rainfall
Evaporation
Input
Initial lake water level
Power house data
Tail rating curves
Output
Lake water level
Spillway release
Generation
Tail water level
Inundation map of lake
Turbine release
Output
Lake water level
Spillway release
Generation
Tail water level
Inundation map of lake
Turbine release
Database Inflow prediction
Simulation
Result presentation
Main Interface of ROM

1010
11 22
Reservoir Operation Model
Result presentation module

1111
Operation dependent land availability
Helped to build confidence in ethnic groups
Reservoir Operation Model Inundation mapping module

1212
ConclusionConclusion
Salinity rise at Mohra or irrigation water shortage at halda/Ichamoti is only due to absence of basin level planning and operation.
A River Basin Organisation (RBO) can be a suitable platform to implement IWRM.
How to work with agencies having diversified ineterst and chain of command

1313
Institutional NeedInstitutional Need
Institution required forInstitution required for
• Equitable participation of stakeholdersEquitable participation of stakeholders
• Output disseminationOutput dissemination
• Participatory planningParticipatory planning
• Sharing knowledge/constrainSharing knowledge/constrain
Public representatives/NGO/Local administrationFlood map
Upstream farmersFlood map
IndustriesTail water level
BWDBReservoir releaseTail water level
BPDBInflow forecast, Spillway release,Flood mapTail water level
IWMFeedback & update
Fisheries and navigationWater level and Extent
Tour operatorFlood map

1414
Institutional Framework
Water Resource Planning Organization
DSS housed at PDB, KaptaiRiver Basin Unit
Upstream stakeholder committee
Downstream stakeholder committee
Initial setup of RBO under WARPO with DSS is being worked out

1515