1. Thinking ahead to the November election, how …...Do you have a favorable or unfavorable...
290
Table of contents Banner 1 Table market Table q1 Table q2 Table q3 Table q4 Table q5 Table q6 Table q7a Table q7b Table q7Summ Table q8 Table corona_1 Table corona_2 Table corona_3 Table q10 Table q11a Table q11b Table q11_Summ Table age Table q13 Table q14a Table q14b Table q14_SUMM 13. Which two of the following issues do you believe are the most important issues facing the country? [Select up to 2] 14a. In politics today, do you generally consider yourself .... a republican, a democrat, an independent or something else? 14b. Do you think of yourself closer to the Republican Party or Democratic Party? 14. Party Summary 11a. If the election for US Congress were being held today, for whom would you vote.... the Republican candidate or the Democrat candidate? 11b. Would you say you are leaning toward the Republican candidate or leaning toward the Democrat candidate? 11. Summary Generic US Congress 12. Age 8. Do you approve or disapprove of the way President Trump is handling the Coronavirus crisis? CORONAVIRUS 1. With over 60,000 Americans dead from the pandemic, how worried are you that you, or someone close to you, will be infected with coronavirus? CORONAVIRUS 2. Which statement do you agree with, or agree with more: "It's time for people to get back to work." or "It's too early to lift stay-at-home restrictions." CORONAVIRUS 3. Which statement do you agree with, or agree with more: "We should re-open the economy, even if that means more people will get coronavirus." or "We should continue the shelter-in-place restrictions, even if that means severe job losses and economic disruption." 10. Do you think it was fair or unfair that Democrat President Obama's administration investigated and surveilled Republican Donald Trump as both a presidential candidate and president-elect for allegedly colluding with Russia? Media Market 1. Thinking ahead to the November election, how likely would you say you are to vote in these elections? Would you say you are… 2. Do you think the country is going in the right direction, or have things pretty seriously gone off on the wrong track? 3. Do you think the economy is going in the right direction, or have things pretty seriously gone off on the wrong track? 4. Do you approve or disapprove of the job Donald Trump is doing as President? Would that be strongly or somewhat (approve or disapprove)? 5. Do you think the impeachment of President Trump was good for the country, bad for the country, or did the impeachment not really matter that much? 6. Do you have a favorable or unfavorable impression of Donald Trump? 7a. If the election for President were being held today, and the candidates were Donald Trump and Joe Biden, for whom would you vote? 7b. Would you say you are leaning toward Donald Trump or leaning toward Joe Biden? 7. Biden Ballot Summary Restoration PAC, Pennsylvania Statewide - May 2020 Banner 1 Page 1 of 290
Transcript of 1. Thinking ahead to the November election, how …...Do you have a favorable or unfavorable...

Table of contents
Banner 1
Table market
Table q1
Table q2
Table q3
Table q4
Table q5
Table q6
Table q7a
Table q7b
Table q7Summ
Table q8
Table corona_1
Table corona_2
Table corona_3
Table q10
Table q11a
Table q11b
Table q11_Summ
Table age
Table q13
Table q14a
Table q14b
Table q14_SUMM
13. Which two of the following issues do you believe are the most important issues facing the country? [Select up to 2]
14a. In politics today, do you generally consider yourself .... a republican, a democrat, an independent or something else?
14b. Do you think of yourself closer to the Republican Party or Democratic Party?
14. Party Summary
11a. If the election for US Congress were being held today, for whom would you vote.... the Republican candidate or the Democrat candidate?
11b. Would you say you are leaning toward the Republican candidate or leaning toward the Democrat candidate?
11. Summary Generic US Congress
12. Age
8. Do you approve or disapprove of the way President Trump is handling the Coronavirus crisis?
CORONAVIRUS 1. With over 60,000 Americans dead from the pandemic, how worried are you that you, or someone close to you, will be infected with coronavirus?
CORONAVIRUS 2. Which statement do you agree with, or agree with more: "It's time for people to get back to work." or "It's too early to lift stay-at-home restrictions."
CORONAVIRUS 3. Which statement do you agree with, or agree with more: "We should re-open the economy, even if that means more people will get coronavirus." or "We
should continue the shelter-in-place restrictions, even if that means severe job losses and economic disruption."
10. Do you think it was fair or unfair that Democrat President Obama's administration investigated and surveilled Republican Donald Trump as both a presidential candidate
and president-elect for allegedly colluding with Russia?
Media Market
1. Thinking ahead to the November election, how likely would you say you are to vote in these elections? Would you say you are…
2. Do you think the country is going in the right direction, or have things pretty seriously gone off on the wrong track?
3. Do you think the economy is going in the right direction, or have things pretty seriously gone off on the wrong track?
4. Do you approve or disapprove of the job Donald Trump is doing as President? Would that be strongly or somewhat (approve or disapprove)?
5. Do you think the impeachment of President Trump was good for the country, bad for the country, or did the impeachment not really matter that much?
6. Do you have a favorable or unfavorable impression of Donald Trump?
7a. If the election for President were being held today, and the candidates were Donald Trump and Joe Biden, for whom would you vote?
7b. Would you say you are leaning toward Donald Trump or leaning toward Joe Biden?
7. Biden Ballot Summary
Restoration PAC, Pennsylvania Statewide - May 2020 Banner 1 Page 1 of 290

Table ballot
Table q15
Table q16
Table q17
15. What was the last grade you completed in school?
16. Thinking about where you live, do you consider it to be urban, suburban or rural?
17. Gender
BALLOT. If a mail-in ballot was mailed to you, how likely would you be to vote by mail this fall, as opposed to voting in-person at your polling place?
Restoration PAC, Pennsylvania Statewide - May 2020 Banner 1 Page 2 of 290

Media Market
Total
---------
Gender
Male
---------
Gender
Female
---------
Yng Adlt
18-34
---------
Fam Age
35-54
---------
Seniors
55+
---------
High
School
---------
College
---------
College+
---------
600 286 314 115 189 273 156 312 130
100.00% 100.00% 100.00% 100.00% 100.00% 100.00% 100.00% 100.00% 100.00%
600 286 314 115 189 273 156 312 130
100.00% 100.00% 100.00% 100.00% 100.00% 100.00% 100.00% 100.00% 100.00%
3 2 1 1 1 1 - 2 1
0.50% 0.70% 0.32% 0.87% 0.53% 0.37% 0.64% 0.77%
248 120 128 58 68 114 53 128 65
41.33% 41.96% 40.76% 50.43% 35.98% 41.76% 33.97% 41.03% 50.00%
132 65 67 22 48 54 34 71 27
22.00% 22.73% 21.34% 19.13% 25.40% 19.78% 21.79% 22.76% 20.77%
1 1 - - 1 - 1 - -
0.17% 0.35% 0.53% 0.64%
2 2 - - 1 1 - 2 -
0.33% 0.70% 0.53% 0.37% 0.64%
19 11 8 3 4 10 7 11 1
3.17% 3.85% 2.55% 2.61% 2.12% 3.66% 4.49% 3.53% 0.77%
5 2 3 2 2 1 2 3 -
0.83% 0.70% 0.96% 1.74% 1.06% 0.37% 1.28% 0.96%
2 1 1 - - 2 1 1 -
0.33% 0.35% 0.32% 0.73% 0.64% 0.32%
89 38 51 16 33 39 27 46 16
14.83% 13.29% 16.24% 13.91% 17.46% 14.29% 17.31% 14.74% 12.31%
33 15 18 6 8 18 4 23 6
5.50% 5.24% 5.73% 5.22% 4.23% 6.59% 2.56% 7.37% 4.62%
66 29 37 7 23 33 27 25 14
11.00% 10.14% 11.78% 6.09% 12.17% 12.09% 17.31% 8.01% 10.77%
514 - BUFFALO
516 - ERIE
536 - YOUNGSTOWN
565 - ELMIRA (CORNING)
566 - HARRISBURG-LNCSTR-
LEB-YORK
574 - JOHNSTOWN-ALTOONA-
ST COLGE
577 - WILKES BARRE-
SCRANTON-HZTN
GENDER Q17
---------------------
AGE Q12
--------------------------------
EDUCATION Q15
--------------------------------
Total
Total Answering
501 - NEW YORK
504 - PHILADELPHIA
508 - PITTSBURGH
511 - WASHINGTON, DC
(HAGRSTWN)
Restoration PAC, Pennsylvania Statewide - May 2020 Banner 1 Page 3 of 290

1. Thinking ahead to the November election, how likely would you say you are to vote in these elections? Would you say you are…
Total
---------
Gender
Male
---------
Gender
Female
---------
Yng Adlt
18-34
---------
Fam Age
35-54
---------
Seniors
55+
---------
High
School
---------
College
---------
College+
---------
600 286 314 115 189 273 156 312 130
100.00% 100.00% 100.00% 100.00% 100.00% 100.00% 100.00% 100.00% 100.00%
600 286 314 115 189 273 156 312 130
100.00% 100.00% 100.00% 100.00% 100.00% 100.00% 100.00% 100.00% 100.00%
579 277 302 113 180 264 147 303 128
96.50% 96.85% 96.18% 98.26% 95.24% 96.70% 94.23% 97.12% 98.46%
21 9 12 2 9 9 9 9 2
3.50% 3.15% 3.82% 1.74% 4.76% 3.30% 5.77% 2.88% 1.54%
EDUCATION Q15
--------------------------------
Total
Total Answering
VERY LIKELY
SOMEWHAT LIKELY
GENDER Q17
---------------------
AGE Q12
--------------------------------
Restoration PAC, Pennsylvania Statewide - May 2020 Banner 1 Page 4 of 290

2. Do you think the country is going in the right direction, or have things pretty seriously gone off on the wrong track?
Total
---------
Gender
Male
---------
Gender
Female
---------
Yng Adlt
18-34
---------
Fam Age
35-54
---------
Seniors
55+
---------
High
School
---------
College
---------
College+
---------
600 286 314 115 189 273 156 312 130
100.00% 100.00% 100.00% 100.00% 100.00% 100.00% 100.00% 100.00% 100.00%
600 286 314 115 189 273 156 312 130
100.00% 100.00% 100.00% 100.00% 100.00% 100.00% 100.00% 100.00% 100.00%
230 128 102 39 70 110 66 134 30
38.33% 44.76% 32.48% 33.91% 37.04% 40.29% 42.31% 42.95% 23.08%
339 145 194 66 108 154 81 164 92
56.50% 50.70% 61.78% 57.39% 57.14% 56.41% 51.92% 52.56% 70.77%
27 10 17 8 11 8 8 13 6
4.50% 3.50% 5.41% 6.96% 5.82% 2.93% 5.13% 4.17% 4.62%
4 3 1 2 - 1 1 1 2
0.67% 1.05% 0.32% 1.74% 0.37% 0.64% 0.32% 1.54%
Total Answering
RIGHT DIRECTION
WRONG TRACK
DON’T KNOW
REFUSED
GENDER Q17
---------------------
AGE Q12
--------------------------------
EDUCATION Q15
--------------------------------
Total
Restoration PAC, Pennsylvania Statewide - May 2020 Banner 1 Page 5 of 290

3. Do you think the economy is going in the right direction, or have things pretty seriously gone off on the wrong track?
Total
---------
Gender
Male
---------
Gender
Female
---------
Yng Adlt
18-34
---------
Fam Age
35-54
---------
Seniors
55+
---------
High
School
---------
College
---------
College+
---------
600 286 314 115 189 273 156 312 130
100.00% 100.00% 100.00% 100.00% 100.00% 100.00% 100.00% 100.00% 100.00%
600 286 314 115 189 273 156 312 130
100.00% 100.00% 100.00% 100.00% 100.00% 100.00% 100.00% 100.00% 100.00%
202 114 88 32 56 104 59 114 29
33.67% 39.86% 28.03% 27.83% 29.63% 38.10% 37.82% 36.54% 22.31%
362 158 204 74 123 153 85 183 92
60.33% 55.24% 64.97% 64.35% 65.08% 56.04% 54.49% 58.65% 70.77%
32 11 21 7 9 15 11 15 6
5.33% 3.85% 6.69% 6.09% 4.76% 5.49% 7.05% 4.81% 4.62%
4 3 1 2 1 1 1 - 3
0.67% 1.05% 0.32% 1.74% 0.53% 0.37% 0.64% 2.31%
Total Answering
RIGHT DIRECTION
WRONG TRACK
DON’T KNOW
REFUSED
GENDER Q17
---------------------
AGE Q12
--------------------------------
EDUCATION Q15
--------------------------------
Total
Restoration PAC, Pennsylvania Statewide - May 2020 Banner 1 Page 6 of 290

4. Do you approve or disapprove of the job Donald Trump is doing as President? Would that be strongly or somewhat (approve or disapprove)?
Total
---------
Gender
Male
---------
Gender
Female
---------
Yng Adlt
18-34
---------
Fam Age
35-54
---------
Seniors
55+
---------
High
School
---------
College
---------
College+
---------
600 286 314 115 189 273 156 312 130
100.00% 100.00% 100.00% 100.00% 100.00% 100.00% 100.00% 100.00% 100.00%
600 286 314 115 189 273 156 312 130
100.00% 100.00% 100.00% 100.00% 100.00% 100.00% 100.00% 100.00% 100.00%
268 140 128 46 83 127 82 148 38
44.67% 48.95% 40.76% 40.00% 43.92% 46.52% 52.56% 47.44% 29.23%
46 28 18 7 14 21 13 24 9
7.67% 9.79% 5.73% 6.09% 7.41% 7.69% 8.33% 7.69% 6.92%
18 9 9 4 7 7 5 9 4
3.00% 3.15% 2.87% 3.48% 3.70% 2.56% 3.21% 2.88% 3.08%
256 106 150 56 83 113 52 125 77
42.67% 37.06% 47.77% 48.70% 43.92% 41.39% 33.33% 40.06% 59.23%
12 3 9 2 2 5 4 6 2
2.00% 1.05% 2.87% 1.74% 1.06% 1.83% 2.56% 1.92% 1.54%
314 168 146 53 97 148 95 172 47
52.33% 58.74% 46.50% 46.09% 51.32% 54.21% 60.90% 55.13% 36.15%
274 115 159 60 90 120 57 134 81
45.67% 40.21% 50.64% 52.17% 47.62% 43.96% 36.54% 42.95% 62.31%
Total Answering
STRONGLY APPROVE
SOMEWHAT APPROVE
SOMEWHAT DISAPPROVE
STRONGLY DISAPPROVE
DON’T KNOW/NO ANSWER
Total Approve
Total Disapprove
GENDER Q17
---------------------
AGE Q12
--------------------------------
EDUCATION Q15
--------------------------------
Total
Restoration PAC, Pennsylvania Statewide - May 2020 Banner 1 Page 7 of 290

5. Do you think the impeachment of President Trump was good for the country, bad for the country, or did the impeachment not really matter that much?
Total
---------
Gender
Male
---------
Gender
Female
---------
Yng Adlt
18-34
---------
Fam Age
35-54
---------
Seniors
55+
---------
High
School
---------
College
---------
College+
---------
600 286 314 115 189 273 156 312 130
100.00% 100.00% 100.00% 100.00% 100.00% 100.00% 100.00% 100.00% 100.00%
600 286 314 115 189 273 156 312 130
100.00% 100.00% 100.00% 100.00% 100.00% 100.00% 100.00% 100.00% 100.00%
107 44 63 23 29 47 27 47 32
17.83% 15.38% 20.06% 20.00% 15.34% 17.22% 17.31% 15.06% 24.62%
289 161 128 53 89 136 79 162 48
48.17% 56.29% 40.76% 46.09% 47.09% 49.82% 50.64% 51.92% 36.92%
204 81 123 39 71 90 50 103 50
34.00% 28.32% 39.17% 33.91% 37.57% 32.97% 32.05% 33.01% 38.46%
AGE Q12
--------------------------------
EDUCATION Q15
--------------------------------
Total
Total Answering
GOOD
BAD
DOESN'T MATTER/DON'T
KNOW
GENDER Q17
---------------------
Restoration PAC, Pennsylvania Statewide - May 2020 Banner 1 Page 8 of 290

6. Do you have a favorable or unfavorable impression of Donald Trump?
Total
---------
Gender
Male
---------
Gender
Female
---------
Yng Adlt
18-34
---------
Fam Age
35-54
---------
Seniors
55+
---------
High
School
---------
College
---------
College+
---------
600 286 314 115 189 273 156 312 130
100.00% 100.00% 100.00% 100.00% 100.00% 100.00% 100.00% 100.00% 100.00%
600 286 314 115 189 273 156 312 130
100.00% 100.00% 100.00% 100.00% 100.00% 100.00% 100.00% 100.00% 100.00%
243 130 113 38 72 119 79 133 31
40.50% 45.45% 35.99% 33.04% 38.10% 43.59% 50.64% 42.63% 23.85%
53 28 25 12 20 19 10 33 10
8.83% 9.79% 7.96% 10.43% 10.58% 6.96% 6.41% 10.58% 7.69%
11 6 5 2 1 6 4 5 1
1.83% 2.10% 1.59% 1.74% 0.53% 2.20% 2.56% 1.60% 0.77%
24 11 13 7 9 8 6 10 8
4.00% 3.85% 4.14% 6.09% 4.76% 2.93% 3.85% 3.21% 6.15%
268 111 157 55 87 121 57 131 79
44.67% 38.81% 50.00% 47.83% 46.03% 44.32% 36.54% 41.99% 60.77%
- - - - - - - - -
1 - 1 1 - - - - 1
0.17% 0.32% 0.87% 0.77%
296 158 138 50 92 138 89 166 41
49.33% 55.24% 43.95% 43.48% 48.68% 50.55% 57.05% 53.21% 31.54%
292 122 170 62 96 129 63 141 87
48.67% 42.66% 54.14% 53.91% 50.79% 47.25% 40.38% 45.19% 66.92%
Total Favorable
Total Unfavorable
Total
Total Answering
Strongly FAVORABLE
Somewhat FAVORABLE
NO OPINION
Somewhat UNFAVORABLE
Strongly UNFAVORABLE
DON’T KNOW/NOT SURE
REFUSED
GENDER Q17
---------------------
AGE Q12
--------------------------------
EDUCATION Q15
--------------------------------
Restoration PAC, Pennsylvania Statewide - May 2020 Banner 1 Page 9 of 290

7a. If the election for President were being held today, and the candidates were Donald Trump and Joe Biden, for whom would you vote?
Total
---------
Gender
Male
---------
Gender
Female
---------
Yng Adlt
18-34
---------
Fam Age
35-54
---------
Seniors
55+
---------
High
School
---------
College
---------
College+
---------
600 286 314 115 189 273 156 312 130
100.00% 100.00% 100.00% 100.00% 100.00% 100.00% 100.00% 100.00% 100.00%
600 286 314 115 189 273 156 312 130
100.00% 100.00% 100.00% 100.00% 100.00% 100.00% 100.00% 100.00% 100.00%
286 151 135 49 85 137 87 160 39
47.67% 52.80% 42.99% 42.61% 44.97% 50.18% 55.77% 51.28% 30.00%
15 13 2 3 8 3 4 10 1
2.50% 4.55% 0.64% 2.61% 4.23% 1.10% 2.56% 3.21% 0.77%
22 13 9 3 6 12 6 10 6
3.67% 4.55% 2.87% 2.61% 3.17% 4.40% 3.85% 3.21% 4.62%
15 7 8 3 5 6 7 6 2
2.50% 2.45% 2.55% 2.61% 2.65% 2.20% 4.49% 1.92% 1.54%
258 100 158 56 85 112 50 125 81
43.00% 34.97% 50.32% 48.70% 44.97% 41.03% 32.05% 40.06% 62.31%
4 2 2 1 - 3 2 1 1
0.67% 0.70% 0.64% 0.87% 1.10% 1.28% 0.32% 0.77%
301 164 137 52 93 140 91 170 40
50.17% 57.34% 43.63% 45.22% 49.21% 51.28% 58.33% 54.49% 30.77%
22 13 9 3 6 12 6 10 6
3.67% 4.55% 2.87% 2.61% 3.17% 4.40% 3.85% 3.21% 4.62%
273 107 166 59 90 118 57 131 83
45.50% 37.41% 52.87% 51.30% 47.62% 43.22% 36.54% 41.99% 63.85%
UNDECIDED
Probably BIDEN
Definitely BIDEN
Refused
Total Trump
Total Undecided
Total Biden
GENDER Q17
---------------------
AGE Q12
--------------------------------
EDUCATION Q15
--------------------------------
Total
Total Answering
Definitely TRUMP
Probably TRUMP
Restoration PAC, Pennsylvania Statewide - May 2020 Banner 1 Page 10 of 290

7b. Would you say you are leaning toward Donald Trump or leaning toward Joe Biden?
Total
---------
Gender
Male
---------
Gender
Female
---------
Yng Adlt
18-34
---------
Fam Age
35-54
---------
Seniors
55+
---------
High
School
---------
College
---------
College+
---------
600 286 314 115 189 273 156 312 130
100.00% 100.00% 100.00% 100.00% 100.00% 100.00% 100.00% 100.00% 100.00%
26 15 11 4 6 15 8 11 7
4.33% 5.24% 3.50% 3.48% 3.17% 5.49% 5.13% 3.53% 5.38%
2 1 1 1 - 1 1 - 1
0.33% 0.35% 0.32% 0.87% 0.37% 0.64% 0.77%
21 12 9 2 5 13 6 10 5
3.50% 4.20% 2.87% 1.74% 2.65% 4.76% 3.85% 3.21% 3.85%
3 2 1 1 1 1 1 1 1
0.50% 0.70% 0.32% 0.87% 0.53% 0.37% 0.64% 0.32% 0.77%
EDUCATION Q15
--------------------------------
Total
Total Answering
LEAN TRUMP
HARD UNDECIDED
LEAN BIDEN
GENDER Q17
---------------------
AGE Q12
--------------------------------
Restoration PAC, Pennsylvania Statewide - May 2020 Banner 1 Page 11 of 290

7. Biden Ballot Summary
Total
---------
Gender
Male
---------
Gender
Female
---------
Yng Adlt
18-34
---------
Fam Age
35-54
---------
Seniors
55+
---------
High
School
---------
College
---------
College+
---------
600 286 314 115 189 273 156 312 130
100.00% 100.00% 100.00% 100.00% 100.00% 100.00% 100.00% 100.00% 100.00%
600 286 314 115 189 273 156 312 130
100.00% 100.00% 100.00% 100.00% 100.00% 100.00% 100.00% 100.00% 100.00%
303 165 138 53 93 141 92 170 41
50.50% 57.69% 43.95% 46.09% 49.21% 51.65% 58.97% 54.49% 31.54%
21 12 9 2 5 13 6 10 5
3.50% 4.20% 2.87% 1.74% 2.65% 4.76% 3.85% 3.21% 3.85%
276 109 167 60 91 119 58 132 84
46.00% 38.11% 53.18% 52.17% 48.15% 43.59% 37.18% 42.31% 64.62%
Total
Total Answering
ALL TRUMP
ALL UNDECIDED
ALL BIDEN
GENDER Q17
---------------------
AGE Q12
--------------------------------
EDUCATION Q15
--------------------------------
Restoration PAC, Pennsylvania Statewide - May 2020 Banner 1 Page 12 of 290

8. Do you approve or disapprove of the way President Trump is handling the Coronavirus crisis?
Total
---------
Gender
Male
---------
Gender
Female
---------
Yng Adlt
18-34
---------
Fam Age
35-54
---------
Seniors
55+
---------
High
School
---------
College
---------
College+
---------
600 286 314 115 189 273 156 312 130
100.00% 100.00% 100.00% 100.00% 100.00% 100.00% 100.00% 100.00% 100.00%
600 286 314 115 189 273 156 312 130
100.00% 100.00% 100.00% 100.00% 100.00% 100.00% 100.00% 100.00% 100.00%
222 114 108 40 66 102 72 123 27
37.00% 39.86% 34.39% 34.78% 34.92% 37.36% 46.15% 39.42% 20.77%
89 49 40 15 29 43 22 49 18
14.83% 17.13% 12.74% 13.04% 15.34% 15.75% 14.10% 15.71% 13.85%
24 8 16 2 6 16 7 12 5
4.00% 2.80% 5.10% 1.74% 3.17% 5.86% 4.49% 3.85% 3.85%
253 108 145 57 81 108 49 122 80
42.17% 37.76% 46.18% 49.57% 42.86% 39.56% 31.41% 39.10% 61.54%
12 7 5 1 7 4 6 6 -
2.00% 2.45% 1.59% 0.87% 3.70% 1.47% 3.85% 1.92%
311 163 148 55 95 145 94 172 45
51.83% 56.99% 47.13% 47.83% 50.26% 53.11% 60.26% 55.13% 34.62%
277 116 161 59 87 124 56 134 85
46.17% 40.56% 51.27% 51.30% 46.03% 45.42% 35.90% 42.95% 65.38%
Total Answering
STRONGLY APPROVE
SOMEWHAT APPROVE
SOMEWHAT DISAPPROVE
STRONGLY DISAPPROVE
DON’T KNOW/NO ANSWER
Total Approve
Total Disapprove
GENDER Q17
---------------------
AGE Q12
--------------------------------
EDUCATION Q15
--------------------------------
Total
Restoration PAC, Pennsylvania Statewide - May 2020 Banner 1 Page 13 of 290

CORONAVIRUS 1. With over 60,000 Americans dead from the pandemic, how worried are you that you, or someone close to you, will be infected with coronavirus?
Total
---------
Gender
Male
---------
Gender
Female
---------
Yng Adlt
18-34
---------
Fam Age
35-54
---------
Seniors
55+
---------
High
School
---------
College
---------
College+
---------
600 286 314 115 189 273 156 312 130
100.00% 100.00% 100.00% 100.00% 100.00% 100.00% 100.00% 100.00% 100.00%
600 286 314 115 189 273 156 312 130
100.00% 100.00% 100.00% 100.00% 100.00% 100.00% 100.00% 100.00% 100.00%
168 86 82 36 54 69 48 87 33
28.00% 30.07% 26.11% 31.30% 28.57% 25.27% 30.77% 27.88% 25.38%
223 117 106 38 77 101 63 120 39
37.17% 40.91% 33.76% 33.04% 40.74% 37.00% 40.38% 38.46% 30.00%
209 83 126 41 58 103 45 105 58
34.83% 29.02% 40.13% 35.65% 30.69% 37.73% 28.85% 33.65% 44.62%
AGE Q12
--------------------------------
EDUCATION Q15
--------------------------------
Total
Total Answering
NOT WORRIED
SOMEWHAT WORRIED
VERY WORRIED
GENDER Q17
---------------------
Restoration PAC, Pennsylvania Statewide - May 2020 Banner 1 Page 14 of 290

CORONAVIRUS 2. Which statement do you agree with, or agree with more: "It's time for people to get back to work." or "It's too early to lift stay-at-home restrictions."
Total
---------
Gender
Male
---------
Gender
Female
---------
Yng Adlt
18-34
---------
Fam Age
35-54
---------
Seniors
55+
---------
High
School
---------
College
---------
College+
---------
600 286 314 115 189 273 156 312 130
100.00% 100.00% 100.00% 100.00% 100.00% 100.00% 100.00% 100.00% 100.00%
600 286 314 115 189 273 156 312 130
100.00% 100.00% 100.00% 100.00% 100.00% 100.00% 100.00% 100.00% 100.00%
309 172 137 58 91 144 85 176 48
51.50% 60.14% 43.63% 50.43% 48.15% 52.75% 54.49% 56.41% 36.92%
291 114 177 57 98 129 71 136 82
48.50% 39.86% 56.37% 49.57% 51.85% 47.25% 45.51% 43.59% 63.08%
Total
Total Answering
WORK
STAY HOME
GENDER Q17
---------------------
AGE Q12
--------------------------------
EDUCATION Q15
--------------------------------
Restoration PAC, Pennsylvania Statewide - May 2020 Banner 1 Page 15 of 290

Total
---------
Gender
Male
---------
Gender
Female
---------
Yng Adlt
18-34
---------
Fam Age
35-54
---------
Seniors
55+
---------
High
School
---------
College
---------
College+
---------
600 286 314 115 189 273 156 312 130
100.00% 100.00% 100.00% 100.00% 100.00% 100.00% 100.00% 100.00% 100.00%
600 286 314 115 189 273 156 312 130
100.00% 100.00% 100.00% 100.00% 100.00% 100.00% 100.00% 100.00% 100.00%
301 166 135 58 91 136 87 168 46
50.17% 58.04% 42.99% 50.43% 48.15% 49.82% 55.77% 53.85% 35.38%
299 120 179 57 98 137 69 144 84
49.83% 41.96% 57.01% 49.57% 51.85% 50.18% 44.23% 46.15% 64.62%
CORONAVIRUS 3. Which statement do you agree with, or agree with more: "We should re-open the economy, even if that means more people will get coronavirus." or "We should continue the shelter-in-place
restrictions, even if that means severe job losses and economic disruption."
OPEN/VIRUS
SHUTDOWN/JOBS
GENDER Q17
---------------------
AGE Q12
--------------------------------
EDUCATION Q15
--------------------------------
Total
Total Answering
Restoration PAC, Pennsylvania Statewide - May 2020 Banner 1 Page 16 of 290

Total
---------
Gender
Male
---------
Gender
Female
---------
Yng Adlt
18-34
---------
Fam Age
35-54
---------
Seniors
55+
---------
High
School
---------
College
---------
College+
---------
600 286 314 115 189 273 156 312 130
100.00% 100.00% 100.00% 100.00% 100.00% 100.00% 100.00% 100.00% 100.00%
600 286 314 115 189 273 156 312 130
100.00% 100.00% 100.00% 100.00% 100.00% 100.00% 100.00% 100.00% 100.00%
235 91 144 47 70 108 50 122 62
39.17% 31.82% 45.86% 40.87% 37.04% 39.56% 32.05% 39.10% 47.69%
285 156 129 49 89 137 89 153 43
47.50% 54.55% 41.08% 42.61% 47.09% 50.18% 57.05% 49.04% 33.08%
80 39 41 19 30 28 17 37 25
13.33% 13.64% 13.06% 16.52% 15.87% 10.26% 10.90% 11.86% 19.23%
DON'T KNOW
GENDER Q17
---------------------
AGE Q12
--------------------------------
EDUCATION Q15
--------------------------------
Total
Total Answering
FAIR
NOT FAIR
10. Do you think it was fair or unfair that Democrat President Obama's administration investigated and surveilled Republican Donald Trump as both a presidential candidate and president-elect for allegedly
colluding with Russia?
Restoration PAC, Pennsylvania Statewide - May 2020 Banner 1 Page 17 of 290

11a. If the election for US Congress were being held today, for whom would you vote.... the Republican candidate or the Democrat candidate?
Total
---------
Gender
Male
---------
Gender
Female
---------
Yng Adlt
18-34
---------
Fam Age
35-54
---------
Seniors
55+
---------
High
School
---------
College
---------
College+
---------
600 286 314 115 189 273 156 312 130
100.00% 100.00% 100.00% 100.00% 100.00% 100.00% 100.00% 100.00% 100.00%
600 286 314 115 189 273 156 312 130
100.00% 100.00% 100.00% 100.00% 100.00% 100.00% 100.00% 100.00% 100.00%
248 129 119 44 72 119 79 137 32
41.33% 45.10% 37.90% 38.26% 38.10% 43.59% 50.64% 43.91% 24.62%
34 18 16 4 13 15 8 24 2
5.67% 6.29% 5.10% 3.48% 6.88% 5.49% 5.13% 7.69% 1.54%
92 51 41 19 32 38 22 42 28
15.33% 17.83% 13.06% 16.52% 16.93% 13.92% 14.10% 13.46% 21.54%
25 12 13 4 7 14 7 16 2
4.17% 4.20% 4.14% 3.48% 3.70% 5.13% 4.49% 5.13% 1.54%
198 76 122 43 64 86 39 92 65
33.00% 26.57% 38.85% 37.39% 33.86% 31.50% 25.00% 29.49% 50.00%
3 - 3 1 1 1 1 1 1
0.50% 0.96% 0.87% 0.53% 0.37% 0.64% 0.32% 0.77%
282 147 135 48 85 134 87 161 34
47.00% 51.40% 42.99% 41.74% 44.97% 49.08% 55.77% 51.60% 26.15%
223 88 135 47 71 100 46 108 67
37.17% 30.77% 42.99% 40.87% 37.57% 36.63% 29.49% 34.62% 51.54%
Probably DEMOCRAT
Definitely DEMOCRAT
Refused
Total Republican
Total Democrat
GENDER Q17
---------------------
AGE Q12
--------------------------------
EDUCATION Q15
--------------------------------
Total
Total Answering
Definitely REPUBLICAN
Probably REPUBLICAN
UNDECIDED
Restoration PAC, Pennsylvania Statewide - May 2020 Banner 1 Page 18 of 290

11b. Would you say you are leaning toward the Republican candidate or leaning toward the Democrat candidate?
Total
---------
Gender
Male
---------
Gender
Female
---------
Yng Adlt
18-34
---------
Fam Age
35-54
---------
Seniors
55+
---------
High
School
---------
College
---------
College+
---------
600 286 314 115 189 273 156 312 130
100.00% 100.00% 100.00% 100.00% 100.00% 100.00% 100.00% 100.00% 100.00%
95 51 44 20 33 39 23 43 29
15.83% 17.83% 14.01% 17.39% 17.46% 14.29% 14.74% 13.78% 22.31%
14 10 4 5 4 5 3 6 5
2.33% 3.50% 1.27% 4.35% 2.12% 1.83% 1.92% 1.92% 3.85%
63 35 28 11 24 26 17 26 20
10.50% 12.24% 8.92% 9.57% 12.70% 9.52% 10.90% 8.33% 15.38%
18 6 12 4 5 8 3 11 4
3.00% 2.10% 3.82% 3.48% 2.65% 2.93% 1.92% 3.53% 3.08%
Total Answering
LEAN GOP
HARD UNDECIDED/NOT SURE
LEAN DEM
GENDER Q17
---------------------
AGE Q12
--------------------------------
EDUCATION Q15
--------------------------------
Total
Restoration PAC, Pennsylvania Statewide - May 2020 Banner 1 Page 19 of 290

11. Summary Generic US Congress
Total
---------
Gender
Male
---------
Gender
Female
---------
Yng Adlt
18-34
---------
Fam Age
35-54
---------
Seniors
55+
---------
High
School
---------
College
---------
College+
---------
600 286 314 115 189 273 156 312 130
100.00% 100.00% 100.00% 100.00% 100.00% 100.00% 100.00% 100.00% 100.00%
600 286 314 115 189 273 156 312 130
100.00% 100.00% 100.00% 100.00% 100.00% 100.00% 100.00% 100.00% 100.00%
296 157 139 53 89 139 90 167 39
49.33% 54.90% 44.27% 46.09% 47.09% 50.92% 57.69% 53.53% 30.00%
63 35 28 11 24 26 17 26 20
10.50% 12.24% 8.92% 9.57% 12.70% 9.52% 10.90% 8.33% 15.38%
241 94 147 51 76 108 49 119 71
40.17% 32.87% 46.82% 44.35% 40.21% 39.56% 31.41% 38.14% 54.62%
ALL GOP
HARD UNDECIDED
ALL DEM
GENDER Q17
---------------------
AGE Q12
--------------------------------
EDUCATION Q15
--------------------------------
Total
Total Answering
Restoration PAC, Pennsylvania Statewide - May 2020 Banner 1 Page 20 of 290

12. Age
Total
---------
Gender
Male
---------
Gender
Female
---------
Yng Adlt
18-34
---------
Fam Age
35-54
---------
Seniors
55+
---------
High
School
---------
College
---------
College+
---------
600 286 314 115 189 273 156 312 130
100.00% 100.00% 100.00% 100.00% 100.00% 100.00% 100.00% 100.00% 100.00%
600 286 314 115 189 273 156 312 130
100.00% 100.00% 100.00% 100.00% 100.00% 100.00% 100.00% 100.00% 100.00%
34 10 24 34 - - 8 15 11
5.67% 3.50% 7.64% 29.57% 5.13% 4.81% 8.46%
81 43 38 81 - - 20 39 21
13.50% 15.03% 12.10% 70.43% 12.82% 12.50% 16.15%
91 49 42 - 91 - 20 52 19
15.17% 17.13% 13.38% 48.15% 12.82% 16.67% 14.62%
98 42 56 - 98 - 22 53 23
16.33% 14.69% 17.83% 51.85% 14.10% 16.99% 17.69%
118 55 63 - - 118 30 68 20
19.67% 19.23% 20.06% 43.22% 19.23% 21.79% 15.38%
155 75 80 - - 155 51 70 34
25.83% 26.22% 25.48% 56.78% 32.69% 22.44% 26.15%
23 12 11 - - - 5 15 2
3.83% 4.20% 3.50% 3.21% 4.81% 1.54%
115 53 62 115 - - 28 54 32
19.17% 18.53% 19.75% 100.00% 17.95% 17.31% 24.62%
189 91 98 - 189 - 42 105 42
31.50% 31.82% 31.21% 100.00% 26.92% 33.65% 32.31%
273 130 143 - - 273 81 138 54
45.50% 45.45% 45.54% 100.00% 51.92% 44.23% 41.54%
25-34
35-44
45-54
55-64
65+
Refused
Young Adult 18-34
Family Age 35-54
Seniors 55+
GENDER Q17
---------------------
AGE Q12
--------------------------------
EDUCATION Q15
--------------------------------
Total
Total Answering
18-24
Restoration PAC, Pennsylvania Statewide - May 2020 Banner 1 Page 21 of 290

13. Which two of the following issues do you believe are the most important issues facing the country? [Select up to 2]
Total
---------
Gender
Male
---------
Gender
Female
---------
Yng Adlt
18-34
---------
Fam Age
35-54
---------
Seniors
55+
---------
High
School
---------
College
---------
College+
---------
600 286 314 115 189 273 156 312 130
100.00% 100.00% 100.00% 100.00% 100.00% 100.00% 100.00% 100.00% 100.00%
600 286 314 115 189 273 156 312 130
100.00% 100.00% 100.00% 100.00% 100.00% 100.00% 100.00% 100.00% 100.00%
264 132 132 48 90 115 69 143 52
44.00% 46.15% 42.04% 41.74% 47.62% 42.12% 44.23% 45.83% 40.00%
190 88 102 32 57 92 45 98 47
31.67% 30.77% 32.48% 27.83% 30.16% 33.70% 28.85% 31.41% 36.15%
271 118 153 52 95 114 69 133 67
45.17% 41.26% 48.73% 45.22% 50.26% 41.76% 44.23% 42.63% 51.54%
77 45 32 13 31 30 23 41 13
12.83% 15.73% 10.19% 11.30% 16.40% 10.99% 14.74% 13.14% 10.00%
71 33 38 12 21 35 20 36 15
11.83% 11.54% 12.10% 10.43% 11.11% 12.82% 12.82% 11.54% 11.54%
47 22 25 9 9 27 12 21 12
7.83% 7.69% 7.96% 7.83% 4.76% 9.89% 7.69% 6.73% 9.23%
31 20 11 7 11 12 6 21 4
5.17% 6.99% 3.50% 6.09% 5.82% 4.40% 3.85% 6.73% 3.08%
79 31 48 16 23 37 11 45 23
13.17% 10.84% 15.29% 13.91% 12.17% 13.55% 7.05% 14.42% 17.69%
72 35 37 17 19 35 22 39 11
12.00% 12.24% 11.78% 14.78% 10.05% 12.82% 14.10% 12.50% 8.46%
39 22 17 5 9 24 17 19 3
6.50% 7.69% 5.41% 4.35% 4.76% 8.79% 10.90% 6.09% 2.31%
15 5 10 4 2 8 6 7 2
2.50% 1.75% 3.18% 3.48% 1.06% 2.93% 3.85% 2.24% 1.54%
EDUCATION
GUNS
FOREIGN TRADE
CLIMATE CHANGE
IMMIGRATION
IMPEACHMENT OR
INVESTIGATING GOVERNMENT
SOMETHING ELSE
GENDER Q17
---------------------
AGE Q12
--------------------------------
EDUCATION Q15
--------------------------------
Total
Total Answering
JOBS AND THE ECONOMY
HEALTH CARE
STOPPING CORONAVIRUS
NATIONAL SECURITY
Restoration PAC, Pennsylvania Statewide - May 2020 Banner 1 Page 22 of 290

14a. In politics today, do you generally consider yourself .... a republican, a democrat, an independent or something else?
Total
---------
Gender
Male
---------
Gender
Female
---------
Yng Adlt
18-34
---------
Fam Age
35-54
---------
Seniors
55+
---------
High
School
---------
College
---------
College+
---------
600 286 314 115 189 273 156 312 130
100.00% 100.00% 100.00% 100.00% 100.00% 100.00% 100.00% 100.00% 100.00%
600 286 314 115 189 273 156 312 130
100.00% 100.00% 100.00% 100.00% 100.00% 100.00% 100.00% 100.00% 100.00%
225 119 106 39 64 109 69 129 27
37.50% 41.61% 33.76% 33.91% 33.86% 39.93% 44.23% 41.35% 20.77%
34 19 15 6 11 15 9 18 7
5.67% 6.64% 4.78% 5.22% 5.82% 5.49% 5.77% 5.77% 5.38%
119 72 47 26 41 51 27 67 25
19.83% 25.17% 14.97% 22.61% 21.69% 18.68% 17.31% 21.47% 19.23%
36 16 20 5 14 15 9 14 13
6.00% 5.59% 6.37% 4.35% 7.41% 5.49% 5.77% 4.49% 10.00%
184 60 124 37 59 83 42 84 56
30.67% 20.98% 39.49% 32.17% 31.22% 30.40% 26.92% 26.92% 43.08%
2 - 2 2 - - - - 2
0.33% 0.64% 1.74% 1.54%
259 138 121 45 75 124 78 147 34
43.17% 48.25% 38.54% 39.13% 39.68% 45.42% 50.00% 47.12% 26.15%
220 76 144 42 73 98 51 98 69
36.67% 26.57% 45.86% 36.52% 38.62% 35.90% 32.69% 31.41% 53.08%
119 72 47 26 41 51 27 67 25
19.83% 25.17% 14.97% 22.61% 21.69% 18.68% 17.31% 21.47% 19.23%
Total Republican
Total Democrat
Independent
EDUCATION Q15
--------------------------------
Total
Total Answering
Strong REPUBLICAN
Not so Strong Republican
AN INDEPENDENT, OR
SOMETHING ELSE
Not so Strong DEMOCRAT
Strong DEMOCRAT
Refused
GENDER Q17
---------------------
AGE Q12
--------------------------------
Restoration PAC, Pennsylvania Statewide - May 2020 Banner 1 Page 23 of 290

14b. Do you think of yourself closer to the Republican Party or Democratic Party?
Total
---------
Gender
Male
---------
Gender
Female
---------
Yng Adlt
18-34
---------
Fam Age
35-54
---------
Seniors
55+
---------
High
School
---------
College
---------
College+
---------
600 286 314 115 189 273 156 312 130
100.00% 100.00% 100.00% 100.00% 100.00% 100.00% 100.00% 100.00% 100.00%
121 72 49 28 41 51 27 67 27
20.17% 25.17% 15.61% 24.35% 21.69% 18.68% 17.31% 21.47% 20.77%
35 27 8 6 13 16 12 17 6
5.83% 9.44% 2.55% 5.22% 6.88% 5.86% 7.69% 5.45% 4.62%
58 29 29 16 19 22 10 35 13
9.67% 10.14% 9.24% 13.91% 10.05% 8.06% 6.41% 11.22% 10.00%
28 16 12 6 9 13 5 15 8
4.67% 5.59% 3.82% 5.22% 4.76% 4.76% 3.21% 4.81% 6.15%
FIRM INDEPENDENT
LEAN DEMOCRAT
GENDER Q17
---------------------
AGE Q12
--------------------------------
EDUCATION Q15
--------------------------------
Total
Total Answering
LEAN REPUBLICAN
Restoration PAC, Pennsylvania Statewide - May 2020 Banner 1 Page 24 of 290
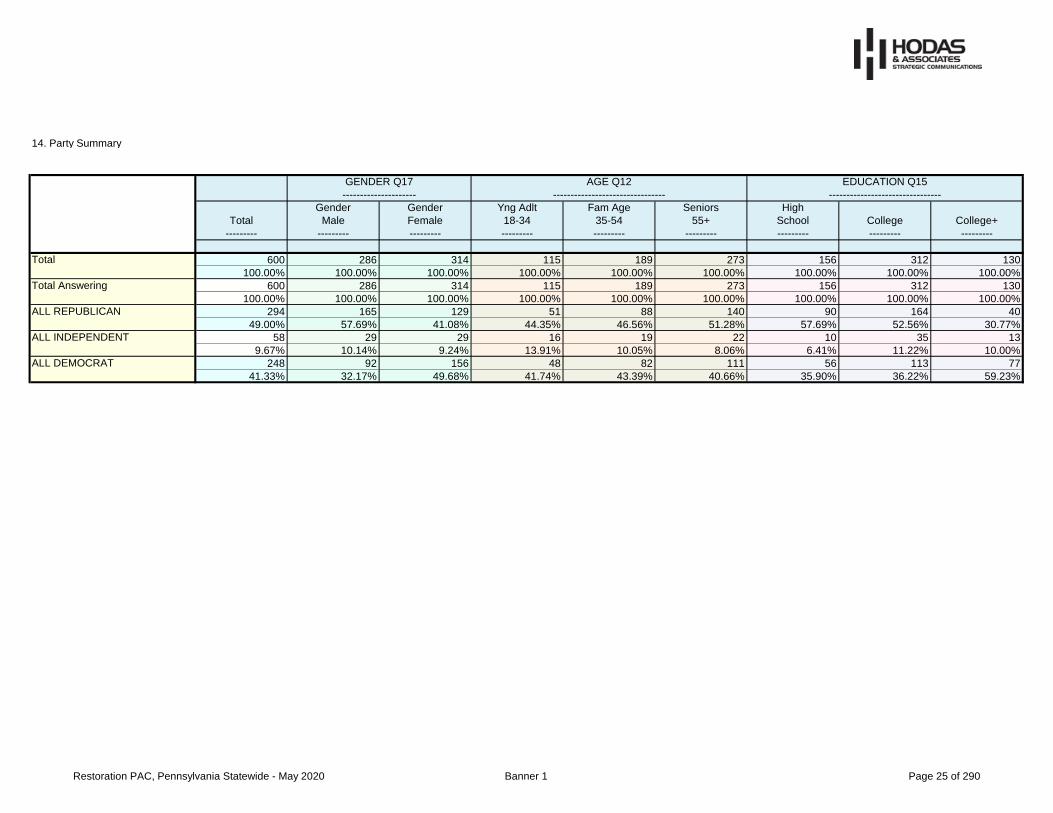
14. Party Summary
Total
---------
Gender
Male
---------
Gender
Female
---------
Yng Adlt
18-34
---------
Fam Age
35-54
---------
Seniors
55+
---------
High
School
---------
College
---------
College+
---------
600 286 314 115 189 273 156 312 130
100.00% 100.00% 100.00% 100.00% 100.00% 100.00% 100.00% 100.00% 100.00%
600 286 314 115 189 273 156 312 130
100.00% 100.00% 100.00% 100.00% 100.00% 100.00% 100.00% 100.00% 100.00%
294 165 129 51 88 140 90 164 40
49.00% 57.69% 41.08% 44.35% 46.56% 51.28% 57.69% 52.56% 30.77%
58 29 29 16 19 22 10 35 13
9.67% 10.14% 9.24% 13.91% 10.05% 8.06% 6.41% 11.22% 10.00%
248 92 156 48 82 111 56 113 77
41.33% 32.17% 49.68% 41.74% 43.39% 40.66% 35.90% 36.22% 59.23%
ALL DEMOCRAT
GENDER Q17
---------------------
AGE Q12
--------------------------------
EDUCATION Q15
--------------------------------
Total
Total Answering
ALL REPUBLICAN
ALL INDEPENDENT
Restoration PAC, Pennsylvania Statewide - May 2020 Banner 1 Page 25 of 290

BALLOT. If a mail-in ballot was mailed to you, how likely would you be to vote by mail this fall, as opposed to voting in-person at your polling place?
Total
---------
Gender
Male
---------
Gender
Female
---------
Yng Adlt
18-34
---------
Fam Age
35-54
---------
Seniors
55+
---------
High
School
---------
College
---------
College+
---------
600 286 314 115 189 273 156 312 130
100.00% 100.00% 100.00% 100.00% 100.00% 100.00% 100.00% 100.00% 100.00%
600 286 314 115 189 273 156 312 130
100.00% 100.00% 100.00% 100.00% 100.00% 100.00% 100.00% 100.00% 100.00%
84 45 39 17 25 34 17 44 23
14.00% 15.73% 12.42% 14.78% 13.23% 12.45% 10.90% 14.10% 17.69%
247 99 148 55 77 109 57 119 69
41.17% 34.62% 47.13% 47.83% 40.74% 39.93% 36.54% 38.14% 53.08%
269 142 127 43 87 130 82 149 38
44.83% 49.65% 40.45% 37.39% 46.03% 47.62% 52.56% 47.76% 29.23%
GENDER Q17
---------------------
AGE Q12
--------------------------------
EDUCATION Q15
--------------------------------
Total
Total Answering
Somewhat likely to vote by mail
Very likely to vote by mail
Not likely/Would still vote at
polling place
Restoration PAC, Pennsylvania Statewide - May 2020 Banner 1 Page 26 of 290

15. What was the last grade you completed in school?
Total
---------
Gender
Male
---------
Gender
Female
---------
Yng Adlt
18-34
---------
Fam Age
35-54
---------
Seniors
55+
---------
High
School
---------
College
---------
College+
---------
600 286 314 115 189 273 156 312 130
100.00% 100.00% 100.00% 100.00% 100.00% 100.00% 100.00% 100.00% 100.00%
600 286 314 115 189 273 156 312 130
100.00% 100.00% 100.00% 100.00% 100.00% 100.00% 100.00% 100.00% 100.00%
3 2 1 - - 3 3 - -
0.50% 0.70% 0.32% 1.10% 1.92%
153 70 83 28 42 78 153 - -
25.50% 24.48% 26.43% 24.35% 22.22% 28.57% 98.08%
30 16 14 2 13 13 - 30 -
5.00% 5.59% 4.46% 1.74% 6.88% 4.76% 9.62%
282 131 151 52 92 125 - 282 -
47.00% 45.80% 48.09% 45.22% 48.68% 45.79% 90.38%
130 66 64 32 42 54 - - 130
21.67% 23.08% 20.38% 27.83% 22.22% 19.78% 100.00%
2 1 1 1 - - - - -
0.33% 0.35% 0.32% 0.87%
156 72 84 28 42 81 156 - -
26.00% 25.17% 26.75% 24.35% 22.22% 29.67% 100.00%
312 147 165 54 105 138 - 312 -
52.00% 51.40% 52.55% 46.96% 55.56% 50.55% 100.00%
130 66 64 32 42 54 - - 130
21.67% 23.08% 20.38% 27.83% 22.22% 19.78% 100.00%
GRADUATE SCHOOL
REFUSED
High School
College
College+
GENDER Q17
---------------------
AGE Q12
--------------------------------
EDUCATION Q15
--------------------------------
Total
Total Answering
GRADE SCHOOL [1-8]
HIGH SCHOOL [9-12]
TECHNICAL/VOCATIONAL
SCHOOL
COLLEGE
Restoration PAC, Pennsylvania Statewide - May 2020 Banner 1 Page 27 of 290

16. Thinking about where you live, do you consider it to be urban, suburban or rural?
Total
---------
Gender
Male
---------
Gender
Female
---------
Yng Adlt
18-34
---------
Fam Age
35-54
---------
Seniors
55+
---------
High
School
---------
College
---------
College+
---------
600 286 314 115 189 273 156 312 130
100.00% 100.00% 100.00% 100.00% 100.00% 100.00% 100.00% 100.00% 100.00%
600 286 314 115 189 273 156 312 130
100.00% 100.00% 100.00% 100.00% 100.00% 100.00% 100.00% 100.00% 100.00%
103 46 57 17 22 56 35 47 20
17.17% 16.08% 18.15% 14.78% 11.64% 20.51% 22.44% 15.06% 15.38%
299 151 148 64 101 123 47 169 83
49.83% 52.80% 47.13% 55.65% 53.44% 45.05% 30.13% 54.17% 63.85%
196 88 108 34 66 93 73 95 27
32.67% 30.77% 34.39% 29.57% 34.92% 34.07% 46.79% 30.45% 20.77%
2 1 1 - - 1 1 1 -
0.33% 0.35% 0.32% 0.37% 0.64% 0.32%
Total Answering
URBAN
SUBURBAN
RURAL
DON'T KNOW
GENDER Q17
---------------------
AGE Q12
--------------------------------
EDUCATION Q15
--------------------------------
Total
Restoration PAC, Pennsylvania Statewide - May 2020 Banner 1 Page 28 of 290

17. Gender
Total
---------
Gender
Male
---------
Gender
Female
---------
Yng Adlt
18-34
---------
Fam Age
35-54
---------
Seniors
55+
---------
High
School
---------
College
---------
College+
---------
600 286 314 115 189 273 156 312 130
100.00% 100.00% 100.00% 100.00% 100.00% 100.00% 100.00% 100.00% 100.00%
600 286 314 115 189 273 156 312 130
100.00% 100.00% 100.00% 100.00% 100.00% 100.00% 100.00% 100.00% 100.00%
286 286 - 53 91 130 72 147 66
47.67% 100.00% 46.09% 48.15% 47.62% 46.15% 47.12% 50.77%
314 - 314 62 98 143 84 165 64
52.33% 100.00% 53.91% 51.85% 52.38% 53.85% 52.88% 49.23%
Total Answering
Male
Female
GENDER Q17
---------------------
AGE Q12
--------------------------------
EDUCATION Q15
--------------------------------
Total
Restoration PAC, Pennsylvania Statewide - May 2020 Banner 1 Page 29 of 290

Table of contents
Banner 2
Table market
Table q1
Table q2
Table q3
Table q4
Table q5
Table q6
Table q7a
Table q7b
Table q7Summ
Table q8
Table corona_1
Table corona_2
Table corona_3
Table q10
Table q11a
Table q11b
Table q11_Summ
Table age
Table q13
Table q14a
Table q14b
Table q14_SUMM
Table ballot BALLOT. If a mail-in ballot was mailed to you, how likely would you be to vote by mail this fall, as opposed to voting in-person at your polling place?
13. Which two of the following issues do you believe are the most important issues facing the country? [Select up to 2]
14a. In politics today, do you generally consider yourself .... a republican, a democrat, an independent or something else?
14b. Do you think of yourself closer to the Republican Party or Democratic Party?
14. Party Summary
10. Do you think it was fair or unfair that Democrat President Obama's administration investigated and surveilled Republican Donald Trump as both a presidential candidate and president-
elect for allegedly colluding with Russia?
11a. If the election for US Congress were being held today, for whom would you vote.... the Republican candidate or the Democrat candidate?
11b. Would you say you are leaning toward the Republican candidate or leaning toward the Democrat candidate?
11. Summary Generic US Congress
12. Age
8. Do you approve or disapprove of the way President Trump is handling the Coronavirus crisis?
CORONAVIRUS 1. With over 60,000 Americans dead from the pandemic, how worried are you that you, or someone close to you, will be infected with coronavirus?
CORONAVIRUS 2. Which statement do you agree with, or agree with more: "It's time for people to get back to work." or "It's too early to lift stay-at-home restrictions."
CORONAVIRUS 3. Which statement do you agree with, or agree with more: "We should re-open the economy, even if that means more people will get coronavirus." or "We should
continue the shelter-in-place restrictions, even if that means severe job losses and economic disruption."
Media Market
1. Thinking ahead to the November election, how likely would you say you are to vote in these elections? Would you say you are…
2. Do you think the country is going in the right direction, or have things pretty seriously gone off on the wrong track?
3. Do you think the economy is going in the right direction, or have things pretty seriously gone off on the wrong track?
4. Do you approve or disapprove of the job Donald Trump is doing as President? Would that be strongly or somewhat (approve or disapprove)?
5. Do you think the impeachment of President Trump was good for the country, bad for the country, or did the impeachment not really matter that much?
6. Do you have a favorable or unfavorable impression of Donald Trump?
7a. If the election for President were being held today, and the candidates were Donald Trump and Joe Biden, for whom would you vote?
7b. Would you say you are leaning toward Donald Trump or leaning toward Joe Biden?
7. Biden Ballot Summary
Restoration PAC, Pennsylvania Statewide - May 2020 Banner 2 Page 30 of 290

Table q15
Table q16
Table q17
15. What was the last grade you completed in school?
16. Thinking about where you live, do you consider it to be urban, suburban or rural?
17. Gender
Restoration PAC, Pennsylvania Statewide - May 2020 Banner 2 Page 31 of 290

Media Market
Total
-----
Def
GOP
-----
Prob
GOP
-----
UNDEC
-----
Prob
DEM
-----
Def
DEM
-----
TOT
GOP
-----
UNDEC
-----
TOT
DEM
-----
Lean
GOP
-----
Hard
UNDEC
-----
Lean
DEM
-----
All
GOP
-----
All
UNDEC
-----
All
DEM
-----
600 248 34 92 25 198 282 92 223 14 63 18 296 63 241
100.00% 100.00% 100.00% 100.00% 100.00% 100.00% 100.00% 100.00% 100.00% 100.00% 100.00% 100.00% 100.00% 100.00% 100.00%
600 248 34 92 25 198 282 92 223 14 63 18 296 63 241
100.00% 100.00% 100.00% 100.00% 100.00% 100.00% 100.00% 100.00% 100.00% 100.00% 100.00% 100.00% 100.00% 100.00% 100.00%
3 1 1 1 - - 2 1 - 1 - - 3 - -
0.50% 0.40% 2.94% 1.09% 0.71% 1.09% 7.14% 1.01%
248 81 15 35 12 103 96 35 115 4 22 11 100 22 126
41.33% 32.66% 44.12% 38.04% 48.00% 52.02% 34.04% 38.04% 51.57% 28.57% 34.92% 61.11% 33.78% 34.92% 52.28%
132 58 8 21 4 41 66 21 45 5 14 2 71 14 47
22.00% 23.39% 23.53% 22.83% 16.00% 20.71% 23.40% 22.83% 20.18% 35.71% 22.22% 11.11% 23.99% 22.22% 19.50%
1 1 - - - - 1 - - - - - 1 - -
0.17% 0.40% 0.35% 0.34%
2 1 - 1 - - 1 1 - - - 1 1 - 1
0.33% 0.40% 1.09% 0.35% 1.09% 5.56% 0.34% 0.41%
19 10 1 2 1 5 11 2 6 - 2 - 11 2 6
3.17% 4.03% 2.94% 2.17% 4.00% 2.53% 3.90% 2.17% 2.69% 3.17% 3.72% 3.17% 2.49%
5 3 - 1 1 - 3 1 1 - - 1 3 - 2
0.83% 1.21% 1.09% 4.00% 1.06% 1.09% 0.45% 5.56% 1.01% 0.83%
2 1 - - - 1 1 - 1 - - - 1 - 1
0.33% 0.40% 0.51% 0.35% 0.45% 0.34% 0.41%
89 44 5 15 4 20 49 15 24 - 15 1 49 15 25
14.83% 17.74% 14.71% 16.30% 16.00% 10.10% 17.38% 16.30% 10.76% 23.81% 5.56% 16.55% 23.81% 10.37%
33 22 2 4 - 5 24 4 5 1 2 1 25 2 6
5.50% 8.87% 5.88% 4.35% 2.53% 8.51% 4.35% 2.24% 7.14% 3.17% 5.56% 8.45% 3.17% 2.49%
66 26 2 12 3 23 28 12 26 3 8 1 31 8 27
11.00% 10.48% 5.88% 13.04% 12.00% 11.62% 9.93% 13.04% 11.66% 21.43% 12.70% 5.56% 10.47% 12.70% 11.20%
514 - BUFFALO
516 - ERIE
536 - YOUNGSTOWN
565 - ELMIRA (CORNING)
566 - HARRISBURG-LNCSTR-
LEB-YORK
574 - JOHNSTOWN-ALTOONA-
ST COLGE
577 - WILKES BARRE-
SCRANTON-HZTN
GENERIC CONGRESS BALLOT Q11A
-------------------------------------------------------
UNDECIDED Q11B
--------------------
SUMMARY Q11
--------------------
Total
Total Answering
501 - NEW YORK
504 - PHILADELPHIA
508 - PITTSBURGH
511 - WASHINGTON, DC
(HAGRSTWN)
Restoration PAC, Pennsylvania Statewide - May 2020 Banner 2 Page 32 of 290

1. Thinking ahead to the November election, how likely would you say you are to vote in these elections? Would you say you are…
Total
-----
Def
GOP
-----
Prob
GOP
-----
UNDEC
-----
Prob
DEM
-----
Def
DEM
-----
TOT
GOP
-----
UNDEC
-----
TOT
DEM
-----
Lean
GOP
-----
Hard
UNDEC
-----
Lean
DEM
-----
All
GOP
-----
All
UNDEC
-----
All
DEM
-----
600 248 34 92 25 198 282 92 223 14 63 18 296 63 241
100.00% 100.00% 100.00% 100.00% 100.00% 100.00% 100.00% 100.00% 100.00% 100.00% 100.00% 100.00% 100.00% 100.00% 100.00%
600 248 34 92 25 198 282 92 223 14 63 18 296 63 241
100.00% 100.00% 100.00% 100.00% 100.00% 100.00% 100.00% 100.00% 100.00% 100.00% 100.00% 100.00% 100.00% 100.00% 100.00%
579 244 33 86 24 189 277 86 213 13 58 18 290 58 231
96.50% 98.39% 97.06% 93.48% 96.00% 95.45% 98.23% 93.48% 95.52% 92.86% 92.06% 100.00% 97.97% 92.06% 95.85%
21 4 1 6 1 9 5 6 10 1 5 - 6 5 10
3.50% 1.61% 2.94% 6.52% 4.00% 4.55% 1.77% 6.52% 4.48% 7.14% 7.94% 2.03% 7.94% 4.15%
SUMMARY Q11
--------------------
Total
Total Answering
VERY LIKELY
SOMEWHAT LIKELY
GENERIC CONGRESS BALLOT Q11A
-------------------------------------------------------
UNDECIDED Q11B
--------------------
Restoration PAC, Pennsylvania Statewide - May 2020 Banner 2 Page 33 of 290

2. Do you think the country is going in the right direction, or have things pretty seriously gone off on the wrong track?
Total
-----
Def
GOP
-----
Prob
GOP
-----
UNDEC
-----
Prob
DEM
-----
Def
DEM
-----
TOT
GOP
-----
UNDEC
-----
TOT
DEM
-----
Lean
GOP
-----
Hard
UNDEC
-----
Lean
DEM
-----
All
GOP
-----
All
UNDEC
-----
All
DEM
-----
600 248 34 92 25 198 282 92 223 14 63 18 296 63 241
100.00% 100.00% 100.00% 100.00% 100.00% 100.00% 100.00% 100.00% 100.00% 100.00% 100.00% 100.00% 100.00% 100.00% 100.00%
600 248 34 92 25 198 282 92 223 14 63 18 296 63 241
100.00% 100.00% 100.00% 100.00% 100.00% 100.00% 100.00% 100.00% 100.00% 100.00% 100.00% 100.00% 100.00% 100.00% 100.00%
230 178 19 23 2 7 197 23 9 9 13 2 206 13 11
38.33% 71.77% 55.88% 25.00% 8.00% 3.54% 69.86% 25.00% 4.04% 64.29% 20.63% 11.11% 69.59% 20.63% 4.56%
339 51 13 63 23 187 64 63 210 3 46 16 67 46 226
56.50% 20.56% 38.24% 68.48% 92.00% 94.44% 22.70% 68.48% 94.17% 21.43% 73.02% 88.89% 22.64% 73.02% 93.78%
27 17 1 5 - 4 18 5 4 1 4 - 19 4 4
4.50% 6.85% 2.94% 5.43% 2.02% 6.38% 5.43% 1.79% 7.14% 6.35% 6.42% 6.35% 1.66%
4 2 1 1 - - 3 1 - 1 - - 4 - -
0.67% 0.81% 2.94% 1.09% 1.06% 1.09% 7.14% 1.35%
Total Answering
RIGHT DIRECTION
WRONG TRACK
DON’T KNOW
REFUSED
GENERIC CONGRESS BALLOT Q11A
-------------------------------------------------------
UNDECIDED Q11B
--------------------
SUMMARY Q11
--------------------
Total
Restoration PAC, Pennsylvania Statewide - May 2020 Banner 2 Page 34 of 290

3. Do you think the economy is going in the right direction, or have things pretty seriously gone off on the wrong track?
Total
-----
Def
GOP
-----
Prob
GOP
-----
UNDEC
-----
Prob
DEM
-----
Def
DEM
-----
TOT
GOP
-----
UNDEC
-----
TOT
DEM
-----
Lean
GOP
-----
Hard
UNDEC
-----
Lean
DEM
-----
All
GOP
-----
All
UNDEC
-----
All
DEM
-----
600 248 34 92 25 198 282 92 223 14 63 18 296 63 241
100.00% 100.00% 100.00% 100.00% 100.00% 100.00% 100.00% 100.00% 100.00% 100.00% 100.00% 100.00% 100.00% 100.00% 100.00%
600 248 34 92 25 198 282 92 223 14 63 18 296 63 241
100.00% 100.00% 100.00% 100.00% 100.00% 100.00% 100.00% 100.00% 100.00% 100.00% 100.00% 100.00% 100.00% 100.00% 100.00%
202 149 14 26 4 9 163 26 13 8 15 3 171 15 16
33.67% 60.08% 41.18% 28.26% 16.00% 4.55% 57.80% 28.26% 5.83% 57.14% 23.81% 16.67% 57.77% 23.81% 6.64%
362 84 19 57 20 180 103 57 200 5 41 13 108 41 213
60.33% 33.87% 55.88% 61.96% 80.00% 90.91% 36.52% 61.96% 89.69% 35.71% 65.08% 72.22% 36.49% 65.08% 88.38%
32 14 - 8 1 8 14 8 9 - 7 2 14 7 11
5.33% 5.65% 8.70% 4.00% 4.04% 4.96% 8.70% 4.04% 11.11% 11.11% 4.73% 11.11% 4.56%
4 1 1 1 - 1 2 1 1 1 - - 3 - 1
0.67% 0.40% 2.94% 1.09% 0.51% 0.71% 1.09% 0.45% 7.14% 1.01% 0.41%
Total Answering
RIGHT DIRECTION
WRONG TRACK
DON’T KNOW
REFUSED
GENERIC CONGRESS BALLOT Q11A
-------------------------------------------------------
UNDECIDED Q11B
--------------------
SUMMARY Q11
--------------------
Total
Restoration PAC, Pennsylvania Statewide - May 2020 Banner 2 Page 35 of 290

4. Do you approve or disapprove of the job Donald Trump is doing as President? Would that be strongly or somewhat (approve or disapprove)?
Total
-----
Def
GOP
-----
Prob
GOP
-----
UNDEC
-----
Prob
DEM
-----
Def
DEM
-----
TOT
GOP
-----
UNDEC
-----
TOT
DEM
-----
Lean
GOP
-----
Hard
UNDEC
-----
Lean
DEM
-----
All
GOP
-----
All
UNDEC
-----
All
DEM
-----
600 248 34 92 25 198 282 92 223 14 63 18 296 63 241
100.00% 100.00% 100.00% 100.00% 100.00% 100.00% 100.00% 100.00% 100.00% 100.00% 100.00% 100.00% 100.00% 100.00% 100.00%
600 248 34 92 25 198 282 92 223 14 63 18 296 63 241
100.00% 100.00% 100.00% 100.00% 100.00% 100.00% 100.00% 100.00% 100.00% 100.00% 100.00% 100.00% 100.00% 100.00% 100.00%
268 217 23 21 1 6 240 21 7 6 13 2 246 13 9
44.67% 87.50% 67.65% 22.83% 4.00% 3.03% 85.11% 22.83% 3.14% 42.86% 20.63% 11.11% 83.11% 20.63% 3.73%
46 19 6 17 2 2 25 17 4 7 10 - 32 10 4
7.67% 7.66% 17.65% 18.48% 8.00% 1.01% 8.87% 18.48% 1.79% 50.00% 15.87% 10.81% 15.87% 1.66%
18 4 1 5 - 8 5 5 8 - 4 1 5 4 9
3.00% 1.61% 2.94% 5.43% 4.04% 1.77% 5.43% 3.59% 6.35% 5.56% 1.69% 6.35% 3.73%
256 7 2 46 22 177 9 46 199 1 32 15 10 32 214
42.67% 2.82% 5.88% 50.00% 88.00% 89.39% 3.19% 50.00% 89.24% 7.14% 50.79% 83.33% 3.38% 50.79% 88.80%
12 1 2 3 - 5 3 3 5 - 4 - 3 4 5
2.00% 0.40% 5.88% 3.26% 2.53% 1.06% 3.26% 2.24% 6.35% 1.01% 6.35% 2.07%
314 236 29 38 3 8 265 38 11 13 23 2 278 23 13
52.33% 95.16% 85.29% 41.30% 12.00% 4.04% 93.97% 41.30% 4.93% 92.86% 36.51% 11.11% 93.92% 36.51% 5.39%
274 11 3 51 22 185 14 51 207 1 36 16 15 36 223
45.67% 4.44% 8.82% 55.43% 88.00% 93.43% 4.96% 55.43% 92.83% 7.14% 57.14% 88.89% 5.07% 57.14% 92.53%
Total Answering
STRONGLY APPROVE
SOMEWHAT APPROVE
SOMEWHAT DISAPPROVE
STRONGLY DISAPPROVE
DON’T KNOW/NO ANSWER
Total Approve
Total Disapprove
GENERIC CONGRESS BALLOT Q11A
-------------------------------------------------------
UNDECIDED Q11B
--------------------
SUMMARY Q11
--------------------
Total
Restoration PAC, Pennsylvania Statewide - May 2020 Banner 2 Page 36 of 290

5. Do you think the impeachment of President Trump was good for the country, bad for the country, or did the impeachment not really matter that much?
Total
-----
Def
GOP
-----
Prob
GOP
-----
UNDEC
-----
Prob
DEM
-----
Def
DEM
-----
TOT
GOP
-----
UNDEC
-----
TOT
DEM
-----
Lean
GOP
-----
Hard
UNDEC
-----
Lean
DEM
-----
All
GOP
-----
All
UNDEC
-----
All
DEM
-----
600 248 34 92 25 198 282 92 223 14 63 18 296 63 241
100.00% 100.00% 100.00% 100.00% 100.00% 100.00% 100.00% 100.00% 100.00% 100.00% 100.00% 100.00% 100.00% 100.00% 100.00%
600 248 34 92 25 198 282 92 223 14 63 18 296 63 241
100.00% 100.00% 100.00% 100.00% 100.00% 100.00% 100.00% 100.00% 100.00% 100.00% 100.00% 100.00% 100.00% 100.00% 100.00%
107 19 2 9 6 70 21 9 76 - 9 1 21 9 77
17.83% 7.66% 5.88% 9.78% 24.00% 35.35% 7.45% 9.78% 34.08% 14.29% 5.56% 7.09% 14.29% 31.95%
289 197 27 37 6 21 224 37 27 8 26 4 232 26 31
48.17% 79.44% 79.41% 40.22% 24.00% 10.61% 79.43% 40.22% 12.11% 57.14% 41.27% 22.22% 78.38% 41.27% 12.86%
204 32 5 46 13 107 37 46 120 6 28 13 43 28 133
34.00% 12.90% 14.71% 50.00% 52.00% 54.04% 13.12% 50.00% 53.81% 42.86% 44.44% 72.22% 14.53% 44.44% 55.19%
UNDECIDED Q11B
--------------------
SUMMARY Q11
--------------------
Total
Total Answering
GOOD
BAD
DOESN'T MATTER/DON'T KNOW
GENERIC CONGRESS BALLOT Q11A
-------------------------------------------------------
Restoration PAC, Pennsylvania Statewide - May 2020 Banner 2 Page 37 of 290

6. Do you have a favorable or unfavorable impression of Donald Trump?
Total
-----
Def
GOP
-----
Prob
GOP
-----
UNDEC
-----
Prob
DEM
-----
Def
DEM
-----
TOT
GOP
-----
UNDEC
-----
TOT
DEM
-----
Lean
GOP
-----
Hard
UNDEC
-----
Lean
DEM
-----
All
GOP
-----
All
UNDEC
-----
All
DEM
-----
600 248 34 92 25 198 282 92 223 14 63 18 296 63 241
100.00% 100.00% 100.00% 100.00% 100.00% 100.00% 100.00% 100.00% 100.00% 100.00% 100.00% 100.00% 100.00% 100.00% 100.00%
600 248 34 92 25 198 282 92 223 14 63 18 296 63 241
100.00% 100.00% 100.00% 100.00% 100.00% 100.00% 100.00% 100.00% 100.00% 100.00% 100.00% 100.00% 100.00% 100.00% 100.00%
243 208 18 13 3 1 226 13 4 5 7 1 231 7 5
40.50% 83.87% 52.94% 14.13% 12.00% 0.51% 80.14% 14.13% 1.79% 35.71% 11.11% 5.56% 78.04% 11.11% 2.07%
53 21 11 18 1 2 32 18 3 6 12 - 38 12 3
8.83% 8.47% 32.35% 19.57% 4.00% 1.01% 11.35% 19.57% 1.35% 42.86% 19.05% 12.84% 19.05% 1.24%
11 2 1 4 - 4 3 4 4 1 3 - 4 3 4
1.83% 0.81% 2.94% 4.35% 2.02% 1.06% 4.35% 1.79% 7.14% 4.76% 1.35% 4.76% 1.66%
24 8 - 6 1 8 8 6 9 1 6 - 9 6 9
4.00% 3.23% 6.52% 4.00% 4.04% 2.84% 6.52% 4.04% 7.14% 9.52% 3.04% 9.52% 3.73%
268 9 4 51 20 183 13 51 203 1 34 17 14 34 220
44.67% 3.63% 11.76% 55.43% 80.00% 92.42% 4.61% 55.43% 91.03% 7.14% 53.97% 94.44% 4.73% 53.97% 91.29%
- - - - - - - - - - - - - - -
1 - - - - - - - - - 1 - - 1 -
0.17% 1.59% 1.59%
296 229 29 31 4 3 258 31 7 11 19 1 269 19 8
49.33% 92.34% 85.29% 33.70% 16.00% 1.52% 91.49% 33.70% 3.14% 78.57% 30.16% 5.56% 90.88% 30.16% 3.32%
292 17 4 57 21 191 21 57 212 2 40 17 23 40 229
48.67% 6.85% 11.76% 61.96% 84.00% 96.46% 7.45% 61.96% 95.07% 14.29% 63.49% 94.44% 7.77% 63.49% 95.02%
Total Favorable
Total Unfavorable
Total
Total Answering
Strongly FAVORABLE
Somewhat FAVORABLE
NO OPINION
Somewhat UNFAVORABLE
Strongly UNFAVORABLE
DON’T KNOW/NOT SURE
REFUSED
GENERIC CONGRESS BALLOT Q11A
-------------------------------------------------------
UNDECIDED Q11B
--------------------
SUMMARY Q11
--------------------
Restoration PAC, Pennsylvania Statewide - May 2020 Banner 2 Page 38 of 290

7a. If the election for President were being held today, and the candidates were Donald Trump and Joe Biden, for whom would you vote?
Total
-----
Def
GOP
-----
Prob
GOP
-----
UNDEC
-----
Prob
DEM
-----
Def
DEM
-----
TOT
GOP
-----
UNDEC
-----
TOT
DEM
-----
Lean
GOP
-----
Hard
UNDEC
-----
Lean
DEM
-----
All
GOP
-----
All
UNDEC
-----
All
DEM
-----
600 248 34 92 25 198 282 92 223 14 63 18 296 63 241
100.00% 100.00% 100.00% 100.00% 100.00% 100.00% 100.00% 100.00% 100.00% 100.00% 100.00% 100.00% 100.00% 100.00% 100.00%
600 248 34 92 25 198 282 92 223 14 63 18 296 63 241
100.00% 100.00% 100.00% 100.00% 100.00% 100.00% 100.00% 100.00% 100.00% 100.00% 100.00% 100.00% 100.00% 100.00% 100.00%
286 231 27 27 1 - 258 27 1 8 18 1 266 18 2
47.67% 93.15% 79.41% 29.35% 4.00% 91.49% 29.35% 0.45% 57.14% 28.57% 5.56% 89.86% 28.57% 0.83%
15 6 3 5 1 - 9 5 1 3 2 - 12 2 1
2.50% 2.42% 8.82% 5.43% 4.00% 3.19% 5.43% 0.45% 21.43% 3.17% 4.05% 3.17% 0.41%
22 4 - 13 1 4 4 13 5 2 11 - 6 11 5
3.67% 1.61% 14.13% 4.00% 2.02% 1.42% 14.13% 2.24% 14.29% 17.46% 2.03% 17.46% 2.07%
15 1 2 5 4 3 3 5 7 - 4 1 3 4 8
2.50% 0.40% 5.88% 5.43% 16.00% 1.52% 1.06% 5.43% 3.14% 6.35% 5.56% 1.01% 6.35% 3.32%
258 6 2 40 17 191 8 40 208 1 27 14 9 27 222
43.00% 2.42% 5.88% 43.48% 68.00% 96.46% 2.84% 43.48% 93.27% 7.14% 42.86% 77.78% 3.04% 42.86% 92.12%
4 - - 2 1 - - 2 1 - 1 2 - 1 3
0.67% 2.17% 4.00% 2.17% 0.45% 1.59% 11.11% 1.59% 1.24%
301 237 30 32 2 - 267 32 2 11 20 1 278 20 3
50.17% 95.56% 88.24% 34.78% 8.00% 94.68% 34.78% 0.90% 78.57% 31.75% 5.56% 93.92% 31.75% 1.24%
22 4 - 13 1 4 4 13 5 2 11 - 6 11 5
3.67% 1.61% 14.13% 4.00% 2.02% 1.42% 14.13% 2.24% 14.29% 17.46% 2.03% 17.46% 2.07%
273 7 4 45 21 194 11 45 215 1 31 15 12 31 230
45.50% 2.82% 11.76% 48.91% 84.00% 97.98% 3.90% 48.91% 96.41% 7.14% 49.21% 83.33% 4.05% 49.21% 95.44%
UNDECIDED
Probably BIDEN
Definitely BIDEN
Refused
Total Trump
Total Undecided
Total Biden
GENERIC CONGRESS BALLOT Q11A
-------------------------------------------------------
UNDECIDED Q11B
--------------------
SUMMARY Q11
--------------------
Total
Total Answering
Definitely TRUMP
Probably TRUMP
Restoration PAC, Pennsylvania Statewide - May 2020 Banner 2 Page 39 of 290

7b. Would you say you are leaning toward Donald Trump or leaning toward Joe Biden?
Total
-----
Def
GOP
-----
Prob
GOP
-----
UNDEC
-----
Prob
DEM
-----
Def
DEM
-----
TOT
GOP
-----
UNDEC
-----
TOT
DEM
-----
Lean
GOP
-----
Hard
UNDEC
-----
Lean
DEM
-----
All
GOP
-----
All
UNDEC
-----
All
DEM
-----
600 248 34 92 25 198 282 92 223 14 63 18 296 63 241
100.00% 100.00% 100.00% 100.00% 100.00% 100.00% 100.00% 100.00% 100.00% 100.00% 100.00% 100.00% 100.00% 100.00% 100.00%
26 4 - 15 2 4 4 15 6 2 12 2 6 12 8
4.33% 1.61% 16.30% 8.00% 2.02% 1.42% 16.30% 2.69% 14.29% 19.05% 11.11% 2.03% 19.05% 3.32%
2 - - 2 - - - 2 - 2 - - 2 - -
0.33% 2.17% 2.17% 14.29% 0.68%
21 4 - 12 1 3 4 12 4 - 11 2 4 11 6
3.50% 1.61% 13.04% 4.00% 1.52% 1.42% 13.04% 1.79% 17.46% 11.11% 1.35% 17.46% 2.49%
3 - - 1 1 1 - 1 2 - 1 - - 1 2
0.50% 1.09% 4.00% 0.51% 1.09% 0.90% 1.59% 1.59% 0.83%
SUMMARY Q11
--------------------
Total
Total Answering
LEAN TRUMP
HARD UNDECIDED
LEAN BIDEN
GENERIC CONGRESS BALLOT Q11A
-------------------------------------------------------
UNDECIDED Q11B
--------------------
Restoration PAC, Pennsylvania Statewide - May 2020 Banner 2 Page 40 of 290

7. Biden Ballot Summary
Total
-----
Def
GOP
-----
Prob
GOP
-----
UNDEC
-----
Prob
DEM
-----
Def
DEM
-----
TOT
GOP
-----
UNDEC
-----
TOT
DEM
-----
Lean
GOP
-----
Hard
UNDEC
-----
Lean
DEM
-----
All
GOP
-----
All
UNDEC
-----
All
DEM
-----
600 248 34 92 25 198 282 92 223 14 63 18 296 63 241
100.00% 100.00% 100.00% 100.00% 100.00% 100.00% 100.00% 100.00% 100.00% 100.00% 100.00% 100.00% 100.00% 100.00% 100.00%
600 248 34 92 25 198 282 92 223 14 63 18 296 63 241
100.00% 100.00% 100.00% 100.00% 100.00% 100.00% 100.00% 100.00% 100.00% 100.00% 100.00% 100.00% 100.00% 100.00% 100.00%
303 237 30 34 2 - 267 34 2 13 20 1 280 20 3
50.50% 95.56% 88.24% 36.96% 8.00% 94.68% 36.96% 0.90% 92.86% 31.75% 5.56% 94.59% 31.75% 1.24%
21 4 - 12 1 3 4 12 4 - 11 2 4 11 6
3.50% 1.61% 13.04% 4.00% 1.52% 1.42% 13.04% 1.79% 17.46% 11.11% 1.35% 17.46% 2.49%
276 7 4 46 22 195 11 46 217 1 32 15 12 32 232
46.00% 2.82% 11.76% 50.00% 88.00% 98.48% 3.90% 50.00% 97.31% 7.14% 50.79% 83.33% 4.05% 50.79% 96.27%
Total
Total Answering
ALL TRUMP
ALL UNDECIDED
ALL BIDEN
GENERIC CONGRESS BALLOT Q11A
-------------------------------------------------------
UNDECIDED Q11B
--------------------
SUMMARY Q11
--------------------
Restoration PAC, Pennsylvania Statewide - May 2020 Banner 2 Page 41 of 290

8. Do you approve or disapprove of the way President Trump is handling the Coronavirus crisis?
Total
-----
Def
GOP
-----
Prob
GOP
-----
UNDEC
-----
Prob
DEM
-----
Def
DEM
-----
TOT
GOP
-----
UNDEC
-----
TOT
DEM
-----
Lean
GOP
-----
Hard
UNDEC
-----
Lean
DEM
-----
All
GOP
-----
All
UNDEC
-----
All
DEM
-----
600 248 34 92 25 198 282 92 223 14 63 18 296 63 241
100.00% 100.00% 100.00% 100.00% 100.00% 100.00% 100.00% 100.00% 100.00% 100.00% 100.00% 100.00% 100.00% 100.00% 100.00%
600 248 34 92 25 198 282 92 223 14 63 18 296 63 241
100.00% 100.00% 100.00% 100.00% 100.00% 100.00% 100.00% 100.00% 100.00% 100.00% 100.00% 100.00% 100.00% 100.00% 100.00%
222 184 17 15 - 5 201 15 5 6 9 1 207 9 6
37.00% 74.19% 50.00% 16.30% 2.53% 71.28% 16.30% 2.24% 42.86% 14.29% 5.56% 69.93% 14.29% 2.49%
89 49 14 18 3 5 63 18 8 6 12 - 69 12 8
14.83% 19.76% 41.18% 19.57% 12.00% 2.53% 22.34% 19.57% 3.59% 42.86% 19.05% 23.31% 19.05% 3.32%
24 3 1 11 1 8 4 11 9 - 8 3 4 8 12
4.00% 1.21% 2.94% 11.96% 4.00% 4.04% 1.42% 11.96% 4.04% 12.70% 16.67% 1.35% 12.70% 4.98%
253 7 2 44 21 177 9 44 198 1 32 13 10 32 211
42.17% 2.82% 5.88% 47.83% 84.00% 89.39% 3.19% 47.83% 88.79% 7.14% 50.79% 72.22% 3.38% 50.79% 87.55%
12 5 - 4 - 3 5 4 3 1 2 1 6 2 4
2.00% 2.02% 4.35% 1.52% 1.77% 4.35% 1.35% 7.14% 3.17% 5.56% 2.03% 3.17% 1.66%
311 233 31 33 3 10 264 33 13 12 21 1 276 21 14
51.83% 93.95% 91.18% 35.87% 12.00% 5.05% 93.62% 35.87% 5.83% 85.71% 33.33% 5.56% 93.24% 33.33% 5.81%
277 10 3 55 22 185 13 55 207 1 40 16 14 40 223
46.17% 4.03% 8.82% 59.78% 88.00% 93.43% 4.61% 59.78% 92.83% 7.14% 63.49% 88.89% 4.73% 63.49% 92.53%
Total Answering
STRONGLY APPROVE
SOMEWHAT APPROVE
SOMEWHAT DISAPPROVE
STRONGLY DISAPPROVE
DON’T KNOW/NO ANSWER
Total Approve
Total Disapprove
GENERIC CONGRESS BALLOT Q11A
-------------------------------------------------------
UNDECIDED Q11B
--------------------
SUMMARY Q11
--------------------
Total
Restoration PAC, Pennsylvania Statewide - May 2020 Banner 2 Page 42 of 290

CORONAVIRUS 1. With over 60,000 Americans dead from the pandemic, how worried are you that you, or someone close to you, will be infected with coronavirus?
Total
-----
Def
GOP
-----
Prob
GOP
-----
UNDEC
-----
Prob
DEM
-----
Def
DEM
-----
TOT
GOP
-----
UNDEC
-----
TOT
DEM
-----
Lean
GOP
-----
Hard
UNDEC
-----
Lean
DEM
-----
All
GOP
-----
All
UNDEC
-----
All
DEM
-----
600 248 34 92 25 198 282 92 223 14 63 18 296 63 241
100.00% 100.00% 100.00% 100.00% 100.00% 100.00% 100.00% 100.00% 100.00% 100.00% 100.00% 100.00% 100.00% 100.00% 100.00%
600 248 34 92 25 198 282 92 223 14 63 18 296 63 241
100.00% 100.00% 100.00% 100.00% 100.00% 100.00% 100.00% 100.00% 100.00% 100.00% 100.00% 100.00% 100.00% 100.00% 100.00%
168 121 11 20 1 13 132 20 14 8 13 1 140 13 15
28.00% 48.79% 32.35% 21.74% 4.00% 6.57% 46.81% 21.74% 6.28% 57.14% 20.63% 5.56% 47.30% 20.63% 6.22%
223 87 16 44 6 70 103 44 76 6 31 7 109 31 83
37.17% 35.08% 47.06% 47.83% 24.00% 35.35% 36.52% 47.83% 34.08% 42.86% 49.21% 38.89% 36.82% 49.21% 34.44%
209 40 7 28 18 115 47 28 133 - 19 10 47 19 143
34.83% 16.13% 20.59% 30.43% 72.00% 58.08% 16.67% 30.43% 59.64% 30.16% 55.56% 15.88% 30.16% 59.34%
UNDECIDED Q11B
--------------------
SUMMARY Q11
--------------------
Total
Total Answering
NOT WORRIED
SOMEWHAT WORRIED
VERY WORRIED
GENERIC CONGRESS BALLOT Q11A
-------------------------------------------------------
Restoration PAC, Pennsylvania Statewide - May 2020 Banner 2 Page 43 of 290

CORONAVIRUS 2. Which statement do you agree with, or agree with more: "It's time for people to get back to work." or "It's too early to lift stay-at-home restrictions."
Total
-----
Def
GOP
-----
Prob
GOP
-----
UNDEC
-----
Prob
DEM
-----
Def
DEM
-----
TOT
GOP
-----
UNDEC
-----
TOT
DEM
-----
Lean
GOP
-----
Hard
UNDEC
-----
Lean
DEM
-----
All
GOP
-----
All
UNDEC
-----
All
DEM
-----
600 248 34 92 25 198 282 92 223 14 63 18 296 63 241
100.00% 100.00% 100.00% 100.00% 100.00% 100.00% 100.00% 100.00% 100.00% 100.00% 100.00% 100.00% 100.00% 100.00% 100.00%
600 248 34 92 25 198 282 92 223 14 63 18 296 63 241
100.00% 100.00% 100.00% 100.00% 100.00% 100.00% 100.00% 100.00% 100.00% 100.00% 100.00% 100.00% 100.00% 100.00% 100.00%
309 210 27 44 3 23 237 44 26 11 31 4 248 31 30
51.50% 84.68% 79.41% 47.83% 12.00% 11.62% 84.04% 47.83% 11.66% 78.57% 49.21% 22.22% 83.78% 49.21% 12.45%
291 38 7 48 22 175 45 48 197 3 32 14 48 32 211
48.50% 15.32% 20.59% 52.17% 88.00% 88.38% 15.96% 52.17% 88.34% 21.43% 50.79% 77.78% 16.22% 50.79% 87.55%
Total
Total Answering
WORK
STAY HOME
GENERIC CONGRESS BALLOT Q11A
-------------------------------------------------------
UNDECIDED Q11B
--------------------
SUMMARY Q11
--------------------
Restoration PAC, Pennsylvania Statewide - May 2020 Banner 2 Page 44 of 290

Total
-----
Def
GOP
-----
Prob
GOP
-----
UNDEC
-----
Prob
DEM
-----
Def
DEM
-----
TOT
GOP
-----
UNDEC
-----
TOT
DEM
-----
Lean
GOP
-----
Hard
UNDEC
-----
Lean
DEM
-----
All
GOP
-----
All
UNDEC
-----
All
DEM
-----
600 248 34 92 25 198 282 92 223 14 63 18 296 63 241
100.00% 100.00% 100.00% 100.00% 100.00% 100.00% 100.00% 100.00% 100.00% 100.00% 100.00% 100.00% 100.00% 100.00% 100.00%
600 248 34 92 25 198 282 92 223 14 63 18 296 63 241
100.00% 100.00% 100.00% 100.00% 100.00% 100.00% 100.00% 100.00% 100.00% 100.00% 100.00% 100.00% 100.00% 100.00% 100.00%
301 206 25 41 6 21 231 41 27 10 29 4 241 29 31
50.17% 83.06% 73.53% 44.57% 24.00% 10.61% 81.91% 44.57% 12.11% 71.43% 46.03% 22.22% 81.42% 46.03% 12.86%
299 42 9 51 19 177 51 51 196 4 34 14 55 34 210
49.83% 16.94% 26.47% 55.43% 76.00% 89.39% 18.09% 55.43% 87.89% 28.57% 53.97% 77.78% 18.58% 53.97% 87.14%
CORONAVIRUS 3. Which statement do you agree with, or agree with more: "We should re-open the economy, even if that means more people will get coronavirus." or "We should continue the shelter-in-place
restrictions, even if that means severe job losses and economic disruption."
OPEN/VIRUS
SHUTDOWN/JOBS
GENERIC CONGRESS BALLOT Q11A
-------------------------------------------------------
UNDECIDED Q11B
--------------------
SUMMARY Q11
--------------------
Total
Total Answering
Restoration PAC, Pennsylvania Statewide - May 2020 Banner 2 Page 45 of 290

Total
-----
Def
GOP
-----
Prob
GOP
-----
UNDEC
-----
Prob
DEM
-----
Def
DEM
-----
TOT
GOP
-----
UNDEC
-----
TOT
DEM
-----
Lean
GOP
-----
Hard
UNDEC
-----
Lean
DEM
-----
All
GOP
-----
All
UNDEC
-----
All
DEM
-----
600 248 34 92 25 198 282 92 223 14 63 18 296 63 241
100.00% 100.00% 100.00% 100.00% 100.00% 100.00% 100.00% 100.00% 100.00% 100.00% 100.00% 100.00% 100.00% 100.00% 100.00%
600 248 34 92 25 198 282 92 223 14 63 18 296 63 241
100.00% 100.00% 100.00% 100.00% 100.00% 100.00% 100.00% 100.00% 100.00% 100.00% 100.00% 100.00% 100.00% 100.00% 100.00%
235 22 1 41 19 151 23 41 170 1 27 14 24 27 184
39.17% 8.87% 2.94% 44.57% 76.00% 76.26% 8.16% 44.57% 76.23% 7.14% 42.86% 77.78% 8.11% 42.86% 76.35%
285 202 31 36 3 12 233 36 15 11 23 3 244 23 18
47.50% 81.45% 91.18% 39.13% 12.00% 6.06% 82.62% 39.13% 6.73% 78.57% 36.51% 16.67% 82.43% 36.51% 7.47%
80 24 2 15 3 35 26 15 38 2 13 1 28 13 39
13.33% 9.68% 5.88% 16.30% 12.00% 17.68% 9.22% 16.30% 17.04% 14.29% 20.63% 5.56% 9.46% 20.63% 16.18%
DON'T KNOW
GENERIC CONGRESS BALLOT Q11A
-------------------------------------------------------
UNDECIDED Q11B
--------------------
SUMMARY Q11
--------------------
Total
Total Answering
FAIR
NOT FAIR
10. Do you think it was fair or unfair that Democrat President Obama's administration investigated and surveilled Republican Donald Trump as both a presidential candidate and president-elect for allegedly colluding with
Russia?
Restoration PAC, Pennsylvania Statewide - May 2020 Banner 2 Page 46 of 290

11a. If the election for US Congress were being held today, for whom would you vote.... the Republican candidate or the Democrat candidate?
Total
-----
Def
GOP
-----
Prob
GOP
-----
UNDEC
-----
Prob
DEM
-----
Def
DEM
-----
TOT
GOP
-----
UNDEC
-----
TOT
DEM
-----
Lean
GOP
-----
Hard
UNDEC
-----
Lean
DEM
-----
All
GOP
-----
All
UNDEC
-----
All
DEM
-----
600 248 34 92 25 198 282 92 223 14 63 18 296 63 241
100.00% 100.00% 100.00% 100.00% 100.00% 100.00% 100.00% 100.00% 100.00% 100.00% 100.00% 100.00% 100.00% 100.00% 100.00%
600 248 34 92 25 198 282 92 223 14 63 18 296 63 241
100.00% 100.00% 100.00% 100.00% 100.00% 100.00% 100.00% 100.00% 100.00% 100.00% 100.00% 100.00% 100.00% 100.00% 100.00%
248 248 - - - - 248 - - - - - 248 - -
41.33% 100.00% 87.94% 83.78%
34 - 34 - - - 34 - - - - - 34 - -
5.67% 100.00% 12.06% 11.49%
92 - - 92 - - - 92 - 14 61 17 14 61 17
15.33% 100.00% 100.00% 100.00% 96.83% 94.44% 4.73% 96.83% 7.05%
25 - - - 25 - - - 25 - - - - - 25
4.17% 100.00% 11.21% 10.37%
198 - - - - 198 - - 198 - - - - - 198
33.00% 100.00% 88.79% 82.16%
3 - - - - - - - - - 2 1 - 2 1
0.50% 3.17% 5.56% 3.17% 0.41%
282 248 34 - - - 282 - - - - - 282 - -
47.00% 100.00% 100.00% 100.00% 95.27%
223 - - - 25 198 - - 223 - - - - - 223
37.17% 100.00% 100.00% 100.00% 92.53%
Probably DEMOCRAT
Definitely DEMOCRAT
Refused
Total Republican
Total Democrat
GENERIC CONGRESS BALLOT Q11A
-------------------------------------------------------
UNDECIDED Q11B
--------------------
SUMMARY Q11
--------------------
Total
Total Answering
Definitely REPUBLICAN
Probably REPUBLICAN
UNDECIDED
Restoration PAC, Pennsylvania Statewide - May 2020 Banner 2 Page 47 of 290

11b. Would you say you are leaning toward the Republican candidate or leaning toward the Democrat candidate?
Total
-----
Def
GOP
-----
Prob
GOP
-----
UNDEC
-----
Prob
DEM
-----
Def
DEM
-----
TOT
GOP
-----
UNDEC
-----
TOT
DEM
-----
Lean
GOP
-----
Hard
UNDEC
-----
Lean
DEM
-----
All
GOP
-----
All
UNDEC
-----
All
DEM
-----
600 248 34 92 25 198 282 92 223 14 63 18 296 63 241
100.00% 100.00% 100.00% 100.00% 100.00% 100.00% 100.00% 100.00% 100.00% 100.00% 100.00% 100.00% 100.00% 100.00% 100.00%
95 - - 92 - - - 92 - 14 63 18 14 63 18
15.83% 100.00% 100.00% 100.00% 100.00% 100.00% 4.73% 100.00% 7.47%
14 - - 14 - - - 14 - 14 - - 14 - -
2.33% 15.22% 15.22% 100.00% 4.73%
63 - - 61 - - - 61 - - 63 - - 63 -
10.50% 66.30% 66.30% 100.00% 100.00%
18 - - 17 - - - 17 - - - 18 - - 18
3.00% 18.48% 18.48% 100.00% 7.47%
Total Answering
LEAN GOP
HARD UNDECIDED/NOT SURE
LEAN DEM
GENERIC CONGRESS BALLOT Q11A
-------------------------------------------------------
UNDECIDED Q11B
--------------------
SUMMARY Q11
--------------------
Total
Restoration PAC, Pennsylvania Statewide - May 2020 Banner 2 Page 48 of 290

11. Summary Generic US Congress
Total
-----
Def
GOP
-----
Prob
GOP
-----
UNDEC
-----
Prob
DEM
-----
Def
DEM
-----
TOT
GOP
-----
UNDEC
-----
TOT
DEM
-----
Lean
GOP
-----
Hard
UNDEC
-----
Lean
DEM
-----
All
GOP
-----
All
UNDEC
-----
All
DEM
-----
600 248 34 92 25 198 282 92 223 14 63 18 296 63 241
100.00% 100.00% 100.00% 100.00% 100.00% 100.00% 100.00% 100.00% 100.00% 100.00% 100.00% 100.00% 100.00% 100.00% 100.00%
600 248 34 92 25 198 282 92 223 14 63 18 296 63 241
100.00% 100.00% 100.00% 100.00% 100.00% 100.00% 100.00% 100.00% 100.00% 100.00% 100.00% 100.00% 100.00% 100.00% 100.00%
296 248 34 14 - - 282 14 - 14 - - 296 - -
49.33% 100.00% 100.00% 15.22% 100.00% 15.22% 100.00% 100.00%
63 - - 61 - - - 61 - - 63 - - 63 -
10.50% 66.30% 66.30% 100.00% 100.00%
241 - - 17 25 198 - 17 223 - - 18 - - 241
40.17% 18.48% 100.00% 100.00% 18.48% 100.00% 100.00% 100.00%
ALL GOP
HARD UNDECIDED
ALL DEM
GENERIC CONGRESS BALLOT Q11A
-------------------------------------------------------
UNDECIDED Q11B
--------------------
SUMMARY Q11
--------------------
Total
Total Answering
Restoration PAC, Pennsylvania Statewide - May 2020 Banner 2 Page 49 of 290

12. Age
Total
-----
Def
GOP
-----
Prob
GOP
-----
UNDEC
-----
Prob
DEM
-----
Def
DEM
-----
TOT
GOP
-----
UNDEC
-----
TOT
DEM
-----
Lean
GOP
-----
Hard
UNDEC
-----
Lean
DEM
-----
All
GOP
-----
All
UNDEC
-----
All
DEM
-----
600 248 34 92 25 198 282 92 223 14 63 18 296 63 241
100.00% 100.00% 100.00% 100.00% 100.00% 100.00% 100.00% 100.00% 100.00% 100.00% 100.00% 100.00% 100.00% 100.00% 100.00%
600 248 34 92 25 198 282 92 223 14 63 18 296 63 241
100.00% 100.00% 100.00% 100.00% 100.00% 100.00% 100.00% 100.00% 100.00% 100.00% 100.00% 100.00% 100.00% 100.00% 100.00%
34 12 1 6 - 14 13 6 14 1 4 2 14 4 16
5.67% 4.84% 2.94% 6.52% 7.07% 4.61% 6.52% 6.28% 7.14% 6.35% 11.11% 4.73% 6.35% 6.64%
81 32 3 13 4 29 35 13 33 4 7 2 39 7 35
13.50% 12.90% 8.82% 14.13% 16.00% 14.65% 12.41% 14.13% 14.80% 28.57% 11.11% 11.11% 13.18% 11.11% 14.52%
91 27 9 18 5 32 36 18 37 3 14 1 39 14 38
15.17% 10.89% 26.47% 19.57% 20.00% 16.16% 12.77% 19.57% 16.59% 21.43% 22.22% 5.56% 13.18% 22.22% 15.77%
98 45 4 14 2 32 49 14 34 1 10 4 50 10 38
16.33% 18.15% 11.76% 15.22% 8.00% 16.16% 17.38% 15.22% 15.25% 7.14% 15.87% 22.22% 16.89% 15.87% 15.77%
118 50 7 17 4 40 57 17 44 2 10 5 59 10 49
19.67% 20.16% 20.59% 18.48% 16.00% 20.20% 20.21% 18.48% 19.73% 14.29% 15.87% 27.78% 19.93% 15.87% 20.33%
155 69 8 21 10 46 77 21 56 3 16 3 80 16 59
25.83% 27.82% 23.53% 22.83% 40.00% 23.23% 27.30% 22.83% 25.11% 21.43% 25.40% 16.67% 27.03% 25.40% 24.48%
23 13 2 3 - 5 15 3 5 - 2 1 15 2 6
3.83% 5.24% 5.88% 3.26% 2.53% 5.32% 3.26% 2.24% 3.17% 5.56% 5.07% 3.17% 2.49%
115 44 4 19 4 43 48 19 47 5 11 4 53 11 51
19.17% 17.74% 11.76% 20.65% 16.00% 21.72% 17.02% 20.65% 21.08% 35.71% 17.46% 22.22% 17.91% 17.46% 21.16%
189 72 13 32 7 64 85 32 71 4 24 5 89 24 76
31.50% 29.03% 38.24% 34.78% 28.00% 32.32% 30.14% 34.78% 31.84% 28.57% 38.10% 27.78% 30.07% 38.10% 31.54%
273 119 15 38 14 86 134 38 100 5 26 8 139 26 108
45.50% 47.98% 44.12% 41.30% 56.00% 43.43% 47.52% 41.30% 44.84% 35.71% 41.27% 44.44% 46.96% 41.27% 44.81%
25-34
35-44
45-54
55-64
65+
Refused
Young Adult 18-34
Family Age 35-54
Seniors 55+
GENERIC CONGRESS BALLOT Q11A
-------------------------------------------------------
UNDECIDED Q11B
--------------------
SUMMARY Q11
--------------------
Total
Total Answering
18-24
Restoration PAC, Pennsylvania Statewide - May 2020 Banner 2 Page 50 of 290

13. Which two of the following issues do you believe are the most important issues facing the country? [Select up to 2]
Total
-----
Def
GOP
-----
Prob
GOP
-----
UNDEC
-----
Prob
DEM
-----
Def
DEM
-----
TOT
GOP
-----
UNDEC
-----
TOT
DEM
-----
Lean
GOP
-----
Hard
UNDEC
-----
Lean
DEM
-----
All
GOP
-----
All
UNDEC
-----
All
DEM
-----
600 248 34 92 25 198 282 92 223 14 63 18 296 63 241
100.00% 100.00% 100.00% 100.00% 100.00% 100.00% 100.00% 100.00% 100.00% 100.00% 100.00% 100.00% 100.00% 100.00% 100.00%
600 248 34 92 25 198 282 92 223 14 63 18 296 63 241
100.00% 100.00% 100.00% 100.00% 100.00% 100.00% 100.00% 100.00% 100.00% 100.00% 100.00% 100.00% 100.00% 100.00% 100.00%
264 144 22 42 8 48 166 42 56 5 31 6 171 31 62
44.00% 58.06% 64.71% 45.65% 32.00% 24.24% 58.87% 45.65% 25.11% 35.71% 49.21% 33.33% 57.77% 49.21% 25.73%
190 59 6 25 11 87 65 25 98 2 20 5 67 20 103
31.67% 23.79% 17.65% 27.17% 44.00% 43.94% 23.05% 27.17% 43.95% 14.29% 31.75% 27.78% 22.64% 31.75% 42.74%
271 82 17 38 11 122 99 38 133 2 25 12 101 25 145
45.17% 33.06% 50.00% 41.30% 44.00% 61.62% 35.11% 41.30% 59.64% 14.29% 39.68% 66.67% 34.12% 39.68% 60.17%
77 53 2 14 - 8 55 14 8 4 7 3 59 7 11
12.83% 21.37% 5.88% 15.22% 4.04% 19.50% 15.22% 3.59% 28.57% 11.11% 16.67% 19.93% 11.11% 4.56%
71 26 2 14 5 24 28 14 29 5 8 1 33 8 30
11.83% 10.48% 5.88% 15.22% 20.00% 12.12% 9.93% 15.22% 13.00% 35.71% 12.70% 5.56% 11.15% 12.70% 12.45%
47 14 1 7 3 22 15 7 25 1 4 2 16 4 27
7.83% 5.65% 2.94% 7.61% 12.00% 11.11% 5.32% 7.61% 11.21% 7.14% 6.35% 11.11% 5.41% 6.35% 11.20%
31 20 3 4 - 4 23 4 4 2 1 1 25 1 5
5.17% 8.06% 8.82% 4.35% 2.02% 8.16% 4.35% 1.79% 14.29% 1.59% 5.56% 8.45% 1.59% 2.07%
79 10 2 16 6 45 12 16 51 1 12 3 13 12 54
13.17% 4.03% 5.88% 17.39% 24.00% 22.73% 4.26% 17.39% 22.87% 7.14% 19.05% 16.67% 4.39% 19.05% 22.41%
72 45 8 11 2 6 53 11 8 5 5 1 58 5 9
12.00% 18.15% 23.53% 11.96% 8.00% 3.03% 18.79% 11.96% 3.59% 35.71% 7.94% 5.56% 19.59% 7.94% 3.73%
39 20 2 4 1 12 22 4 13 - 3 1 22 3 14
6.50% 8.06% 5.88% 4.35% 4.00% 6.06% 7.80% 4.35% 5.83% 4.76% 5.56% 7.43% 4.76% 5.81%
15 7 - 2 2 3 7 2 5 - 3 - 7 3 5
2.50% 2.82% 2.17% 8.00% 1.52% 2.48% 2.17% 2.24% 4.76% 2.36% 4.76% 2.07%
EDUCATION
GUNS
FOREIGN TRADE
CLIMATE CHANGE
IMMIGRATION
IMPEACHMENT OR
INVESTIGATING GOVERNMENT
SOMETHING ELSE
GENERIC CONGRESS BALLOT Q11A
-------------------------------------------------------
UNDECIDED Q11B
--------------------
SUMMARY Q11
--------------------
Total
Total Answering
JOBS AND THE ECONOMY
HEALTH CARE
STOPPING CORONAVIRUS
NATIONAL SECURITY
Restoration PAC, Pennsylvania Statewide - May 2020 Banner 2 Page 51 of 290

14a. In politics today, do you generally consider yourself .... a republican, a democrat, an independent or something else?
Total
-----
Def
GOP
-----
Prob
GOP
-----
UNDEC
-----
Prob
DEM
-----
Def
DEM
-----
TOT
GOP
-----
UNDEC
-----
TOT
DEM
-----
Lean
GOP
-----
Hard
UNDEC
-----
Lean
DEM
-----
All
GOP
-----
All
UNDEC
-----
All
DEM
-----
600 248 34 92 25 198 282 92 223 14 63 18 296 63 241
100.00% 100.00% 100.00% 100.00% 100.00% 100.00% 100.00% 100.00% 100.00% 100.00% 100.00% 100.00% 100.00% 100.00% 100.00%
600 248 34 92 25 198 282 92 223 14 63 18 296 63 241
100.00% 100.00% 100.00% 100.00% 100.00% 100.00% 100.00% 100.00% 100.00% 100.00% 100.00% 100.00% 100.00% 100.00% 100.00%
225 192 13 16 2 2 205 16 4 8 7 1 213 7 5
37.50% 77.42% 38.24% 17.39% 8.00% 1.01% 72.70% 17.39% 1.79% 57.14% 11.11% 5.56% 71.96% 11.11% 2.07%
34 12 7 10 1 4 19 10 5 2 8 - 21 8 5
5.67% 4.84% 20.59% 10.87% 4.00% 2.02% 6.74% 10.87% 2.24% 14.29% 12.70% 7.09% 12.70% 2.07%
119 32 10 39 4 33 42 39 37 3 30 7 45 30 44
19.83% 12.90% 29.41% 42.39% 16.00% 16.67% 14.89% 42.39% 16.59% 21.43% 47.62% 38.89% 15.20% 47.62% 18.26%
36 1 3 14 5 13 4 14 18 1 10 3 5 10 21
6.00% 0.40% 8.82% 15.22% 20.00% 6.57% 1.42% 15.22% 8.07% 7.14% 15.87% 16.67% 1.69% 15.87% 8.71%
184 11 1 12 13 146 12 12 159 - 6 7 12 6 166
30.67% 4.44% 2.94% 13.04% 52.00% 73.74% 4.26% 13.04% 71.30% 9.52% 38.89% 4.05% 9.52% 68.88%
2 - - 1 - - - 1 - - 2 - - 2 -
0.33% 1.09% 1.09% 3.17% 3.17%
259 204 20 26 3 6 224 26 9 10 15 1 234 15 10
43.17% 82.26% 58.82% 28.26% 12.00% 3.03% 79.43% 28.26% 4.04% 71.43% 23.81% 5.56% 79.05% 23.81% 4.15%
220 12 4 26 18 159 16 26 177 1 16 10 17 16 187
36.67% 4.84% 11.76% 28.26% 72.00% 80.30% 5.67% 28.26% 79.37% 7.14% 25.40% 55.56% 5.74% 25.40% 77.59%
119 32 10 39 4 33 42 39 37 3 30 7 45 30 44
19.83% 12.90% 29.41% 42.39% 16.00% 16.67% 14.89% 42.39% 16.59% 21.43% 47.62% 38.89% 15.20% 47.62% 18.26%
Total Republican
Total Democrat
Independent
SUMMARY Q11
--------------------
Total
Total Answering
Strong REPUBLICAN
Not so Strong Republican
AN INDEPENDENT, OR
SOMETHING ELSE
Not so Strong DEMOCRAT
Strong DEMOCRAT
Refused
GENERIC CONGRESS BALLOT Q11A
-------------------------------------------------------
UNDECIDED Q11B
--------------------
Restoration PAC, Pennsylvania Statewide - May 2020 Banner 2 Page 52 of 290

14b. Do you think of yourself closer to the Republican Party or Democratic Party?
Total
-----
Def
GOP
-----
Prob
GOP
-----
UNDEC
-----
Prob
DEM
-----
Def
DEM
-----
TOT
GOP
-----
UNDEC
-----
TOT
DEM
-----
Lean
GOP
-----
Hard
UNDEC
-----
Lean
DEM
-----
All
GOP
-----
All
UNDEC
-----
All
DEM
-----
600 248 34 92 25 198 282 92 223 14 63 18 296 63 241
100.00% 100.00% 100.00% 100.00% 100.00% 100.00% 100.00% 100.00% 100.00% 100.00% 100.00% 100.00% 100.00% 100.00% 100.00%
121 32 10 40 4 33 42 40 37 3 32 7 45 32 44
20.17% 12.90% 29.41% 43.48% 16.00% 16.67% 14.89% 43.48% 16.59% 21.43% 50.79% 38.89% 15.20% 50.79% 18.26%
35 20 8 6 1 - 28 6 1 2 3 1 30 3 2
5.83% 8.06% 23.53% 6.52% 4.00% 9.93% 6.52% 0.45% 14.29% 4.76% 5.56% 10.14% 4.76% 0.83%
58 12 2 28 2 12 14 28 14 - 26 4 14 26 18
9.67% 4.84% 5.88% 30.43% 8.00% 6.06% 4.96% 30.43% 6.28% 41.27% 22.22% 4.73% 41.27% 7.47%
28 - - 6 1 21 - 6 22 1 3 2 1 3 24
4.67% 6.52% 4.00% 10.61% 6.52% 9.87% 7.14% 4.76% 11.11% 0.34% 4.76% 9.96%
FIRM INDEPENDENT
LEAN DEMOCRAT
GENERIC CONGRESS BALLOT Q11A
-------------------------------------------------------
UNDECIDED Q11B
--------------------
SUMMARY Q11
--------------------
Total
Total Answering
LEAN REPUBLICAN
Restoration PAC, Pennsylvania Statewide - May 2020 Banner 2 Page 53 of 290

14. Party Summary
Total
-----
Def
GOP
-----
Prob
GOP
-----
UNDEC
-----
Prob
DEM
-----
Def
DEM
-----
TOT
GOP
-----
UNDEC
-----
TOT
DEM
-----
Lean
GOP
-----
Hard
UNDEC
-----
Lean
DEM
-----
All
GOP
-----
All
UNDEC
-----
All
DEM
-----
600 248 34 92 25 198 282 92 223 14 63 18 296 63 241
100.00% 100.00% 100.00% 100.00% 100.00% 100.00% 100.00% 100.00% 100.00% 100.00% 100.00% 100.00% 100.00% 100.00% 100.00%
600 248 34 92 25 198 282 92 223 14 63 18 296 63 241
100.00% 100.00% 100.00% 100.00% 100.00% 100.00% 100.00% 100.00% 100.00% 100.00% 100.00% 100.00% 100.00% 100.00% 100.00%
294 224 28 32 4 6 252 32 10 12 18 2 264 18 12
49.00% 90.32% 82.35% 34.78% 16.00% 3.03% 89.36% 34.78% 4.48% 85.71% 28.57% 11.11% 89.19% 28.57% 4.98%
58 12 2 28 2 12 14 28 14 - 26 4 14 26 18
9.67% 4.84% 5.88% 30.43% 8.00% 6.06% 4.96% 30.43% 6.28% 41.27% 22.22% 4.73% 41.27% 7.47%
248 12 4 32 19 180 16 32 199 2 19 12 18 19 211
41.33% 4.84% 11.76% 34.78% 76.00% 90.91% 5.67% 34.78% 89.24% 14.29% 30.16% 66.67% 6.08% 30.16% 87.55%
ALL DEMOCRAT
GENERIC CONGRESS BALLOT Q11A
-------------------------------------------------------
UNDECIDED Q11B
--------------------
SUMMARY Q11
--------------------
Total
Total Answering
ALL REPUBLICAN
ALL INDEPENDENT
Restoration PAC, Pennsylvania Statewide - May 2020 Banner 2 Page 54 of 290

BALLOT. If a mail-in ballot was mailed to you, how likely would you be to vote by mail this fall, as opposed to voting in-person at your polling place?
Total
-----
Def
GOP
-----
Prob
GOP
-----
UNDEC
-----
Prob
DEM
-----
Def
DEM
-----
TOT
GOP
-----
UNDEC
-----
TOT
DEM
-----
Lean
GOP
-----
Hard
UNDEC
-----
Lean
DEM
-----
All
GOP
-----
All
UNDEC
-----
All
DEM
-----
600 248 34 92 25 198 282 92 223 14 63 18 296 63 241
100.00% 100.00% 100.00% 100.00% 100.00% 100.00% 100.00% 100.00% 100.00% 100.00% 100.00% 100.00% 100.00% 100.00% 100.00%
600 248 34 92 25 198 282 92 223 14 63 18 296 63 241
100.00% 100.00% 100.00% 100.00% 100.00% 100.00% 100.00% 100.00% 100.00% 100.00% 100.00% 100.00% 100.00% 100.00% 100.00%
84 29 3 13 5 32 32 13 37 1 12 2 33 12 39
14.00% 11.69% 8.82% 14.13% 20.00% 16.16% 11.35% 14.13% 16.59% 7.14% 19.05% 11.11% 11.15% 19.05% 16.18%
247 41 6 45 17 137 47 45 154 3 32 11 50 32 165
41.17% 16.53% 17.65% 48.91% 68.00% 69.19% 16.67% 48.91% 69.06% 21.43% 50.79% 61.11% 16.89% 50.79% 68.46%
269 178 25 34 3 29 203 34 32 10 19 5 213 19 37
44.83% 71.77% 73.53% 36.96% 12.00% 14.65% 71.99% 36.96% 14.35% 71.43% 30.16% 27.78% 71.96% 30.16% 15.35%
GENERIC CONGRESS BALLOT Q11A
-------------------------------------------------------
UNDECIDED Q11B
--------------------
SUMMARY Q11
--------------------
Total
Total Answering
Somewhat likely to vote by mail
Very likely to vote by mail
Not likely/Would still vote at polling
place
Restoration PAC, Pennsylvania Statewide - May 2020 Banner 2 Page 55 of 290

15. What was the last grade you completed in school?
Total
-----
Def
GOP
-----
Prob
GOP
-----
UNDEC
-----
Prob
DEM
-----
Def
DEM
-----
TOT
GOP
-----
UNDEC
-----
TOT
DEM
-----
Lean
GOP
-----
Hard
UNDEC
-----
Lean
DEM
-----
All
GOP
-----
All
UNDEC
-----
All
DEM
-----
600 248 34 92 25 198 282 92 223 14 63 18 296 63 241
100.00% 100.00% 100.00% 100.00% 100.00% 100.00% 100.00% 100.00% 100.00% 100.00% 100.00% 100.00% 100.00% 100.00% 100.00%
600 248 34 92 25 198 282 92 223 14 63 18 296 63 241
100.00% 100.00% 100.00% 100.00% 100.00% 100.00% 100.00% 100.00% 100.00% 100.00% 100.00% 100.00% 100.00% 100.00% 100.00%
3 1 - - - 2 1 - 2 - - - 1 - 2
0.50% 0.40% 1.01% 0.35% 0.90% 0.34% 0.83%
153 78 8 22 7 37 86 22 44 3 17 3 89 17 47
25.50% 31.45% 23.53% 23.91% 28.00% 18.69% 30.50% 23.91% 19.73% 21.43% 26.98% 16.67% 30.07% 26.98% 19.50%
30 15 3 - - 11 18 - 11 - 1 - 18 1 11
5.00% 6.05% 8.82% 5.56% 6.38% 4.93% 1.59% 6.08% 1.59% 4.56%
282 122 21 42 16 81 143 42 97 6 25 11 149 25 108
47.00% 49.19% 61.76% 45.65% 64.00% 40.91% 50.71% 45.65% 43.50% 42.86% 39.68% 61.11% 50.34% 39.68% 44.81%
130 32 2 28 2 65 34 28 67 5 20 4 39 20 71
21.67% 12.90% 5.88% 30.43% 8.00% 32.83% 12.06% 30.43% 30.04% 35.71% 31.75% 22.22% 13.18% 31.75% 29.46%
2 - - - - 2 - - 2 - - - - - 2
0.33% 1.01% 0.90% 0.83%
156 79 8 22 7 39 87 22 46 3 17 3 90 17 49
26.00% 31.85% 23.53% 23.91% 28.00% 19.70% 30.85% 23.91% 20.63% 21.43% 26.98% 16.67% 30.41% 26.98% 20.33%
312 137 24 42 16 92 161 42 108 6 26 11 167 26 119
52.00% 55.24% 70.59% 45.65% 64.00% 46.46% 57.09% 45.65% 48.43% 42.86% 41.27% 61.11% 56.42% 41.27% 49.38%
130 32 2 28 2 65 34 28 67 5 20 4 39 20 71
21.67% 12.90% 5.88% 30.43% 8.00% 32.83% 12.06% 30.43% 30.04% 35.71% 31.75% 22.22% 13.18% 31.75% 29.46%
GRADUATE SCHOOL
REFUSED
High School
College
College+
GENERIC CONGRESS BALLOT Q11A
-------------------------------------------------------
UNDECIDED Q11B
--------------------
SUMMARY Q11
--------------------
Total
Total Answering
GRADE SCHOOL [1-8]
HIGH SCHOOL [9-12]
TECHNICAL/VOCATIONAL
SCHOOL
COLLEGE
Restoration PAC, Pennsylvania Statewide - May 2020 Banner 2 Page 56 of 290

16. Thinking about where you live, do you consider it to be urban, suburban or rural?
Total
-----
Def
GOP
-----
Prob
GOP
-----
UNDEC
-----
Prob
DEM
-----
Def
DEM
-----
TOT
GOP
-----
UNDEC
-----
TOT
DEM
-----
Lean
GOP
-----
Hard
UNDEC
-----
Lean
DEM
-----
All
GOP
-----
All
UNDEC
-----
All
DEM
-----
600 248 34 92 25 198 282 92 223 14 63 18 296 63 241
100.00% 100.00% 100.00% 100.00% 100.00% 100.00% 100.00% 100.00% 100.00% 100.00% 100.00% 100.00% 100.00% 100.00% 100.00%
600 248 34 92 25 198 282 92 223 14 63 18 296 63 241
100.00% 100.00% 100.00% 100.00% 100.00% 100.00% 100.00% 100.00% 100.00% 100.00% 100.00% 100.00% 100.00% 100.00% 100.00%
103 37 2 15 4 45 39 15 49 3 8 4 42 8 53
17.17% 14.92% 5.88% 16.30% 16.00% 22.73% 13.83% 16.30% 21.97% 21.43% 12.70% 22.22% 14.19% 12.70% 21.99%
299 113 19 47 16 103 132 47 119 9 33 6 141 33 125
49.83% 45.56% 55.88% 51.09% 64.00% 52.02% 46.81% 51.09% 53.36% 64.29% 52.38% 33.33% 47.64% 52.38% 51.87%
196 96 13 30 5 50 109 30 55 2 22 8 111 22 63
32.67% 38.71% 38.24% 32.61% 20.00% 25.25% 38.65% 32.61% 24.66% 14.29% 34.92% 44.44% 37.50% 34.92% 26.14%
2 2 - - - - 2 - - - - - 2 - -
0.33% 0.81% 0.71% 0.68%
Total Answering
URBAN
SUBURBAN
RURAL
DON'T KNOW
GENERIC CONGRESS BALLOT Q11A
-------------------------------------------------------
UNDECIDED Q11B
--------------------
SUMMARY Q11
--------------------
Total
Restoration PAC, Pennsylvania Statewide - May 2020 Banner 2 Page 57 of 290

17. Gender
Total
-----
Def
GOP
-----
Prob
GOP
-----
UNDEC
-----
Prob
DEM
-----
Def
DEM
-----
TOT
GOP
-----
UNDEC
-----
TOT
DEM
-----
Lean
GOP
-----
Hard
UNDEC
-----
Lean
DEM
-----
All
GOP
-----
All
UNDEC
-----
All
DEM
-----
600 248 34 92 25 198 282 92 223 14 63 18 296 63 241
100.00% 100.00% 100.00% 100.00% 100.00% 100.00% 100.00% 100.00% 100.00% 100.00% 100.00% 100.00% 100.00% 100.00% 100.00%
600 248 34 92 25 198 282 92 223 14 63 18 296 63 241
100.00% 100.00% 100.00% 100.00% 100.00% 100.00% 100.00% 100.00% 100.00% 100.00% 100.00% 100.00% 100.00% 100.00% 100.00%
286 129 18 51 12 76 147 51 88 10 35 6 157 35 94
47.67% 52.02% 52.94% 55.43% 48.00% 38.38% 52.13% 55.43% 39.46% 71.43% 55.56% 33.33% 53.04% 55.56% 39.00%
314 119 16 41 13 122 135 41 135 4 28 12 139 28 147
52.33% 47.98% 47.06% 44.57% 52.00% 61.62% 47.87% 44.57% 60.54% 28.57% 44.44% 66.67% 46.96% 44.44% 61.00%
Total Answering
Male
Female
GENERIC CONGRESS BALLOT Q11A
-------------------------------------------------------
UNDECIDED Q11B
--------------------
SUMMARY Q11
--------------------
Total
Restoration PAC, Pennsylvania Statewide - May 2020 Banner 2 Page 58 of 290

Table of contents
Banner 3
Table market
Table q1
Table q2
Table q3
Table q4
Table q5
Table q6
Table q7a
Table q7b
Table q7Summ
Table q8
Table corona_1
Table corona_2
Table corona_3
Table q10
Table q11a
Table q11b
Table q11_Summ
Table age
Table q13
Table q14a
Table q14b
Table q14_SUMM
Table ballot BALLOT. If a mail-in ballot was mailed to you, how likely would you be to vote by mail this fall, as opposed to voting in-person at your polling place?
13. Which two of the following issues do you believe are the most important issues facing the country? [Select up to 2]
14a. In politics today, do you generally consider yourself .... a republican, a democrat, an independent or something else?
14b. Do you think of yourself closer to the Republican Party or Democratic Party?
14. Party Summary
10. Do you think it was fair or unfair that Democrat President Obama's administration investigated and surveilled Republican Donald Trump as both a presidential candidate and president-
elect for allegedly colluding with Russia?
11a. If the election for US Congress were being held today, for whom would you vote.... the Republican candidate or the Democrat candidate?
11b. Would you say you are leaning toward the Republican candidate or leaning toward the Democrat candidate?
11. Summary Generic US Congress
12. Age
8. Do you approve or disapprove of the way President Trump is handling the Coronavirus crisis?
CORONAVIRUS 1. With over 60,000 Americans dead from the pandemic, how worried are you that you, or someone close to you, will be infected with coronavirus?
CORONAVIRUS 2. Which statement do you agree with, or agree with more: "It's time for people to get back to work." or "It's too early to lift stay-at-home restrictions."
CORONAVIRUS 3. Which statement do you agree with, or agree with more: "We should re-open the economy, even if that means more people will get coronavirus." or "We should
continue the shelter-in-place restrictions, even if that means severe job losses and economic disruption."
Media Market
1. Thinking ahead to the November election, how likely would you say you are to vote in these elections? Would you say you are…
2. Do you think the country is going in the right direction, or have things pretty seriously gone off on the wrong track?
3. Do you think the economy is going in the right direction, or have things pretty seriously gone off on the wrong track?
4. Do you approve or disapprove of the job Donald Trump is doing as President? Would that be strongly or somewhat (approve or disapprove)?
5. Do you think the impeachment of President Trump was good for the country, bad for the country, or did the impeachment not really matter that much?
6. Do you have a favorable or unfavorable impression of Donald Trump?
7a. If the election for President were being held today, and the candidates were Donald Trump and Joe Biden, for whom would you vote?
7b. Would you say you are leaning toward Donald Trump or leaning toward Joe Biden?
7. Biden Ballot Summary
Restoration PAC, Pennsylvania Statewide - May 2020 Banner 3 Page 59 of 290

Table q15
Table q16
Table q17
15. What was the last grade you completed in school?
16. Thinking about where you live, do you consider it to be urban, suburban or rural?
17. Gender
Restoration PAC, Pennsylvania Statewide - May 2020 Banner 3 Page 60 of 290

Media Market
Total
-----
New
York
-----
Phil
-----
Pitt
-----
Wash
DC
-----
Bufflo
-----
Erie
-----
Youngs
town
-----
Elmira
-----
Harris
Lncstr
-----
Johns-
Altoon
-----
Wilkes
Barre
-----
URBAN
-----
SUBURB
-----
RURAL
-----
600 3 248 132 1 2 19 5 2 89 33 66 103 299 196
100.00% 100.00% 100.00% 100.00% 100.00% 100.00% 100.00% 100.00% 100.00% 100.00% 100.00% 100.00% 100.00% 100.00% 100.00%
600 3 248 132 1 2 19 5 2 89 33 66 103 299 196
100.00% 100.00% 100.00% 100.00% 100.00% 100.00% 100.00% 100.00% 100.00% 100.00% 100.00% 100.00% 100.00% 100.00% 100.00%
3 3 - - - - - - - - - - - 1 2
0.50% 100.00% 0.33% 1.02%
248 - 248 - - - - - - - - - 62 148 38
41.33% 100.00% 60.19% 49.50% 19.39%
132 - - 132 - - - - - - - - 19 68 43
22.00% 100.00% 18.45% 22.74% 21.94%
1 - - - 1 - - - - - - - - - 1
0.17% 100.00% 0.51%
2 - - - - 2 - - - - - - - - 2
0.33% 100.00% 1.02%
19 - - - - - 19 - - - - - 6 4 9
3.17% 100.00% 5.83% 1.34% 4.59%
5 - - - - - - 5 - - - - - 1 4
0.83% 100.00% 0.33% 2.04%
2 - - - - - - - 2 - - - - - 2
0.33% 100.00% 1.02%
89 - - - - - - - - 89 - - 7 45 37
14.83% 100.00% 6.80% 15.05% 18.88%
33 - - - - - - - - - 33 - 1 11 21
5.50% 100.00% 0.97% 3.68% 10.71%
66 - - - - - - - - - - 66 8 21 37
11.00% 100.00% 7.77% 7.02% 18.88%
516 - ERIE
536 - YOUNGSTOWN
565 - ELMIRA (CORNING)
566 - HARRISBURG-LNCSTR-
LEB-YORK
574 - JOHNSTOWN-ALTOONA-
ST COLGE
577 - WILKES BARRE-
SCRANTON-HZTN
MEDIA MARKET
----------------------------------------------------------------------------
REGION Q16
--------------------
Total
Total Answering
501 - NEW YORK
504 - PHILADELPHIA
508 - PITTSBURGH
511 - WASHINGTON, DC
(HAGRSTWN)
514 - BUFFALO
Restoration PAC, Pennsylvania Statewide - May 2020 Banner 3 Page 61 of 290

1. Thinking ahead to the November election, how likely would you say you are to vote in these elections? Would you say you are…
Total
-----
New
York
-----
Phil
-----
Pitt
-----
Wash
DC
-----
Bufflo
-----
Erie
-----
Youngs
town
-----
Elmira
-----
Harris
Lncstr
-----
Johns-
Altoon
-----
Wilkes
Barre
-----
URBAN
-----
SUBURB
-----
RURAL
-----
600 3 248 132 1 2 19 5 2 89 33 66 103 299 196
100.00% 100.00% 100.00% 100.00% 100.00% 100.00% 100.00% 100.00% 100.00% 100.00% 100.00% 100.00% 100.00% 100.00% 100.00%
600 3 248 132 1 2 19 5 2 89 33 66 103 299 196
100.00% 100.00% 100.00% 100.00% 100.00% 100.00% 100.00% 100.00% 100.00% 100.00% 100.00% 100.00% 100.00% 100.00% 100.00%
579 1 238 130 1 2 18 5 2 85 32 65 99 289 189
96.50% 33.33% 95.97% 98.48% 100.00% 100.00% 94.74% 100.00% 100.00% 95.51% 96.97% 98.48% 96.12% 96.66% 96.43%
21 2 10 2 - - 1 - - 4 1 1 4 10 7
3.50% 66.67% 4.03% 1.52% 5.26% 4.49% 3.03% 1.52% 3.88% 3.34% 3.57%
Total Answering
VERY LIKELY
SOMEWHAT LIKELY
MEDIA MARKET
----------------------------------------------------------------------------
REGION Q16
--------------------
Total
Restoration PAC, Pennsylvania Statewide - May 2020 Banner 3 Page 62 of 290

2. Do you think the country is going in the right direction, or have things pretty seriously gone off on the wrong track?
Total
-----
New
York
-----
Phil
-----
Pitt
-----
Wash
DC
-----
Bufflo
-----
Erie
-----
Youngs
town
-----
Elmira
-----
Harris
Lncstr
-----
Johns-
Altoon
-----
Wilkes
Barre
-----
URBAN
-----
SUBURB
-----
RURAL
-----
600 3 248 132 1 2 19 5 2 89 33 66 103 299 196
100.00% 100.00% 100.00% 100.00% 100.00% 100.00% 100.00% 100.00% 100.00% 100.00% 100.00% 100.00% 100.00% 100.00% 100.00%
600 3 248 132 1 2 19 5 2 89 33 66 103 299 196
100.00% 100.00% 100.00% 100.00% 100.00% 100.00% 100.00% 100.00% 100.00% 100.00% 100.00% 100.00% 100.00% 100.00% 100.00%
230 3 79 55 1 2 7 2 1 36 16 28 34 117 78
38.33% 100.00% 31.85% 41.67% 100.00% 100.00% 36.84% 40.00% 50.00% 40.45% 48.48% 42.42% 33.01% 39.13% 39.80%
339 - 159 71 - - 12 2 1 45 13 36 65 173 100
56.50% 64.11% 53.79% 63.16% 40.00% 50.00% 50.56% 39.39% 54.55% 63.11% 57.86% 51.02%
27 - 8 5 - - - 1 - 7 4 2 4 5 18
4.50% 3.23% 3.79% 20.00% 7.87% 12.12% 3.03% 3.88% 1.67% 9.18%
4 - 2 1 - - - - - 1 - - - 4 -
0.67% 0.81% 0.76% 1.12% 1.34%
DON’T KNOW
REFUSED
MEDIA MARKET
----------------------------------------------------------------------------
REGION Q16
--------------------
Total
Total Answering
RIGHT DIRECTION
WRONG TRACK
Restoration PAC, Pennsylvania Statewide - May 2020 Banner 3 Page 63 of 290

3. Do you think the economy is going in the right direction, or have things pretty seriously gone off on the wrong track?
Total
-----
New
York
-----
Phil
-----
Pitt
-----
Wash
DC
-----
Bufflo
-----
Erie
-----
Youngs
town
-----
Elmira
-----
Harris
Lncstr
-----
Johns-
Altoon
-----
Wilkes
Barre
-----
URBAN
-----
SUBURB
-----
RURAL
-----
600 3 248 132 1 2 19 5 2 89 33 66 103 299 196
100.00% 100.00% 100.00% 100.00% 100.00% 100.00% 100.00% 100.00% 100.00% 100.00% 100.00% 100.00% 100.00% 100.00% 100.00%
600 3 248 132 1 2 19 5 2 89 33 66 103 299 196
100.00% 100.00% 100.00% 100.00% 100.00% 100.00% 100.00% 100.00% 100.00% 100.00% 100.00% 100.00% 100.00% 100.00% 100.00%
202 3 69 48 - 2 8 1 1 31 14 25 30 100 71
33.67% 100.00% 27.82% 36.36% 100.00% 42.11% 20.00% 50.00% 34.83% 42.42% 37.88% 29.13% 33.44% 36.22%
362 - 168 77 1 - 10 3 - 50 16 37 69 182 110
60.33% 67.74% 58.33% 100.00% 52.63% 60.00% 56.18% 48.48% 56.06% 66.99% 60.87% 56.12%
32 - 10 6 - - 1 1 1 6 3 4 4 13 15
5.33% 4.03% 4.55% 5.26% 20.00% 50.00% 6.74% 9.09% 6.06% 3.88% 4.35% 7.65%
4 - 1 1 - - - - - 2 - - - 4 -
0.67% 0.40% 0.76% 2.25% 1.34%
REFUSED
MEDIA MARKET
----------------------------------------------------------------------------
REGION Q16
--------------------
Total
Total Answering
RIGHT DIRECTION
WRONG TRACK
DON’T KNOW
Restoration PAC, Pennsylvania Statewide - May 2020 Banner 3 Page 64 of 290

4. Do you approve or disapprove of the job Donald Trump is doing as President? Would that be strongly or somewhat (approve or disapprove)?
Total
-----
New
York
-----
Phil
-----
Pitt
-----
Wash
DC
-----
Bufflo
-----
Erie
-----
Youngs
town
-----
Elmira
-----
Harris
Lncstr
-----
Johns-
Altoon
-----
Wilkes
Barre
-----
URBAN
-----
SUBURB
-----
RURAL
-----
600 3 248 132 1 2 19 5 2 89 33 66 103 299 196
100.00% 100.00% 100.00% 100.00% 100.00% 100.00% 100.00% 100.00% 100.00% 100.00% 100.00% 100.00% 100.00% 100.00% 100.00%
600 3 248 132 1 2 19 5 2 89 33 66 103 299 196
100.00% 100.00% 100.00% 100.00% 100.00% 100.00% 100.00% 100.00% 100.00% 100.00% 100.00% 100.00% 100.00% 100.00% 100.00%
268 1 86 66 1 1 10 2 1 50 21 29 37 127 102
44.67% 33.33% 34.68% 50.00% 100.00% 50.00% 52.63% 40.00% 50.00% 56.18% 63.64% 43.94% 35.92% 42.47% 52.04%
46 1 18 11 - - - 1 - 5 4 6 8 21 17
7.67% 33.33% 7.26% 8.33% 20.00% 5.62% 12.12% 9.09% 7.77% 7.02% 8.67%
18 - 6 2 - 1 2 - - 5 1 1 3 11 4
3.00% 2.42% 1.52% 50.00% 10.53% 5.62% 3.03% 1.52% 2.91% 3.68% 2.04%
256 - 132 51 - - 6 2 1 28 7 29 51 134 71
42.67% 53.23% 38.64% 31.58% 40.00% 50.00% 31.46% 21.21% 43.94% 49.51% 44.82% 36.22%
12 1 6 2 - - 1 - - 1 - 1 4 6 2
2.00% 33.33% 2.42% 1.52% 5.26% 1.12% 1.52% 3.88% 2.01% 1.02%
314 2 104 77 1 1 10 3 1 55 25 35 45 148 119
52.33% 66.67% 41.94% 58.33% 100.00% 50.00% 52.63% 60.00% 50.00% 61.80% 75.76% 53.03% 43.69% 49.50% 60.71%
274 - 138 53 - 1 8 2 1 33 8 30 54 145 75
45.67% 55.65% 40.15% 50.00% 42.11% 40.00% 50.00% 37.08% 24.24% 45.45% 52.43% 48.49% 38.27%
DON’T KNOW/NO ANSWER
Total Approve
Total Disapprove
MEDIA MARKET
----------------------------------------------------------------------------
REGION Q16
--------------------
Total
Total Answering
STRONGLY APPROVE
SOMEWHAT APPROVE
SOMEWHAT DISAPPROVE
STRONGLY DISAPPROVE
Restoration PAC, Pennsylvania Statewide - May 2020 Banner 3 Page 65 of 290

5. Do you think the impeachment of President Trump was good for the country, bad for the country, or did the impeachment not really matter that much?
Total
-----
New
York
-----
Phil
-----
Pitt
-----
Wash
DC
-----
Bufflo
-----
Erie
-----
Youngs
town
-----
Elmira
-----
Harris
Lncstr
-----
Johns-
Altoon
-----
Wilkes
Barre
-----
URBAN
-----
SUBURB
-----
RURAL
-----
600 3 248 132 1 2 19 5 2 89 33 66 103 299 196
100.00% 100.00% 100.00% 100.00% 100.00% 100.00% 100.00% 100.00% 100.00% 100.00% 100.00% 100.00% 100.00% 100.00% 100.00%
600 3 248 132 1 2 19 5 2 89 33 66 103 299 196
100.00% 100.00% 100.00% 100.00% 100.00% 100.00% 100.00% 100.00% 100.00% 100.00% 100.00% 100.00% 100.00% 100.00% 100.00%
107 - 44 24 - - 2 - - 16 5 16 26 55 26
17.83% 17.74% 18.18% 10.53% 17.98% 15.15% 24.24% 25.24% 18.39% 13.27%
289 2 113 62 1 2 10 2 - 51 18 28 37 148 102
48.17% 66.67% 45.56% 46.97% 100.00% 100.00% 52.63% 40.00% 57.30% 54.55% 42.42% 35.92% 49.50% 52.04%
204 1 91 46 - - 7 3 2 22 10 22 40 96 68
34.00% 33.33% 36.69% 34.85% 36.84% 60.00% 100.00% 24.72% 30.30% 33.33% 38.83% 32.11% 34.69%
DOESN'T MATTER/DON'T KNOW
MEDIA MARKET
----------------------------------------------------------------------------
REGION Q16
--------------------
Total
Total Answering
GOOD
BAD
Restoration PAC, Pennsylvania Statewide - May 2020 Banner 3 Page 66 of 290

6. Do you have a favorable or unfavorable impression of Donald Trump?
Total
-----
New
York
-----
Phil
-----
Pitt
-----
Wash
DC
-----
Bufflo
-----
Erie
-----
Youngs
town
-----
Elmira
-----
Harris
Lncstr
-----
Johns-
Altoon
-----
Wilkes
Barre
-----
URBAN
-----
SUBURB
-----
RURAL
-----
600 3 248 132 1 2 19 5 2 89 33 66 103 299 196
100.00% 100.00% 100.00% 100.00% 100.00% 100.00% 100.00% 100.00% 100.00% 100.00% 100.00% 100.00% 100.00% 100.00% 100.00%
600 3 248 132 1 2 19 5 2 89 33 66 103 299 196
100.00% 100.00% 100.00% 100.00% 100.00% 100.00% 100.00% 100.00% 100.00% 100.00% 100.00% 100.00% 100.00% 100.00% 100.00%
243 1 77 60 1 1 10 3 1 38 22 29 36 110 95
40.50% 33.33% 31.05% 45.45% 100.00% 50.00% 52.63% 60.00% 50.00% 42.70% 66.67% 43.94% 34.95% 36.79% 48.47%
53 1 20 12 - - - - - 13 1 6 8 29 16
8.83% 33.33% 8.06% 9.09% 14.61% 3.03% 9.09% 7.77% 9.70% 8.16%
11 1 3 3 - - 1 - - 3 - - 1 5 5
1.83% 33.33% 1.21% 2.27% 5.26% 3.37% 0.97% 1.67% 2.55%
24 - 9 7 - - 1 - - 5 2 - 3 15 6
4.00% 3.63% 5.30% 5.26% 5.62% 6.06% 2.91% 5.02% 3.06%
268 - 138 50 - 1 7 2 1 30 8 31 55 139 74
44.67% 55.65% 37.88% 50.00% 36.84% 40.00% 50.00% 33.71% 24.24% 46.97% 53.40% 46.49% 37.76%
- - - - - - - - - - - - - - -
1 - 1 - - - - - - - - - - 1 -
0.17% 0.40% 0.33%
296 2 97 72 1 1 10 3 1 51 23 35 44 139 111
49.33% 66.67% 39.11% 54.55% 100.00% 50.00% 52.63% 60.00% 50.00% 57.30% 69.70% 53.03% 42.72% 46.49% 56.63%
292 - 147 57 - 1 8 2 1 35 10 31 58 154 80
48.67% 59.27% 43.18% 50.00% 42.11% 40.00% 50.00% 39.33% 30.30% 46.97% 56.31% 51.51% 40.82%
Strongly UNFAVORABLE
DON’T KNOW/NOT SURE
REFUSED
Total Favorable
Total Unfavorable
MEDIA MARKET
----------------------------------------------------------------------------
REGION Q16
--------------------
Total
Total Answering
Strongly FAVORABLE
Somewhat FAVORABLE
NO OPINION
Somewhat UNFAVORABLE
Restoration PAC, Pennsylvania Statewide - May 2020 Banner 3 Page 67 of 290

7a. If the election for President were being held today, and the candidates were Donald Trump and Joe Biden, for whom would you vote?
Total
-----
New
York
-----
Phil
-----
Pitt
-----
Wash
DC
-----
Bufflo
-----
Erie
-----
Youngs
town
-----
Elmira
-----
Harris
Lncstr
-----
Johns-
Altoon
-----
Wilkes
Barre
-----
URBAN
-----
SUBURB
-----
RURAL
-----
600 3 248 132 1 2 19 5 2 89 33 66 103 299 196
100.00% 100.00% 100.00% 100.00% 100.00% 100.00% 100.00% 100.00% 100.00% 100.00% 100.00% 100.00% 100.00% 100.00% 100.00%
600 3 248 132 1 2 19 5 2 89 33 66 103 299 196
100.00% 100.00% 100.00% 100.00% 100.00% 100.00% 100.00% 100.00% 100.00% 100.00% 100.00% 100.00% 100.00% 100.00% 100.00%
286 1 94 68 1 1 10 3 1 51 23 33 42 132 110
47.67% 33.33% 37.90% 51.52% 100.00% 50.00% 52.63% 60.00% 50.00% 57.30% 69.70% 50.00% 40.78% 44.15% 56.12%
15 2 7 1 - - - - - 3 - 2 2 10 3
2.50% 66.67% 2.82% 0.76% 3.37% 3.03% 1.94% 3.34% 1.53%
22 - 10 4 - - 3 - - 2 1 2 3 13 6
3.67% 4.03% 3.03% 15.79% 2.25% 3.03% 3.03% 2.91% 4.35% 3.06%
15 - 10 1 - - - - - 2 - 2 1 9 5
2.50% 4.03% 0.76% 2.25% 3.03% 0.97% 3.01% 2.55%
258 - 126 56 - 1 6 2 1 31 9 26 55 133 70
43.00% 50.81% 42.42% 50.00% 31.58% 40.00% 50.00% 34.83% 27.27% 39.39% 53.40% 44.48% 35.71%
4 - 1 2 - - - - - - - 1 - 2 2
0.67% 0.40% 1.52% 1.52% 0.67% 1.02%
301 3 101 69 1 1 10 3 1 54 23 35 44 142 113
50.17% 100.00% 40.73% 52.27% 100.00% 50.00% 52.63% 60.00% 50.00% 60.67% 69.70% 53.03% 42.72% 47.49% 57.65%
22 - 10 4 - - 3 - - 2 1 2 3 13 6
3.67% 4.03% 3.03% 15.79% 2.25% 3.03% 3.03% 2.91% 4.35% 3.06%
273 - 136 57 - 1 6 2 1 33 9 28 56 142 75
45.50% 54.84% 43.18% 50.00% 31.58% 40.00% 50.00% 37.08% 27.27% 42.42% 54.37% 47.49% 38.27%
Definitely TRUMP
Probably TRUMP
UNDECIDED
Probably BIDEN
Definitely BIDEN
Refused
Total Trump
Total Undecided
Total Biden
MEDIA MARKET
----------------------------------------------------------------------------
REGION Q16
--------------------
Total
Total Answering
Restoration PAC, Pennsylvania Statewide - May 2020 Banner 3 Page 68 of 290

7b. Would you say you are leaning toward Donald Trump or leaning toward Joe Biden?
Total
-----
New
York
-----
Phil
-----
Pitt
-----
Wash
DC
-----
Bufflo
-----
Erie
-----
Youngs
town
-----
Elmira
-----
Harris
Lncstr
-----
Johns-
Altoon
-----
Wilkes
Barre
-----
URBAN
-----
SUBURB
-----
RURAL
-----
600 3 248 132 1 2 19 5 2 89 33 66 103 299 196
100.00% 100.00% 100.00% 100.00% 100.00% 100.00% 100.00% 100.00% 100.00% 100.00% 100.00% 100.00% 100.00% 100.00% 100.00%
26 - 11 6 - - 3 - - 2 1 3 3 15 8
4.33% 4.44% 4.55% 15.79% 2.25% 3.03% 4.55% 2.91% 5.02% 4.08%
2 - - 2 - - - - - - - - - 2 -
0.33% 1.52% 0.67%
21 - 11 3 - - 2 - - 2 1 2 2 12 7
3.50% 4.44% 2.27% 10.53% 2.25% 3.03% 3.03% 1.94% 4.01% 3.57%
3 - - 1 - - 1 - - - - 1 1 1 1
0.50% 0.76% 5.26% 1.52% 0.97% 0.33% 0.51%
MEDIA MARKET
----------------------------------------------------------------------------
REGION Q16
--------------------
Total
Total Answering
LEAN TRUMP
HARD UNDECIDED
LEAN BIDEN
Restoration PAC, Pennsylvania Statewide - May 2020 Banner 3 Page 69 of 290

7. Biden Ballot Summary
Total
-----
New
York
-----
Phil
-----
Pitt
-----
Wash
DC
-----
Bufflo
-----
Erie
-----
Youngs
town
-----
Elmira
-----
Harris
Lncstr
-----
Johns-
Altoon
-----
Wilkes
Barre
-----
URBAN
-----
SUBURB
-----
RURAL
-----
600 3 248 132 1 2 19 5 2 89 33 66 103 299 196
100.00% 100.00% 100.00% 100.00% 100.00% 100.00% 100.00% 100.00% 100.00% 100.00% 100.00% 100.00% 100.00% 100.00% 100.00%
600 3 248 132 1 2 19 5 2 89 33 66 103 299 196
100.00% 100.00% 100.00% 100.00% 100.00% 100.00% 100.00% 100.00% 100.00% 100.00% 100.00% 100.00% 100.00% 100.00% 100.00%
303 3 101 71 1 1 10 3 1 54 23 35 44 144 113
50.50% 100.00% 40.73% 53.79% 100.00% 50.00% 52.63% 60.00% 50.00% 60.67% 69.70% 53.03% 42.72% 48.16% 57.65%
21 - 11 3 - - 2 - - 2 1 2 2 12 7
3.50% 4.44% 2.27% 10.53% 2.25% 3.03% 3.03% 1.94% 4.01% 3.57%
276 - 136 58 - 1 7 2 1 33 9 29 57 143 76
46.00% 54.84% 43.94% 50.00% 36.84% 40.00% 50.00% 37.08% 27.27% 43.94% 55.34% 47.83% 38.78%
Total
Total Answering
ALL TRUMP
ALL UNDECIDED
ALL BIDEN
MEDIA MARKET
----------------------------------------------------------------------------
REGION Q16
--------------------
Restoration PAC, Pennsylvania Statewide - May 2020 Banner 3 Page 70 of 290

8. Do you approve or disapprove of the way President Trump is handling the Coronavirus crisis?
Total
-----
New
York
-----
Phil
-----
Pitt
-----
Wash
DC
-----
Bufflo
-----
Erie
-----
Youngs
town
-----
Elmira
-----
Harris
Lncstr
-----
Johns-
Altoon
-----
Wilkes
Barre
-----
URBAN
-----
SUBURB
-----
RURAL
-----
600 3 248 132 1 2 19 5 2 89 33 66 103 299 196
100.00% 100.00% 100.00% 100.00% 100.00% 100.00% 100.00% 100.00% 100.00% 100.00% 100.00% 100.00% 100.00% 100.00% 100.00%
600 3 248 132 1 2 19 5 2 89 33 66 103 299 196
100.00% 100.00% 100.00% 100.00% 100.00% 100.00% 100.00% 100.00% 100.00% 100.00% 100.00% 100.00% 100.00% 100.00% 100.00%
222 - 76 55 1 1 7 2 - 31 21 28 34 109 78
37.00% 30.65% 41.67% 100.00% 50.00% 36.84% 40.00% 34.83% 63.64% 42.42% 33.01% 36.45% 39.80%
89 3 31 17 - - 5 1 1 22 2 7 11 40 38
14.83% 100.00% 12.50% 12.88% 26.32% 20.00% 50.00% 24.72% 6.06% 10.61% 10.68% 13.38% 19.39%
24 - 2 7 - - - - 1 7 3 4 2 12 10
4.00% 0.81% 5.30% 50.00% 7.87% 9.09% 6.06% 1.94% 4.01% 5.10%
253 - 134 50 - 1 7 2 - 26 7 26 53 130 70
42.17% 54.03% 37.88% 50.00% 36.84% 40.00% 29.21% 21.21% 39.39% 51.46% 43.48% 35.71%
12 - 5 3 - - - - - 3 - 1 3 8 -
2.00% 2.02% 2.27% 3.37% 1.52% 2.91% 2.68%
311 3 107 72 1 1 12 3 1 53 23 35 45 149 116
51.83% 100.00% 43.15% 54.55% 100.00% 50.00% 63.16% 60.00% 50.00% 59.55% 69.70% 53.03% 43.69% 49.83% 59.18%
277 - 136 57 - 1 7 2 1 33 10 30 55 142 80
46.17% 54.84% 43.18% 50.00% 36.84% 40.00% 50.00% 37.08% 30.30% 45.45% 53.40% 47.49% 40.82%
STRONGLY APPROVE
SOMEWHAT APPROVE
SOMEWHAT DISAPPROVE
STRONGLY DISAPPROVE
DON’T KNOW/NO ANSWER
Total Approve
Total Disapprove
MEDIA MARKET
----------------------------------------------------------------------------
REGION Q16
--------------------
Total
Total Answering
Restoration PAC, Pennsylvania Statewide - May 2020 Banner 3 Page 71 of 290

CORONAVIRUS 1. With over 60,000 Americans dead from the pandemic, how worried are you that you, or someone close to you, will be infected with coronavirus?
Total
-----
New
York
-----
Phil
-----
Pitt
-----
Wash
DC
-----
Bufflo
-----
Erie
-----
Youngs
town
-----
Elmira
-----
Harris
Lncstr
-----
Johns-
Altoon
-----
Wilkes
Barre
-----
URBAN
-----
SUBURB
-----
RURAL
-----
600 3 248 132 1 2 19 5 2 89 33 66 103 299 196
100.00% 100.00% 100.00% 100.00% 100.00% 100.00% 100.00% 100.00% 100.00% 100.00% 100.00% 100.00% 100.00% 100.00% 100.00%
600 3 248 132 1 2 19 5 2 89 33 66 103 299 196
100.00% 100.00% 100.00% 100.00% 100.00% 100.00% 100.00% 100.00% 100.00% 100.00% 100.00% 100.00% 100.00% 100.00% 100.00%
168 2 56 48 - 1 2 3 - 31 13 12 23 81 63
28.00% 66.67% 22.58% 36.36% 50.00% 10.53% 60.00% 34.83% 39.39% 18.18% 22.33% 27.09% 32.14%
223 1 85 45 1 1 10 1 2 36 14 27 35 110 77
37.17% 33.33% 34.27% 34.09% 100.00% 50.00% 52.63% 20.00% 100.00% 40.45% 42.42% 40.91% 33.98% 36.79% 39.29%
209 - 107 39 - - 7 1 - 22 6 27 45 108 56
34.83% 43.15% 29.55% 36.84% 20.00% 24.72% 18.18% 40.91% 43.69% 36.12% 28.57%
Total
Total Answering
NOT WORRIED
SOMEWHAT WORRIED
VERY WORRIED
MEDIA MARKET
----------------------------------------------------------------------------
REGION Q16
--------------------
Restoration PAC, Pennsylvania Statewide - May 2020 Banner 3 Page 72 of 290

CORONAVIRUS 2. Which statement do you agree with, or agree with more: "It's time for people to get back to work." or "It's too early to lift stay-at-home restrictions."
Total
-----
New
York
-----
Phil
-----
Pitt
-----
Wash
DC
-----
Bufflo
-----
Erie
-----
Youngs
town
-----
Elmira
-----
Harris
Lncstr
-----
Johns-
Altoon
-----
Wilkes
Barre
-----
URBAN
-----
SUBURB
-----
RURAL
-----
600 3 248 132 1 2 19 5 2 89 33 66 103 299 196
100.00% 100.00% 100.00% 100.00% 100.00% 100.00% 100.00% 100.00% 100.00% 100.00% 100.00% 100.00% 100.00% 100.00% 100.00%
600 3 248 132 1 2 19 5 2 89 33 66 103 299 196
100.00% 100.00% 100.00% 100.00% 100.00% 100.00% 100.00% 100.00% 100.00% 100.00% 100.00% 100.00% 100.00% 100.00% 100.00%
309 2 106 76 1 2 12 3 1 58 23 25 50 148 111
51.50% 66.67% 42.74% 57.58% 100.00% 100.00% 63.16% 60.00% 50.00% 65.17% 69.70% 37.88% 48.54% 49.50% 56.63%
291 1 142 56 - - 7 2 1 31 10 41 53 151 85
48.50% 33.33% 57.26% 42.42% 36.84% 40.00% 50.00% 34.83% 30.30% 62.12% 51.46% 50.50% 43.37%
WORK
STAY HOME
MEDIA MARKET
----------------------------------------------------------------------------
REGION Q16
--------------------
Total
Total Answering
Restoration PAC, Pennsylvania Statewide - May 2020 Banner 3 Page 73 of 290

Total
-----
New
York
-----
Phil
-----
Pitt
-----
Wash
DC
-----
Bufflo
-----
Erie
-----
Youngs
town
-----
Elmira
-----
Harris
Lncstr
-----
Johns-
Altoon
-----
Wilkes
Barre
-----
URBAN
-----
SUBURB
-----
RURAL
-----
600 3 248 132 1 2 19 5 2 89 33 66 103 299 196
100.00% 100.00% 100.00% 100.00% 100.00% 100.00% 100.00% 100.00% 100.00% 100.00% 100.00% 100.00% 100.00% 100.00% 100.00%
600 3 248 132 1 2 19 5 2 89 33 66 103 299 196
100.00% 100.00% 100.00% 100.00% 100.00% 100.00% 100.00% 100.00% 100.00% 100.00% 100.00% 100.00% 100.00% 100.00% 100.00%
301 1 105 72 1 2 11 3 1 55 23 27 45 144 112
50.17% 33.33% 42.34% 54.55% 100.00% 100.00% 57.89% 60.00% 50.00% 61.80% 69.70% 40.91% 43.69% 48.16% 57.14%
299 2 143 60 - - 8 2 1 34 10 39 58 155 84
49.83% 66.67% 57.66% 45.45% 42.11% 40.00% 50.00% 38.20% 30.30% 59.09% 56.31% 51.84% 42.86%
CORONAVIRUS 3. Which statement do you agree with, or agree with more: "We should re-open the economy, even if that means more people will get coronavirus." or "We should continue the shelter-in-place
restrictions, even if that means severe job losses and economic disruption."
MEDIA MARKET
----------------------------------------------------------------------------
REGION Q16
--------------------
Total
Total Answering
OPEN/VIRUS
SHUTDOWN/JOBS
Restoration PAC, Pennsylvania Statewide - May 2020 Banner 3 Page 74 of 290

Total
-----
New
York
-----
Phil
-----
Pitt
-----
Wash
DC
-----
Bufflo
-----
Erie
-----
Youngs
town
-----
Elmira
-----
Harris
Lncstr
-----
Johns-
Altoon
-----
Wilkes
Barre
-----
URBAN
-----
SUBURB
-----
RURAL
-----
600 3 248 132 1 2 19 5 2 89 33 66 103 299 196
100.00% 100.00% 100.00% 100.00% 100.00% 100.00% 100.00% 100.00% 100.00% 100.00% 100.00% 100.00% 100.00% 100.00% 100.00%
600 3 248 132 1 2 19 5 2 89 33 66 103 299 196
100.00% 100.00% 100.00% 100.00% 100.00% 100.00% 100.00% 100.00% 100.00% 100.00% 100.00% 100.00% 100.00% 100.00% 100.00%
235 - 110 47 1 1 8 2 1 28 5 32 50 115 70
39.17% 44.35% 35.61% 100.00% 50.00% 42.11% 40.00% 50.00% 31.46% 15.15% 48.48% 48.54% 38.46% 35.71%
285 3 97 67 - 1 8 2 1 50 26 30 41 136 107
47.50% 100.00% 39.11% 50.76% 50.00% 42.11% 40.00% 50.00% 56.18% 78.79% 45.45% 39.81% 45.48% 54.59%
80 - 41 18 - - 3 1 - 11 2 4 12 48 19
13.33% 16.53% 13.64% 15.79% 20.00% 12.36% 6.06% 6.06% 11.65% 16.05% 9.69%
10. Do you think it was fair or unfair that Democrat President Obama's administration investigated and surveilled Republican Donald Trump as both a presidential candidate and president-elect for allegedly colluding with
Russia?
Total
Total Answering
FAIR
NOT FAIR
DON'T KNOW
MEDIA MARKET
----------------------------------------------------------------------------
REGION Q16
--------------------
Restoration PAC, Pennsylvania Statewide - May 2020 Banner 3 Page 75 of 290

11a. If the election for US Congress were being held today, for whom would you vote.... the Republican candidate or the Democrat candidate?
Total
-----
New
York
-----
Phil
-----
Pitt
-----
Wash
DC
-----
Bufflo
-----
Erie
-----
Youngs
town
-----
Elmira
-----
Harris
Lncstr
-----
Johns-
Altoon
-----
Wilkes
Barre
-----
URBAN
-----
SUBURB
-----
RURAL
-----
600 3 248 132 1 2 19 5 2 89 33 66 103 299 196
100.00% 100.00% 100.00% 100.00% 100.00% 100.00% 100.00% 100.00% 100.00% 100.00% 100.00% 100.00% 100.00% 100.00% 100.00%
600 3 248 132 1 2 19 5 2 89 33 66 103 299 196
100.00% 100.00% 100.00% 100.00% 100.00% 100.00% 100.00% 100.00% 100.00% 100.00% 100.00% 100.00% 100.00% 100.00% 100.00%
248 1 81 58 1 1 10 3 1 44 22 26 37 113 96
41.33% 33.33% 32.66% 43.94% 100.00% 50.00% 52.63% 60.00% 50.00% 49.44% 66.67% 39.39% 35.92% 37.79% 48.98%
34 1 15 8 - - 1 - - 5 2 2 2 19 13
5.67% 33.33% 6.05% 6.06% 5.26% 5.62% 6.06% 3.03% 1.94% 6.35% 6.63%
92 1 35 21 - 1 2 1 - 15 4 12 15 47 30
15.33% 33.33% 14.11% 15.91% 50.00% 10.53% 20.00% 16.85% 12.12% 18.18% 14.56% 15.72% 15.31%
25 - 12 4 - - 1 1 - 4 - 3 4 16 5
4.17% 4.84% 3.03% 5.26% 20.00% 4.49% 4.55% 3.88% 5.35% 2.55%
198 - 103 41 - - 5 - 1 20 5 23 45 103 50
33.00% 41.53% 31.06% 26.32% 50.00% 22.47% 15.15% 34.85% 43.69% 34.45% 25.51%
3 - 2 - - - - - - 1 - - - 1 2
0.50% 0.81% 1.12% 0.33% 1.02%
282 2 96 66 1 1 11 3 1 49 24 28 39 132 109
47.00% 66.67% 38.71% 50.00% 100.00% 50.00% 57.89% 60.00% 50.00% 55.06% 72.73% 42.42% 37.86% 44.15% 55.61%
223 - 115 45 - - 6 1 1 24 5 26 49 119 55
37.17% 46.37% 34.09% 31.58% 20.00% 50.00% 26.97% 15.15% 39.39% 47.57% 39.80% 28.06%
Definitely REPUBLICAN
Probably REPUBLICAN
UNDECIDED
Probably DEMOCRAT
Definitely DEMOCRAT
Refused
Total Republican
Total Democrat
MEDIA MARKET
----------------------------------------------------------------------------
REGION Q16
--------------------
Total
Total Answering
Restoration PAC, Pennsylvania Statewide - May 2020 Banner 3 Page 76 of 290

11b. Would you say you are leaning toward the Republican candidate or leaning toward the Democrat candidate?
Total
-----
New
York
-----
Phil
-----
Pitt
-----
Wash
DC
-----
Bufflo
-----
Erie
-----
Youngs
town
-----
Elmira
-----
Harris
Lncstr
-----
Johns-
Altoon
-----
Wilkes
Barre
-----
URBAN
-----
SUBURB
-----
RURAL
-----
600 3 248 132 1 2 19 5 2 89 33 66 103 299 196
100.00% 100.00% 100.00% 100.00% 100.00% 100.00% 100.00% 100.00% 100.00% 100.00% 100.00% 100.00% 100.00% 100.00% 100.00%
95 1 37 21 - 1 2 1 - 16 4 12 15 48 32
15.83% 33.33% 14.92% 15.91% 50.00% 10.53% 20.00% 17.98% 12.12% 18.18% 14.56% 16.05% 16.33%
14 1 4 5 - - - - - - 1 3 3 9 2
2.33% 33.33% 1.61% 3.79% 3.03% 4.55% 2.91% 3.01% 1.02%
63 - 22 14 - - 2 - - 15 2 8 8 33 22
10.50% 8.87% 10.61% 10.53% 16.85% 6.06% 12.12% 7.77% 11.04% 11.22%
18 - 11 2 - 1 - 1 - 1 1 1 4 6 8
3.00% 4.44% 1.52% 50.00% 20.00% 1.12% 3.03% 1.52% 3.88% 2.01% 4.08%
REGION Q16
--------------------
Total
Total Answering
LEAN GOP
HARD UNDECIDED/NOT SURE
LEAN DEM
MEDIA MARKET
----------------------------------------------------------------------------
Restoration PAC, Pennsylvania Statewide - May 2020 Banner 3 Page 77 of 290

11. Summary Generic US Congress
Total
-----
New
York
-----
Phil
-----
Pitt
-----
Wash
DC
-----
Bufflo
-----
Erie
-----
Youngs
town
-----
Elmira
-----
Harris
Lncstr
-----
Johns-
Altoon
-----
Wilkes
Barre
-----
URBAN
-----
SUBURB
-----
RURAL
-----
600 3 248 132 1 2 19 5 2 89 33 66 103 299 196
100.00% 100.00% 100.00% 100.00% 100.00% 100.00% 100.00% 100.00% 100.00% 100.00% 100.00% 100.00% 100.00% 100.00% 100.00%
600 3 248 132 1 2 19 5 2 89 33 66 103 299 196
100.00% 100.00% 100.00% 100.00% 100.00% 100.00% 100.00% 100.00% 100.00% 100.00% 100.00% 100.00% 100.00% 100.00% 100.00%
296 3 100 71 1 1 11 3 1 49 25 31 42 141 111
49.33% 100.00% 40.32% 53.79% 100.00% 50.00% 57.89% 60.00% 50.00% 55.06% 75.76% 46.97% 40.78% 47.16% 56.63%
63 - 22 14 - - 2 - - 15 2 8 8 33 22
10.50% 8.87% 10.61% 10.53% 16.85% 6.06% 12.12% 7.77% 11.04% 11.22%
241 - 126 47 - 1 6 2 1 25 6 27 53 125 63
40.17% 50.81% 35.61% 50.00% 31.58% 40.00% 50.00% 28.09% 18.18% 40.91% 51.46% 41.81% 32.14%
Total Answering
ALL GOP
HARD UNDECIDED
ALL DEM
MEDIA MARKET
----------------------------------------------------------------------------
REGION Q16
--------------------
Total
Restoration PAC, Pennsylvania Statewide - May 2020 Banner 3 Page 78 of 290

12. Age
Total
-----
New
York
-----
Phil
-----
Pitt
-----
Wash
DC
-----
Bufflo
-----
Erie
-----
Youngs
town
-----
Elmira
-----
Harris
Lncstr
-----
Johns-
Altoon
-----
Wilkes
Barre
-----
URBAN
-----
SUBURB
-----
RURAL
-----
600 3 248 132 1 2 19 5 2 89 33 66 103 299 196
100.00% 100.00% 100.00% 100.00% 100.00% 100.00% 100.00% 100.00% 100.00% 100.00% 100.00% 100.00% 100.00% 100.00% 100.00%
600 3 248 132 1 2 19 5 2 89 33 66 103 299 196
100.00% 100.00% 100.00% 100.00% 100.00% 100.00% 100.00% 100.00% 100.00% 100.00% 100.00% 100.00% 100.00% 100.00% 100.00%
34 - 22 2 - - 1 - - 4 2 3 6 20 8
5.67% 8.87% 1.52% 5.26% 4.49% 6.06% 4.55% 5.83% 6.69% 4.08%
81 1 36 20 - - 2 2 - 12 4 4 11 44 26
13.50% 33.33% 14.52% 15.15% 10.53% 40.00% 13.48% 12.12% 6.06% 10.68% 14.72% 13.27%
91 - 29 28 1 - 2 2 - 16 2 11 9 52 30
15.17% 11.69% 21.21% 100.00% 10.53% 40.00% 17.98% 6.06% 16.67% 8.74% 17.39% 15.31%
98 1 39 20 - 1 2 - - 17 6 12 13 49 36
16.33% 33.33% 15.73% 15.15% 50.00% 10.53% 19.10% 18.18% 18.18% 12.62% 16.39% 18.37%
118 - 43 32 - - 4 1 1 16 7 14 22 51 44
19.67% 17.34% 24.24% 21.05% 20.00% 50.00% 17.98% 21.21% 21.21% 21.36% 17.06% 22.45%
155 1 71 22 - 1 6 - 1 23 11 19 34 72 49
25.83% 33.33% 28.63% 16.67% 50.00% 31.58% 50.00% 25.84% 33.33% 28.79% 33.01% 24.08% 25.00%
23 - 8 8 - - 2 - - 1 1 3 8 11 3
3.83% 3.23% 6.06% 10.53% 1.12% 3.03% 4.55% 7.77% 3.68% 1.53%
115 1 58 22 - - 3 2 - 16 6 7 17 64 34
19.17% 33.33% 23.39% 16.67% 15.79% 40.00% 17.98% 18.18% 10.61% 16.50% 21.40% 17.35%
189 1 68 48 1 1 4 2 - 33 8 23 22 101 66
31.50% 33.33% 27.42% 36.36% 100.00% 50.00% 21.05% 40.00% 37.08% 24.24% 34.85% 21.36% 33.78% 33.67%
273 1 114 54 - 1 10 1 2 39 18 33 56 123 93
45.50% 33.33% 45.97% 40.91% 50.00% 52.63% 20.00% 100.00% 43.82% 54.55% 50.00% 54.37% 41.14% 47.45%
25-34
35-44
45-54
55-64
65+
Refused
Young Adult 18-34
Family Age 35-54
Seniors 55+
MEDIA MARKET
----------------------------------------------------------------------------
REGION Q16
--------------------
Total
Total Answering
18-24
Restoration PAC, Pennsylvania Statewide - May 2020 Banner 3 Page 79 of 290

13. Which two of the following issues do you believe are the most important issues facing the country? [Select up to 2]
Total
-----
New
York
-----
Phil
-----
Pitt
-----
Wash
DC
-----
Bufflo
-----
Erie
-----
Youngs
town
-----
Elmira
-----
Harris
Lncstr
-----
Johns-
Altoon
-----
Wilkes
Barre
-----
URBAN
-----
SUBURB
-----
RURAL
-----
600 3 248 132 1 2 19 5 2 89 33 66 103 299 196
100.00% 100.00% 100.00% 100.00% 100.00% 100.00% 100.00% 100.00% 100.00% 100.00% 100.00% 100.00% 100.00% 100.00% 100.00%
600 3 248 132 1 2 19 5 2 89 33 66 103 299 196
100.00% 100.00% 100.00% 100.00% 100.00% 100.00% 100.00% 100.00% 100.00% 100.00% 100.00% 100.00% 100.00% 100.00% 100.00%
264 2 105 58 - 1 8 2 1 47 18 22 41 132 90
44.00% 66.67% 42.34% 43.94% 50.00% 42.11% 40.00% 50.00% 52.81% 54.55% 33.33% 39.81% 44.15% 45.92%
190 1 75 47 1 - 5 2 1 19 15 24 38 85 66
31.67% 33.33% 30.24% 35.61% 100.00% 26.32% 40.00% 50.00% 21.35% 45.45% 36.36% 36.89% 28.43% 33.67%
271 1 138 46 1 - 6 2 1 37 12 27 44 148 77
45.17% 33.33% 55.65% 34.85% 100.00% 31.58% 40.00% 50.00% 41.57% 36.36% 40.91% 42.72% 49.50% 39.29%
77 - 25 16 - 1 5 2 - 14 4 10 7 37 33
12.83% 10.08% 12.12% 50.00% 26.32% 40.00% 15.73% 12.12% 15.15% 6.80% 12.37% 16.84%
71 - 26 19 - - 4 2 - 8 - 12 16 31 24
11.83% 10.48% 14.39% 21.05% 40.00% 8.99% 18.18% 15.53% 10.37% 12.24%
47 - 18 12 - - - - - 5 5 7 11 20 16
7.83% 7.26% 9.09% 5.62% 15.15% 10.61% 10.68% 6.69% 8.16%
31 - 12 9 - - 3 - - 4 1 2 6 14 11
5.17% 4.84% 6.82% 15.79% 4.49% 3.03% 3.03% 5.83% 4.68% 5.61%
79 - 35 14 - - 4 - - 17 2 7 16 43 20
13.17% 14.11% 10.61% 21.05% 19.10% 6.06% 10.61% 15.53% 14.38% 10.20%
72 1 23 20 - 1 3 - - 12 2 10 9 38 25
12.00% 33.33% 9.27% 15.15% 50.00% 15.79% 13.48% 6.06% 15.15% 8.74% 12.71% 12.76%
39 1 11 13 - 1 - - 1 4 3 5 10 14 15
6.50% 33.33% 4.44% 9.85% 50.00% 50.00% 4.49% 9.09% 7.58% 9.71% 4.68% 7.65%
15 - 5 3 - - - - - 5 - 2 1 10 4
2.50% 2.02% 2.27% 5.62% 3.03% 0.97% 3.34% 2.04%
GUNS
FOREIGN TRADE
CLIMATE CHANGE
IMMIGRATION
IMPEACHMENT OR
INVESTIGATING GOVERNMENT
SOMETHING ELSE
MEDIA MARKET
----------------------------------------------------------------------------
REGION Q16
--------------------
Total
Total Answering
JOBS AND THE ECONOMY
HEALTH CARE
STOPPING CORONAVIRUS
NATIONAL SECURITY
EDUCATION
Restoration PAC, Pennsylvania Statewide - May 2020 Banner 3 Page 80 of 290

14a. In politics today, do you generally consider yourself .... a republican, a democrat, an independent or something else?
Total
-----
New
York
-----
Phil
-----
Pitt
-----
Wash
DC
-----
Bufflo
-----
Erie
-----
Youngs
town
-----
Elmira
-----
Harris
Lncstr
-----
Johns-
Altoon
-----
Wilkes
Barre
-----
URBAN
-----
SUBURB
-----
RURAL
-----
600 3 248 132 1 2 19 5 2 89 33 66 103 299 196
100.00% 100.00% 100.00% 100.00% 100.00% 100.00% 100.00% 100.00% 100.00% 100.00% 100.00% 100.00% 100.00% 100.00% 100.00%
600 3 248 132 1 2 19 5 2 89 33 66 103 299 196
100.00% 100.00% 100.00% 100.00% 100.00% 100.00% 100.00% 100.00% 100.00% 100.00% 100.00% 100.00% 100.00% 100.00% 100.00%
225 - 80 49 - - 7 3 1 40 18 27 27 109 87
37.50% 32.26% 37.12% 36.84% 60.00% 50.00% 44.94% 54.55% 40.91% 26.21% 36.45% 44.39%
34 1 13 5 - - 2 - - 10 - 3 6 18 10
5.67% 33.33% 5.24% 3.79% 10.53% 11.24% 4.55% 5.83% 6.02% 5.10%
119 2 46 22 1 2 3 1 - 20 8 14 15 64 40
19.83% 66.67% 18.55% 16.67% 100.00% 100.00% 15.79% 20.00% 22.47% 24.24% 21.21% 14.56% 21.40% 20.41%
36 - 19 7 - - 2 - - 2 - 6 9 17 10
6.00% 7.66% 5.30% 10.53% 2.25% 9.09% 8.74% 5.69% 5.10%
184 - 89 48 - - 5 1 1 17 7 16 46 90 48
30.67% 35.89% 36.36% 26.32% 20.00% 50.00% 19.10% 21.21% 24.24% 44.66% 30.10% 24.49%
2 - 1 1 - - - - - - - - - 1 1
0.33% 0.40% 0.76% 0.33% 0.51%
259 1 93 54 - - 9 3 1 50 18 30 33 127 97
43.17% 33.33% 37.50% 40.91% 47.37% 60.00% 50.00% 56.18% 54.55% 45.45% 32.04% 42.47% 49.49%
220 - 108 55 - - 7 1 1 19 7 22 55 107 58
36.67% 43.55% 41.67% 36.84% 20.00% 50.00% 21.35% 21.21% 33.33% 53.40% 35.79% 29.59%
119 2 46 22 1 2 3 1 - 20 8 14 15 64 40
19.83% 66.67% 18.55% 16.67% 100.00% 100.00% 15.79% 20.00% 22.47% 24.24% 21.21% 14.56% 21.40% 20.41%
Independent
Total Answering
Strong REPUBLICAN
Not so Strong Republican
AN INDEPENDENT, OR
SOMETHING ELSE
Not so Strong DEMOCRAT
Strong DEMOCRAT
Refused
Total Republican
Total Democrat
MEDIA MARKET
----------------------------------------------------------------------------
REGION Q16
--------------------
Total
Restoration PAC, Pennsylvania Statewide - May 2020 Banner 3 Page 81 of 290

14b. Do you think of yourself closer to the Republican Party or Democratic Party?
Total
-----
New
York
-----
Phil
-----
Pitt
-----
Wash
DC
-----
Bufflo
-----
Erie
-----
Youngs
town
-----
Elmira
-----
Harris
Lncstr
-----
Johns-
Altoon
-----
Wilkes
Barre
-----
URBAN
-----
SUBURB
-----
RURAL
-----
600 3 248 132 1 2 19 5 2 89 33 66 103 299 196
100.00% 100.00% 100.00% 100.00% 100.00% 100.00% 100.00% 100.00% 100.00% 100.00% 100.00% 100.00% 100.00% 100.00% 100.00%
121 2 47 23 1 2 3 1 - 20 8 14 15 65 41
20.17% 66.67% 18.95% 17.42% 100.00% 100.00% 15.79% 20.00% 22.47% 24.24% 21.21% 14.56% 21.74% 20.92%
35 1 13 5 1 1 2 - - 7 3 2 5 16 14
5.83% 33.33% 5.24% 3.79% 100.00% 50.00% 10.53% 7.87% 9.09% 3.03% 4.85% 5.35% 7.14%
58 1 24 13 - - - 1 - 7 5 7 7 32 19
9.67% 33.33% 9.68% 9.85% 20.00% 7.87% 15.15% 10.61% 6.80% 10.70% 9.69%
28 - 10 5 - 1 1 - - 6 - 5 3 17 8
4.67% 4.03% 3.79% 50.00% 5.26% 6.74% 7.58% 2.91% 5.69% 4.08%
MEDIA MARKET
----------------------------------------------------------------------------
REGION Q16
--------------------
Total
Total Answering
LEAN REPUBLICAN
FIRM INDEPENDENT
LEAN DEMOCRAT
Restoration PAC, Pennsylvania Statewide - May 2020 Banner 3 Page 82 of 290

14. Party Summary
Total
-----
New
York
-----
Phil
-----
Pitt
-----
Wash
DC
-----
Bufflo
-----
Erie
-----
Youngs
town
-----
Elmira
-----
Harris
Lncstr
-----
Johns-
Altoon
-----
Wilkes
Barre
-----
URBAN
-----
SUBURB
-----
RURAL
-----
600 3 248 132 1 2 19 5 2 89 33 66 103 299 196
100.00% 100.00% 100.00% 100.00% 100.00% 100.00% 100.00% 100.00% 100.00% 100.00% 100.00% 100.00% 100.00% 100.00% 100.00%
600 3 248 132 1 2 19 5 2 89 33 66 103 299 196
100.00% 100.00% 100.00% 100.00% 100.00% 100.00% 100.00% 100.00% 100.00% 100.00% 100.00% 100.00% 100.00% 100.00% 100.00%
294 2 106 59 1 1 11 3 1 57 21 32 38 143 111
49.00% 66.67% 42.74% 44.70% 100.00% 50.00% 57.89% 60.00% 50.00% 64.04% 63.64% 48.48% 36.89% 47.83% 56.63%
58 1 24 13 - - - 1 - 7 5 7 7 32 19
9.67% 33.33% 9.68% 9.85% 20.00% 7.87% 15.15% 10.61% 6.80% 10.70% 9.69%
248 - 118 60 - 1 8 1 1 25 7 27 58 124 66
41.33% 47.58% 45.45% 50.00% 42.11% 20.00% 50.00% 28.09% 21.21% 40.91% 56.31% 41.47% 33.67%
Total
Total Answering
ALL REPUBLICAN
ALL INDEPENDENT
ALL DEMOCRAT
MEDIA MARKET
----------------------------------------------------------------------------
REGION Q16
--------------------
Restoration PAC, Pennsylvania Statewide - May 2020 Banner 3 Page 83 of 290

BALLOT. If a mail-in ballot was mailed to you, how likely would you be to vote by mail this fall, as opposed to voting in-person at your polling place?
Total
-----
New
York
-----
Phil
-----
Pitt
-----
Wash
DC
-----
Bufflo
-----
Erie
-----
Youngs
town
-----
Elmira
-----
Harris
Lncstr
-----
Johns-
Altoon
-----
Wilkes
Barre
-----
URBAN
-----
SUBURB
-----
RURAL
-----
600 3 248 132 1 2 19 5 2 89 33 66 103 299 196
100.00% 100.00% 100.00% 100.00% 100.00% 100.00% 100.00% 100.00% 100.00% 100.00% 100.00% 100.00% 100.00% 100.00% 100.00%
600 3 248 132 1 2 19 5 2 89 33 66 103 299 196
100.00% 100.00% 100.00% 100.00% 100.00% 100.00% 100.00% 100.00% 100.00% 100.00% 100.00% 100.00% 100.00% 100.00% 100.00%
84 - 37 20 - 1 5 - 1 10 4 6 12 50 21
14.00% 14.92% 15.15% 50.00% 26.32% 50.00% 11.24% 12.12% 9.09% 11.65% 16.72% 10.71%
247 1 111 58 - - 3 2 - 35 8 29 45 129 72
41.17% 33.33% 44.76% 43.94% 15.79% 40.00% 39.33% 24.24% 43.94% 43.69% 43.14% 36.73%
269 2 100 54 1 1 11 3 1 44 21 31 46 120 103
44.83% 66.67% 40.32% 40.91% 100.00% 50.00% 57.89% 60.00% 50.00% 49.44% 63.64% 46.97% 44.66% 40.13% 52.55%
Somewhat likely to vote by mail
Very likely to vote by mail
Not likely/Would still vote at polling
place
MEDIA MARKET
----------------------------------------------------------------------------
REGION Q16
--------------------
Total
Total Answering
Restoration PAC, Pennsylvania Statewide - May 2020 Banner 3 Page 84 of 290

15. What was the last grade you completed in school?
Total
-----
New
York
-----
Phil
-----
Pitt
-----
Wash
DC
-----
Bufflo
-----
Erie
-----
Youngs
town
-----
Elmira
-----
Harris
Lncstr
-----
Johns-
Altoon
-----
Wilkes
Barre
-----
URBAN
-----
SUBURB
-----
RURAL
-----
600 3 248 132 1 2 19 5 2 89 33 66 103 299 196
100.00% 100.00% 100.00% 100.00% 100.00% 100.00% 100.00% 100.00% 100.00% 100.00% 100.00% 100.00% 100.00% 100.00% 100.00%
600 3 248 132 1 2 19 5 2 89 33 66 103 299 196
100.00% 100.00% 100.00% 100.00% 100.00% 100.00% 100.00% 100.00% 100.00% 100.00% 100.00% 100.00% 100.00% 100.00% 100.00%
3 - 2 - - - - - - - - 1 2 1 -
0.50% 0.81% 1.52% 1.94% 0.33%
153 - 51 34 1 - 7 2 1 27 4 26 33 46 73
25.50% 20.56% 25.76% 100.00% 36.84% 40.00% 50.00% 30.34% 12.12% 39.39% 32.04% 15.38% 37.24%
30 1 10 10 - - 2 - - 5 1 1 2 15 13
5.00% 33.33% 4.03% 7.58% 10.53% 5.62% 3.03% 1.52% 1.94% 5.02% 6.63%
282 1 118 61 - 2 9 3 1 41 22 24 45 154 82
47.00% 33.33% 47.58% 46.21% 100.00% 47.37% 60.00% 50.00% 46.07% 66.67% 36.36% 43.69% 51.51% 41.84%
130 1 65 27 - - 1 - - 16 6 14 20 83 27
21.67% 33.33% 26.21% 20.45% 5.26% 17.98% 18.18% 21.21% 19.42% 27.76% 13.78%
2 - 2 - - - - - - - - - 1 - 1
0.33% 0.81% 0.97% 0.51%
156 - 53 34 1 - 7 2 1 27 4 27 35 47 73
26.00% 21.37% 25.76% 100.00% 36.84% 40.00% 50.00% 30.34% 12.12% 40.91% 33.98% 15.72% 37.24%
312 2 128 71 - 2 11 3 1 46 23 25 47 169 95
52.00% 66.67% 51.61% 53.79% 100.00% 57.89% 60.00% 50.00% 51.69% 69.70% 37.88% 45.63% 56.52% 48.47%
130 1 65 27 - - 1 - - 16 6 14 20 83 27
21.67% 33.33% 26.21% 20.45% 5.26% 17.98% 18.18% 21.21% 19.42% 27.76% 13.78%
TECHNICAL/VOCATIONAL
SCHOOL
COLLEGE
GRADUATE SCHOOL
REFUSED
High School
College
College+
MEDIA MARKET
----------------------------------------------------------------------------
REGION Q16
--------------------
Total
Total Answering
GRADE SCHOOL [1-8]
HIGH SCHOOL [9-12]
Restoration PAC, Pennsylvania Statewide - May 2020 Banner 3 Page 85 of 290

16. Thinking about where you live, do you consider it to be urban, suburban or rural?
Total
-----
New
York
-----
Phil
-----
Pitt
-----
Wash
DC
-----
Bufflo
-----
Erie
-----
Youngs
town
-----
Elmira
-----
Harris
Lncstr
-----
Johns-
Altoon
-----
Wilkes
Barre
-----
URBAN
-----
SUBURB
-----
RURAL
-----
600 3 248 132 1 2 19 5 2 89 33 66 103 299 196
100.00% 100.00% 100.00% 100.00% 100.00% 100.00% 100.00% 100.00% 100.00% 100.00% 100.00% 100.00% 100.00% 100.00% 100.00%
600 3 248 132 1 2 19 5 2 89 33 66 103 299 196
100.00% 100.00% 100.00% 100.00% 100.00% 100.00% 100.00% 100.00% 100.00% 100.00% 100.00% 100.00% 100.00% 100.00% 100.00%
103 - 62 19 - - 6 - - 7 1 8 103 - -
17.17% 25.00% 14.39% 31.58% 7.87% 3.03% 12.12% 100.00%
299 1 148 68 - - 4 1 - 45 11 21 - 299 -
49.83% 33.33% 59.68% 51.52% 21.05% 20.00% 50.56% 33.33% 31.82% 100.00%
196 2 38 43 1 2 9 4 2 37 21 37 - - 196
32.67% 66.67% 15.32% 32.58% 100.00% 100.00% 47.37% 80.00% 100.00% 41.57% 63.64% 56.06% 100.00%
2 - - 2 - - - - - - - - - - -
0.33% 1.52%
Total
Total Answering
URBAN
SUBURBAN
RURAL
DON'T KNOW
MEDIA MARKET
----------------------------------------------------------------------------
REGION Q16
--------------------
Restoration PAC, Pennsylvania Statewide - May 2020 Banner 3 Page 86 of 290

17. Gender
Total
-----
New
York
-----
Phil
-----
Pitt
-----
Wash
DC
-----
Bufflo
-----
Erie
-----
Youngs
town
-----
Elmira
-----
Harris
Lncstr
-----
Johns-
Altoon
-----
Wilkes
Barre
-----
URBAN
-----
SUBURB
-----
RURAL
-----
600 3 248 132 1 2 19 5 2 89 33 66 103 299 196
100.00% 100.00% 100.00% 100.00% 100.00% 100.00% 100.00% 100.00% 100.00% 100.00% 100.00% 100.00% 100.00% 100.00% 100.00%
600 3 248 132 1 2 19 5 2 89 33 66 103 299 196
100.00% 100.00% 100.00% 100.00% 100.00% 100.00% 100.00% 100.00% 100.00% 100.00% 100.00% 100.00% 100.00% 100.00% 100.00%
286 2 120 65 1 2 11 2 1 38 15 29 46 151 88
47.67% 66.67% 48.39% 49.24% 100.00% 100.00% 57.89% 40.00% 50.00% 42.70% 45.45% 43.94% 44.66% 50.50% 44.90%
314 1 128 67 - - 8 3 1 51 18 37 57 148 108
52.33% 33.33% 51.61% 50.76% 42.11% 60.00% 50.00% 57.30% 54.55% 56.06% 55.34% 49.50% 55.10%
Total Answering
Male
Female
MEDIA MARKET
----------------------------------------------------------------------------
REGION Q16
--------------------
Total
Restoration PAC, Pennsylvania Statewide - May 2020 Banner 3 Page 87 of 290

Table of contents
Banner 4
Table market
Table q1
Table q2
Table q3
Table q4
Table q5
Table q6
Table q7a
Table q7b
Table q7Summ
Table q8
Table corona_1
Table corona_2
Table corona_3
Table q10
Table q11a
Table q11b
Table q11_Summ
Table age
Table q13
Table q14a
Table q14b
Table q14_SUMM
Table ballot
14a. In politics today, do you generally consider yourself .... a republican, a democrat, an independent or something else?
14b. Do you think of yourself closer to the Republican Party or Democratic Party?
14. Party Summary
BALLOT. If a mail-in ballot was mailed to you, how likely would you be to vote by mail this fall, as opposed to voting in-person at your polling place?
11a. If the election for US Congress were being held today, for whom would you vote.... the Republican candidate or the Democrat candidate?
11b. Would you say you are leaning toward the Republican candidate or leaning toward the Democrat candidate?
11. Summary Generic US Congress
12. Age
13. Which two of the following issues do you believe are the most important issues facing the country? [Select up to 2]
CORONAVIRUS 1. With over 60,000 Americans dead from the pandemic, how worried are you that you, or someone close to you, will be infected with coronavirus?
CORONAVIRUS 2. Which statement do you agree with, or agree with more: "It's time for people to get back to work." or "It's too early to lift stay-at-home restrictions."
CORONAVIRUS 3. Which statement do you agree with, or agree with more: "We should re-open the economy, even if that means more people will get coronavirus." or "We
should continue the shelter-in-place restrictions, even if that means severe job losses and economic disruption."
10. Do you think it was fair or unfair that Democrat President Obama's administration investigated and surveilled Republican Donald Trump as both a presidential candidate and
president-elect for allegedly colluding with Russia?
Media Market
1. Thinking ahead to the November election, how likely would you say you are to vote in these elections? Would you say you are…
2. Do you think the country is going in the right direction, or have things pretty seriously gone off on the wrong track?
3. Do you think the economy is going in the right direction, or have things pretty seriously gone off on the wrong track?
4. Do you approve or disapprove of the job Donald Trump is doing as President? Would that be strongly or somewhat (approve or disapprove)?
5. Do you think the impeachment of President Trump was good for the country, bad for the country, or did the impeachment not really matter that much?
6. Do you have a favorable or unfavorable impression of Donald Trump?
7a. If the election for President were being held today, and the candidates were Donald Trump and Joe Biden, for whom would you vote?
7b. Would you say you are leaning toward Donald Trump or leaning toward Joe Biden?
7. Biden Ballot Summary
8. Do you approve or disapprove of the way President Trump is handling the Coronavirus crisis?
Restoration PAC, Pennsylvania Statewide - May 2020 Banner 4 Page 88 of 290

Table q15
Table q16
Table q17
15. What was the last grade you completed in school?
16. Thinking about where you live, do you consider it to be urban, suburban or rural?
17. Gender
Restoration PAC, Pennsylvania Statewide - May 2020 Banner 4 Page 89 of 290

Media Market
Total
---------
Very
---------
Somewhat
---------
Right
---------
Wrong
---------
Right
---------
Wrong
---------
Approve
---------
Disappr
---------
Favorable
---------
Unfavorble
---------
600 579 21 230 339 202 362 314 274 296 292
100.00% 100.00% 100.00% 100.00% 100.00% 100.00% 100.00% 100.00% 100.00% 100.00% 100.00%
600 579 21 230 339 202 362 314 274 296 292
100.00% 100.00% 100.00% 100.00% 100.00% 100.00% 100.00% 100.00% 100.00% 100.00% 100.00%
3 1 2 3 - 3 - 2 - 2 -
0.50% 0.17% 9.52% 1.30% 1.49% 0.64% 0.68%
248 238 10 79 159 69 168 104 138 97 147
41.33% 41.11% 47.62% 34.35% 46.90% 34.16% 46.41% 33.12% 50.36% 32.77% 50.34%
132 130 2 55 71 48 77 77 53 72 57
22.00% 22.45% 9.52% 23.91% 20.94% 23.76% 21.27% 24.52% 19.34% 24.32% 19.52%
1 1 - 1 - - 1 1 - 1 -
0.17% 0.17% 0.43% 0.28% 0.32% 0.34%
2 2 - 2 - 2 - 1 1 1 1
0.33% 0.35% 0.87% 0.99% 0.32% 0.36% 0.34% 0.34%
19 18 1 7 12 8 10 10 8 10 8
3.17% 3.11% 4.76% 3.04% 3.54% 3.96% 2.76% 3.18% 2.92% 3.38% 2.74%
5 5 - 2 2 1 3 3 2 3 2
0.83% 0.86% 0.87% 0.59% 0.50% 0.83% 0.96% 0.73% 1.01% 0.68%
2 2 - 1 1 1 - 1 1 1 1
0.33% 0.35% 0.43% 0.29% 0.50% 0.32% 0.36% 0.34% 0.34%
89 85 4 36 45 31 50 55 33 51 35
14.83% 14.68% 19.05% 15.65% 13.27% 15.35% 13.81% 17.52% 12.04% 17.23% 11.99%
33 32 1 16 13 14 16 25 8 23 10
5.50% 5.53% 4.76% 6.96% 3.83% 6.93% 4.42% 7.96% 2.92% 7.77% 3.42%
66 65 1 28 36 25 37 35 30 35 31
11.00% 11.23% 4.76% 12.17% 10.62% 12.38% 10.22% 11.15% 10.95% 11.82% 10.62%
508 - PITTSBURGH
511 - WASHINGTON, DC
(HAGRSTWN)
514 - BUFFALO
516 - ERIE
536 - YOUNGSTOWN
565 - ELMIRA (CORNING)
566 - HARRISBURG-LNCSTR-
LEB-YORK
574 - JOHNSTOWN-ALTOONA-
ST COLGE
577 - WILKES BARRE-
SCRANTON-HZTN
LIKELY VOTER Q1
---------------------
MOOD Q2
---------------------
ECON MOOD Q3
---------------------
TRUMP JOB Q4
---------------------
TRUMP FAV Q6
---------------------
Total
Total Answering
501 - NEW YORK
504 - PHILADELPHIA
Restoration PAC, Pennsylvania Statewide - May 2020 Banner 4 Page 90 of 290

1. Thinking ahead to the November election, how likely would you say you are to vote in these elections? Would you say you are…
Total
---------
Very
---------
Somewhat
---------
Right
---------
Wrong
---------
Right
---------
Wrong
---------
Approve
---------
Disappr
---------
Favorable
---------
Unfavorble
---------
600 579 21 230 339 202 362 314 274 296 292
100.00% 100.00% 100.00% 100.00% 100.00% 100.00% 100.00% 100.00% 100.00% 100.00% 100.00%
600 579 21 230 339 202 362 314 274 296 292
100.00% 100.00% 100.00% 100.00% 100.00% 100.00% 100.00% 100.00% 100.00% 100.00% 100.00%
579 579 - 223 326 198 347 308 262 291 281
96.50% 100.00% 96.96% 96.17% 98.02% 95.86% 98.09% 95.62% 98.31% 96.23%
21 - 21 7 13 4 15 6 12 5 11
3.50% 100.00% 3.04% 3.83% 1.98% 4.14% 1.91% 4.38% 1.69% 3.77%
LIKELY VOTER Q1
---------------------
MOOD Q2
---------------------
ECON MOOD Q3
---------------------
TRUMP JOB Q4
---------------------
TRUMP FAV Q6
---------------------
Total
Total Answering
VERY LIKELY
SOMEWHAT LIKELY
Restoration PAC, Pennsylvania Statewide - May 2020 Banner 4 Page 91 of 290

2. Do you think the country is going in the right direction, or have things pretty seriously gone off on the wrong track?
Total
---------
Very
---------
Somewhat
---------
Right
---------
Wrong
---------
Right
---------
Wrong
---------
Approve
---------
Disappr
---------
Favorable
---------
Unfavorble
---------
600 579 21 230 339 202 362 314 274 296 292
100.00% 100.00% 100.00% 100.00% 100.00% 100.00% 100.00% 100.00% 100.00% 100.00% 100.00%
600 579 21 230 339 202 362 314 274 296 292
100.00% 100.00% 100.00% 100.00% 100.00% 100.00% 100.00% 100.00% 100.00% 100.00% 100.00%
230 223 7 230 - 173 47 218 7 215 10
38.33% 38.51% 33.33% 100.00% 85.64% 12.98% 69.43% 2.55% 72.64% 3.42%
339 326 13 - 339 23 300 71 262 62 271
56.50% 56.30% 61.90% 100.00% 11.39% 82.87% 22.61% 95.62% 20.95% 92.81%
27 26 1 - - 5 15 21 5 16 11
4.50% 4.49% 4.76% 2.48% 4.14% 6.69% 1.82% 5.41% 3.77%
4 4 - - - 1 - 4 - 3 -
0.67% 0.69% 0.50% 1.27% 1.01%
DON’T KNOW
REFUSED
LIKELY VOTER Q1
---------------------
MOOD Q2
---------------------
ECON MOOD Q3
---------------------
TRUMP JOB Q4
---------------------
TRUMP FAV Q6
---------------------
Total
Total Answering
RIGHT DIRECTION
WRONG TRACK
Restoration PAC, Pennsylvania Statewide - May 2020 Banner 4 Page 92 of 290

3. Do you think the economy is going in the right direction, or have things pretty seriously gone off on the wrong track?
Total
---------
Very
---------
Somewhat
---------
Right
---------
Wrong
---------
Right
---------
Wrong
---------
Approve
---------
Disappr
---------
Favorable
---------
Unfavorble
---------
600 579 21 230 339 202 362 314 274 296 292
100.00% 100.00% 100.00% 100.00% 100.00% 100.00% 100.00% 100.00% 100.00% 100.00% 100.00%
600 579 21 230 339 202 362 314 274 296 292
100.00% 100.00% 100.00% 100.00% 100.00% 100.00% 100.00% 100.00% 100.00% 100.00% 100.00%
202 198 4 173 23 202 - 180 19 177 23
33.67% 34.20% 19.05% 75.22% 6.78% 100.00% 57.32% 6.93% 59.80% 7.88%
362 347 15 47 300 - 362 115 240 104 254
60.33% 59.93% 71.43% 20.43% 88.50% 100.00% 36.62% 87.59% 35.14% 86.99%
32 30 2 10 15 - - 16 14 13 14
5.33% 5.18% 9.52% 4.35% 4.42% 5.10% 5.11% 4.39% 4.79%
4 4 - - 1 - - 3 1 2 1
0.67% 0.69% 0.29% 0.96% 0.36% 0.68% 0.34%
RIGHT DIRECTION
WRONG TRACK
DON’T KNOW
REFUSED
LIKELY VOTER Q1
---------------------
MOOD Q2
---------------------
ECON MOOD Q3
---------------------
TRUMP JOB Q4
---------------------
TRUMP FAV Q6
---------------------
Total
Total Answering
Restoration PAC, Pennsylvania Statewide - May 2020 Banner 4 Page 93 of 290

4. Do you approve or disapprove of the job Donald Trump is doing as President? Would that be strongly or somewhat (approve or disapprove)?
Total
---------
Very
---------
Somewhat
---------
Right
---------
Wrong
---------
Right
---------
Wrong
---------
Approve
---------
Disappr
---------
Favorable
---------
Unfavorble
---------
600 579 21 230 339 202 362 314 274 296 292
100.00% 100.00% 100.00% 100.00% 100.00% 100.00% 100.00% 100.00% 100.00% 100.00% 100.00%
600 579 21 230 339 202 362 314 274 296 292
100.00% 100.00% 100.00% 100.00% 100.00% 100.00% 100.00% 100.00% 100.00% 100.00% 100.00%
268 265 3 191 59 157 96 268 - 253 11
44.67% 45.77% 14.29% 83.04% 17.40% 77.72% 26.52% 85.35% 85.47% 3.77%
46 43 3 27 12 23 19 46 - 39 7
7.67% 7.43% 14.29% 11.74% 3.54% 11.39% 5.25% 14.65% 13.18% 2.40%
18 15 3 4 13 6 11 - 18 1 17
3.00% 2.59% 14.29% 1.74% 3.83% 2.97% 3.04% 6.57% 0.34% 5.82%
256 247 9 3 249 13 229 - 256 1 251
42.67% 42.66% 42.86% 1.30% 73.45% 6.44% 63.26% 93.43% 0.34% 85.96%
12 9 3 5 6 3 7 - - 2 6
2.00% 1.55% 14.29% 2.17% 1.77% 1.49% 1.93% 0.68% 2.05%
314 308 6 218 71 180 115 314 - 292 18
52.33% 53.20% 28.57% 94.78% 20.94% 89.11% 31.77% 100.00% 98.65% 6.16%
274 262 12 7 262 19 240 - 274 2 268
45.67% 45.25% 57.14% 3.04% 77.29% 9.41% 66.30% 100.00% 0.68% 91.78%
Total
Total Answering
STRONGLY APPROVE
SOMEWHAT APPROVE
SOMEWHAT DISAPPROVE
STRONGLY DISAPPROVE
DON’T KNOW/NO ANSWER
Total Approve
Total Disapprove
LIKELY VOTER Q1
---------------------
MOOD Q2
---------------------
ECON MOOD Q3
---------------------
TRUMP JOB Q4
---------------------
TRUMP FAV Q6
---------------------
Restoration PAC, Pennsylvania Statewide - May 2020 Banner 4 Page 94 of 290

5. Do you think the impeachment of President Trump was good for the country, bad for the country, or did the impeachment not really matter that much?
Total
---------
Very
---------
Somewhat
---------
Right
---------
Wrong
---------
Right
---------
Wrong
---------
Approve
---------
Disappr
---------
Favorable
---------
Unfavorble
---------
600 579 21 230 339 202 362 314 274 296 292
100.00% 100.00% 100.00% 100.00% 100.00% 100.00% 100.00% 100.00% 100.00% 100.00% 100.00%
600 579 21 230 339 202 362 314 274 296 292
100.00% 100.00% 100.00% 100.00% 100.00% 100.00% 100.00% 100.00% 100.00% 100.00% 100.00%
107 105 2 17 86 14 89 23 82 20 86
17.83% 18.13% 9.52% 7.39% 25.37% 6.93% 24.59% 7.32% 29.93% 6.76% 29.45%
289 280 9 183 88 152 121 246 41 235 49
48.17% 48.36% 42.86% 79.57% 25.96% 75.25% 33.43% 78.34% 14.96% 79.39% 16.78%
204 194 10 30 165 36 152 45 151 41 157
34.00% 33.51% 47.62% 13.04% 48.67% 17.82% 41.99% 14.33% 55.11% 13.85% 53.77%
DOESN'T MATTER/DON'T
KNOW
LIKELY VOTER Q1
---------------------
MOOD Q2
---------------------
ECON MOOD Q3
---------------------
TRUMP JOB Q4
---------------------
TRUMP FAV Q6
---------------------
Total
Total Answering
GOOD
BAD
Restoration PAC, Pennsylvania Statewide - May 2020 Banner 4 Page 95 of 290

6. Do you have a favorable or unfavorable impression of Donald Trump?
Total
---------
Very
---------
Somewhat
---------
Right
---------
Wrong
---------
Right
---------
Wrong
---------
Approve
---------
Disappr
---------
Favorable
---------
Unfavorble
---------
600 579 21 230 339 202 362 314 274 296 292
100.00% 100.00% 100.00% 100.00% 100.00% 100.00% 100.00% 100.00% 100.00% 100.00% 100.00%
600 579 21 230 339 202 362 314 274 296 292
100.00% 100.00% 100.00% 100.00% 100.00% 100.00% 100.00% 100.00% 100.00% 100.00% 100.00%
243 241 2 183 47 150 83 240 1 243 -
40.50% 41.62% 9.52% 79.57% 13.86% 74.26% 22.93% 76.43% 0.36% 82.09%
53 50 3 32 15 27 21 52 1 53 -
8.83% 8.64% 14.29% 13.91% 4.42% 13.37% 5.80% 16.56% 0.36% 17.91%
11 6 5 4 6 2 4 4 4 - -
1.83% 1.04% 23.81% 1.74% 1.77% 0.99% 1.10% 1.27% 1.46%
24 22 2 3 17 7 16 9 14 - 24
4.00% 3.80% 9.52% 1.30% 5.01% 3.47% 4.42% 2.87% 5.11% 8.22%
268 259 9 7 254 16 238 9 254 - 268
44.67% 44.73% 42.86% 3.04% 74.93% 7.92% 65.75% 2.87% 92.70% 91.78%
- - - - - - - - - - -
1 1 - 1 - - - - - - -
0.17% 0.17% 0.43%
296 291 5 215 62 177 104 292 2 296 -
49.33% 50.26% 23.81% 93.48% 18.29% 87.62% 28.73% 92.99% 0.73% 100.00%
292 281 11 10 271 23 254 18 268 - 292
48.67% 48.53% 52.38% 4.35% 79.94% 11.39% 70.17% 5.73% 97.81% 100.00%
Somewhat FAVORABLE
NO OPINION
Somewhat UNFAVORABLE
Strongly UNFAVORABLE
DON’T KNOW/NOT SURE
REFUSED
Total Favorable
Total Unfavorable
LIKELY VOTER Q1
---------------------
MOOD Q2
---------------------
ECON MOOD Q3
---------------------
TRUMP JOB Q4
---------------------
TRUMP FAV Q6
---------------------
Total
Total Answering
Strongly FAVORABLE
Restoration PAC, Pennsylvania Statewide - May 2020 Banner 4 Page 96 of 290

7a. If the election for President were being held today, and the candidates were Donald Trump and Joe Biden, for whom would you vote?
Total
---------
Very
---------
Somewhat
---------
Right
---------
Wrong
---------
Right
---------
Wrong
---------
Approve
---------
Disappr
---------
Favorable
---------
Unfavorble
---------
600 579 21 230 339 202 362 314 274 296 292
100.00% 100.00% 100.00% 100.00% 100.00% 100.00% 100.00% 100.00% 100.00% 100.00% 100.00%
600 579 21 230 339 202 362 314 274 296 292
100.00% 100.00% 100.00% 100.00% 100.00% 100.00% 100.00% 100.00% 100.00% 100.00% 100.00%
286 283 3 206 58 170 100 282 3 277 7
47.67% 48.88% 14.29% 89.57% 17.11% 84.16% 27.62% 89.81% 1.09% 93.58% 2.40%
15 11 4 11 3 9 6 13 1 11 3
2.50% 1.90% 19.05% 4.78% 0.88% 4.46% 1.66% 4.14% 0.36% 3.72% 1.03%
22 19 3 4 16 4 12 10 10 4 15
3.67% 3.28% 14.29% 1.74% 4.72% 1.98% 3.31% 3.18% 3.65% 1.35% 5.14%
15 13 2 1 14 - 15 - 14 - 14
2.50% 2.25% 9.52% 0.43% 4.13% 4.14% 5.11% 4.79%
258 249 9 7 245 18 227 8 244 3 251
43.00% 43.01% 42.86% 3.04% 72.27% 8.91% 62.71% 2.55% 89.05% 1.01% 85.96%
4 4 - 1 3 1 2 1 2 1 2
0.67% 0.69% 0.43% 0.88% 0.50% 0.55% 0.32% 0.73% 0.34% 0.68%
301 294 7 217 61 179 106 295 4 288 10
50.17% 50.78% 33.33% 94.35% 17.99% 88.61% 29.28% 93.95% 1.46% 97.30% 3.42%
22 19 3 4 16 4 12 10 10 4 15
3.67% 3.28% 14.29% 1.74% 4.72% 1.98% 3.31% 3.18% 3.65% 1.35% 5.14%
273 262 11 8 259 18 242 8 258 3 265
45.50% 45.25% 52.38% 3.48% 76.40% 8.91% 66.85% 2.55% 94.16% 1.01% 90.75%
Probably BIDEN
Definitely BIDEN
Refused
Total Trump
Total Undecided
Total Biden
MOOD Q2
---------------------
ECON MOOD Q3
---------------------
TRUMP JOB Q4
---------------------
TRUMP FAV Q6
---------------------
Total
Total Answering
Definitely TRUMP
Probably TRUMP
UNDECIDED
LIKELY VOTER Q1
---------------------
Restoration PAC, Pennsylvania Statewide - May 2020 Banner 4 Page 97 of 290

7b. Would you say you are leaning toward Donald Trump or leaning toward Joe Biden?
Total
---------
Very
---------
Somewhat
---------
Right
---------
Wrong
---------
Right
---------
Wrong
---------
Approve
---------
Disappr
---------
Favorable
---------
Unfavorble
---------
600 579 21 230 339 202 362 314 274 296 292
100.00% 100.00% 100.00% 100.00% 100.00% 100.00% 100.00% 100.00% 100.00% 100.00% 100.00%
26 23 3 5 19 5 14 11 12 5 17
4.33% 3.97% 14.29% 2.17% 5.60% 2.48% 3.87% 3.50% 4.38% 1.69% 5.82%
2 2 - - 1 - 1 2 - - 1
0.33% 0.35% 0.29% 0.28% 0.64% 0.34%
21 19 2 4 16 4 11 8 10 4 14
3.50% 3.28% 9.52% 1.74% 4.72% 1.98% 3.04% 2.55% 3.65% 1.35% 4.79%
3 2 1 1 2 1 2 1 2 1 2
0.50% 0.35% 4.76% 0.43% 0.59% 0.50% 0.55% 0.32% 0.73% 0.34% 0.68%
TRUMP JOB Q4
---------------------
TRUMP FAV Q6
---------------------
Total
Total Answering
LEAN TRUMP
HARD UNDECIDED
LEAN BIDEN
LIKELY VOTER Q1
---------------------
MOOD Q2
---------------------
ECON MOOD Q3
---------------------
Restoration PAC, Pennsylvania Statewide - May 2020 Banner 4 Page 98 of 290

7. Biden Ballot Summary
Total
---------
Very
---------
Somewhat
---------
Right
---------
Wrong
---------
Right
---------
Wrong
---------
Approve
---------
Disappr
---------
Favorable
---------
Unfavorble
---------
600 579 21 230 339 202 362 314 274 296 292
100.00% 100.00% 100.00% 100.00% 100.00% 100.00% 100.00% 100.00% 100.00% 100.00% 100.00%
600 579 21 230 339 202 362 314 274 296 292
100.00% 100.00% 100.00% 100.00% 100.00% 100.00% 100.00% 100.00% 100.00% 100.00% 100.00%
303 296 7 217 62 179 107 297 4 288 11
50.50% 51.12% 33.33% 94.35% 18.29% 88.61% 29.56% 94.59% 1.46% 97.30% 3.77%
21 19 2 4 16 4 11 8 10 4 14
3.50% 3.28% 9.52% 1.74% 4.72% 1.98% 3.04% 2.55% 3.65% 1.35% 4.79%
276 264 12 9 261 19 244 9 260 4 267
46.00% 45.60% 57.14% 3.91% 76.99% 9.41% 67.40% 2.87% 94.89% 1.35% 91.44%
Total
Total Answering
ALL TRUMP
ALL UNDECIDED
ALL BIDEN
LIKELY VOTER Q1
---------------------
MOOD Q2
---------------------
ECON MOOD Q3
---------------------
TRUMP JOB Q4
---------------------
TRUMP FAV Q6
---------------------
Restoration PAC, Pennsylvania Statewide - May 2020 Banner 4 Page 99 of 290

8. Do you approve or disapprove of the way President Trump is handling the Coronavirus crisis?
Total
---------
Very
---------
Somewhat
---------
Right
---------
Wrong
---------
Right
---------
Wrong
---------
Approve
---------
Disappr
---------
Favorable
---------
Unfavorble
---------
600 579 21 230 339 202 362 314 274 296 292
100.00% 100.00% 100.00% 100.00% 100.00% 100.00% 100.00% 100.00% 100.00% 100.00% 100.00%
600 579 21 230 339 202 362 314 274 296 292
100.00% 100.00% 100.00% 100.00% 100.00% 100.00% 100.00% 100.00% 100.00% 100.00% 100.00%
222 219 3 169 42 135 74 216 4 211 7
37.00% 37.82% 14.29% 73.48% 12.39% 66.83% 20.44% 68.79% 1.46% 71.28% 2.40%
89 83 6 49 29 42 42 79 8 73 13
14.83% 14.34% 28.57% 21.30% 8.55% 20.79% 11.60% 25.16% 2.92% 24.66% 4.45%
24 23 1 3 19 6 14 6 16 3 20
4.00% 3.97% 4.76% 1.30% 5.60% 2.97% 3.87% 1.91% 5.84% 1.01% 6.85%
253 242 11 5 243 13 227 5 242 3 246
42.17% 41.80% 52.38% 2.17% 71.68% 6.44% 62.71% 1.59% 88.32% 1.01% 84.25%
12 12 - 4 6 6 5 8 4 6 6
2.00% 2.07% 1.74% 1.77% 2.97% 1.38% 2.55% 1.46% 2.03% 2.05%
311 302 9 218 71 177 116 295 12 284 20
51.83% 52.16% 42.86% 94.78% 20.94% 87.62% 32.04% 93.95% 4.38% 95.95% 6.85%
277 265 12 8 262 19 241 11 258 6 266
46.17% 45.77% 57.14% 3.48% 77.29% 9.41% 66.57% 3.50% 94.16% 2.03% 91.10%
Total Disapprove
TRUMP FAV Q6
---------------------
Total
Total Answering
STRONGLY APPROVE
SOMEWHAT APPROVE
SOMEWHAT DISAPPROVE
STRONGLY DISAPPROVE
DON’T KNOW/NO ANSWER
Total Approve
LIKELY VOTER Q1
---------------------
MOOD Q2
---------------------
ECON MOOD Q3
---------------------
TRUMP JOB Q4
---------------------
Restoration PAC, Pennsylvania Statewide - May 2020 Banner 4 Page 100 of 290

CORONAVIRUS 1. With over 60,000 Americans dead from the pandemic, how worried are you that you, or someone close to you, will be infected with coronavirus?
Total
---------
Very
---------
Somewhat
---------
Right
---------
Wrong
---------
Right
---------
Wrong
---------
Approve
---------
Disappr
---------
Favorable
---------
Unfavorble
---------
600 579 21 230 339 202 362 314 274 296 292
100.00% 100.00% 100.00% 100.00% 100.00% 100.00% 100.00% 100.00% 100.00% 100.00% 100.00%
600 579 21 230 339 202 362 314 274 296 292
100.00% 100.00% 100.00% 100.00% 100.00% 100.00% 100.00% 100.00% 100.00% 100.00% 100.00%
168 164 4 105 53 86 71 149 17 140 26
28.00% 28.32% 19.05% 45.65% 15.63% 42.57% 19.61% 47.45% 6.20% 47.30% 8.90%
223 215 8 93 117 77 128 116 104 109 106
37.17% 37.13% 38.10% 40.43% 34.51% 38.12% 35.36% 36.94% 37.96% 36.82% 36.30%
209 200 9 32 169 39 163 49 153 47 160
34.83% 34.54% 42.86% 13.91% 49.85% 19.31% 45.03% 15.61% 55.84% 15.88% 54.79%
SOMEWHAT WORRIED
VERY WORRIED
LIKELY VOTER Q1
---------------------
MOOD Q2
---------------------
ECON MOOD Q3
---------------------
TRUMP JOB Q4
---------------------
TRUMP FAV Q6
---------------------
Total
Total Answering
NOT WORRIED
Restoration PAC, Pennsylvania Statewide - May 2020 Banner 4 Page 101 of 290

CORONAVIRUS 2. Which statement do you agree with, or agree with more: "It's time for people to get back to work." or "It's too early to lift stay-at-home restrictions."
Total
---------
Very
---------
Somewhat
---------
Right
---------
Wrong
---------
Right
---------
Wrong
---------
Approve
---------
Disappr
---------
Favorable
---------
Unfavorble
---------
600 579 21 230 339 202 362 314 274 296 292
100.00% 100.00% 100.00% 100.00% 100.00% 100.00% 100.00% 100.00% 100.00% 100.00% 100.00%
600 579 21 230 339 202 362 314 274 296 292
100.00% 100.00% 100.00% 100.00% 100.00% 100.00% 100.00% 100.00% 100.00% 100.00% 100.00%
309 303 6 194 95 161 131 267 37 254 49
51.50% 52.33% 28.57% 84.35% 28.02% 79.70% 36.19% 85.03% 13.50% 85.81% 16.78%
291 276 15 36 244 41 231 47 237 42 243
48.50% 47.67% 71.43% 15.65% 71.98% 20.30% 63.81% 14.97% 86.50% 14.19% 83.22%
WORK
STAY HOME
LIKELY VOTER Q1
---------------------
MOOD Q2
---------------------
ECON MOOD Q3
---------------------
TRUMP JOB Q4
---------------------
TRUMP FAV Q6
---------------------
Total
Total Answering
Restoration PAC, Pennsylvania Statewide - May 2020 Banner 4 Page 102 of 290

Total
---------
Very
---------
Somewhat
---------
Right
---------
Wrong
---------
Right
---------
Wrong
---------
Approve
---------
Disappr
---------
Favorable
---------
Unfavorble
---------
600 579 21 230 339 202 362 314 274 296 292
100.00% 100.00% 100.00% 100.00% 100.00% 100.00% 100.00% 100.00% 100.00% 100.00% 100.00%
600 579 21 230 339 202 362 314 274 296 292
100.00% 100.00% 100.00% 100.00% 100.00% 100.00% 100.00% 100.00% 100.00% 100.00% 100.00%
301 295 6 192 89 159 125 262 35 249 47
50.17% 50.95% 28.57% 83.48% 26.25% 78.71% 34.53% 83.44% 12.77% 84.12% 16.10%
299 284 15 38 250 43 237 52 239 47 245
49.83% 49.05% 71.43% 16.52% 73.75% 21.29% 65.47% 16.56% 87.23% 15.88% 83.90%
CORONAVIRUS 3. Which statement do you agree with, or agree with more: "We should re-open the economy, even if that means more people will get coronavirus." or "We should continue the shelter-in-place
restrictions, even if that means severe job losses and economic disruption."
OPEN/VIRUS
SHUTDOWN/JOBS
LIKELY VOTER Q1
---------------------
MOOD Q2
---------------------
ECON MOOD Q3
---------------------
TRUMP JOB Q4
---------------------
TRUMP FAV Q6
---------------------
Total
Total Answering
Restoration PAC, Pennsylvania Statewide - May 2020 Banner 4 Page 103 of 290

Total
---------
Very
---------
Somewhat
---------
Right
---------
Wrong
---------
Right
---------
Wrong
---------
Approve
---------
Disappr
---------
Favorable
---------
Unfavorble
---------
600 579 21 230 339 202 362 314 274 296 292
100.00% 100.00% 100.00% 100.00% 100.00% 100.00% 100.00% 100.00% 100.00% 100.00% 100.00%
600 579 21 230 339 202 362 314 274 296 292
100.00% 100.00% 100.00% 100.00% 100.00% 100.00% 100.00% 100.00% 100.00% 100.00% 100.00%
235 226 9 23 206 29 194 29 203 22 209
39.17% 39.03% 42.86% 10.00% 60.77% 14.36% 53.59% 9.24% 74.09% 7.43% 71.58%
285 277 8 188 81 160 109 256 23 248 33
47.50% 47.84% 38.10% 81.74% 23.89% 79.21% 30.11% 81.53% 8.39% 83.78% 11.30%
80 76 4 19 52 13 59 29 48 26 50
13.33% 13.13% 19.05% 8.26% 15.34% 6.44% 16.30% 9.24% 17.52% 8.78% 17.12%
FAIR
NOT FAIR
DON'T KNOW
LIKELY VOTER Q1
---------------------
MOOD Q2
---------------------
ECON MOOD Q3
---------------------
TRUMP JOB Q4
---------------------
TRUMP FAV Q6
---------------------
Total
Total Answering
10. Do you think it was fair or unfair that Democrat President Obama's administration investigated and surveilled Republican Donald Trump as both a presidential candidate and president-elect for allegedly colluding
with Russia?
Restoration PAC, Pennsylvania Statewide - May 2020 Banner 4 Page 104 of 290

11a. If the election for US Congress were being held today, for whom would you vote.... the Republican candidate or the Democrat candidate?
Total
---------
Very
---------
Somewhat
---------
Right
---------
Wrong
---------
Right
---------
Wrong
---------
Approve
---------
Disappr
---------
Favorable
---------
Unfavorble
---------
600 579 21 230 339 202 362 314 274 296 292
100.00% 100.00% 100.00% 100.00% 100.00% 100.00% 100.00% 100.00% 100.00% 100.00% 100.00%
600 579 21 230 339 202 362 314 274 296 292
100.00% 100.00% 100.00% 100.00% 100.00% 100.00% 100.00% 100.00% 100.00% 100.00% 100.00%
248 244 4 178 51 149 84 236 11 229 17
41.33% 42.14% 19.05% 77.39% 15.04% 73.76% 23.20% 75.16% 4.01% 77.36% 5.82%
34 33 1 19 13 14 19 29 3 29 4
5.67% 5.70% 4.76% 8.26% 3.83% 6.93% 5.25% 9.24% 1.09% 9.80% 1.37%
92 86 6 23 63 26 57 38 51 31 57
15.33% 14.85% 28.57% 10.00% 18.58% 12.87% 15.75% 12.10% 18.61% 10.47% 19.52%
25 24 1 2 23 4 20 3 22 4 21
4.17% 4.15% 4.76% 0.87% 6.78% 1.98% 5.52% 0.96% 8.03% 1.35% 7.19%
198 189 9 7 187 9 180 8 185 3 191
33.00% 32.64% 42.86% 3.04% 55.16% 4.46% 49.72% 2.55% 67.52% 1.01% 65.41%
3 3 - 1 2 - 2 - 2 - 2
0.50% 0.52% 0.43% 0.59% 0.55% 0.73% 0.68%
282 277 5 197 64 163 103 265 14 258 21
47.00% 47.84% 23.81% 85.65% 18.88% 80.69% 28.45% 84.39% 5.11% 87.16% 7.19%
223 213 10 9 210 13 200 11 207 7 212
37.17% 36.79% 47.62% 3.91% 61.95% 6.44% 55.25% 3.50% 75.55% 2.36% 72.60%
Total Answering
Definitely REPUBLICAN
Probably REPUBLICAN
UNDECIDED
Probably DEMOCRAT
Definitely DEMOCRAT
Refused
Total Republican
Total Democrat
LIKELY VOTER Q1
---------------------
MOOD Q2
---------------------
ECON MOOD Q3
---------------------
TRUMP JOB Q4
---------------------
TRUMP FAV Q6
---------------------
Total
Restoration PAC, Pennsylvania Statewide - May 2020 Banner 4 Page 105 of 290

11b. Would you say you are leaning toward the Republican candidate or leaning toward the Democrat candidate?
Total
---------
Very
---------
Somewhat
---------
Right
---------
Wrong
---------
Right
---------
Wrong
---------
Approve
---------
Disappr
---------
Favorable
---------
Unfavorble
---------
600 579 21 230 339 202 362 314 274 296 292
100.00% 100.00% 100.00% 100.00% 100.00% 100.00% 100.00% 100.00% 100.00% 100.00% 100.00%
95 89 6 24 65 26 59 38 53 31 59
15.83% 15.37% 28.57% 10.43% 19.17% 12.87% 16.30% 12.10% 19.34% 10.47% 20.21%
14 13 1 9 3 8 5 13 1 11 2
2.33% 2.25% 4.76% 3.91% 0.88% 3.96% 1.38% 4.14% 0.36% 3.72% 0.68%
63 58 5 13 46 15 41 23 36 19 40
10.50% 10.02% 23.81% 5.65% 13.57% 7.43% 11.33% 7.32% 13.14% 6.42% 13.70%
18 18 - 2 16 3 13 2 16 1 17
3.00% 3.11% 0.87% 4.72% 1.49% 3.59% 0.64% 5.84% 0.34% 5.82%
LEAN DEM
LIKELY VOTER Q1
---------------------
MOOD Q2
---------------------
ECON MOOD Q3
---------------------
TRUMP JOB Q4
---------------------
TRUMP FAV Q6
---------------------
Total
Total Answering
LEAN GOP
HARD UNDECIDED/NOT SURE
Restoration PAC, Pennsylvania Statewide - May 2020 Banner 4 Page 106 of 290

11. Summary Generic US Congress
Total
---------
Very
---------
Somewhat
---------
Right
---------
Wrong
---------
Right
---------
Wrong
---------
Approve
---------
Disappr
---------
Favorable
---------
Unfavorble
---------
600 579 21 230 339 202 362 314 274 296 292
100.00% 100.00% 100.00% 100.00% 100.00% 100.00% 100.00% 100.00% 100.00% 100.00% 100.00%
600 579 21 230 339 202 362 314 274 296 292
100.00% 100.00% 100.00% 100.00% 100.00% 100.00% 100.00% 100.00% 100.00% 100.00% 100.00%
296 290 6 206 67 171 108 278 15 269 23
49.33% 50.09% 28.57% 89.57% 19.76% 84.65% 29.83% 88.54% 5.47% 90.88% 7.88%
63 58 5 13 46 15 41 23 36 19 40
10.50% 10.02% 23.81% 5.65% 13.57% 7.43% 11.33% 7.32% 13.14% 6.42% 13.70%
241 231 10 11 226 16 213 13 223 8 229
40.17% 39.90% 47.62% 4.78% 66.67% 7.92% 58.84% 4.14% 81.39% 2.70% 78.42%
HARD UNDECIDED
ALL DEM
LIKELY VOTER Q1
---------------------
MOOD Q2
---------------------
ECON MOOD Q3
---------------------
TRUMP JOB Q4
---------------------
TRUMP FAV Q6
---------------------
Total
Total Answering
ALL GOP
Restoration PAC, Pennsylvania Statewide - May 2020 Banner 4 Page 107 of 290

12. Age
Total
---------
Very
---------
Somewhat
---------
Right
---------
Wrong
---------
Right
---------
Wrong
---------
Approve
---------
Disappr
---------
Favorable
---------
Unfavorble
---------
600 579 21 230 339 202 362 314 274 296 292
100.00% 100.00% 100.00% 100.00% 100.00% 100.00% 100.00% 100.00% 100.00% 100.00% 100.00%
600 579 21 230 339 202 362 314 274 296 292
100.00% 100.00% 100.00% 100.00% 100.00% 100.00% 100.00% 100.00% 100.00% 100.00% 100.00%
34 33 1 13 20 10 21 14 19 13 20
5.67% 5.70% 4.76% 5.65% 5.90% 4.95% 5.80% 4.46% 6.93% 4.39% 6.85%
81 80 1 26 46 22 53 39 41 37 42
13.50% 13.82% 4.76% 11.30% 13.57% 10.89% 14.64% 12.42% 14.96% 12.50% 14.38%
91 88 3 31 53 27 59 44 46 43 48
15.17% 15.20% 14.29% 13.48% 15.63% 13.37% 16.30% 14.01% 16.79% 14.53% 16.44%
98 92 6 39 55 29 64 53 44 49 48
16.33% 15.89% 28.57% 16.96% 16.22% 14.36% 17.68% 16.88% 16.06% 16.55% 16.44%
118 118 - 45 69 47 63 62 55 58 58
19.67% 20.38% 19.57% 20.35% 23.27% 17.40% 19.75% 20.07% 19.59% 19.86%
155 146 9 65 85 57 90 86 65 80 71
25.83% 25.22% 42.86% 28.26% 25.07% 28.22% 24.86% 27.39% 23.72% 27.03% 24.32%
23 22 1 11 11 10 12 16 4 16 5
3.83% 3.80% 4.76% 4.78% 3.24% 4.95% 3.31% 5.10% 1.46% 5.41% 1.71%
115 113 2 39 66 32 74 53 60 50 62
19.17% 19.52% 9.52% 16.96% 19.47% 15.84% 20.44% 16.88% 21.90% 16.89% 21.23%
189 180 9 70 108 56 123 97 90 92 96
31.50% 31.09% 42.86% 30.43% 31.86% 27.72% 33.98% 30.89% 32.85% 31.08% 32.88%
273 264 9 110 154 104 153 148 120 138 129
45.50% 45.60% 42.86% 47.83% 45.43% 51.49% 42.27% 47.13% 43.80% 46.62% 44.18%
Seniors 55+
18-24
25-34
35-44
45-54
55-64
65+
Refused
Young Adult 18-34
Family Age 35-54
LIKELY VOTER Q1
---------------------
MOOD Q2
---------------------
ECON MOOD Q3
---------------------
TRUMP JOB Q4
---------------------
TRUMP FAV Q6
---------------------
Total
Total Answering
Restoration PAC, Pennsylvania Statewide - May 2020 Banner 4 Page 108 of 290

13. Which two of the following issues do you believe are the most important issues facing the country? [Select up to 2]
Total
---------
Very
---------
Somewhat
---------
Right
---------
Wrong
---------
Right
---------
Wrong
---------
Approve
---------
Disappr
---------
Favorable
---------
Unfavorble
---------
600 579 21 230 339 202 362 314 274 296 292
100.00% 100.00% 100.00% 100.00% 100.00% 100.00% 100.00% 100.00% 100.00% 100.00% 100.00%
600 579 21 230 339 202 362 314 274 296 292
100.00% 100.00% 100.00% 100.00% 100.00% 100.00% 100.00% 100.00% 100.00% 100.00% 100.00%
264 257 7 123 122 105 143 184 77 173 88
44.00% 44.39% 33.33% 53.48% 35.99% 51.98% 39.50% 58.60% 28.10% 58.45% 30.14%
190 182 8 51 133 50 133 73 114 67 121
31.67% 31.43% 38.10% 22.17% 39.23% 24.75% 36.74% 23.25% 41.61% 22.64% 41.44%
271 259 12 73 187 63 193 105 161 95 170
45.17% 44.73% 57.14% 31.74% 55.16% 31.19% 53.31% 33.44% 58.76% 32.09% 58.22%
77 76 1 47 27 37 35 58 19 58 18
12.83% 13.13% 4.76% 20.43% 7.96% 18.32% 9.67% 18.47% 6.93% 19.59% 6.16%
71 69 2 30 39 31 35 35 35 34 36
11.83% 11.92% 9.52% 13.04% 11.50% 15.35% 9.67% 11.15% 12.77% 11.49% 12.33%
47 43 4 10 33 10 31 18 29 15 30
7.83% 7.43% 19.05% 4.35% 9.73% 4.95% 8.56% 5.73% 10.58% 5.07% 10.27%
31 31 - 20 8 18 12 25 5 25 6
5.17% 5.35% 8.70% 2.36% 8.91% 3.31% 7.96% 1.82% 8.45% 2.05%
79 76 3 10 67 12 64 14 62 13 64
13.17% 13.13% 14.29% 4.35% 19.76% 5.94% 17.68% 4.46% 22.63% 4.39% 21.92%
72 70 2 49 16 42 24 63 8 59 11
12.00% 12.09% 9.52% 21.30% 4.72% 20.79% 6.63% 20.06% 2.92% 19.93% 3.77%
39 39 - 20 19 21 17 23 16 23 15
6.50% 6.74% 8.70% 5.60% 10.40% 4.70% 7.32% 5.84% 7.77% 5.14%
15 14 1 8 5 6 6 8 4 9 4
2.50% 2.42% 4.76% 3.48% 1.47% 2.97% 1.66% 2.55% 1.46% 3.04% 1.37%
SOMETHING ELSE
HEALTH CARE
STOPPING CORONAVIRUS
NATIONAL SECURITY
EDUCATION
GUNS
FOREIGN TRADE
CLIMATE CHANGE
IMMIGRATION
IMPEACHMENT OR
INVESTIGATING GOVERNMENT
LIKELY VOTER Q1
---------------------
MOOD Q2
---------------------
ECON MOOD Q3
---------------------
TRUMP JOB Q4
---------------------
TRUMP FAV Q6
---------------------
Total
Total Answering
JOBS AND THE ECONOMY
Restoration PAC, Pennsylvania Statewide - May 2020 Banner 4 Page 109 of 290

14a. In politics today, do you generally consider yourself .... a republican, a democrat, an independent or something else?
Total
---------
Very
---------
Somewhat
---------
Right
---------
Wrong
---------
Right
---------
Wrong
---------
Approve
---------
Disappr
---------
Favorable
---------
Unfavorble
---------
600 579 21 230 339 202 362 314 274 296 292
100.00% 100.00% 100.00% 100.00% 100.00% 100.00% 100.00% 100.00% 100.00% 100.00% 100.00%
600 579 21 230 339 202 362 314 274 296 292
100.00% 100.00% 100.00% 100.00% 100.00% 100.00% 100.00% 100.00% 100.00% 100.00% 100.00%
225 222 3 156 52 135 77 214 10 208 16
37.50% 38.34% 14.29% 67.83% 15.34% 66.83% 21.27% 68.15% 3.65% 70.27% 5.48%
34 32 2 17 16 16 17 25 9 24 9
5.67% 5.53% 9.52% 7.39% 4.72% 7.92% 4.70% 7.96% 3.28% 8.11% 3.08%
119 116 3 39 72 36 74 48 67 43 74
19.83% 20.03% 14.29% 16.96% 21.24% 17.82% 20.44% 15.29% 24.45% 14.53% 25.34%
36 33 3 6 28 4 31 13 21 11 24
6.00% 5.70% 14.29% 2.61% 8.26% 1.98% 8.56% 4.14% 7.66% 3.72% 8.22%
184 174 10 11 170 11 162 14 166 10 168
30.67% 30.05% 47.62% 4.78% 50.15% 5.45% 44.75% 4.46% 60.58% 3.38% 57.53%
2 2 - 1 1 - 1 - 1 - 1
0.33% 0.35% 0.43% 0.29% 0.28% 0.36% 0.34%
259 254 5 173 68 151 94 239 19 232 25
43.17% 43.87% 23.81% 75.22% 20.06% 74.75% 25.97% 76.11% 6.93% 78.38% 8.56%
220 207 13 17 198 15 193 27 187 21 192
36.67% 35.75% 61.90% 7.39% 58.41% 7.43% 53.31% 8.60% 68.25% 7.09% 65.75%
119 116 3 39 72 36 74 48 67 43 74
19.83% 20.03% 14.29% 16.96% 21.24% 17.82% 20.44% 15.29% 24.45% 14.53% 25.34%
Not so Strong Republican
AN INDEPENDENT, OR
SOMETHING ELSE
Not so Strong DEMOCRAT
Strong DEMOCRAT
Refused
Total Republican
Total Democrat
Independent
LIKELY VOTER Q1
---------------------
MOOD Q2
---------------------
ECON MOOD Q3
---------------------
TRUMP JOB Q4
---------------------
TRUMP FAV Q6
---------------------
Total
Total Answering
Strong REPUBLICAN
Restoration PAC, Pennsylvania Statewide - May 2020 Banner 4 Page 110 of 290

14b. Do you think of yourself closer to the Republican Party or Democratic Party?
Total
---------
Very
---------
Somewhat
---------
Right
---------
Wrong
---------
Right
---------
Wrong
---------
Approve
---------
Disappr
---------
Favorable
---------
Unfavorble
---------
600 579 21 230 339 202 362 314 274 296 292
100.00% 100.00% 100.00% 100.00% 100.00% 100.00% 100.00% 100.00% 100.00% 100.00% 100.00%
121 118 3 40 73 36 75 48 68 43 75
20.17% 20.38% 14.29% 17.39% 21.53% 17.82% 20.72% 15.29% 24.82% 14.53% 25.68%
35 34 1 20 11 15 17 27 7 24 9
5.83% 5.87% 4.76% 8.70% 3.24% 7.43% 4.70% 8.60% 2.55% 8.11% 3.08%
58 56 2 15 39 14 39 19 35 16 41
9.67% 9.67% 9.52% 6.52% 11.50% 6.93% 10.77% 6.05% 12.77% 5.41% 14.04%
28 28 - 5 23 7 19 2 26 3 25
4.67% 4.84% 2.17% 6.78% 3.47% 5.25% 0.64% 9.49% 1.01% 8.56%
MOOD Q2
---------------------
ECON MOOD Q3
---------------------
TRUMP JOB Q4
---------------------
TRUMP FAV Q6
---------------------
Total
Total Answering
LEAN REPUBLICAN
FIRM INDEPENDENT
LEAN DEMOCRAT
LIKELY VOTER Q1
---------------------
Restoration PAC, Pennsylvania Statewide - May 2020 Banner 4 Page 111 of 290

14. Party Summary
Total
---------
Very
---------
Somewhat
---------
Right
---------
Wrong
---------
Right
---------
Wrong
---------
Approve
---------
Disappr
---------
Favorable
---------
Unfavorble
---------
600 579 21 230 339 202 362 314 274 296 292
100.00% 100.00% 100.00% 100.00% 100.00% 100.00% 100.00% 100.00% 100.00% 100.00% 100.00%
600 579 21 230 339 202 362 314 274 296 292
100.00% 100.00% 100.00% 100.00% 100.00% 100.00% 100.00% 100.00% 100.00% 100.00% 100.00%
294 288 6 193 79 166 111 266 26 256 34
49.00% 49.74% 28.57% 83.91% 23.30% 82.18% 30.66% 84.71% 9.49% 86.49% 11.64%
58 56 2 15 39 14 39 19 35 16 41
9.67% 9.67% 9.52% 6.52% 11.50% 6.93% 10.77% 6.05% 12.77% 5.41% 14.04%
248 235 13 22 221 22 212 29 213 24 217
41.33% 40.59% 61.90% 9.57% 65.19% 10.89% 58.56% 9.24% 77.74% 8.11% 74.32%
ALL DEMOCRAT
LIKELY VOTER Q1
---------------------
MOOD Q2
---------------------
ECON MOOD Q3
---------------------
TRUMP JOB Q4
---------------------
TRUMP FAV Q6
---------------------
Total
Total Answering
ALL REPUBLICAN
ALL INDEPENDENT
Restoration PAC, Pennsylvania Statewide - May 2020 Banner 4 Page 112 of 290

BALLOT. If a mail-in ballot was mailed to you, how likely would you be to vote by mail this fall, as opposed to voting in-person at your polling place?
Total
---------
Very
---------
Somewhat
---------
Right
---------
Wrong
---------
Right
---------
Wrong
---------
Approve
---------
Disappr
---------
Favorable
---------
Unfavorble
---------
600 579 21 230 339 202 362 314 274 296 292
100.00% 100.00% 100.00% 100.00% 100.00% 100.00% 100.00% 100.00% 100.00% 100.00% 100.00%
600 579 21 230 339 202 362 314 274 296 292
100.00% 100.00% 100.00% 100.00% 100.00% 100.00% 100.00% 100.00% 100.00% 100.00% 100.00%
84 78 6 33 46 27 45 41 40 35 46
14.00% 13.47% 28.57% 14.35% 13.57% 13.37% 12.43% 13.06% 14.60% 11.82% 15.75%
247 236 11 34 201 41 196 52 190 46 195
41.17% 40.76% 52.38% 14.78% 59.29% 20.30% 54.14% 16.56% 69.34% 15.54% 66.78%
269 265 4 163 92 134 121 221 44 215 51
44.83% 45.77% 19.05% 70.87% 27.14% 66.34% 33.43% 70.38% 16.06% 72.64% 17.47%
Very likely to vote by mail
Not likely/Would still vote at
polling place
LIKELY VOTER Q1
---------------------
MOOD Q2
---------------------
ECON MOOD Q3
---------------------
TRUMP JOB Q4
---------------------
TRUMP FAV Q6
---------------------
Total
Total Answering
Somewhat likely to vote by mail
Restoration PAC, Pennsylvania Statewide - May 2020 Banner 4 Page 113 of 290

15. What was the last grade you completed in school?
Total
---------
Very
---------
Somewhat
---------
Right
---------
Wrong
---------
Right
---------
Wrong
---------
Approve
---------
Disappr
---------
Favorable
---------
Unfavorble
---------
600 579 21 230 339 202 362 314 274 296 292
100.00% 100.00% 100.00% 100.00% 100.00% 100.00% 100.00% 100.00% 100.00% 100.00% 100.00%
600 579 21 230 339 202 362 314 274 296 292
100.00% 100.00% 100.00% 100.00% 100.00% 100.00% 100.00% 100.00% 100.00% 100.00% 100.00%
3 3 - 1 2 - 1 1 2 1 2
0.50% 0.52% 0.43% 0.59% 0.28% 0.32% 0.73% 0.34% 0.68%
153 144 9 65 79 59 84 94 55 88 61
25.50% 24.87% 42.86% 28.26% 23.30% 29.21% 23.20% 29.94% 20.07% 29.73% 20.89%
30 27 3 14 15 12 16 18 10 17 11
5.00% 4.66% 14.29% 6.09% 4.42% 5.94% 4.42% 5.73% 3.65% 5.74% 3.77%
282 276 6 120 149 102 167 154 124 149 130
47.00% 47.67% 28.57% 52.17% 43.95% 50.50% 46.13% 49.04% 45.26% 50.34% 44.52%
130 128 2 30 92 29 92 47 81 41 87
21.67% 22.11% 9.52% 13.04% 27.14% 14.36% 25.41% 14.97% 29.56% 13.85% 29.79%
2 1 1 - 2 - 2 - 2 - 1
0.33% 0.17% 4.76% 0.59% 0.55% 0.73% 0.34%
156 147 9 66 81 59 85 95 57 89 63
26.00% 25.39% 42.86% 28.70% 23.89% 29.21% 23.48% 30.25% 20.80% 30.07% 21.58%
312 303 9 134 164 114 183 172 134 166 141
52.00% 52.33% 42.86% 58.26% 48.38% 56.44% 50.55% 54.78% 48.91% 56.08% 48.29%
130 128 2 30 92 29 92 47 81 41 87
21.67% 22.11% 9.52% 13.04% 27.14% 14.36% 25.41% 14.97% 29.56% 13.85% 29.79%
GRADE SCHOOL [1-8]
HIGH SCHOOL [9-12]
TECHNICAL/VOCATIONAL
SCHOOL
COLLEGE
GRADUATE SCHOOL
REFUSED
High School
College
College+
LIKELY VOTER Q1
---------------------
MOOD Q2
---------------------
ECON MOOD Q3
---------------------
TRUMP JOB Q4
---------------------
TRUMP FAV Q6
---------------------
Total
Total Answering
Restoration PAC, Pennsylvania Statewide - May 2020 Banner 4 Page 114 of 290

16. Thinking about where you live, do you consider it to be urban, suburban or rural?
Total
---------
Very
---------
Somewhat
---------
Right
---------
Wrong
---------
Right
---------
Wrong
---------
Approve
---------
Disappr
---------
Favorable
---------
Unfavorble
---------
600 579 21 230 339 202 362 314 274 296 292
100.00% 100.00% 100.00% 100.00% 100.00% 100.00% 100.00% 100.00% 100.00% 100.00% 100.00%
600 579 21 230 339 202 362 314 274 296 292
100.00% 100.00% 100.00% 100.00% 100.00% 100.00% 100.00% 100.00% 100.00% 100.00% 100.00%
103 99 4 34 65 30 69 45 54 44 58
17.17% 17.10% 19.05% 14.78% 19.17% 14.85% 19.06% 14.33% 19.71% 14.86% 19.86%
299 289 10 117 173 100 182 148 145 139 154
49.83% 49.91% 47.62% 50.87% 51.03% 49.50% 50.28% 47.13% 52.92% 46.96% 52.74%
196 189 7 78 100 71 110 119 75 111 80
32.67% 32.64% 33.33% 33.91% 29.50% 35.15% 30.39% 37.90% 27.37% 37.50% 27.40%
2 2 - 1 1 1 1 2 - 2 -
0.33% 0.35% 0.43% 0.29% 0.50% 0.28% 0.64% 0.68%
RURAL
DON'T KNOW
LIKELY VOTER Q1
---------------------
MOOD Q2
---------------------
ECON MOOD Q3
---------------------
TRUMP JOB Q4
---------------------
TRUMP FAV Q6
---------------------
Total
Total Answering
URBAN
SUBURBAN
Restoration PAC, Pennsylvania Statewide - May 2020 Banner 4 Page 115 of 290

17. Gender
Total
---------
Very
---------
Somewhat
---------
Right
---------
Wrong
---------
Right
---------
Wrong
---------
Approve
---------
Disappr
---------
Favorable
---------
Unfavorble
---------
600 579 21 230 339 202 362 314 274 296 292
100.00% 100.00% 100.00% 100.00% 100.00% 100.00% 100.00% 100.00% 100.00% 100.00% 100.00%
600 579 21 230 339 202 362 314 274 296 292
100.00% 100.00% 100.00% 100.00% 100.00% 100.00% 100.00% 100.00% 100.00% 100.00% 100.00%
286 277 9 128 145 114 158 168 115 158 122
47.67% 47.84% 42.86% 55.65% 42.77% 56.44% 43.65% 53.50% 41.97% 53.38% 41.78%
314 302 12 102 194 88 204 146 159 138 170
52.33% 52.16% 57.14% 44.35% 57.23% 43.56% 56.35% 46.50% 58.03% 46.62% 58.22%
Male
Female
LIKELY VOTER Q1
---------------------
MOOD Q2
---------------------
ECON MOOD Q3
---------------------
TRUMP JOB Q4
---------------------
TRUMP FAV Q6
---------------------
Total
Total Answering
Restoration PAC, Pennsylvania Statewide - May 2020 Banner 4 Page 116 of 290

Table of contents
Banner 5
Table market
Table q1
Table q2
Table q3
Table q4
Table q5
Table q6
Table q7a
Table q7b
Table q7Summ
Table q8
Table corona_1
Table corona_2
Table corona_3
Table q10
Table q11a
Table q11b
Table q11_Summ
Table age
Table q13
Table q14a
Table q14b
Table q14_SUMM
13. Which two of the following issues do you believe are the most important issues facing the country? [Select up to 2]
14a. In politics today, do you generally consider yourself .... a republican, a democrat, an independent or something else?
14b. Do you think of yourself closer to the Republican Party or Democratic Party?
14. Party Summary
10. Do you think it was fair or unfair that Democrat President Obama's administration investigated and surveilled Republican Donald Trump as both a presidential candidate and
president-elect for allegedly colluding with Russia?
11a. If the election for US Congress were being held today, for whom would you vote.... the Republican candidate or the Democrat candidate?
11b. Would you say you are leaning toward the Republican candidate or leaning toward the Democrat candidate?
11. Summary Generic US Congress
12. Age
8. Do you approve or disapprove of the way President Trump is handling the Coronavirus crisis?
CORONAVIRUS 1. With over 60,000 Americans dead from the pandemic, how worried are you that you, or someone close to you, will be infected with coronavirus?
CORONAVIRUS 2. Which statement do you agree with, or agree with more: "It's time for people to get back to work." or "It's too early to lift stay-at-home restrictions."
CORONAVIRUS 3. Which statement do you agree with, or agree with more: "We should re-open the economy, even if that means more people will get coronavirus." or "We
should continue the shelter-in-place restrictions, even if that means severe job losses and economic disruption."
Media Market
1. Thinking ahead to the November election, how likely would you say you are to vote in these elections? Would you say you are…
2. Do you think the country is going in the right direction, or have things pretty seriously gone off on the wrong track?
3. Do you think the economy is going in the right direction, or have things pretty seriously gone off on the wrong track?
4. Do you approve or disapprove of the job Donald Trump is doing as President? Would that be strongly or somewhat (approve or disapprove)?
5. Do you think the impeachment of President Trump was good for the country, bad for the country, or did the impeachment not really matter that much?
6. Do you have a favorable or unfavorable impression of Donald Trump?
7a. If the election for President were being held today, and the candidates were Donald Trump and Joe Biden, for whom would you vote?
7b. Would you say you are leaning toward Donald Trump or leaning toward Joe Biden?
7. Biden Ballot Summary
Restoration PAC, Pennsylvania Statewide - May 2020 Banner 5 Page 117 of 290

Table ballot
Table q15
Table q16
Table q17
BALLOT. If a mail-in ballot was mailed to you, how likely would you be to vote by mail this fall, as opposed to voting in-person at your polling place?
15. What was the last grade you completed in school?
16. Thinking about where you live, do you consider it to be urban, suburban or rural?
17. Gender
Restoration PAC, Pennsylvania Statewide - May 2020 Banner 5 Page 118 of 290

Media Market
Total
---------
Good
---------
Bad
---------
Indiff
---------
Fair
---------
Not Fair
---------
D/K
---------
600 107 289 204 235 285 80
100.00% 100.00% 100.00% 100.00% 100.00% 100.00% 100.00%
600 107 289 204 235 285 80
100.00% 100.00% 100.00% 100.00% 100.00% 100.00% 100.00%
3 - 2 1 - 3 -
0.50% 0.69% 0.49% 1.05%
248 44 113 91 110 97 41
41.33% 41.12% 39.10% 44.61% 46.81% 34.04% 51.25%
132 24 62 46 47 67 18
22.00% 22.43% 21.45% 22.55% 20.00% 23.51% 22.50%
1 - 1 - 1 - -
0.17% 0.35% 0.43%
2 - 2 - 1 1 -
0.33% 0.69% 0.43% 0.35%
19 2 10 7 8 8 3
3.17% 1.87% 3.46% 3.43% 3.40% 2.81% 3.75%
5 - 2 3 2 2 1
0.83% 0.69% 1.47% 0.85% 0.70% 1.25%
2 - - 2 1 1 -
0.33% 0.98% 0.43% 0.35%
89 16 51 22 28 50 11
14.83% 14.95% 17.65% 10.78% 11.91% 17.54% 13.75%
33 5 18 10 5 26 2
5.50% 4.67% 6.23% 4.90% 2.13% 9.12% 2.50%
66 16 28 22 32 30 4
11.00% 14.95% 9.69% 10.78% 13.62% 10.53% 5.00%
516 - ERIE
536 - YOUNGSTOWN
565 - ELMIRA (CORNING)
566 - HARRISBURG-LNCSTR-
LEB-YORK
574 - JOHNSTOWN-ALTOONA-
ST COLGE
577 - WILKES BARRE-
SCRANTON-HZTN
IMPEACHMENT Q5
--------------------------------
RUSSIA INVESTIGATION Q10
--------------------------------
Total
Total Answering
501 - NEW YORK
504 - PHILADELPHIA
508 - PITTSBURGH
511 - WASHINGTON, DC
(HAGRSTWN)
514 - BUFFALO
Restoration PAC, Pennsylvania Statewide - May 2020 Banner 5 Page 119 of 290

1. Thinking ahead to the November election, how likely would you say you are to vote in these elections? Would you say you are…
Total
---------
Good
---------
Bad
---------
Indiff
---------
Fair
---------
Not Fair
---------
D/K
---------
600 107 289 204 235 285 80
100.00% 100.00% 100.00% 100.00% 100.00% 100.00% 100.00%
600 107 289 204 235 285 80
100.00% 100.00% 100.00% 100.00% 100.00% 100.00% 100.00%
579 105 280 194 226 277 76
96.50% 98.13% 96.89% 95.10% 96.17% 97.19% 95.00%
21 2 9 10 9 8 4
3.50% 1.87% 3.11% 4.90% 3.83% 2.81% 5.00%
Total Answering
VERY LIKELY
SOMEWHAT LIKELY
IMPEACHMENT Q5
--------------------------------
RUSSIA INVESTIGATION Q10
--------------------------------
Total
Restoration PAC, Pennsylvania Statewide - May 2020 Banner 5 Page 120 of 290

2. Do you think the country is going in the right direction, or have things pretty seriously gone off on the wrong track?
Total
---------
Good
---------
Bad
---------
Indiff
---------
Fair
---------
Not Fair
---------
D/K
---------
600 107 289 204 235 285 80
100.00% 100.00% 100.00% 100.00% 100.00% 100.00% 100.00%
600 107 289 204 235 285 80
100.00% 100.00% 100.00% 100.00% 100.00% 100.00% 100.00%
230 17 183 30 23 188 19
38.33% 15.89% 63.32% 14.71% 9.79% 65.96% 23.75%
339 86 88 165 206 81 52
56.50% 80.37% 30.45% 80.88% 87.66% 28.42% 65.00%
27 3 16 8 5 14 8
4.50% 2.80% 5.54% 3.92% 2.13% 4.91% 10.00%
4 1 2 1 1 2 1
0.67% 0.93% 0.69% 0.49% 0.43% 0.70% 1.25%
DON’T KNOW
REFUSED
IMPEACHMENT Q5
--------------------------------
RUSSIA INVESTIGATION Q10
--------------------------------
Total
Total Answering
RIGHT DIRECTION
WRONG TRACK
Restoration PAC, Pennsylvania Statewide - May 2020 Banner 5 Page 121 of 290

3. Do you think the economy is going in the right direction, or have things pretty seriously gone off on the wrong track?
Total
---------
Good
---------
Bad
---------
Indiff
---------
Fair
---------
Not Fair
---------
D/K
---------
600 107 289 204 235 285 80
100.00% 100.00% 100.00% 100.00% 100.00% 100.00% 100.00%
600 107 289 204 235 285 80
100.00% 100.00% 100.00% 100.00% 100.00% 100.00% 100.00%
202 14 152 36 29 160 13
33.67% 13.08% 52.60% 17.65% 12.34% 56.14% 16.25%
362 89 121 152 194 109 59
60.33% 83.18% 41.87% 74.51% 82.55% 38.25% 73.75%
32 3 14 15 12 14 6
5.33% 2.80% 4.84% 7.35% 5.11% 4.91% 7.50%
4 1 2 1 - 2 2
0.67% 0.93% 0.69% 0.49% 0.70% 2.50%
REFUSED
IMPEACHMENT Q5
--------------------------------
RUSSIA INVESTIGATION Q10
--------------------------------
Total
Total Answering
RIGHT DIRECTION
WRONG TRACK
DON’T KNOW
Restoration PAC, Pennsylvania Statewide - May 2020 Banner 5 Page 122 of 290

4. Do you approve or disapprove of the job Donald Trump is doing as President? Would that be strongly or somewhat (approve or disapprove)?
Total
---------
Good
---------
Bad
---------
Indiff
---------
Fair
---------
Not Fair
---------
D/K
---------
600 107 289 204 235 285 80
100.00% 100.00% 100.00% 100.00% 100.00% 100.00% 100.00%
600 107 289 204 235 285 80
100.00% 100.00% 100.00% 100.00% 100.00% 100.00% 100.00%
268 22 208 38 22 225 21
44.67% 20.56% 71.97% 18.63% 9.36% 78.95% 26.25%
46 1 38 7 7 31 8
7.67% 0.93% 13.15% 3.43% 2.98% 10.88% 10.00%
18 3 4 11 10 4 4
3.00% 2.80% 1.38% 5.39% 4.26% 1.40% 5.00%
256 79 37 140 193 19 44
42.67% 73.83% 12.80% 68.63% 82.13% 6.67% 55.00%
12 2 2 8 3 6 3
2.00% 1.87% 0.69% 3.92% 1.28% 2.11% 3.75%
314 23 246 45 29 256 29
52.33% 21.50% 85.12% 22.06% 12.34% 89.82% 36.25%
274 82 41 151 203 23 48
45.67% 76.64% 14.19% 74.02% 86.38% 8.07% 60.00%
DON’T KNOW/NO ANSWER
Total Approve
Total Disapprove
IMPEACHMENT Q5
--------------------------------
RUSSIA INVESTIGATION Q10
--------------------------------
Total
Total Answering
STRONGLY APPROVE
SOMEWHAT APPROVE
SOMEWHAT DISAPPROVE
STRONGLY DISAPPROVE
Restoration PAC, Pennsylvania Statewide - May 2020 Banner 5 Page 123 of 290

5. Do you think the impeachment of President Trump was good for the country, bad for the country, or did the impeachment not really matter that much?
Total
---------
Good
---------
Bad
---------
Indiff
---------
Fair
---------
Not Fair
---------
D/K
---------
600 107 289 204 235 285 80
100.00% 100.00% 100.00% 100.00% 100.00% 100.00% 100.00%
600 107 289 204 235 285 80
100.00% 100.00% 100.00% 100.00% 100.00% 100.00% 100.00%
107 107 - - 70 23 14
17.83% 100.00% 29.79% 8.07% 17.50%
289 - 289 - 44 215 30
48.17% 100.00% 18.72% 75.44% 37.50%
204 - - 204 121 47 36
34.00% 100.00% 51.49% 16.49% 45.00%
DOESN'T MATTER/DON'T
KNOW
IMPEACHMENT Q5
--------------------------------
RUSSIA INVESTIGATION Q10
--------------------------------
Total
Total Answering
GOOD
BAD
Restoration PAC, Pennsylvania Statewide - May 2020 Banner 5 Page 124 of 290

6. Do you have a favorable or unfavorable impression of Donald Trump?
Total
---------
Good
---------
Bad
---------
Indiff
---------
Fair
---------
Not Fair
---------
D/K
---------
600 107 289 204 235 285 80
100.00% 100.00% 100.00% 100.00% 100.00% 100.00% 100.00%
600 107 289 204 235 285 80
100.00% 100.00% 100.00% 100.00% 100.00% 100.00% 100.00%
243 18 191 34 19 206 18
40.50% 16.82% 66.09% 16.67% 8.09% 72.28% 22.50%
53 2 44 7 3 42 8
8.83% 1.87% 15.22% 3.43% 1.28% 14.74% 10.00%
11 1 4 6 4 3 4
1.83% 0.93% 1.38% 2.94% 1.70% 1.05% 5.00%
24 3 8 13 8 13 3
4.00% 2.80% 2.77% 6.37% 3.40% 4.56% 3.75%
268 83 41 144 201 20 47
44.67% 77.57% 14.19% 70.59% 85.53% 7.02% 58.75%
- - - - - - -
1 - 1 - - 1 -
0.17% 0.35% 0.35%
296 20 235 41 22 248 26
49.33% 18.69% 81.31% 20.10% 9.36% 87.02% 32.50%
292 86 49 157 209 33 50
48.67% 80.37% 16.96% 76.96% 88.94% 11.58% 62.50%
Strongly UNFAVORABLE
DON’T KNOW/NOT SURE
REFUSED
Total Favorable
Total Unfavorable
IMPEACHMENT Q5
--------------------------------
RUSSIA INVESTIGATION Q10
--------------------------------
Total
Total Answering
Strongly FAVORABLE
Somewhat FAVORABLE
NO OPINION
Somewhat UNFAVORABLE
Restoration PAC, Pennsylvania Statewide - May 2020 Banner 5 Page 125 of 290

7a. If the election for President were being held today, and the candidates were Donald Trump and Joe Biden, for whom would you vote?
Total
---------
Good
---------
Bad
---------
Indiff
---------
Fair
---------
Not Fair
---------
D/K
---------
600 107 289 204 235 285 80
100.00% 100.00% 100.00% 100.00% 100.00% 100.00% 100.00%
600 107 289 204 235 285 80
100.00% 100.00% 100.00% 100.00% 100.00% 100.00% 100.00%
286 19 230 37 22 240 24
47.67% 17.76% 79.58% 18.14% 9.36% 84.21% 30.00%
15 1 11 3 - 14 1
2.50% 0.93% 3.81% 1.47% 4.91% 1.25%
22 1 8 13 8 6 8
3.67% 0.93% 2.77% 6.37% 3.40% 2.11% 10.00%
15 4 8 3 11 2 2
2.50% 3.74% 2.77% 1.47% 4.68% 0.70% 2.50%
258 82 31 145 192 21 45
43.00% 76.64% 10.73% 71.08% 81.70% 7.37% 56.25%
4 - 1 3 2 2 -
0.67% 0.35% 1.47% 0.85% 0.70%
301 20 241 40 22 254 25
50.17% 18.69% 83.39% 19.61% 9.36% 89.12% 31.25%
22 1 8 13 8 6 8
3.67% 0.93% 2.77% 6.37% 3.40% 2.11% 10.00%
273 86 39 148 203 23 47
45.50% 80.37% 13.49% 72.55% 86.38% 8.07% 58.75%
Definitely TRUMP
Probably TRUMP
UNDECIDED
Probably BIDEN
Definitely BIDEN
Refused
Total Trump
Total Undecided
Total Biden
IMPEACHMENT Q5
--------------------------------
RUSSIA INVESTIGATION Q10
--------------------------------
Total
Total Answering
Restoration PAC, Pennsylvania Statewide - May 2020 Banner 5 Page 126 of 290

7b. Would you say you are leaning toward Donald Trump or leaning toward Joe Biden?
Total
---------
Good
---------
Bad
---------
Indiff
---------
Fair
---------
Not Fair
---------
D/K
---------
600 107 289 204 235 285 80
100.00% 100.00% 100.00% 100.00% 100.00% 100.00% 100.00%
26 1 9 16 10 8 8
4.33% 0.93% 3.11% 7.84% 4.26% 2.81% 10.00%
2 - - 2 - 1 1
0.33% 0.98% 0.35% 1.25%
21 1 8 12 7 7 7
3.50% 0.93% 2.77% 5.88% 2.98% 2.46% 8.75%
3 - 1 2 3 - -
0.50% 0.35% 0.98% 1.28%
IMPEACHMENT Q5
--------------------------------
RUSSIA INVESTIGATION Q10
--------------------------------
Total
Total Answering
LEAN TRUMP
HARD UNDECIDED
LEAN BIDEN
Restoration PAC, Pennsylvania Statewide - May 2020 Banner 5 Page 127 of 290

7. Biden Ballot Summary
Total
---------
Good
---------
Bad
---------
Indiff
---------
Fair
---------
Not Fair
---------
D/K
---------
600 107 289 204 235 285 80
100.00% 100.00% 100.00% 100.00% 100.00% 100.00% 100.00%
600 107 289 204 235 285 80
100.00% 100.00% 100.00% 100.00% 100.00% 100.00% 100.00%
303 20 241 42 22 255 26
50.50% 18.69% 83.39% 20.59% 9.36% 89.47% 32.50%
21 1 8 12 7 7 7
3.50% 0.93% 2.77% 5.88% 2.98% 2.46% 8.75%
276 86 40 150 206 23 47
46.00% 80.37% 13.84% 73.53% 87.66% 8.07% 58.75%
Total
Total Answering
ALL TRUMP
ALL UNDECIDED
ALL BIDEN
IMPEACHMENT Q5
--------------------------------
RUSSIA INVESTIGATION Q10
--------------------------------
Restoration PAC, Pennsylvania Statewide - May 2020 Banner 5 Page 128 of 290

8. Do you approve or disapprove of the way President Trump is handling the Coronavirus crisis?
Total
---------
Good
---------
Bad
---------
Indiff
---------
Fair
---------
Not Fair
---------
D/K
---------
600 107 289 204 235 285 80
100.00% 100.00% 100.00% 100.00% 100.00% 100.00% 100.00%
600 107 289 204 235 285 80
100.00% 100.00% 100.00% 100.00% 100.00% 100.00% 100.00%
222 18 178 26 24 182 16
37.00% 16.82% 61.59% 12.75% 10.21% 63.86% 20.00%
89 6 63 20 7 68 14
14.83% 5.61% 21.80% 9.80% 2.98% 23.86% 17.50%
24 3 5 16 15 8 1
4.00% 2.80% 1.73% 7.84% 6.38% 2.81% 1.25%
253 78 37 138 188 21 44
42.17% 72.90% 12.80% 67.65% 80.00% 7.37% 55.00%
12 2 6 4 1 6 5
2.00% 1.87% 2.08% 1.96% 0.43% 2.11% 6.25%
311 24 241 46 31 250 30
51.83% 22.43% 83.39% 22.55% 13.19% 87.72% 37.50%
277 81 42 154 203 29 45
46.17% 75.70% 14.53% 75.49% 86.38% 10.18% 56.25%
STRONGLY APPROVE
SOMEWHAT APPROVE
SOMEWHAT DISAPPROVE
STRONGLY DISAPPROVE
DON’T KNOW/NO ANSWER
Total Approve
Total Disapprove
IMPEACHMENT Q5
--------------------------------
RUSSIA INVESTIGATION Q10
--------------------------------
Total
Total Answering
Restoration PAC, Pennsylvania Statewide - May 2020 Banner 5 Page 129 of 290

CORONAVIRUS 1. With over 60,000 Americans dead from the pandemic, how worried are you that you, or someone close to you, will be infected with coronavirus?
Total
---------
Good
---------
Bad
---------
Indiff
---------
Fair
---------
Not Fair
---------
D/K
---------
600 107 289 204 235 285 80
100.00% 100.00% 100.00% 100.00% 100.00% 100.00% 100.00%
600 107 289 204 235 285 80
100.00% 100.00% 100.00% 100.00% 100.00% 100.00% 100.00%
168 17 119 32 26 123 19
28.00% 15.89% 41.18% 15.69% 11.06% 43.16% 23.75%
223 37 117 69 85 108 30
37.17% 34.58% 40.48% 33.82% 36.17% 37.89% 37.50%
209 53 53 103 124 54 31
34.83% 49.53% 18.34% 50.49% 52.77% 18.95% 38.75%
Total
Total Answering
NOT WORRIED
SOMEWHAT WORRIED
VERY WORRIED
IMPEACHMENT Q5
--------------------------------
RUSSIA INVESTIGATION Q10
--------------------------------
Restoration PAC, Pennsylvania Statewide - May 2020 Banner 5 Page 130 of 290

CORONAVIRUS 2. Which statement do you agree with, or agree with more: "It's time for people to get back to work." or "It's too early to lift stay-at-home restrictions."
Total
---------
Good
---------
Bad
---------
Indiff
---------
Fair
---------
Not Fair
---------
D/K
---------
600 107 289 204 235 285 80
100.00% 100.00% 100.00% 100.00% 100.00% 100.00% 100.00%
600 107 289 204 235 285 80
100.00% 100.00% 100.00% 100.00% 100.00% 100.00% 100.00%
309 29 222 58 47 227 35
51.50% 27.10% 76.82% 28.43% 20.00% 79.65% 43.75%
291 78 67 146 188 58 45
48.50% 72.90% 23.18% 71.57% 80.00% 20.35% 56.25%
WORK
STAY HOME
IMPEACHMENT Q5
--------------------------------
RUSSIA INVESTIGATION Q10
--------------------------------
Total
Total Answering
Restoration PAC, Pennsylvania Statewide - May 2020 Banner 5 Page 131 of 290

Total
---------
Good
---------
Bad
---------
Indiff
---------
Fair
---------
Not Fair
---------
D/K
---------
600 107 289 204 235 285 80
100.00% 100.00% 100.00% 100.00% 100.00% 100.00% 100.00%
600 107 289 204 235 285 80
100.00% 100.00% 100.00% 100.00% 100.00% 100.00% 100.00%
301 28 217 56 46 223 32
50.17% 26.17% 75.09% 27.45% 19.57% 78.25% 40.00%
299 79 72 148 189 62 48
49.83% 73.83% 24.91% 72.55% 80.43% 21.75% 60.00%
CORONAVIRUS 3. Which statement do you agree with, or agree with more: "We should re-open the economy, even if that means more people will get coronavirus." or "We should continue the shelter-in-place
restrictions, even if that means severe job losses and economic disruption."
IMPEACHMENT Q5
--------------------------------
RUSSIA INVESTIGATION Q10
--------------------------------
Total
Total Answering
OPEN/VIRUS
SHUTDOWN/JOBS
Restoration PAC, Pennsylvania Statewide - May 2020 Banner 5 Page 132 of 290

Total
---------
Good
---------
Bad
---------
Indiff
---------
Fair
---------
Not Fair
---------
D/K
---------
600 107 289 204 235 285 80
100.00% 100.00% 100.00% 100.00% 100.00% 100.00% 100.00%
600 107 289 204 235 285 80
100.00% 100.00% 100.00% 100.00% 100.00% 100.00% 100.00%
235 70 44 121 235 - -
39.17% 65.42% 15.22% 59.31% 100.00%
285 23 215 47 - 285 -
47.50% 21.50% 74.39% 23.04% 100.00%
80 14 30 36 - - 80
13.33% 13.08% 10.38% 17.65% 100.00%
Total
Total Answering
FAIR
NOT FAIR
DON'T KNOW
IMPEACHMENT Q5
--------------------------------
RUSSIA INVESTIGATION Q10
--------------------------------
10. Do you think it was fair or unfair that Democrat President Obama's administration investigated and surveilled Republican Donald Trump as both a presidential candidate and president-elect for allegedly colluding
with Russia?
Restoration PAC, Pennsylvania Statewide - May 2020 Banner 5 Page 133 of 290

11a. If the election for US Congress were being held today, for whom would you vote.... the Republican candidate or the Democrat candidate?
Total
---------
Good
---------
Bad
---------
Indiff
---------
Fair
---------
Not Fair
---------
D/K
---------
600 107 289 204 235 285 80
100.00% 100.00% 100.00% 100.00% 100.00% 100.00% 100.00%
600 107 289 204 235 285 80
100.00% 100.00% 100.00% 100.00% 100.00% 100.00% 100.00%
248 19 197 32 22 202 24
41.33% 17.76% 68.17% 15.69% 9.36% 70.88% 30.00%
34 2 27 5 1 31 2
5.67% 1.87% 9.34% 2.45% 0.43% 10.88% 2.50%
92 9 37 46 41 36 15
15.33% 8.41% 12.80% 22.55% 17.45% 12.63% 18.75%
25 6 6 13 19 3 3
4.17% 5.61% 2.08% 6.37% 8.09% 1.05% 3.75%
198 70 21 107 151 12 35
33.00% 65.42% 7.27% 52.45% 64.26% 4.21% 43.75%
3 1 1 1 1 1 1
0.50% 0.93% 0.35% 0.49% 0.43% 0.35% 1.25%
282 21 224 37 23 233 26
47.00% 19.63% 77.51% 18.14% 9.79% 81.75% 32.50%
223 76 27 120 170 15 38
37.17% 71.03% 9.34% 58.82% 72.34% 5.26% 47.50%
Definitely REPUBLICAN
Probably REPUBLICAN
UNDECIDED
Probably DEMOCRAT
Definitely DEMOCRAT
Refused
Total Republican
Total Democrat
IMPEACHMENT Q5
--------------------------------
RUSSIA INVESTIGATION Q10
--------------------------------
Total
Total Answering
Restoration PAC, Pennsylvania Statewide - May 2020 Banner 5 Page 134 of 290

11b. Would you say you are leaning toward the Republican candidate or leaning toward the Democrat candidate?
Total
---------
Good
---------
Bad
---------
Indiff
---------
Fair
---------
Not Fair
---------
D/K
---------
600 107 289 204 235 285 80
100.00% 100.00% 100.00% 100.00% 100.00% 100.00% 100.00%
95 10 38 47 42 37 16
15.83% 9.35% 13.15% 23.04% 17.87% 12.98% 20.00%
14 - 8 6 1 11 2
2.33% 2.77% 2.94% 0.43% 3.86% 2.50%
63 9 26 28 27 23 13
10.50% 8.41% 9.00% 13.73% 11.49% 8.07% 16.25%
18 1 4 13 14 3 1
3.00% 0.93% 1.38% 6.37% 5.96% 1.05% 1.25%
RUSSIA INVESTIGATION Q10
--------------------------------
Total
Total Answering
LEAN GOP
HARD UNDECIDED/NOT SURE
LEAN DEM
IMPEACHMENT Q5
--------------------------------
Restoration PAC, Pennsylvania Statewide - May 2020 Banner 5 Page 135 of 290

11. Summary Generic US Congress
Total
---------
Good
---------
Bad
---------
Indiff
---------
Fair
---------
Not Fair
---------
D/K
---------
600 107 289 204 235 285 80
100.00% 100.00% 100.00% 100.00% 100.00% 100.00% 100.00%
600 107 289 204 235 285 80
100.00% 100.00% 100.00% 100.00% 100.00% 100.00% 100.00%
296 21 232 43 24 244 28
49.33% 19.63% 80.28% 21.08% 10.21% 85.61% 35.00%
63 9 26 28 27 23 13
10.50% 8.41% 9.00% 13.73% 11.49% 8.07% 16.25%
241 77 31 133 184 18 39
40.17% 71.96% 10.73% 65.20% 78.30% 6.32% 48.75%
Total Answering
ALL GOP
HARD UNDECIDED
ALL DEM
IMPEACHMENT Q5
--------------------------------
RUSSIA INVESTIGATION Q10
--------------------------------
Total
Restoration PAC, Pennsylvania Statewide - May 2020 Banner 5 Page 136 of 290

12. Age
Total
---------
Good
---------
Bad
---------
Indiff
---------
Fair
---------
Not Fair
---------
D/K
---------
600 107 289 204 235 285 80
100.00% 100.00% 100.00% 100.00% 100.00% 100.00% 100.00%
600 107 289 204 235 285 80
100.00% 100.00% 100.00% 100.00% 100.00% 100.00% 100.00%
34 9 16 9 17 12 5
5.67% 8.41% 5.54% 4.41% 7.23% 4.21% 6.25%
81 14 37 30 30 37 14
13.50% 13.08% 12.80% 14.71% 12.77% 12.98% 17.50%
91 16 37 38 36 43 12
15.17% 14.95% 12.80% 18.63% 15.32% 15.09% 15.00%
98 13 52 33 34 46 18
16.33% 12.15% 17.99% 16.18% 14.47% 16.14% 22.50%
118 19 59 40 51 57 10
19.67% 17.76% 20.42% 19.61% 21.70% 20.00% 12.50%
155 28 77 50 57 80 18
25.83% 26.17% 26.64% 24.51% 24.26% 28.07% 22.50%
23 8 11 4 10 10 3
3.83% 7.48% 3.81% 1.96% 4.26% 3.51% 3.75%
115 23 53 39 47 49 19
19.17% 21.50% 18.34% 19.12% 20.00% 17.19% 23.75%
189 29 89 71 70 89 30
31.50% 27.10% 30.80% 34.80% 29.79% 31.23% 37.50%
273 47 136 90 108 137 28
45.50% 43.93% 47.06% 44.12% 45.96% 48.07% 35.00%
25-34
35-44
45-54
55-64
65+
Refused
Young Adult 18-34
Family Age 35-54
Seniors 55+
IMPEACHMENT Q5
--------------------------------
RUSSIA INVESTIGATION Q10
--------------------------------
Total
Total Answering
18-24
Restoration PAC, Pennsylvania Statewide - May 2020 Banner 5 Page 137 of 290

13. Which two of the following issues do you believe are the most important issues facing the country? [Select up to 2]
Total
---------
Good
---------
Bad
---------
Indiff
---------
Fair
---------
Not Fair
---------
D/K
---------
600 107 289 204 235 285 80
100.00% 100.00% 100.00% 100.00% 100.00% 100.00% 100.00%
600 107 289 204 235 285 80
100.00% 100.00% 100.00% 100.00% 100.00% 100.00% 100.00%
264 23 168 73 66 159 39
44.00% 21.50% 58.13% 35.78% 28.09% 55.79% 48.75%
190 48 65 77 104 63 23
31.67% 44.86% 22.49% 37.75% 44.26% 22.11% 28.75%
271 59 102 110 134 94 43
45.17% 55.14% 35.29% 53.92% 57.02% 32.98% 53.75%
77 12 50 15 16 56 5
12.83% 11.21% 17.30% 7.35% 6.81% 19.65% 6.25%
71 10 34 27 31 31 9
11.83% 9.35% 11.76% 13.24% 13.19% 10.88% 11.25%
47 9 17 21 22 18 7
7.83% 8.41% 5.88% 10.29% 9.36% 6.32% 8.75%
31 4 21 6 5 22 4
5.17% 3.74% 7.27% 2.94% 2.13% 7.72% 5.00%
79 20 22 37 48 14 17
13.17% 18.69% 7.61% 18.14% 20.43% 4.91% 21.25%
72 9 47 16 10 60 2
12.00% 8.41% 16.26% 7.84% 4.26% 21.05% 2.50%
39 6 23 10 15 22 2
6.50% 5.61% 7.96% 4.90% 6.38% 7.72% 2.50%
15 4 7 4 5 9 1
2.50% 3.74% 2.42% 1.96% 2.13% 3.16% 1.25%
GUNS
FOREIGN TRADE
CLIMATE CHANGE
IMMIGRATION
IMPEACHMENT OR
INVESTIGATING GOVERNMENT
SOMETHING ELSE
IMPEACHMENT Q5
--------------------------------
RUSSIA INVESTIGATION Q10
--------------------------------
Total
Total Answering
JOBS AND THE ECONOMY
HEALTH CARE
STOPPING CORONAVIRUS
NATIONAL SECURITY
EDUCATION
Restoration PAC, Pennsylvania Statewide - May 2020 Banner 5 Page 138 of 290

14a. In politics today, do you generally consider yourself .... a republican, a democrat, an independent or something else?
Total
---------
Good
---------
Bad
---------
Indiff
---------
Fair
---------
Not Fair
---------
D/K
---------
600 107 289 204 235 285 80
100.00% 100.00% 100.00% 100.00% 100.00% 100.00% 100.00%
600 107 289 204 235 285 80
100.00% 100.00% 100.00% 100.00% 100.00% 100.00% 100.00%
225 14 179 32 21 183 21
37.50% 13.08% 61.94% 15.69% 8.94% 64.21% 26.25%
34 5 24 5 9 22 3
5.67% 4.67% 8.30% 2.45% 3.83% 7.72% 3.75%
119 20 48 51 49 54 16
19.83% 18.69% 16.61% 25.00% 20.85% 18.95% 20.00%
36 7 13 16 25 7 4
6.00% 6.54% 4.50% 7.84% 10.64% 2.46% 5.00%
184 61 23 100 131 18 35
30.67% 57.01% 7.96% 49.02% 55.74% 6.32% 43.75%
2 - 2 - - 1 1
0.33% 0.69% 0.35% 1.25%
259 19 203 37 30 205 24
43.17% 17.76% 70.24% 18.14% 12.77% 71.93% 30.00%
220 68 36 116 156 25 39
36.67% 63.55% 12.46% 56.86% 66.38% 8.77% 48.75%
119 20 48 51 49 54 16
19.83% 18.69% 16.61% 25.00% 20.85% 18.95% 20.00%
Independent
Total Answering
Strong REPUBLICAN
Not so Strong Republican
AN INDEPENDENT, OR
SOMETHING ELSE
Not so Strong DEMOCRAT
Strong DEMOCRAT
Refused
Total Republican
Total Democrat
IMPEACHMENT Q5
--------------------------------
RUSSIA INVESTIGATION Q10
--------------------------------
Total
Restoration PAC, Pennsylvania Statewide - May 2020 Banner 5 Page 139 of 290

14b. Do you think of yourself closer to the Republican Party or Democratic Party?
Total
---------
Good
---------
Bad
---------
Indiff
---------
Fair
---------
Not Fair
---------
D/K
---------
600 107 289 204 235 285 80
100.00% 100.00% 100.00% 100.00% 100.00% 100.00% 100.00%
121 20 50 51 49 55 17
20.17% 18.69% 17.30% 25.00% 20.85% 19.30% 21.25%
35 2 22 11 6 25 4
5.83% 1.87% 7.61% 5.39% 2.55% 8.77% 5.00%
58 8 21 29 22 27 9
9.67% 7.48% 7.27% 14.22% 9.36% 9.47% 11.25%
28 10 7 11 21 3 4
4.67% 9.35% 2.42% 5.39% 8.94% 1.05% 5.00%
IMPEACHMENT Q5
--------------------------------
RUSSIA INVESTIGATION Q10
--------------------------------
Total
Total Answering
LEAN REPUBLICAN
FIRM INDEPENDENT
LEAN DEMOCRAT
Restoration PAC, Pennsylvania Statewide - May 2020 Banner 5 Page 140 of 290

14. Party Summary
Total
---------
Good
---------
Bad
---------
Indiff
---------
Fair
---------
Not Fair
---------
D/K
---------
600 107 289 204 235 285 80
100.00% 100.00% 100.00% 100.00% 100.00% 100.00% 100.00%
600 107 289 204 235 285 80
100.00% 100.00% 100.00% 100.00% 100.00% 100.00% 100.00%
294 21 225 48 36 230 28
49.00% 19.63% 77.85% 23.53% 15.32% 80.70% 35.00%
58 8 21 29 22 27 9
9.67% 7.48% 7.27% 14.22% 9.36% 9.47% 11.25%
248 78 43 127 177 28 43
41.33% 72.90% 14.88% 62.25% 75.32% 9.82% 53.75%
Total
Total Answering
ALL REPUBLICAN
ALL INDEPENDENT
ALL DEMOCRAT
IMPEACHMENT Q5
--------------------------------
RUSSIA INVESTIGATION Q10
--------------------------------
Restoration PAC, Pennsylvania Statewide - May 2020 Banner 5 Page 141 of 290

BALLOT. If a mail-in ballot was mailed to you, how likely would you be to vote by mail this fall, as opposed to voting in-person at your polling place?
Total
---------
Good
---------
Bad
---------
Indiff
---------
Fair
---------
Not Fair
---------
D/K
---------
600 107 289 204 235 285 80
100.00% 100.00% 100.00% 100.00% 100.00% 100.00% 100.00%
600 107 289 204 235 285 80
100.00% 100.00% 100.00% 100.00% 100.00% 100.00% 100.00%
84 20 33 31 43 31 10
14.00% 18.69% 11.42% 15.20% 18.30% 10.88% 12.50%
247 65 65 117 149 56 42
41.17% 60.75% 22.49% 57.35% 63.40% 19.65% 52.50%
269 22 191 56 43 198 28
44.83% 20.56% 66.09% 27.45% 18.30% 69.47% 35.00%
Somewhat likely to vote by mail
Very likely to vote by mail
Not likely/Would still vote at polling
place
IMPEACHMENT Q5
--------------------------------
RUSSIA INVESTIGATION Q10
--------------------------------
Total
Total Answering
Restoration PAC, Pennsylvania Statewide - May 2020 Banner 5 Page 142 of 290

15. What was the last grade you completed in school?
Total
---------
Good
---------
Bad
---------
Indiff
---------
Fair
---------
Not Fair
---------
D/K
---------
600 107 289 204 235 285 80
100.00% 100.00% 100.00% 100.00% 100.00% 100.00% 100.00%
600 107 289 204 235 285 80
100.00% 100.00% 100.00% 100.00% 100.00% 100.00% 100.00%
3 - 1 2 2 1 -
0.50% 0.35% 0.98% 0.85% 0.35%
153 27 78 48 48 88 17
25.50% 25.23% 26.99% 23.53% 20.43% 30.88% 21.25%
30 4 16 10 10 16 4
5.00% 3.74% 5.54% 4.90% 4.26% 5.61% 5.00%
282 43 146 93 112 137 33
47.00% 40.19% 50.52% 45.59% 47.66% 48.07% 41.25%
130 32 48 50 62 43 25
21.67% 29.91% 16.61% 24.51% 26.38% 15.09% 31.25%
2 1 - 1 1 - 1
0.33% 0.93% 0.49% 0.43% 1.25%
156 27 79 50 50 89 17
26.00% 25.23% 27.34% 24.51% 21.28% 31.23% 21.25%
312 47 162 103 122 153 37
52.00% 43.93% 56.06% 50.49% 51.91% 53.68% 46.25%
130 32 48 50 62 43 25
21.67% 29.91% 16.61% 24.51% 26.38% 15.09% 31.25%
TECHNICAL/VOCATIONAL
SCHOOL
COLLEGE
GRADUATE SCHOOL
REFUSED
High School
College
College+
IMPEACHMENT Q5
--------------------------------
RUSSIA INVESTIGATION Q10
--------------------------------
Total
Total Answering
GRADE SCHOOL [1-8]
HIGH SCHOOL [9-12]
Restoration PAC, Pennsylvania Statewide - May 2020 Banner 5 Page 143 of 290

16. Thinking about where you live, do you consider it to be urban, suburban or rural?
Total
---------
Good
---------
Bad
---------
Indiff
---------
Fair
---------
Not Fair
---------
D/K
---------
600 107 289 204 235 285 80
100.00% 100.00% 100.00% 100.00% 100.00% 100.00% 100.00%
600 107 289 204 235 285 80
100.00% 100.00% 100.00% 100.00% 100.00% 100.00% 100.00%
103 26 37 40 50 41 12
17.17% 24.30% 12.80% 19.61% 21.28% 14.39% 15.00%
299 55 148 96 115 136 48
49.83% 51.40% 51.21% 47.06% 48.94% 47.72% 60.00%
196 26 102 68 70 107 19
32.67% 24.30% 35.29% 33.33% 29.79% 37.54% 23.75%
2 - 2 - - 1 1
0.33% 0.69% 0.35% 1.25%
Total
Total Answering
URBAN
SUBURBAN
RURAL
DON'T KNOW
IMPEACHMENT Q5
--------------------------------
RUSSIA INVESTIGATION Q10
--------------------------------
Restoration PAC, Pennsylvania Statewide - May 2020 Banner 5 Page 144 of 290
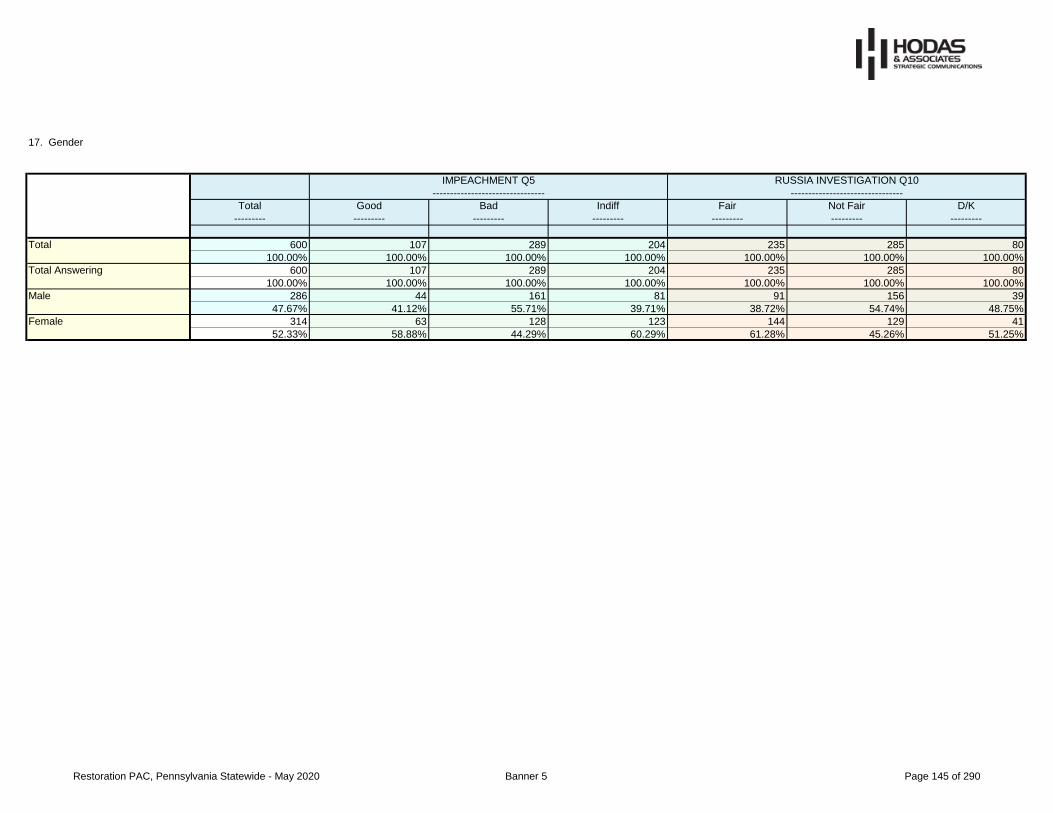
17. Gender
Total
---------
Good
---------
Bad
---------
Indiff
---------
Fair
---------
Not Fair
---------
D/K
---------
600 107 289 204 235 285 80
100.00% 100.00% 100.00% 100.00% 100.00% 100.00% 100.00%
600 107 289 204 235 285 80
100.00% 100.00% 100.00% 100.00% 100.00% 100.00% 100.00%
286 44 161 81 91 156 39
47.67% 41.12% 55.71% 39.71% 38.72% 54.74% 48.75%
314 63 128 123 144 129 41
52.33% 58.88% 44.29% 60.29% 61.28% 45.26% 51.25%
Total Answering
Male
Female
IMPEACHMENT Q5
--------------------------------
RUSSIA INVESTIGATION Q10
--------------------------------
Total
Restoration PAC, Pennsylvania Statewide - May 2020 Banner 5 Page 145 of 290

Table of contents
Banner 6
Table market
Table q1
Table q2
Table q3
Table q4
Table q5
Table q6
Table q7a
Table q7b
Table q7Summ
Table q8
Table corona_1
Table corona_2
Table corona_3
Table q10
Table q11a
Table q11b
Table q11_Summ
Table age
Table q13
Table q14a
Table q14b
12. Age
13. Which two of the following issues do you believe are the most important issues facing the country? [Select up to 2]
14a. In politics today, do you generally consider yourself .... a republican, a democrat, an independent or something else?
14b. Do you think of yourself closer to the Republican Party or Democratic Party?
10. Do you think it was fair or unfair that Democrat President Obama's administration investigated and surveilled Republican Donald Trump as both a presidential candidate
and president-elect for allegedly colluding with Russia?
11a. If the election for US Congress were being held today, for whom would you vote.... the Republican candidate or the Democrat candidate?
11b. Would you say you are leaning toward the Republican candidate or leaning toward the Democrat candidate?
11. Summary Generic US Congress
7. Biden Ballot Summary
8. Do you approve or disapprove of the way President Trump is handling the Coronavirus crisis?
CORONAVIRUS 1. With over 60,000 Americans dead from the pandemic, how worried are you that you, or someone close to you, will be infected with coronavirus?
CORONAVIRUS 2. Which statement do you agree with, or agree with more: "It's time for people to get back to work." or "It's too early to lift stay-at-home restrictions."
CORONAVIRUS 3. Which statement do you agree with, or agree with more: "We should re-open the economy, even if that means more people will get coronavirus." or "We
should continue the shelter-in-place restrictions, even if that means severe job losses and economic disruption."
Media Market
1. Thinking ahead to the November election, how likely would you say you are to vote in these elections? Would you say you are…
2. Do you think the country is going in the right direction, or have things pretty seriously gone off on the wrong track?
3. Do you think the economy is going in the right direction, or have things pretty seriously gone off on the wrong track?
4. Do you approve or disapprove of the job Donald Trump is doing as President? Would that be strongly or somewhat (approve or disapprove)?
5. Do you think the impeachment of President Trump was good for the country, bad for the country, or did the impeachment not really matter that much?
6. Do you have a favorable or unfavorable impression of Donald Trump?
7a. If the election for President were being held today, and the candidates were Donald Trump and Joe Biden, for whom would you vote?
7b. Would you say you are leaning toward Donald Trump or leaning toward Joe Biden?
Restoration PAC, Pennsylvania Statewide - May 2020 Banner 6 Page 146 of 290

Table q14_SUMM
Table ballot
Table q15
Table q16
Table q17
BALLOT. If a mail-in ballot was mailed to you, how likely would you be to vote by mail this fall, as opposed to voting in-person at your polling place?
15. What was the last grade you completed in school?
16. Thinking about where you live, do you consider it to be urban, suburban or rural?
17. Gender
14. Party Summary
Restoration PAC, Pennsylvania Statewide - May 2020 Banner 6 Page 147 of 290

Media Market
Total
---------
Str App
---------
Some App
---------
Some Dis
---------
Str Dis
---------
TOT APP
---------
TOT DIS
---------
600 222 89 24 253 311 277
100.00% 100.00% 100.00% 100.00% 100.00% 100.00% 100.00%
600 222 89 24 253 311 277
100.00% 100.00% 100.00% 100.00% 100.00% 100.00% 100.00%
3 - 3 - - 3 -
0.50% 3.37% 0.96%
248 76 31 2 134 107 136
41.33% 34.23% 34.83% 8.33% 52.96% 34.41% 49.10%
132 55 17 7 50 72 57
22.00% 24.77% 19.10% 29.17% 19.76% 23.15% 20.58%
1 1 - - - 1 -
0.17% 0.45% 0.32%
2 1 - - 1 1 1
0.33% 0.45% 0.40% 0.32% 0.36%
19 7 5 - 7 12 7
3.17% 3.15% 5.62% 2.77% 3.86% 2.53%
5 2 1 - 2 3 2
0.83% 0.90% 1.12% 0.79% 0.96% 0.72%
2 - 1 1 - 1 1
0.33% 1.12% 4.17% 0.32% 0.36%
89 31 22 7 26 53 33
14.83% 13.96% 24.72% 29.17% 10.28% 17.04% 11.91%
33 21 2 3 7 23 10
5.50% 9.46% 2.25% 12.50% 2.77% 7.40% 3.61%
66 28 7 4 26 35 30
11.00% 12.61% 7.87% 16.67% 10.28% 11.25% 10.83%
536 - YOUNGSTOWN
565 - ELMIRA (CORNING)
566 - HARRISBURG-LNCSTR-
LEB-YORK
574 - JOHNSTOWN-ALTOONA-
ST COLGE
577 - WILKES BARRE-
SCRANTON-HZTN
CORONAVIRUS TRUMP Q8
-----------------------------------------------------------------
Total
Total Answering
501 - NEW YORK
504 - PHILADELPHIA
508 - PITTSBURGH
511 - WASHINGTON, DC
(HAGRSTWN)
514 - BUFFALO
516 - ERIE
Restoration PAC, Pennsylvania Statewide - May 2020 Banner 6 Page 148 of 290

1. Thinking ahead to the November election, how likely would you say you are to vote in these elections? Would you say you are…
Total
---------
Str App
---------
Some App
---------
Some Dis
---------
Str Dis
---------
TOT APP
---------
TOT DIS
---------
600 222 89 24 253 311 277
100.00% 100.00% 100.00% 100.00% 100.00% 100.00% 100.00%
600 222 89 24 253 311 277
100.00% 100.00% 100.00% 100.00% 100.00% 100.00% 100.00%
579 219 83 23 242 302 265
96.50% 98.65% 93.26% 95.83% 95.65% 97.11% 95.67%
21 3 6 1 11 9 12
3.50% 1.35% 6.74% 4.17% 4.35% 2.89% 4.33%
SOMEWHAT LIKELY
CORONAVIRUS TRUMP Q8
-----------------------------------------------------------------
Total
Total Answering
VERY LIKELY
Restoration PAC, Pennsylvania Statewide - May 2020 Banner 6 Page 149 of 290

2. Do you think the country is going in the right direction, or have things pretty seriously gone off on the wrong track?
Total
---------
Str App
---------
Some App
---------
Some Dis
---------
Str Dis
---------
TOT APP
---------
TOT DIS
---------
600 222 89 24 253 311 277
100.00% 100.00% 100.00% 100.00% 100.00% 100.00% 100.00%
600 222 89 24 253 311 277
100.00% 100.00% 100.00% 100.00% 100.00% 100.00% 100.00%
230 169 49 3 5 218 8
38.33% 76.13% 55.06% 12.50% 1.98% 70.10% 2.89%
339 42 29 19 243 71 262
56.50% 18.92% 32.58% 79.17% 96.05% 22.83% 94.58%
27 7 11 2 5 18 7
4.50% 3.15% 12.36% 8.33% 1.98% 5.79% 2.53%
4 4 - - - 4 -
0.67% 1.80% 1.29%
CORONAVIRUS TRUMP Q8
-----------------------------------------------------------------
Total
Total Answering
RIGHT DIRECTION
WRONG TRACK
DON’T KNOW
REFUSED
Restoration PAC, Pennsylvania Statewide - May 2020 Banner 6 Page 150 of 290

3. Do you think the economy is going in the right direction, or have things pretty seriously gone off on the wrong track?
Total
---------
Str App
---------
Some App
---------
Some Dis
---------
Str Dis
---------
TOT APP
---------
TOT DIS
---------
600 222 89 24 253 311 277
100.00% 100.00% 100.00% 100.00% 100.00% 100.00% 100.00%
600 222 89 24 253 311 277
100.00% 100.00% 100.00% 100.00% 100.00% 100.00% 100.00%
202 135 42 6 13 177 19
33.67% 60.81% 47.19% 25.00% 5.14% 56.91% 6.86%
362 74 42 14 227 116 241
60.33% 33.33% 47.19% 58.33% 89.72% 37.30% 87.00%
32 10 5 4 12 15 16
5.33% 4.50% 5.62% 16.67% 4.74% 4.82% 5.78%
4 3 - - 1 3 1
0.67% 1.35% 0.40% 0.96% 0.36%
Total
Total Answering
RIGHT DIRECTION
WRONG TRACK
DON’T KNOW
REFUSED
CORONAVIRUS TRUMP Q8
-----------------------------------------------------------------
Restoration PAC, Pennsylvania Statewide - May 2020 Banner 6 Page 151 of 290

4. Do you approve or disapprove of the job Donald Trump is doing as President? Would that be strongly or somewhat (approve or disapprove)?
Total
---------
Str App
---------
Some App
---------
Some Dis
---------
Str Dis
---------
TOT APP
---------
TOT DIS
---------
600 222 89 24 253 311 277
100.00% 100.00% 100.00% 100.00% 100.00% 100.00% 100.00%
600 222 89 24 253 311 277
100.00% 100.00% 100.00% 100.00% 100.00% 100.00% 100.00%
268 199 55 4 5 254 9
44.67% 89.64% 61.80% 16.67% 1.98% 81.67% 3.25%
46 17 24 2 - 41 2
7.67% 7.66% 26.97% 8.33% 13.18% 0.72%
18 1 7 6 3 8 9
3.00% 0.45% 7.87% 25.00% 1.19% 2.57% 3.25%
256 3 1 10 239 4 249
42.67% 1.35% 1.12% 41.67% 94.47% 1.29% 89.89%
12 2 2 2 6 4 8
2.00% 0.90% 2.25% 8.33% 2.37% 1.29% 2.89%
314 216 79 6 5 295 11
52.33% 97.30% 88.76% 25.00% 1.98% 94.86% 3.97%
274 4 8 16 242 12 258
45.67% 1.80% 8.99% 66.67% 95.65% 3.86% 93.14%
STRONGLY APPROVE
SOMEWHAT APPROVE
SOMEWHAT DISAPPROVE
STRONGLY DISAPPROVE
DON’T KNOW/NO ANSWER
Total Approve
Total Disapprove
CORONAVIRUS TRUMP Q8
-----------------------------------------------------------------
Total
Total Answering
Restoration PAC, Pennsylvania Statewide - May 2020 Banner 6 Page 152 of 290

5. Do you think the impeachment of President Trump was good for the country, bad for the country, or did the impeachment not really matter that much?
Total
---------
Str App
---------
Some App
---------
Some Dis
---------
Str Dis
---------
TOT APP
---------
TOT DIS
---------
600 222 89 24 253 311 277
100.00% 100.00% 100.00% 100.00% 100.00% 100.00% 100.00%
600 222 89 24 253 311 277
100.00% 100.00% 100.00% 100.00% 100.00% 100.00% 100.00%
107 18 6 3 78 24 81
17.83% 8.11% 6.74% 12.50% 30.83% 7.72% 29.24%
289 178 63 5 37 241 42
48.17% 80.18% 70.79% 20.83% 14.62% 77.49% 15.16%
204 26 20 16 138 46 154
34.00% 11.71% 22.47% 66.67% 54.55% 14.79% 55.60%
Total Answering
GOOD
BAD
DOESN'T MATTER/DON'T
KNOW
CORONAVIRUS TRUMP Q8
-----------------------------------------------------------------
Total
Restoration PAC, Pennsylvania Statewide - May 2020 Banner 6 Page 153 of 290

6. Do you have a favorable or unfavorable impression of Donald Trump?
Total
---------
Str App
---------
Some App
---------
Some Dis
---------
Str Dis
---------
TOT APP
---------
TOT DIS
---------
600 222 89 24 253 311 277
100.00% 100.00% 100.00% 100.00% 100.00% 100.00% 100.00%
600 222 89 24 253 311 277
100.00% 100.00% 100.00% 100.00% 100.00% 100.00% 100.00%
243 186 47 2 3 233 5
40.50% 83.78% 52.81% 8.33% 1.19% 74.92% 1.81%
53 25 26 1 - 51 1
8.83% 11.26% 29.21% 4.17% 16.40% 0.36%
11 3 3 1 4 6 5
1.83% 1.35% 3.37% 4.17% 1.58% 1.93% 1.81%
24 1 6 5 10 7 15
4.00% 0.45% 6.74% 20.83% 3.95% 2.25% 5.42%
268 6 7 15 236 13 251
44.67% 2.70% 7.87% 62.50% 93.28% 4.18% 90.61%
- - - - - - -
1 1 - - - 1 -
0.17% 0.45% 0.32%
296 211 73 3 3 284 6
49.33% 95.05% 82.02% 12.50% 1.19% 91.32% 2.17%
292 7 13 20 246 20 266
48.67% 3.15% 14.61% 83.33% 97.23% 6.43% 96.03%
NO OPINION
Somewhat UNFAVORABLE
Strongly UNFAVORABLE
DON’T KNOW/NOT SURE
REFUSED
Total Favorable
Total Unfavorable
CORONAVIRUS TRUMP Q8
-----------------------------------------------------------------
Total
Total Answering
Strongly FAVORABLE
Somewhat FAVORABLE
Restoration PAC, Pennsylvania Statewide - May 2020 Banner 6 Page 154 of 290

7a. If the election for President were being held today, and the candidates were Donald Trump and Joe Biden, for whom would you vote?
Total
---------
Str App
---------
Some App
---------
Some Dis
---------
Str Dis
---------
TOT APP
---------
TOT DIS
---------
600 222 89 24 253 311 277
100.00% 100.00% 100.00% 100.00% 100.00% 100.00% 100.00%
600 222 89 24 253 311 277
100.00% 100.00% 100.00% 100.00% 100.00% 100.00% 100.00%
286 208 66 4 2 274 6
47.67% 93.69% 74.16% 16.67% 0.79% 88.10% 2.17%
15 5 8 1 - 13 1
2.50% 2.25% 8.99% 4.17% 4.18% 0.36%
22 3 7 1 10 10 11
3.67% 1.35% 7.87% 4.17% 3.95% 3.22% 3.97%
15 - 2 3 10 2 13
2.50% 2.25% 12.50% 3.95% 0.64% 4.69%
258 5 5 14 230 10 244
43.00% 2.25% 5.62% 58.33% 90.91% 3.22% 88.09%
4 1 1 1 1 2 2
0.67% 0.45% 1.12% 4.17% 0.40% 0.64% 0.72%
301 213 74 5 2 287 7
50.17% 95.95% 83.15% 20.83% 0.79% 92.28% 2.53%
22 3 7 1 10 10 11
3.67% 1.35% 7.87% 4.17% 3.95% 3.22% 3.97%
273 5 7 17 240 12 257
45.50% 2.25% 7.87% 70.83% 94.86% 3.86% 92.78%
Total Biden
Total Answering
Definitely TRUMP
Probably TRUMP
UNDECIDED
Probably BIDEN
Definitely BIDEN
Refused
Total Trump
Total Undecided
CORONAVIRUS TRUMP Q8
-----------------------------------------------------------------
Total
Restoration PAC, Pennsylvania Statewide - May 2020 Banner 6 Page 155 of 290

7b. Would you say you are leaning toward Donald Trump or leaning toward Joe Biden?
Total
---------
Str App
---------
Some App
---------
Some Dis
---------
Str Dis
---------
TOT APP
---------
TOT DIS
---------
600 222 89 24 253 311 277
100.00% 100.00% 100.00% 100.00% 100.00% 100.00% 100.00%
26 4 8 2 11 12 13
4.33% 1.80% 8.99% 8.33% 4.35% 3.86% 4.69%
2 1 1 - - 2 -
0.33% 0.45% 1.12% 0.64%
21 3 6 2 9 9 11
3.50% 1.35% 6.74% 8.33% 3.56% 2.89% 3.97%
3 - 1 - 2 1 2
0.50% 1.12% 0.79% 0.32% 0.72%
CORONAVIRUS TRUMP Q8
-----------------------------------------------------------------
Total
Total Answering
LEAN TRUMP
HARD UNDECIDED
LEAN BIDEN
Restoration PAC, Pennsylvania Statewide - May 2020 Banner 6 Page 156 of 290

7. Biden Ballot Summary
Total
---------
Str App
---------
Some App
---------
Some Dis
---------
Str Dis
---------
TOT APP
---------
TOT DIS
---------
600 222 89 24 253 311 277
100.00% 100.00% 100.00% 100.00% 100.00% 100.00% 100.00%
600 222 89 24 253 311 277
100.00% 100.00% 100.00% 100.00% 100.00% 100.00% 100.00%
303 214 75 5 2 289 7
50.50% 96.40% 84.27% 20.83% 0.79% 92.93% 2.53%
21 3 6 2 9 9 11
3.50% 1.35% 6.74% 8.33% 3.56% 2.89% 3.97%
276 5 8 17 242 13 259
46.00% 2.25% 8.99% 70.83% 95.65% 4.18% 93.50%
Total Answering
ALL TRUMP
ALL UNDECIDED
ALL BIDEN
CORONAVIRUS TRUMP Q8
-----------------------------------------------------------------
Total
Restoration PAC, Pennsylvania Statewide - May 2020 Banner 6 Page 157 of 290

8. Do you approve or disapprove of the way President Trump is handling the Coronavirus crisis?
Total
---------
Str App
---------
Some App
---------
Some Dis
---------
Str Dis
---------
TOT APP
---------
TOT DIS
---------
600 222 89 24 253 311 277
100.00% 100.00% 100.00% 100.00% 100.00% 100.00% 100.00%
600 222 89 24 253 311 277
100.00% 100.00% 100.00% 100.00% 100.00% 100.00% 100.00%
222 222 - - - 222 -
37.00% 100.00% 71.38%
89 - 89 - - 89 -
14.83% 100.00% 28.62%
24 - - 24 - - 24
4.00% 100.00% 8.66%
253 - - - 253 - 253
42.17% 100.00% 91.34%
12 - - - - - -
2.00%
311 222 89 - - 311 -
51.83% 100.00% 100.00% 100.00%
277 - - 24 253 - 277
46.17% 100.00% 100.00% 100.00%
SOMEWHAT DISAPPROVE
STRONGLY DISAPPROVE
DON’T KNOW/NO ANSWER
Total Approve
Total Disapprove
CORONAVIRUS TRUMP Q8
-----------------------------------------------------------------
Total
Total Answering
STRONGLY APPROVE
SOMEWHAT APPROVE
Restoration PAC, Pennsylvania Statewide - May 2020 Banner 6 Page 158 of 290

CORONAVIRUS 1. With over 60,000 Americans dead from the pandemic, how worried are you that you, or someone close to you, will be infected with coronavirus?
Total
---------
Str App
---------
Some App
---------
Some Dis
---------
Str Dis
---------
TOT APP
---------
TOT DIS
---------
600 222 89 24 253 311 277
100.00% 100.00% 100.00% 100.00% 100.00% 100.00% 100.00%
600 222 89 24 253 311 277
100.00% 100.00% 100.00% 100.00% 100.00% 100.00% 100.00%
168 106 38 5 17 144 22
28.00% 47.75% 42.70% 20.83% 6.72% 46.30% 7.94%
223 83 34 10 88 117 98
37.17% 37.39% 38.20% 41.67% 34.78% 37.62% 35.38%
209 33 17 9 148 50 157
34.83% 14.86% 19.10% 37.50% 58.50% 16.08% 56.68%
SOMEWHAT WORRIED
VERY WORRIED
CORONAVIRUS TRUMP Q8
-----------------------------------------------------------------
Total
Total Answering
NOT WORRIED
Restoration PAC, Pennsylvania Statewide - May 2020 Banner 6 Page 159 of 290

CORONAVIRUS 2. Which statement do you agree with, or agree with more: "It's time for people to get back to work." or "It's too early to lift stay-at-home restrictions."
Total
---------
Str App
---------
Some App
---------
Some Dis
---------
Str Dis
---------
TOT APP
---------
TOT DIS
---------
600 222 89 24 253 311 277
100.00% 100.00% 100.00% 100.00% 100.00% 100.00% 100.00%
600 222 89 24 253 311 277
100.00% 100.00% 100.00% 100.00% 100.00% 100.00% 100.00%
309 193 68 11 33 261 44
51.50% 86.94% 76.40% 45.83% 13.04% 83.92% 15.88%
291 29 21 13 220 50 233
48.50% 13.06% 23.60% 54.17% 86.96% 16.08% 84.12%
CORONAVIRUS TRUMP Q8
-----------------------------------------------------------------
Total
Total Answering
WORK
STAY HOME
Restoration PAC, Pennsylvania Statewide - May 2020 Banner 6 Page 160 of 290

Total
---------
Str App
---------
Some App
---------
Some Dis
---------
Str Dis
---------
TOT APP
---------
TOT DIS
---------
600 222 89 24 253 311 277
100.00% 100.00% 100.00% 100.00% 100.00% 100.00% 100.00%
600 222 89 24 253 311 277
100.00% 100.00% 100.00% 100.00% 100.00% 100.00% 100.00%
301 189 65 13 30 254 43
50.17% 85.14% 73.03% 54.17% 11.86% 81.67% 15.52%
299 33 24 11 223 57 234
49.83% 14.86% 26.97% 45.83% 88.14% 18.33% 84.48%
CORONAVIRUS 3. Which statement do you agree with, or agree with more: "We should re-open the economy, even if that means more people will get coronavirus." or "We should continue the shelter-in-
place restrictions, even if that means severe job losses and economic disruption."
Total Answering
OPEN/VIRUS
SHUTDOWN/JOBS
CORONAVIRUS TRUMP Q8
-----------------------------------------------------------------
Total
Restoration PAC, Pennsylvania Statewide - May 2020 Banner 6 Page 161 of 290

Total
---------
Str App
---------
Some App
---------
Some Dis
---------
Str Dis
---------
TOT APP
---------
TOT DIS
---------
600 222 89 24 253 311 277
100.00% 100.00% 100.00% 100.00% 100.00% 100.00% 100.00%
600 222 89 24 253 311 277
100.00% 100.00% 100.00% 100.00% 100.00% 100.00% 100.00%
235 24 7 15 188 31 203
39.17% 10.81% 7.87% 62.50% 74.31% 9.97% 73.29%
285 182 68 8 21 250 29
47.50% 81.98% 76.40% 33.33% 8.30% 80.39% 10.47%
80 16 14 1 44 30 45
13.33% 7.21% 15.73% 4.17% 17.39% 9.65% 16.25%
10. Do you think it was fair or unfair that Democrat President Obama's administration investigated and surveilled Republican Donald Trump as both a presidential candidate and president-elect for allegedly
colluding with Russia?
CORONAVIRUS TRUMP Q8
-----------------------------------------------------------------
Total
Total Answering
FAIR
NOT FAIR
DON'T KNOW
Restoration PAC, Pennsylvania Statewide - May 2020 Banner 6 Page 162 of 290

11a. If the election for US Congress were being held today, for whom would you vote.... the Republican candidate or the Democrat candidate?
Total
---------
Str App
---------
Some App
---------
Some Dis
---------
Str Dis
---------
TOT APP
---------
TOT DIS
---------
600 222 89 24 253 311 277
100.00% 100.00% 100.00% 100.00% 100.00% 100.00% 100.00%
600 222 89 24 253 311 277
100.00% 100.00% 100.00% 100.00% 100.00% 100.00% 100.00%
248 184 49 3 7 233 10
41.33% 82.88% 55.06% 12.50% 2.77% 74.92% 3.61%
34 17 14 1 2 31 3
5.67% 7.66% 15.73% 4.17% 0.79% 9.97% 1.08%
92 15 18 11 44 33 55
15.33% 6.76% 20.22% 45.83% 17.39% 10.61% 19.86%
25 - 3 1 21 3 22
4.17% 3.37% 4.17% 8.30% 0.96% 7.94%
198 5 5 8 177 10 185
33.00% 2.25% 5.62% 33.33% 69.96% 3.22% 66.79%
3 1 - - 2 1 2
0.50% 0.45% 0.79% 0.32% 0.72%
282 201 63 4 9 264 13
47.00% 90.54% 70.79% 16.67% 3.56% 84.89% 4.69%
223 5 8 9 198 13 207
37.17% 2.25% 8.99% 37.50% 78.26% 4.18% 74.73%
Total Republican
Total Democrat
CORONAVIRUS TRUMP Q8
-----------------------------------------------------------------
Total
Total Answering
Definitely REPUBLICAN
Probably REPUBLICAN
UNDECIDED
Probably DEMOCRAT
Definitely DEMOCRAT
Refused
Restoration PAC, Pennsylvania Statewide - May 2020 Banner 6 Page 163 of 290

11b. Would you say you are leaning toward the Republican candidate or leaning toward the Democrat candidate?
Total
---------
Str App
---------
Some App
---------
Some Dis
---------
Str Dis
---------
TOT APP
---------
TOT DIS
---------
600 222 89 24 253 311 277
100.00% 100.00% 100.00% 100.00% 100.00% 100.00% 100.00%
95 16 18 11 46 34 57
15.83% 7.21% 20.22% 45.83% 18.18% 10.93% 20.58%
14 6 6 - 1 12 1
2.33% 2.70% 6.74% 0.40% 3.86% 0.36%
63 9 12 8 32 21 40
10.50% 4.05% 13.48% 33.33% 12.65% 6.75% 14.44%
18 1 - 3 13 1 16
3.00% 0.45% 12.50% 5.14% 0.32% 5.78%
CORONAVIRUS TRUMP Q8
-----------------------------------------------------------------
Total
Total Answering
LEAN GOP
HARD UNDECIDED/NOT SURE
LEAN DEM
Restoration PAC, Pennsylvania Statewide - May 2020 Banner 6 Page 164 of 290

11. Summary Generic US Congress
Total
---------
Str App
---------
Some App
---------
Some Dis
---------
Str Dis
---------
TOT APP
---------
TOT DIS
---------
600 222 89 24 253 311 277
100.00% 100.00% 100.00% 100.00% 100.00% 100.00% 100.00%
600 222 89 24 253 311 277
100.00% 100.00% 100.00% 100.00% 100.00% 100.00% 100.00%
296 207 69 4 10 276 14
49.33% 93.24% 77.53% 16.67% 3.95% 88.75% 5.05%
63 9 12 8 32 21 40
10.50% 4.05% 13.48% 33.33% 12.65% 6.75% 14.44%
241 6 8 12 211 14 223
40.17% 2.70% 8.99% 50.00% 83.40% 4.50% 80.51%
Total
Total Answering
ALL GOP
HARD UNDECIDED
ALL DEM
CORONAVIRUS TRUMP Q8
-----------------------------------------------------------------
Restoration PAC, Pennsylvania Statewide - May 2020 Banner 6 Page 165 of 290

12. Age
Total
---------
Str App
---------
Some App
---------
Some Dis
---------
Str Dis
---------
TOT APP
---------
TOT DIS
---------
600 222 89 24 253 311 277
100.00% 100.00% 100.00% 100.00% 100.00% 100.00% 100.00%
600 222 89 24 253 311 277
100.00% 100.00% 100.00% 100.00% 100.00% 100.00% 100.00%
34 14 2 1 17 16 18
5.67% 6.31% 2.25% 4.17% 6.72% 5.14% 6.50%
81 26 13 1 40 39 41
13.50% 11.71% 14.61% 4.17% 15.81% 12.54% 14.80%
91 29 12 4 42 41 46
15.17% 13.06% 13.48% 16.67% 16.60% 13.18% 16.61%
98 37 17 2 39 54 41
16.33% 16.67% 19.10% 8.33% 15.42% 17.36% 14.80%
118 43 17 6 50 60 56
19.67% 19.37% 19.10% 25.00% 19.76% 19.29% 20.22%
155 59 26 10 58 85 68
25.83% 26.58% 29.21% 41.67% 22.92% 27.33% 24.55%
23 14 2 - 7 16 7
3.83% 6.31% 2.25% 2.77% 5.14% 2.53%
115 40 15 2 57 55 59
19.17% 18.02% 16.85% 8.33% 22.53% 17.68% 21.30%
189 66 29 6 81 95 87
31.50% 29.73% 32.58% 25.00% 32.02% 30.55% 31.41%
273 102 43 16 108 145 124
45.50% 45.95% 48.31% 66.67% 42.69% 46.62% 44.77%
25-34
35-44
45-54
55-64
65+
Refused
Young Adult 18-34
Family Age 35-54
Seniors 55+
CORONAVIRUS TRUMP Q8
-----------------------------------------------------------------
Total
Total Answering
18-24
Restoration PAC, Pennsylvania Statewide - May 2020 Banner 6 Page 166 of 290

13. Which two of the following issues do you believe are the most important issues facing the country? [Select up to 2]
Total
---------
Str App
---------
Some App
---------
Some Dis
---------
Str Dis
---------
TOT APP
---------
TOT DIS
---------
600 222 89 24 253 311 277
100.00% 100.00% 100.00% 100.00% 100.00% 100.00% 100.00%
600 222 89 24 253 311 277
100.00% 100.00% 100.00% 100.00% 100.00% 100.00% 100.00%
264 124 57 8 70 181 78
44.00% 55.86% 64.04% 33.33% 27.67% 58.20% 28.16%
190 54 16 12 104 70 116
31.67% 24.32% 17.98% 50.00% 41.11% 22.51% 41.88%
271 71 31 12 150 102 162
45.17% 31.98% 34.83% 50.00% 59.29% 32.80% 58.48%
77 41 16 3 15 57 18
12.83% 18.47% 17.98% 12.50% 5.93% 18.33% 6.50%
71 26 11 1 31 37 32
11.83% 11.71% 12.36% 4.17% 12.25% 11.90% 11.55%
47 12 4 3 28 16 31
7.83% 5.41% 4.49% 12.50% 11.07% 5.14% 11.19%
31 22 5 - 4 27 4
5.17% 9.91% 5.62% 1.58% 8.68% 1.44%
79 7 5 4 63 12 67
13.17% 3.15% 5.62% 16.67% 24.90% 3.86% 24.19%
72 46 14 1 9 60 10
12.00% 20.72% 15.73% 4.17% 3.56% 19.29% 3.61%
39 19 4 1 14 23 15
6.50% 8.56% 4.49% 4.17% 5.53% 7.40% 5.42%
15 6 6 1 2 12 3
2.50% 2.70% 6.74% 4.17% 0.79% 3.86% 1.08%
FOREIGN TRADE
CLIMATE CHANGE
IMMIGRATION
IMPEACHMENT OR
INVESTIGATING GOVERNMENT
SOMETHING ELSE
CORONAVIRUS TRUMP Q8
-----------------------------------------------------------------
Total
Total Answering
JOBS AND THE ECONOMY
HEALTH CARE
STOPPING CORONAVIRUS
NATIONAL SECURITY
EDUCATION
GUNS
Restoration PAC, Pennsylvania Statewide - May 2020 Banner 6 Page 167 of 290

14a. In politics today, do you generally consider yourself .... a republican, a democrat, an independent or something else?
Total
---------
Str App
---------
Some App
---------
Some Dis
---------
Str Dis
---------
TOT APP
---------
TOT DIS
---------
600 222 89 24 253 311 277
100.00% 100.00% 100.00% 100.00% 100.00% 100.00% 100.00%
600 222 89 24 253 311 277
100.00% 100.00% 100.00% 100.00% 100.00% 100.00% 100.00%
225 167 42 2 10 209 12
37.50% 75.23% 47.19% 8.33% 3.95% 67.20% 4.33%
34 12 14 1 7 26 8
5.67% 5.41% 15.73% 4.17% 2.77% 8.36% 2.89%
119 26 21 12 55 47 67
19.83% 11.71% 23.60% 50.00% 21.74% 15.11% 24.19%
36 4 7 3 21 11 24
6.00% 1.80% 7.87% 12.50% 8.30% 3.54% 8.66%
184 12 5 6 159 17 165
30.67% 5.41% 5.62% 25.00% 62.85% 5.47% 59.57%
2 1 - - 1 1 1
0.33% 0.45% 0.40% 0.32% 0.36%
259 179 56 3 17 235 20
43.17% 80.63% 62.92% 12.50% 6.72% 75.56% 7.22%
220 16 12 9 180 28 189
36.67% 7.21% 13.48% 37.50% 71.15% 9.00% 68.23%
119 26 21 12 55 47 67
19.83% 11.71% 23.60% 50.00% 21.74% 15.11% 24.19%
Not so Strong Republican
AN INDEPENDENT, OR
SOMETHING ELSE
Not so Strong DEMOCRAT
Strong DEMOCRAT
Refused
Total Republican
Total Democrat
Independent
CORONAVIRUS TRUMP Q8
-----------------------------------------------------------------
Total
Total Answering
Strong REPUBLICAN
Restoration PAC, Pennsylvania Statewide - May 2020 Banner 6 Page 168 of 290

14b. Do you think of yourself closer to the Republican Party or Democratic Party?
Total
---------
Str App
---------
Some App
---------
Some Dis
---------
Str Dis
---------
TOT APP
---------
TOT DIS
---------
600 222 89 24 253 311 277
100.00% 100.00% 100.00% 100.00% 100.00% 100.00% 100.00%
121 27 21 12 56 48 68
20.17% 12.16% 23.60% 50.00% 22.13% 15.43% 24.55%
35 14 12 3 3 26 6
5.83% 6.31% 13.48% 12.50% 1.19% 8.36% 2.17%
58 13 6 5 32 19 37
9.67% 5.86% 6.74% 20.83% 12.65% 6.11% 13.36%
28 - 3 4 21 3 25
4.67% 3.37% 16.67% 8.30% 0.96% 9.03%
Total
Total Answering
LEAN REPUBLICAN
FIRM INDEPENDENT
LEAN DEMOCRAT
CORONAVIRUS TRUMP Q8
-----------------------------------------------------------------
Restoration PAC, Pennsylvania Statewide - May 2020 Banner 6 Page 169 of 290

14. Party Summary
Total
---------
Str App
---------
Some App
---------
Some Dis
---------
Str Dis
---------
TOT APP
---------
TOT DIS
---------
600 222 89 24 253 311 277
100.00% 100.00% 100.00% 100.00% 100.00% 100.00% 100.00%
600 222 89 24 253 311 277
100.00% 100.00% 100.00% 100.00% 100.00% 100.00% 100.00%
294 193 68 6 20 261 26
49.00% 86.94% 76.40% 25.00% 7.91% 83.92% 9.39%
58 13 6 5 32 19 37
9.67% 5.86% 6.74% 20.83% 12.65% 6.11% 13.36%
248 16 15 13 201 31 214
41.33% 7.21% 16.85% 54.17% 79.45% 9.97% 77.26%
ALL INDEPENDENT
ALL DEMOCRAT
CORONAVIRUS TRUMP Q8
-----------------------------------------------------------------
Total
Total Answering
ALL REPUBLICAN
Restoration PAC, Pennsylvania Statewide - May 2020 Banner 6 Page 170 of 290

BALLOT. If a mail-in ballot was mailed to you, how likely would you be to vote by mail this fall, as opposed to voting in-person at your polling place?
Total
---------
Str App
---------
Some App
---------
Some Dis
---------
Str Dis
---------
TOT APP
---------
TOT DIS
---------
600 222 89 24 253 311 277
100.00% 100.00% 100.00% 100.00% 100.00% 100.00% 100.00%
600 222 89 24 253 311 277
100.00% 100.00% 100.00% 100.00% 100.00% 100.00% 100.00%
84 29 10 3 40 39 43
14.00% 13.06% 11.24% 12.50% 15.81% 12.54% 15.52%
247 32 23 12 176 55 188
41.17% 14.41% 25.84% 50.00% 69.57% 17.68% 67.87%
269 161 56 9 37 217 46
44.83% 72.52% 62.92% 37.50% 14.62% 69.77% 16.61%
CORONAVIRUS TRUMP Q8
-----------------------------------------------------------------
Total
Total Answering
Somewhat likely to vote by mail
Very likely to vote by mail
Not likely/Would still vote at
polling place
Restoration PAC, Pennsylvania Statewide - May 2020 Banner 6 Page 171 of 290
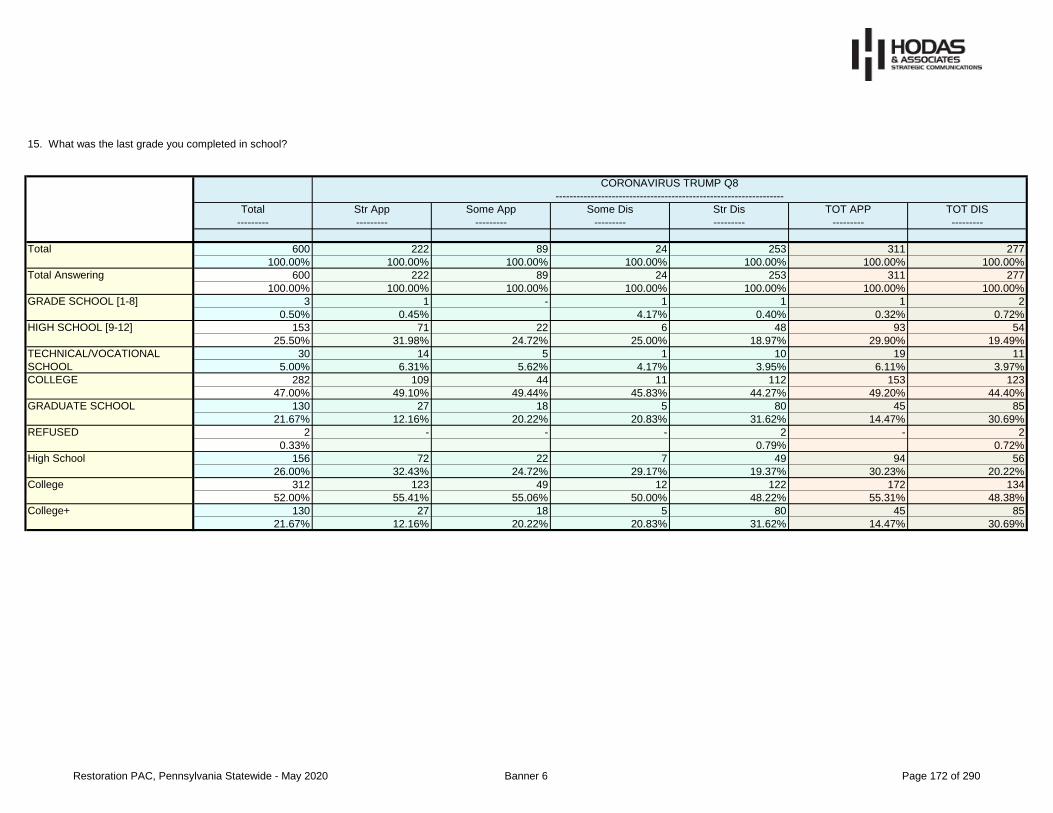
15. What was the last grade you completed in school?
Total
---------
Str App
---------
Some App
---------
Some Dis
---------
Str Dis
---------
TOT APP
---------
TOT DIS
---------
600 222 89 24 253 311 277
100.00% 100.00% 100.00% 100.00% 100.00% 100.00% 100.00%
600 222 89 24 253 311 277
100.00% 100.00% 100.00% 100.00% 100.00% 100.00% 100.00%
3 1 - 1 1 1 2
0.50% 0.45% 4.17% 0.40% 0.32% 0.72%
153 71 22 6 48 93 54
25.50% 31.98% 24.72% 25.00% 18.97% 29.90% 19.49%
30 14 5 1 10 19 11
5.00% 6.31% 5.62% 4.17% 3.95% 6.11% 3.97%
282 109 44 11 112 153 123
47.00% 49.10% 49.44% 45.83% 44.27% 49.20% 44.40%
130 27 18 5 80 45 85
21.67% 12.16% 20.22% 20.83% 31.62% 14.47% 30.69%
2 - - - 2 - 2
0.33% 0.79% 0.72%
156 72 22 7 49 94 56
26.00% 32.43% 24.72% 29.17% 19.37% 30.23% 20.22%
312 123 49 12 122 172 134
52.00% 55.41% 55.06% 50.00% 48.22% 55.31% 48.38%
130 27 18 5 80 45 85
21.67% 12.16% 20.22% 20.83% 31.62% 14.47% 30.69%
College
College+
Total
Total Answering
GRADE SCHOOL [1-8]
HIGH SCHOOL [9-12]
TECHNICAL/VOCATIONAL
SCHOOL
COLLEGE
GRADUATE SCHOOL
REFUSED
High School
CORONAVIRUS TRUMP Q8
-----------------------------------------------------------------
Restoration PAC, Pennsylvania Statewide - May 2020 Banner 6 Page 172 of 290

16. Thinking about where you live, do you consider it to be urban, suburban or rural?
Total
---------
Str App
---------
Some App
---------
Some Dis
---------
Str Dis
---------
TOT APP
---------
TOT DIS
---------
600 222 89 24 253 311 277
100.00% 100.00% 100.00% 100.00% 100.00% 100.00% 100.00%
600 222 89 24 253 311 277
100.00% 100.00% 100.00% 100.00% 100.00% 100.00% 100.00%
103 34 11 2 53 45 55
17.17% 15.32% 12.36% 8.33% 20.95% 14.47% 19.86%
299 109 40 12 130 149 142
49.83% 49.10% 44.94% 50.00% 51.38% 47.91% 51.26%
196 78 38 10 70 116 80
32.67% 35.14% 42.70% 41.67% 27.67% 37.30% 28.88%
2 1 - - - 1 -
0.33% 0.45% 0.32%
CORONAVIRUS TRUMP Q8
-----------------------------------------------------------------
Total
Total Answering
URBAN
SUBURBAN
RURAL
DON'T KNOW
Restoration PAC, Pennsylvania Statewide - May 2020 Banner 6 Page 173 of 290

17. Gender
Total
---------
Str App
---------
Some App
---------
Some Dis
---------
Str Dis
---------
TOT APP
---------
TOT DIS
---------
600 222 89 24 253 311 277
100.00% 100.00% 100.00% 100.00% 100.00% 100.00% 100.00%
600 222 89 24 253 311 277
100.00% 100.00% 100.00% 100.00% 100.00% 100.00% 100.00%
286 114 49 8 108 163 116
47.67% 51.35% 55.06% 33.33% 42.69% 52.41% 41.88%
314 108 40 16 145 148 161
52.33% 48.65% 44.94% 66.67% 57.31% 47.59% 58.12%
CORONAVIRUS TRUMP Q8
-----------------------------------------------------------------
Total
Total Answering
Male
Female
Restoration PAC, Pennsylvania Statewide - May 2020 Banner 6 Page 174 of 290

Table of contents
Banner 7
Table market
Table q1
Table q2
Table q3
Table q4
Table q5
Table q6
Table q7a
Table q7b
Table q7Summ
Table q8
Table corona_1
Table corona_2
Table corona_3
Table q10
Table q11a
Table q11b
Table q11_Summ
Table age
Table q13
Table q14a
Table q14b
Table q14_SUMM
13. Which two of the following issues do you believe are the most important issues facing the country? [Select up to 2]
14a. In politics today, do you generally consider yourself .... a republican, a democrat, an independent or something else?
14b. Do you think of yourself closer to the Republican Party or Democratic Party?
14. Party Summary
11a. If the election for US Congress were being held today, for whom would you vote.... the Republican candidate or the Democrat candidate?
11b. Would you say you are leaning toward the Republican candidate or leaning toward the Democrat candidate?
11. Summary Generic US Congress
12. Age
8. Do you approve or disapprove of the way President Trump is handling the Coronavirus crisis?
CORONAVIRUS 1. With over 60,000 Americans dead from the pandemic, how worried are you that you, or someone close to you, will be infected with coronavirus?
CORONAVIRUS 2. Which statement do you agree with, or agree with more: "It's time for people to get back to work." or "It's too early to lift stay-at-home restrictions."
CORONAVIRUS 3. Which statement do you agree with, or agree with more: "We should re-open the economy, even if that means more people will get coronavirus." or "We
should continue the shelter-in-place restrictions, even if that means severe job losses and economic disruption."
10. Do you think it was fair or unfair that Democrat President Obama's administration investigated and surveilled Republican Donald Trump as both a presidential candidate and
president-elect for allegedly colluding with Russia?
Media Market
1. Thinking ahead to the November election, how likely would you say you are to vote in these elections? Would you say you are…
2. Do you think the country is going in the right direction, or have things pretty seriously gone off on the wrong track?
3. Do you think the economy is going in the right direction, or have things pretty seriously gone off on the wrong track?
4. Do you approve or disapprove of the job Donald Trump is doing as President? Would that be strongly or somewhat (approve or disapprove)?
5. Do you think the impeachment of President Trump was good for the country, bad for the country, or did the impeachment not really matter that much?
6. Do you have a favorable or unfavorable impression of Donald Trump?
7a. If the election for President were being held today, and the candidates were Donald Trump and Joe Biden, for whom would you vote?
7b. Would you say you are leaning toward Donald Trump or leaning toward Joe Biden?
7. Biden Ballot Summary
Restoration PAC, Pennsylvania Statewide - May 2020 Banner 7 Page 175 of 290

Table ballot
Table q15
Table q16
Table q17
15. What was the last grade you completed in school?
16. Thinking about where you live, do you consider it to be urban, suburban or rural?
17. Gender
BALLOT. If a mail-in ballot was mailed to you, how likely would you be to vote by mail this fall, as opposed to voting in-person at your polling place?
Restoration PAC, Pennsylvania Statewide - May 2020 Banner 7 Page 176 of 290

Media Market
Total
---------
Def TRUMP
---------
Prob
TRUMP
---------
UNDEC
---------
Prob BIDEN
---------
Def BIDEN
---------
TOT
TRUMP
---------
TOT BIDEN
---------
Lean
TRUMP
---------
Hard
UNDEC
---------
Lean
BIDEN
---------
All TRUMP
---------
All UNDEC
---------
All BIDEN
---------
600 286 15 22 15 258 301 273 2 21 3 303 21 276
100.00% 100.00% 100.00% 100.00% 100.00% 100.00% 100.00% 100.00% 100.00% 100.00% 100.00% 100.00% 100.00% 100.00%
600 286 15 22 15 258 301 273 2 21 3 303 21 276
100.00% 100.00% 100.00% 100.00% 100.00% 100.00% 100.00% 100.00% 100.00% 100.00% 100.00% 100.00% 100.00% 100.00%
3 1 2 - - - 3 - - - - 3 - -
0.50% 0.35% 13.33% 1.00% 0.99%
248 94 7 10 10 126 101 136 - 11 - 101 11 136
41.33% 32.87% 46.67% 45.45% 66.67% 48.84% 33.55% 49.82% 52.38% 33.33% 52.38% 49.28%
132 68 1 4 1 56 69 57 2 3 1 71 3 58
22.00% 23.78% 6.67% 18.18% 6.67% 21.71% 22.92% 20.88% 100.00% 14.29% 33.33% 23.43% 14.29% 21.01%
1 1 - - - - 1 - - - - 1 - -
0.17% 0.35% 0.33% 0.33%
2 1 - - - 1 1 1 - - - 1 - 1
0.33% 0.35% 0.39% 0.33% 0.37% 0.33% 0.36%
19 10 - 3 - 6 10 6 - 2 1 10 2 7
3.17% 3.50% 13.64% 2.33% 3.32% 2.20% 9.52% 33.33% 3.30% 9.52% 2.54%
5 3 - - - 2 3 2 - - - 3 - 2
0.83% 1.05% 0.78% 1.00% 0.73% 0.99% 0.72%
2 1 - - - 1 1 1 - - - 1 - 1
0.33% 0.35% 0.39% 0.33% 0.37% 0.33% 0.36%
89 51 3 2 2 31 54 33 - 2 - 54 2 33
14.83% 17.83% 20.00% 9.09% 13.33% 12.02% 17.94% 12.09% 9.52% 17.82% 9.52% 11.96%
33 23 - 1 - 9 23 9 - 1 - 23 1 9
5.50% 8.04% 4.55% 3.49% 7.64% 3.30% 4.76% 7.59% 4.76% 3.26%
66 33 2 2 2 26 35 28 - 2 1 35 2 29
11.00% 11.54% 13.33% 9.09% 13.33% 10.08% 11.63% 10.26% 9.52% 33.33% 11.55% 9.52% 10.51%
514 - BUFFALO
516 - ERIE
536 - YOUNGSTOWN
565 - ELMIRA (CORNING)
566 - HARRISBURG-LNCSTR-
LEB-YORK
574 - JOHNSTOWN-ALTOONA-
ST COLGE
577 - WILKES BARRE-
SCRANTON-HZTN
BIDEN BALLOT Q7A
----------------------------------------------------------------------------
UNDECIDED Q7B
--------------------------------
SUMMARY Q7
--------------------------------
Total
Total Answering
501 - NEW YORK
504 - PHILADELPHIA
508 - PITTSBURGH
511 - WASHINGTON, DC
(HAGRSTWN)
Restoration PAC, Pennsylvania Statewide - May 2020 Banner 7 Page 177 of 290

1. Thinking ahead to the November election, how likely would you say you are to vote in these elections? Would you say you are…
Total
---------
Def TRUMP
---------
Prob
TRUMP
---------
UNDEC
---------
Prob BIDEN
---------
Def BIDEN
---------
TOT
TRUMP
---------
TOT BIDEN
---------
Lean
TRUMP
---------
Hard
UNDEC
---------
Lean
BIDEN
---------
All TRUMP
---------
All UNDEC
---------
All BIDEN
---------
600 286 15 22 15 258 301 273 2 21 3 303 21 276
100.00% 100.00% 100.00% 100.00% 100.00% 100.00% 100.00% 100.00% 100.00% 100.00% 100.00% 100.00% 100.00% 100.00%
600 286 15 22 15 258 301 273 2 21 3 303 21 276
100.00% 100.00% 100.00% 100.00% 100.00% 100.00% 100.00% 100.00% 100.00% 100.00% 100.00% 100.00% 100.00% 100.00%
579 283 11 19 13 249 294 262 2 19 2 296 19 264
96.50% 98.95% 73.33% 86.36% 86.67% 96.51% 97.67% 95.97% 100.00% 90.48% 66.67% 97.69% 90.48% 95.65%
21 3 4 3 2 9 7 11 - 2 1 7 2 12
3.50% 1.05% 26.67% 13.64% 13.33% 3.49% 2.33% 4.03% 9.52% 33.33% 2.31% 9.52% 4.35%
SUMMARY Q7
--------------------------------
Total
Total Answering
VERY LIKELY
SOMEWHAT LIKELY
BIDEN BALLOT Q7A
----------------------------------------------------------------------------
UNDECIDED Q7B
--------------------------------
Restoration PAC, Pennsylvania Statewide - May 2020 Banner 7 Page 178 of 290

2. Do you think the country is going in the right direction, or have things pretty seriously gone off on the wrong track?
Total
---------
Def TRUMP
---------
Prob
TRUMP
---------
UNDEC
---------
Prob BIDEN
---------
Def BIDEN
---------
TOT
TRUMP
---------
TOT BIDEN
---------
Lean
TRUMP
---------
Hard
UNDEC
---------
Lean
BIDEN
---------
All TRUMP
---------
All UNDEC
---------
All BIDEN
---------
600 286 15 22 15 258 301 273 2 21 3 303 21 276
100.00% 100.00% 100.00% 100.00% 100.00% 100.00% 100.00% 100.00% 100.00% 100.00% 100.00% 100.00% 100.00% 100.00%
600 286 15 22 15 258 301 273 2 21 3 303 21 276
100.00% 100.00% 100.00% 100.00% 100.00% 100.00% 100.00% 100.00% 100.00% 100.00% 100.00% 100.00% 100.00% 100.00%
230 206 11 4 1 7 217 8 - 4 1 217 4 9
38.33% 72.03% 73.33% 18.18% 6.67% 2.71% 72.09% 2.93% 19.05% 33.33% 71.62% 19.05% 3.26%
339 58 3 16 14 245 61 259 1 16 2 62 16 261
56.50% 20.28% 20.00% 72.73% 93.33% 94.96% 20.27% 94.87% 50.00% 76.19% 66.67% 20.46% 76.19% 94.57%
27 19 1 1 - 6 20 6 - 1 - 20 1 6
4.50% 6.64% 6.67% 4.55% 2.33% 6.64% 2.20% 4.76% 6.60% 4.76% 2.17%
4 3 - 1 - - 3 - 1 - - 4 - -
0.67% 1.05% 4.55% 1.00% 50.00% 1.32%
Total Answering
RIGHT DIRECTION
WRONG TRACK
DON’T KNOW
REFUSED
BIDEN BALLOT Q7A
----------------------------------------------------------------------------
UNDECIDED Q7B
--------------------------------
SUMMARY Q7
--------------------------------
Total
Restoration PAC, Pennsylvania Statewide - May 2020 Banner 7 Page 179 of 290

3. Do you think the economy is going in the right direction, or have things pretty seriously gone off on the wrong track?
Total
---------
Def TRUMP
---------
Prob
TRUMP
---------
UNDEC
---------
Prob BIDEN
---------
Def BIDEN
---------
TOT
TRUMP
---------
TOT BIDEN
---------
Lean
TRUMP
---------
Hard
UNDEC
---------
Lean
BIDEN
---------
All TRUMP
---------
All UNDEC
---------
All BIDEN
---------
600 286 15 22 15 258 301 273 2 21 3 303 21 276
100.00% 100.00% 100.00% 100.00% 100.00% 100.00% 100.00% 100.00% 100.00% 100.00% 100.00% 100.00% 100.00% 100.00%
600 286 15 22 15 258 301 273 2 21 3 303 21 276
100.00% 100.00% 100.00% 100.00% 100.00% 100.00% 100.00% 100.00% 100.00% 100.00% 100.00% 100.00% 100.00% 100.00%
202 170 9 4 - 18 179 18 - 4 1 179 4 19
33.67% 59.44% 60.00% 18.18% 6.98% 59.47% 6.59% 19.05% 33.33% 59.08% 19.05% 6.88%
362 100 6 12 15 227 106 242 1 11 2 107 11 244
60.33% 34.97% 40.00% 54.55% 100.00% 87.98% 35.22% 88.64% 50.00% 52.38% 66.67% 35.31% 52.38% 88.41%
32 14 - 5 - 12 14 12 - 6 - 14 6 12
5.33% 4.90% 22.73% 4.65% 4.65% 4.40% 28.57% 4.62% 28.57% 4.35%
4 2 - 1 - 1 2 1 1 - - 3 - 1
0.67% 0.70% 4.55% 0.39% 0.66% 0.37% 50.00% 0.99% 0.36%
Total Answering
RIGHT DIRECTION
WRONG TRACK
DON’T KNOW
REFUSED
BIDEN BALLOT Q7A
----------------------------------------------------------------------------
UNDECIDED Q7B
--------------------------------
SUMMARY Q7
--------------------------------
Total
Restoration PAC, Pennsylvania Statewide - May 2020 Banner 7 Page 180 of 290

4. Do you approve or disapprove of the job Donald Trump is doing as President? Would that be strongly or somewhat (approve or disapprove)?
Total
---------
Def TRUMP
---------
Prob
TRUMP
---------
UNDEC
---------
Prob BIDEN
---------
Def BIDEN
---------
TOT
TRUMP
---------
TOT BIDEN
---------
Lean
TRUMP
---------
Hard
UNDEC
---------
Lean
BIDEN
---------
All TRUMP
---------
All UNDEC
---------
All BIDEN
---------
600 286 15 22 15 258 301 273 2 21 3 303 21 276
100.00% 100.00% 100.00% 100.00% 100.00% 100.00% 100.00% 100.00% 100.00% 100.00% 100.00% 100.00% 100.00% 100.00%
600 286 15 22 15 258 301 273 2 21 3 303 21 276
100.00% 100.00% 100.00% 100.00% 100.00% 100.00% 100.00% 100.00% 100.00% 100.00% 100.00% 100.00% 100.00% 100.00%
268 253 5 4 - 6 258 6 1 3 - 259 3 6
44.67% 88.46% 33.33% 18.18% 2.33% 85.71% 2.20% 50.00% 14.29% 85.48% 14.29% 2.17%
46 29 8 6 - 2 37 2 1 5 1 38 5 3
7.67% 10.14% 53.33% 27.27% 0.78% 12.29% 0.73% 50.00% 23.81% 33.33% 12.54% 23.81% 1.09%
18 2 1 3 2 10 3 12 - 3 - 3 3 12
3.00% 0.70% 6.67% 13.64% 13.33% 3.88% 1.00% 4.40% 14.29% 0.99% 14.29% 4.35%
256 1 - 7 12 234 1 246 - 7 2 1 7 248
42.67% 0.35% 31.82% 80.00% 90.70% 0.33% 90.11% 33.33% 66.67% 0.33% 33.33% 89.86%
12 1 1 2 1 6 2 7 - 3 - 2 3 7
2.00% 0.35% 6.67% 9.09% 6.67% 2.33% 0.66% 2.56% 14.29% 0.66% 14.29% 2.54%
314 282 13 10 - 8 295 8 2 8 1 297 8 9
52.33% 98.60% 86.67% 45.45% 3.10% 98.01% 2.93% 100.00% 38.10% 33.33% 98.02% 38.10% 3.26%
274 3 1 10 14 244 4 258 - 10 2 4 10 260
45.67% 1.05% 6.67% 45.45% 93.33% 94.57% 1.33% 94.51% 47.62% 66.67% 1.32% 47.62% 94.20%
Total Answering
STRONGLY APPROVE
SOMEWHAT APPROVE
SOMEWHAT DISAPPROVE
STRONGLY DISAPPROVE
DON’T KNOW/NO ANSWER
Total Approve
Total Disapprove
BIDEN BALLOT Q7A
----------------------------------------------------------------------------
UNDECIDED Q7B
--------------------------------
SUMMARY Q7
--------------------------------
Total
Restoration PAC, Pennsylvania Statewide - May 2020 Banner 7 Page 181 of 290

5. Do you think the impeachment of President Trump was good for the country, bad for the country, or did the impeachment not really matter that much?
Total
---------
Def TRUMP
---------
Prob
TRUMP
---------
UNDEC
---------
Prob BIDEN
---------
Def BIDEN
---------
TOT
TRUMP
---------
TOT BIDEN
---------
Lean
TRUMP
---------
Hard
UNDEC
---------
Lean
BIDEN
---------
All TRUMP
---------
All UNDEC
---------
All BIDEN
---------
600 286 15 22 15 258 301 273 2 21 3 303 21 276
100.00% 100.00% 100.00% 100.00% 100.00% 100.00% 100.00% 100.00% 100.00% 100.00% 100.00% 100.00% 100.00% 100.00%
600 286 15 22 15 258 301 273 2 21 3 303 21 276
100.00% 100.00% 100.00% 100.00% 100.00% 100.00% 100.00% 100.00% 100.00% 100.00% 100.00% 100.00% 100.00% 100.00%
107 19 1 1 4 82 20 86 - 1 - 20 1 86
17.83% 6.64% 6.67% 4.55% 26.67% 31.78% 6.64% 31.50% 4.76% 6.60% 4.76% 31.16%
289 230 11 8 8 31 241 39 - 8 1 241 8 40
48.17% 80.42% 73.33% 36.36% 53.33% 12.02% 80.07% 14.29% 38.10% 33.33% 79.54% 38.10% 14.49%
204 37 3 13 3 145 40 148 2 12 2 42 12 150
34.00% 12.94% 20.00% 59.09% 20.00% 56.20% 13.29% 54.21% 100.00% 57.14% 66.67% 13.86% 57.14% 54.35%
UNDECIDED Q7B
--------------------------------
SUMMARY Q7
--------------------------------
Total
Total Answering
GOOD
BAD
DOESN'T MATTER/DON'T
KNOW
BIDEN BALLOT Q7A
----------------------------------------------------------------------------
Restoration PAC, Pennsylvania Statewide - May 2020 Banner 7 Page 182 of 290

6. Do you have a favorable or unfavorable impression of Donald Trump?
Total
---------
Def TRUMP
---------
Prob
TRUMP
---------
UNDEC
---------
Prob BIDEN
---------
Def BIDEN
---------
TOT
TRUMP
---------
TOT BIDEN
---------
Lean
TRUMP
---------
Hard
UNDEC
---------
Lean
BIDEN
---------
All TRUMP
---------
All UNDEC
---------
All BIDEN
---------
600 286 15 22 15 258 301 273 2 21 3 303 21 276
100.00% 100.00% 100.00% 100.00% 100.00% 100.00% 100.00% 100.00% 100.00% 100.00% 100.00% 100.00% 100.00% 100.00%
600 286 15 22 15 258 301 273 2 21 3 303 21 276
100.00% 100.00% 100.00% 100.00% 100.00% 100.00% 100.00% 100.00% 100.00% 100.00% 100.00% 100.00% 100.00% 100.00%
243 236 2 2 - 2 238 2 - 3 - 238 3 2
40.50% 82.52% 13.33% 9.09% 0.78% 79.07% 0.73% 14.29% 78.55% 14.29% 0.72%
53 41 9 2 - 1 50 1 - 1 1 50 1 2
8.83% 14.34% 60.00% 9.09% 0.39% 16.61% 0.37% 4.76% 33.33% 16.50% 4.76% 0.72%
11 2 1 3 1 4 3 5 1 2 - 4 2 5
1.83% 0.70% 6.67% 13.64% 6.67% 1.55% 1.00% 1.83% 50.00% 9.52% 1.32% 9.52% 1.81%
24 2 3 4 1 14 5 15 1 3 - 6 3 15
4.00% 0.70% 20.00% 18.18% 6.67% 5.43% 1.66% 5.49% 50.00% 14.29% 1.98% 14.29% 5.43%
268 5 - 11 13 237 5 250 - 11 2 5 11 252
44.67% 1.75% 50.00% 86.67% 91.86% 1.66% 91.58% 52.38% 66.67% 1.65% 52.38% 91.30%
- - - - - - - - - - - - - -
1 - - - - - - - - 1 - - 1 -
0.17% 4.76% 4.76%
296 277 11 4 - 3 288 3 - 4 1 288 4 4
49.33% 96.85% 73.33% 18.18% 1.16% 95.68% 1.10% 19.05% 33.33% 95.05% 19.05% 1.45%
292 7 3 15 14 251 10 265 1 14 2 11 14 267
48.67% 2.45% 20.00% 68.18% 93.33% 97.29% 3.32% 97.07% 50.00% 66.67% 66.67% 3.63% 66.67% 96.74%
Total Favorable
Total Unfavorable
Total
Total Answering
Strongly FAVORABLE
Somewhat FAVORABLE
NO OPINION
Somewhat UNFAVORABLE
Strongly UNFAVORABLE
DON’T KNOW/NOT SURE
REFUSED
BIDEN BALLOT Q7A
----------------------------------------------------------------------------
UNDECIDED Q7B
--------------------------------
SUMMARY Q7
--------------------------------
Restoration PAC, Pennsylvania Statewide - May 2020 Banner 7 Page 183 of 290

7a. If the election for President were being held today, and the candidates were Donald Trump and Joe Biden, for whom would you vote?
Total
---------
Def TRUMP
---------
Prob
TRUMP
---------
UNDEC
---------
Prob BIDEN
---------
Def BIDEN
---------
TOT
TRUMP
---------
TOT BIDEN
---------
Lean
TRUMP
---------
Hard
UNDEC
---------
Lean
BIDEN
---------
All TRUMP
---------
All UNDEC
---------
All BIDEN
---------
600 286 15 22 15 258 301 273 2 21 3 303 21 276
100.00% 100.00% 100.00% 100.00% 100.00% 100.00% 100.00% 100.00% 100.00% 100.00% 100.00% 100.00% 100.00% 100.00%
600 286 15 22 15 258 301 273 2 21 3 303 21 276
100.00% 100.00% 100.00% 100.00% 100.00% 100.00% 100.00% 100.00% 100.00% 100.00% 100.00% 100.00% 100.00% 100.00%
286 286 - - - - 286 - - - - 286 - -
47.67% 100.00% 95.02% 94.39%
15 - 15 - - - 15 - - - - 15 - -
2.50% 100.00% 4.98% 4.95%
22 - - 22 - - - - 2 17 3 2 17 3
3.67% 100.00% 100.00% 80.95% 100.00% 0.66% 80.95% 1.09%
15 - - - 15 - - 15 - - - - - 15
2.50% 100.00% 5.49% 5.43%
258 - - - - 258 - 258 - - - - - 258
43.00% 100.00% 94.51% 93.48%
4 - - - - - - - - 4 - - 4 -
0.67% 19.05% 19.05%
301 286 15 - - - 301 - - - - 301 - -
50.17% 100.00% 100.00% 100.00% 99.34%
22 - - 22 - - - - 2 17 3 2 17 3
3.67% 100.00% 100.00% 80.95% 100.00% 0.66% 80.95% 1.09%
273 - - - 15 258 - 273 - - - - - 273
45.50% 100.00% 100.00% 100.00% 98.91%
UNDECIDED
Probably BIDEN
Definitely BIDEN
Refused
Total Trump
Total Undecided
Total Biden
BIDEN BALLOT Q7A
----------------------------------------------------------------------------
UNDECIDED Q7B
--------------------------------
SUMMARY Q7
--------------------------------
Total
Total Answering
Definitely TRUMP
Probably TRUMP
Restoration PAC, Pennsylvania Statewide - May 2020 Banner 7 Page 184 of 290

7b. Would you say you are leaning toward Donald Trump or leaning toward Joe Biden?
Total
---------
Def TRUMP
---------
Prob
TRUMP
---------
UNDEC
---------
Prob BIDEN
---------
Def BIDEN
---------
TOT
TRUMP
---------
TOT BIDEN
---------
Lean
TRUMP
---------
Hard
UNDEC
---------
Lean
BIDEN
---------
All TRUMP
---------
All UNDEC
---------
All BIDEN
---------
600 286 15 22 15 258 301 273 2 21 3 303 21 276
100.00% 100.00% 100.00% 100.00% 100.00% 100.00% 100.00% 100.00% 100.00% 100.00% 100.00% 100.00% 100.00% 100.00%
26 - - 22 - - - - 2 21 3 2 21 3
4.33% 100.00% 100.00% 100.00% 100.00% 0.66% 100.00% 1.09%
2 - - 2 - - - - 2 - - 2 - -
0.33% 9.09% 100.00% 0.66%
21 - - 17 - - - - - 21 - - 21 -
3.50% 77.27% 100.00% 100.00%
3 - - 3 - - - - - - 3 - - 3
0.50% 13.64% 100.00% 1.09%
SUMMARY Q7
--------------------------------
Total
Total Answering
LEAN TRUMP
HARD UNDECIDED
LEAN BIDEN
BIDEN BALLOT Q7A
----------------------------------------------------------------------------
UNDECIDED Q7B
--------------------------------
Restoration PAC, Pennsylvania Statewide - May 2020 Banner 7 Page 185 of 290

7. Biden Ballot Summary
Total
---------
Def TRUMP
---------
Prob
TRUMP
---------
UNDEC
---------
Prob BIDEN
---------
Def BIDEN
---------
TOT
TRUMP
---------
TOT BIDEN
---------
Lean
TRUMP
---------
Hard
UNDEC
---------
Lean
BIDEN
---------
All TRUMP
---------
All UNDEC
---------
All BIDEN
---------
600 286 15 22 15 258 301 273 2 21 3 303 21 276
100.00% 100.00% 100.00% 100.00% 100.00% 100.00% 100.00% 100.00% 100.00% 100.00% 100.00% 100.00% 100.00% 100.00%
600 286 15 22 15 258 301 273 2 21 3 303 21 276
100.00% 100.00% 100.00% 100.00% 100.00% 100.00% 100.00% 100.00% 100.00% 100.00% 100.00% 100.00% 100.00% 100.00%
303 286 15 2 - - 301 - 2 - - 303 - -
50.50% 100.00% 100.00% 9.09% 100.00% 100.00% 100.00%
21 - - 17 - - - - - 21 - - 21 -
3.50% 77.27% 100.00% 100.00%
276 - - 3 15 258 - 273 - - 3 - - 276
46.00% 13.64% 100.00% 100.00% 100.00% 100.00% 100.00%
Total
Total Answering
ALL TRUMP
ALL UNDECIDED
ALL BIDEN
BIDEN BALLOT Q7A
----------------------------------------------------------------------------
UNDECIDED Q7B
--------------------------------
SUMMARY Q7
--------------------------------
Restoration PAC, Pennsylvania Statewide - May 2020 Banner 7 Page 186 of 290

8. Do you approve or disapprove of the way President Trump is handling the Coronavirus crisis?
Total
---------
Def TRUMP
---------
Prob
TRUMP
---------
UNDEC
---------
Prob BIDEN
---------
Def BIDEN
---------
TOT
TRUMP
---------
TOT BIDEN
---------
Lean
TRUMP
---------
Hard
UNDEC
---------
Lean
BIDEN
---------
All TRUMP
---------
All UNDEC
---------
All BIDEN
---------
600 286 15 22 15 258 301 273 2 21 3 303 21 276
100.00% 100.00% 100.00% 100.00% 100.00% 100.00% 100.00% 100.00% 100.00% 100.00% 100.00% 100.00% 100.00% 100.00%
600 286 15 22 15 258 301 273 2 21 3 303 21 276
100.00% 100.00% 100.00% 100.00% 100.00% 100.00% 100.00% 100.00% 100.00% 100.00% 100.00% 100.00% 100.00% 100.00%
222 208 5 3 - 5 213 5 1 3 - 214 3 5
37.00% 72.73% 33.33% 13.64% 1.94% 70.76% 1.83% 50.00% 14.29% 70.63% 14.29% 1.81%
89 66 8 7 2 5 74 7 1 6 1 75 6 8
14.83% 23.08% 53.33% 31.82% 13.33% 1.94% 24.58% 2.56% 50.00% 28.57% 33.33% 24.75% 28.57% 2.90%
24 4 1 1 3 14 5 17 - 2 - 5 2 17
4.00% 1.40% 6.67% 4.55% 20.00% 5.43% 1.66% 6.23% 9.52% 1.65% 9.52% 6.16%
253 2 - 10 10 230 2 240 - 9 2 2 9 242
42.17% 0.70% 45.45% 66.67% 89.15% 0.66% 87.91% 42.86% 66.67% 0.66% 42.86% 87.68%
12 6 1 1 - 4 7 4 - 1 - 7 1 4
2.00% 2.10% 6.67% 4.55% 1.55% 2.33% 1.47% 4.76% 2.31% 4.76% 1.45%
311 274 13 10 2 10 287 12 2 9 1 289 9 13
51.83% 95.80% 86.67% 45.45% 13.33% 3.88% 95.35% 4.40% 100.00% 42.86% 33.33% 95.38% 42.86% 4.71%
277 6 1 11 13 244 7 257 - 11 2 7 11 259
46.17% 2.10% 6.67% 50.00% 86.67% 94.57% 2.33% 94.14% 52.38% 66.67% 2.31% 52.38% 93.84%
Total Answering
STRONGLY APPROVE
SOMEWHAT APPROVE
SOMEWHAT DISAPPROVE
STRONGLY DISAPPROVE
DON’T KNOW/NO ANSWER
Total Approve
Total Disapprove
BIDEN BALLOT Q7A
----------------------------------------------------------------------------
UNDECIDED Q7B
--------------------------------
SUMMARY Q7
--------------------------------
Total
Restoration PAC, Pennsylvania Statewide - May 2020 Banner 7 Page 187 of 290

CORONAVIRUS 1. With over 60,000 Americans dead from the pandemic, how worried are you that you, or someone close to you, will be infected with coronavirus?
Total
---------
Def TRUMP
---------
Prob
TRUMP
---------
UNDEC
---------
Prob BIDEN
---------
Def BIDEN
---------
TOT
TRUMP
---------
TOT BIDEN
---------
Lean
TRUMP
---------
Hard
UNDEC
---------
Lean
BIDEN
---------
All TRUMP
---------
All UNDEC
---------
All BIDEN
---------
600 286 15 22 15 258 301 273 2 21 3 303 21 276
100.00% 100.00% 100.00% 100.00% 100.00% 100.00% 100.00% 100.00% 100.00% 100.00% 100.00% 100.00% 100.00% 100.00%
600 286 15 22 15 258 301 273 2 21 3 303 21 276
100.00% 100.00% 100.00% 100.00% 100.00% 100.00% 100.00% 100.00% 100.00% 100.00% 100.00% 100.00% 100.00% 100.00%
168 135 6 7 2 17 141 19 2 5 1 143 5 20
28.00% 47.20% 40.00% 31.82% 13.33% 6.59% 46.84% 6.96% 100.00% 23.81% 33.33% 47.19% 23.81% 7.25%
223 110 5 8 6 92 115 98 - 9 1 115 9 99
37.17% 38.46% 33.33% 36.36% 40.00% 35.66% 38.21% 35.90% 42.86% 33.33% 37.95% 42.86% 35.87%
209 41 4 7 7 149 45 156 - 7 1 45 7 157
34.83% 14.34% 26.67% 31.82% 46.67% 57.75% 14.95% 57.14% 33.33% 33.33% 14.85% 33.33% 56.88%
UNDECIDED Q7B
--------------------------------
SUMMARY Q7
--------------------------------
Total
Total Answering
NOT WORRIED
SOMEWHAT WORRIED
VERY WORRIED
BIDEN BALLOT Q7A
----------------------------------------------------------------------------
Restoration PAC, Pennsylvania Statewide - May 2020 Banner 7 Page 188 of 290

CORONAVIRUS 2. Which statement do you agree with, or agree with more: "It's time for people to get back to work." or "It's too early to lift stay-at-home restrictions."
Total
---------
Def TRUMP
---------
Prob
TRUMP
---------
UNDEC
---------
Prob BIDEN
---------
Def BIDEN
---------
TOT
TRUMP
---------
TOT BIDEN
---------
Lean
TRUMP
---------
Hard
UNDEC
---------
Lean
BIDEN
---------
All TRUMP
---------
All UNDEC
---------
All BIDEN
---------
600 286 15 22 15 258 301 273 2 21 3 303 21 276
100.00% 100.00% 100.00% 100.00% 100.00% 100.00% 100.00% 100.00% 100.00% 100.00% 100.00% 100.00% 100.00% 100.00%
600 286 15 22 15 258 301 273 2 21 3 303 21 276
100.00% 100.00% 100.00% 100.00% 100.00% 100.00% 100.00% 100.00% 100.00% 100.00% 100.00% 100.00% 100.00% 100.00%
309 248 12 11 3 32 260 35 1 10 3 261 10 38
51.50% 86.71% 80.00% 50.00% 20.00% 12.40% 86.38% 12.82% 50.00% 47.62% 100.00% 86.14% 47.62% 13.77%
291 38 3 11 12 226 41 238 1 11 - 42 11 238
48.50% 13.29% 20.00% 50.00% 80.00% 87.60% 13.62% 87.18% 50.00% 52.38% 13.86% 52.38% 86.23%
Total
Total Answering
WORK
STAY HOME
BIDEN BALLOT Q7A
----------------------------------------------------------------------------
UNDECIDED Q7B
--------------------------------
SUMMARY Q7
--------------------------------
Restoration PAC, Pennsylvania Statewide - May 2020 Banner 7 Page 189 of 290

Total
---------
Def TRUMP
---------
Prob
TRUMP
---------
UNDEC
---------
Prob BIDEN
---------
Def BIDEN
---------
TOT
TRUMP
---------
TOT BIDEN
---------
Lean
TRUMP
---------
Hard
UNDEC
---------
Lean
BIDEN
---------
All TRUMP
---------
All UNDEC
---------
All BIDEN
---------
600 286 15 22 15 258 301 273 2 21 3 303 21 276
100.00% 100.00% 100.00% 100.00% 100.00% 100.00% 100.00% 100.00% 100.00% 100.00% 100.00% 100.00% 100.00% 100.00%
600 286 15 22 15 258 301 273 2 21 3 303 21 276
100.00% 100.00% 100.00% 100.00% 100.00% 100.00% 100.00% 100.00% 100.00% 100.00% 100.00% 100.00% 100.00% 100.00%
301 245 9 9 6 29 254 35 1 9 2 255 9 37
50.17% 85.66% 60.00% 40.91% 40.00% 11.24% 84.39% 12.82% 50.00% 42.86% 66.67% 84.16% 42.86% 13.41%
299 41 6 13 9 229 47 238 1 12 1 48 12 239
49.83% 14.34% 40.00% 59.09% 60.00% 88.76% 15.61% 87.18% 50.00% 57.14% 33.33% 15.84% 57.14% 86.59%
OPEN/VIRUS
SHUTDOWN/JOBS
BIDEN BALLOT Q7A
----------------------------------------------------------------------------
UNDECIDED Q7B
--------------------------------
SUMMARY Q7
--------------------------------
Total
Total Answering
CORONAVIRUS 3. Which statement do you agree with, or agree with more: "We should re-open the economy, even if that means more people will get coronavirus." or "We should continue the shelter-in-place
restrictions, even if that means severe job losses and economic disruption."
Restoration PAC, Pennsylvania Statewide - May 2020 Banner 7 Page 190 of 290
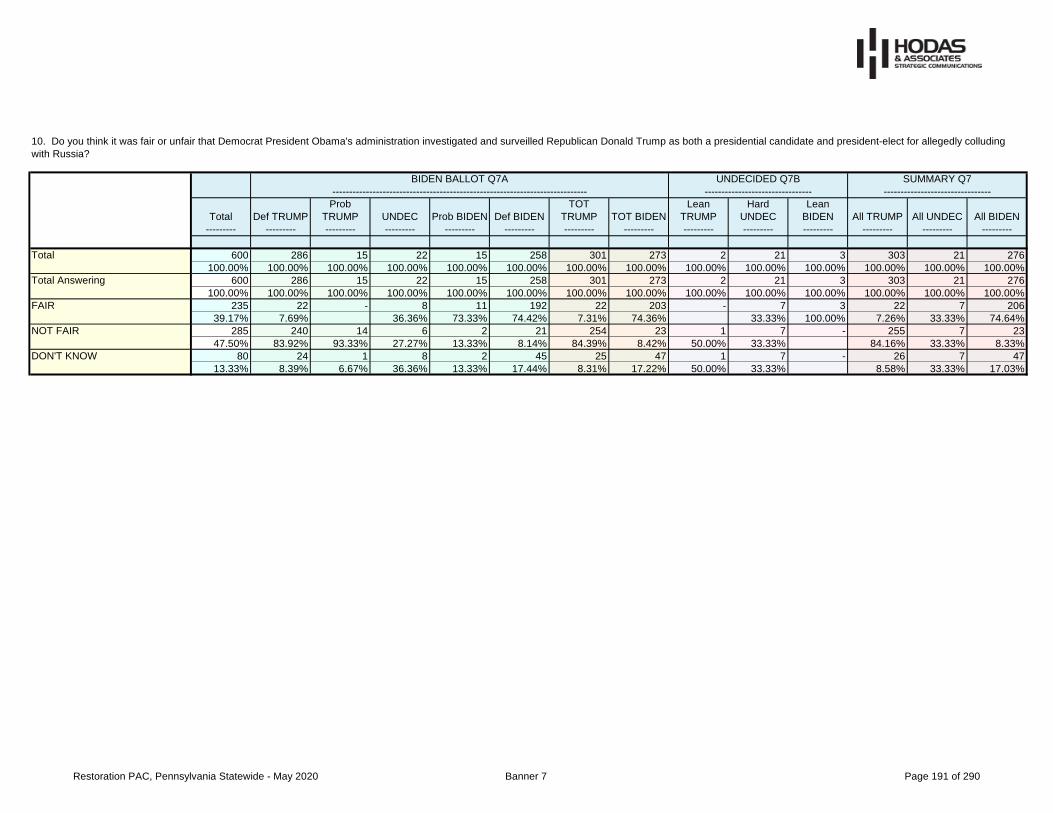
Total
---------
Def TRUMP
---------
Prob
TRUMP
---------
UNDEC
---------
Prob BIDEN
---------
Def BIDEN
---------
TOT
TRUMP
---------
TOT BIDEN
---------
Lean
TRUMP
---------
Hard
UNDEC
---------
Lean
BIDEN
---------
All TRUMP
---------
All UNDEC
---------
All BIDEN
---------
600 286 15 22 15 258 301 273 2 21 3 303 21 276
100.00% 100.00% 100.00% 100.00% 100.00% 100.00% 100.00% 100.00% 100.00% 100.00% 100.00% 100.00% 100.00% 100.00%
600 286 15 22 15 258 301 273 2 21 3 303 21 276
100.00% 100.00% 100.00% 100.00% 100.00% 100.00% 100.00% 100.00% 100.00% 100.00% 100.00% 100.00% 100.00% 100.00%
235 22 - 8 11 192 22 203 - 7 3 22 7 206
39.17% 7.69% 36.36% 73.33% 74.42% 7.31% 74.36% 33.33% 100.00% 7.26% 33.33% 74.64%
285 240 14 6 2 21 254 23 1 7 - 255 7 23
47.50% 83.92% 93.33% 27.27% 13.33% 8.14% 84.39% 8.42% 50.00% 33.33% 84.16% 33.33% 8.33%
80 24 1 8 2 45 25 47 1 7 - 26 7 47
13.33% 8.39% 6.67% 36.36% 13.33% 17.44% 8.31% 17.22% 50.00% 33.33% 8.58% 33.33% 17.03%
DON'T KNOW
BIDEN BALLOT Q7A
----------------------------------------------------------------------------
UNDECIDED Q7B
--------------------------------
SUMMARY Q7
--------------------------------
Total
Total Answering
FAIR
NOT FAIR
10. Do you think it was fair or unfair that Democrat President Obama's administration investigated and surveilled Republican Donald Trump as both a presidential candidate and president-elect for allegedly colluding
with Russia?
Restoration PAC, Pennsylvania Statewide - May 2020 Banner 7 Page 191 of 290

11a. If the election for US Congress were being held today, for whom would you vote.... the Republican candidate or the Democrat candidate?
Total
---------
Def TRUMP
---------
Prob
TRUMP
---------
UNDEC
---------
Prob BIDEN
---------
Def BIDEN
---------
TOT
TRUMP
---------
TOT BIDEN
---------
Lean
TRUMP
---------
Hard
UNDEC
---------
Lean
BIDEN
---------
All TRUMP
---------
All UNDEC
---------
All BIDEN
---------
600 286 15 22 15 258 301 273 2 21 3 303 21 276
100.00% 100.00% 100.00% 100.00% 100.00% 100.00% 100.00% 100.00% 100.00% 100.00% 100.00% 100.00% 100.00% 100.00%
600 286 15 22 15 258 301 273 2 21 3 303 21 276
100.00% 100.00% 100.00% 100.00% 100.00% 100.00% 100.00% 100.00% 100.00% 100.00% 100.00% 100.00% 100.00% 100.00%
248 231 6 4 1 6 237 7 - 4 - 237 4 7
41.33% 80.77% 40.00% 18.18% 6.67% 2.33% 78.74% 2.56% 19.05% 78.22% 19.05% 2.54%
34 27 3 - 2 2 30 4 - - - 30 - 4
5.67% 9.44% 20.00% 13.33% 0.78% 9.97% 1.47% 9.90% 1.45%
92 27 5 13 5 40 32 45 2 12 1 34 12 46
15.33% 9.44% 33.33% 59.09% 33.33% 15.50% 10.63% 16.48% 100.00% 57.14% 33.33% 11.22% 57.14% 16.67%
25 1 1 1 4 17 2 21 - 1 1 2 1 22
4.17% 0.35% 6.67% 4.55% 26.67% 6.59% 0.66% 7.69% 4.76% 33.33% 0.66% 4.76% 7.97%
198 - - 4 3 191 - 194 - 3 1 - 3 195
33.00% 18.18% 20.00% 74.03% 71.06% 14.29% 33.33% 14.29% 70.65%
3 - - - - 2 - 2 - 1 - - 1 2
0.50% 0.78% 0.73% 4.76% 4.76% 0.72%
282 258 9 4 3 8 267 11 - 4 - 267 4 11
47.00% 90.21% 60.00% 18.18% 20.00% 3.10% 88.70% 4.03% 19.05% 88.12% 19.05% 3.99%
223 1 1 5 7 208 2 215 - 4 2 2 4 217
37.17% 0.35% 6.67% 22.73% 46.67% 80.62% 0.66% 78.75% 19.05% 66.67% 0.66% 19.05% 78.62%
Probably DEMOCRAT
Definitely DEMOCRAT
Refused
Total Republican
Total Democrat
BIDEN BALLOT Q7A
----------------------------------------------------------------------------
UNDECIDED Q7B
--------------------------------
SUMMARY Q7
--------------------------------
Total
Total Answering
Definitely REPUBLICAN
Probably REPUBLICAN
UNDECIDED
Restoration PAC, Pennsylvania Statewide - May 2020 Banner 7 Page 192 of 290

11b. Would you say you are leaning toward the Republican candidate or leaning toward the Democrat candidate?
Total
---------
Def TRUMP
---------
Prob
TRUMP
---------
UNDEC
---------
Prob BIDEN
---------
Def BIDEN
---------
TOT
TRUMP
---------
TOT BIDEN
---------
Lean
TRUMP
---------
Hard
UNDEC
---------
Lean
BIDEN
---------
All TRUMP
---------
All UNDEC
---------
All BIDEN
---------
600 286 15 22 15 258 301 273 2 21 3 303 21 276
100.00% 100.00% 100.00% 100.00% 100.00% 100.00% 100.00% 100.00% 100.00% 100.00% 100.00% 100.00% 100.00% 100.00%
95 27 5 13 5 42 32 47 2 13 1 34 13 48
15.83% 9.44% 33.33% 59.09% 33.33% 16.28% 10.63% 17.22% 100.00% 61.90% 33.33% 11.22% 61.90% 17.39%
14 8 3 2 - 1 11 1 2 - - 13 - 1
2.33% 2.80% 20.00% 9.09% 0.39% 3.65% 0.37% 100.00% 4.29% 0.36%
63 18 2 11 4 27 20 31 - 11 1 20 11 32
10.50% 6.29% 13.33% 50.00% 26.67% 10.47% 6.64% 11.36% 52.38% 33.33% 6.60% 52.38% 11.59%
18 1 - - 1 14 1 15 - 2 - 1 2 15
3.00% 0.35% 6.67% 5.43% 0.33% 5.49% 9.52% 0.33% 9.52% 5.43%
Total Answering
LEAN GOP
HARD UNDECIDED/NOT SURE
LEAN DEM
BIDEN BALLOT Q7A
----------------------------------------------------------------------------
UNDECIDED Q7B
--------------------------------
SUMMARY Q7
--------------------------------
Total
Restoration PAC, Pennsylvania Statewide - May 2020 Banner 7 Page 193 of 290

11. Summary Generic US Congress
Total
---------
Def TRUMP
---------
Prob
TRUMP
---------
UNDEC
---------
Prob BIDEN
---------
Def BIDEN
---------
TOT
TRUMP
---------
TOT BIDEN
---------
Lean
TRUMP
---------
Hard
UNDEC
---------
Lean
BIDEN
---------
All TRUMP
---------
All UNDEC
---------
All BIDEN
---------
600 286 15 22 15 258 301 273 2 21 3 303 21 276
100.00% 100.00% 100.00% 100.00% 100.00% 100.00% 100.00% 100.00% 100.00% 100.00% 100.00% 100.00% 100.00% 100.00%
600 286 15 22 15 258 301 273 2 21 3 303 21 276
100.00% 100.00% 100.00% 100.00% 100.00% 100.00% 100.00% 100.00% 100.00% 100.00% 100.00% 100.00% 100.00% 100.00%
296 266 12 6 3 9 278 12 2 4 - 280 4 12
49.33% 93.01% 80.00% 27.27% 20.00% 3.49% 92.36% 4.40% 100.00% 19.05% 92.41% 19.05% 4.35%
63 18 2 11 4 27 20 31 - 11 1 20 11 32
10.50% 6.29% 13.33% 50.00% 26.67% 10.47% 6.64% 11.36% 52.38% 33.33% 6.60% 52.38% 11.59%
241 2 1 5 8 222 3 230 - 6 2 3 6 232
40.17% 0.70% 6.67% 22.73% 53.33% 86.05% 1.00% 84.25% 28.57% 66.67% 0.99% 28.57% 84.06%
ALL GOP
HARD UNDECIDED
ALL DEM
BIDEN BALLOT Q7A
----------------------------------------------------------------------------
UNDECIDED Q7B
--------------------------------
SUMMARY Q7
--------------------------------
Total
Total Answering
Restoration PAC, Pennsylvania Statewide - May 2020 Banner 7 Page 194 of 290

12. Age
Total
---------
Def TRUMP
---------
Prob
TRUMP
---------
UNDEC
---------
Prob BIDEN
---------
Def BIDEN
---------
TOT
TRUMP
---------
TOT BIDEN
---------
Lean
TRUMP
---------
Hard
UNDEC
---------
Lean
BIDEN
---------
All TRUMP
---------
All UNDEC
---------
All BIDEN
---------
600 286 15 22 15 258 301 273 2 21 3 303 21 276
100.00% 100.00% 100.00% 100.00% 100.00% 100.00% 100.00% 100.00% 100.00% 100.00% 100.00% 100.00% 100.00% 100.00%
600 286 15 22 15 258 301 273 2 21 3 303 21 276
100.00% 100.00% 100.00% 100.00% 100.00% 100.00% 100.00% 100.00% 100.00% 100.00% 100.00% 100.00% 100.00% 100.00%
34 12 2 - 1 18 14 19 - 1 - 14 1 19
5.67% 4.20% 13.33% 6.67% 6.98% 4.65% 6.96% 4.76% 4.62% 4.76% 6.88%
81 37 1 3 2 38 38 40 1 1 1 39 1 41
13.50% 12.94% 6.67% 13.64% 13.33% 14.73% 12.62% 14.65% 50.00% 4.76% 33.33% 12.87% 4.76% 14.86%
91 38 4 3 1 45 42 46 - 3 - 42 3 46
15.17% 13.29% 26.67% 13.64% 6.67% 17.44% 13.95% 16.85% 14.29% 13.86% 14.29% 16.67%
98 47 4 3 4 40 51 44 - 2 1 51 2 45
16.33% 16.43% 26.67% 13.64% 26.67% 15.50% 16.94% 16.12% 9.52% 33.33% 16.83% 9.52% 16.30%
118 59 1 5 1 50 60 51 - 7 - 60 7 51
19.67% 20.63% 6.67% 22.73% 6.67% 19.38% 19.93% 18.68% 33.33% 19.80% 33.33% 18.48%
155 78 2 7 5 62 80 67 1 6 1 81 6 68
25.83% 27.27% 13.33% 31.82% 33.33% 24.03% 26.58% 24.54% 50.00% 28.57% 33.33% 26.73% 28.57% 24.64%
23 15 1 1 1 5 16 6 - 1 - 16 1 6
3.83% 5.24% 6.67% 4.55% 6.67% 1.94% 5.32% 2.20% 4.76% 5.28% 4.76% 2.17%
115 49 3 3 3 56 52 59 1 2 1 53 2 60
19.17% 17.13% 20.00% 13.64% 20.00% 21.71% 17.28% 21.61% 50.00% 9.52% 33.33% 17.49% 9.52% 21.74%
189 85 8 6 5 85 93 90 - 5 1 93 5 91
31.50% 29.72% 53.33% 27.27% 33.33% 32.95% 30.90% 32.97% 23.81% 33.33% 30.69% 23.81% 32.97%
273 137 3 12 6 112 140 118 1 13 1 141 13 119
45.50% 47.90% 20.00% 54.55% 40.00% 43.41% 46.51% 43.22% 50.00% 61.90% 33.33% 46.53% 61.90% 43.12%
25-34
35-44
45-54
55-64
65+
Refused
Young Adult 18-34
Family Age 35-54
Seniors 55+
BIDEN BALLOT Q7A
----------------------------------------------------------------------------
UNDECIDED Q7B
--------------------------------
SUMMARY Q7
--------------------------------
Total
Total Answering
18-24
Restoration PAC, Pennsylvania Statewide - May 2020 Banner 7 Page 195 of 290

13. Which two of the following issues do you believe are the most important issues facing the country? [Select up to 2]
Total
---------
Def TRUMP
---------
Prob
TRUMP
---------
UNDEC
---------
Prob BIDEN
---------
Def BIDEN
---------
TOT
TRUMP
---------
TOT BIDEN
---------
Lean
TRUMP
---------
Hard
UNDEC
---------
Lean
BIDEN
---------
All TRUMP
---------
All UNDEC
---------
All BIDEN
---------
600 286 15 22 15 258 301 273 2 21 3 303 21 276
100.00% 100.00% 100.00% 100.00% 100.00% 100.00% 100.00% 100.00% 100.00% 100.00% 100.00% 100.00% 100.00% 100.00%
600 286 15 22 15 258 301 273 2 21 3 303 21 276
100.00% 100.00% 100.00% 100.00% 100.00% 100.00% 100.00% 100.00% 100.00% 100.00% 100.00% 100.00% 100.00% 100.00%
264 169 10 10 6 67 179 73 1 10 1 180 10 74
44.00% 59.09% 66.67% 45.45% 40.00% 25.97% 59.47% 26.74% 50.00% 47.62% 33.33% 59.41% 47.62% 26.81%
190 62 4 9 4 110 66 114 - 8 2 66 8 116
31.67% 21.68% 26.67% 40.91% 26.67% 42.64% 21.93% 41.76% 38.10% 66.67% 21.78% 38.10% 42.03%
271 90 8 9 10 153 98 163 1 8 1 99 8 164
45.17% 31.47% 53.33% 40.91% 66.67% 59.30% 32.56% 59.71% 50.00% 38.10% 33.33% 32.67% 38.10% 59.42%
77 59 1 - 2 15 60 17 - - - 60 - 17
12.83% 20.63% 6.67% 13.33% 5.81% 19.93% 6.23% 19.80% 6.16%
71 30 4 5 1 31 34 32 - 4 1 34 4 33
11.83% 10.49% 26.67% 22.73% 6.67% 12.02% 11.30% 11.72% 19.05% 33.33% 11.22% 19.05% 11.96%
47 15 - 1 2 29 15 31 1 - - 16 - 31
7.83% 5.24% 4.55% 13.33% 11.24% 4.98% 11.36% 50.00% 5.28% 11.23%
31 25 1 1 - 4 26 4 - 1 - 26 1 4
5.17% 8.74% 6.67% 4.55% 1.55% 8.64% 1.47% 4.76% 8.58% 4.76% 1.45%
79 12 - 3 1 62 12 63 - 3 1 12 3 64
13.17% 4.20% 13.64% 6.67% 24.03% 3.99% 23.08% 14.29% 33.33% 3.96% 14.29% 23.19%
72 58 2 3 - 9 60 9 1 2 - 61 2 9
12.00% 20.28% 13.33% 13.64% 3.49% 19.93% 3.30% 50.00% 9.52% 20.13% 9.52% 3.26%
39 22 - 2 1 14 22 15 - 2 - 22 2 15
6.50% 7.69% 9.09% 6.67% 5.43% 7.31% 5.49% 9.52% 7.26% 9.52% 5.43%
15 8 - - - 5 8 5 - 2 - 8 2 5
2.50% 2.80% 1.94% 2.66% 1.83% 9.52% 2.64% 9.52% 1.81%
EDUCATION
GUNS
FOREIGN TRADE
CLIMATE CHANGE
IMMIGRATION
IMPEACHMENT OR
INVESTIGATING GOVERNMENT
SOMETHING ELSE
BIDEN BALLOT Q7A
----------------------------------------------------------------------------
UNDECIDED Q7B
--------------------------------
SUMMARY Q7
--------------------------------
Total
Total Answering
JOBS AND THE ECONOMY
HEALTH CARE
STOPPING CORONAVIRUS
NATIONAL SECURITY
Restoration PAC, Pennsylvania Statewide - May 2020 Banner 7 Page 196 of 290

14a. In politics today, do you generally consider yourself .... a republican, a democrat, an independent or something else?
Total
---------
Def TRUMP
---------
Prob
TRUMP
---------
UNDEC
---------
Prob BIDEN
---------
Def BIDEN
---------
TOT
TRUMP
---------
TOT BIDEN
---------
Lean
TRUMP
---------
Hard
UNDEC
---------
Lean
BIDEN
---------
All TRUMP
---------
All UNDEC
---------
All BIDEN
---------
600 286 15 22 15 258 301 273 2 21 3 303 21 276
100.00% 100.00% 100.00% 100.00% 100.00% 100.00% 100.00% 100.00% 100.00% 100.00% 100.00% 100.00% 100.00% 100.00%
600 286 15 22 15 258 301 273 2 21 3 303 21 276
100.00% 100.00% 100.00% 100.00% 100.00% 100.00% 100.00% 100.00% 100.00% 100.00% 100.00% 100.00% 100.00% 100.00%
225 206 7 5 2 5 213 7 1 4 - 214 4 7
37.50% 72.03% 46.67% 22.73% 13.33% 1.94% 70.76% 2.56% 50.00% 19.05% 70.63% 19.05% 2.54%
34 22 3 - 1 8 25 9 - - - 25 - 9
5.67% 7.69% 20.00% 6.67% 3.10% 8.31% 3.30% 8.25% 3.26%
119 42 5 10 5 56 47 61 1 9 1 48 9 62
19.83% 14.69% 33.33% 45.45% 33.33% 21.71% 15.61% 22.34% 50.00% 42.86% 33.33% 15.84% 42.86% 22.46%
36 9 - 5 2 19 9 21 - 4 2 9 4 23
6.00% 3.15% 22.73% 13.33% 7.36% 2.99% 7.69% 19.05% 66.67% 2.97% 19.05% 8.33%
184 7 - 2 5 169 7 174 - 3 - 7 3 174
30.67% 2.45% 9.09% 33.33% 65.50% 2.33% 63.74% 14.29% 2.31% 14.29% 63.04%
2 - - - - 1 - 1 - 1 - - 1 1
0.33% 0.39% 0.37% 4.76% 4.76% 0.36%
259 228 10 5 3 13 238 16 1 4 - 239 4 16
43.17% 79.72% 66.67% 22.73% 20.00% 5.04% 79.07% 5.86% 50.00% 19.05% 78.88% 19.05% 5.80%
220 16 - 7 7 188 16 195 - 7 2 16 7 197
36.67% 5.59% 31.82% 46.67% 72.87% 5.32% 71.43% 33.33% 66.67% 5.28% 33.33% 71.38%
119 42 5 10 5 56 47 61 1 9 1 48 9 62
19.83% 14.69% 33.33% 45.45% 33.33% 21.71% 15.61% 22.34% 50.00% 42.86% 33.33% 15.84% 42.86% 22.46%
Total Republican
Total Democrat
Independent
SUMMARY Q7
--------------------------------
Total
Total Answering
Strong REPUBLICAN
Not so Strong Republican
AN INDEPENDENT, OR
SOMETHING ELSE
Not so Strong DEMOCRAT
Strong DEMOCRAT
Refused
BIDEN BALLOT Q7A
----------------------------------------------------------------------------
UNDECIDED Q7B
--------------------------------
Restoration PAC, Pennsylvania Statewide - May 2020 Banner 7 Page 197 of 290

14b. Do you think of yourself closer to the Republican Party or Democratic Party?
Total
---------
Def TRUMP
---------
Prob
TRUMP
---------
UNDEC
---------
Prob BIDEN
---------
Def BIDEN
---------
TOT
TRUMP
---------
TOT BIDEN
---------
Lean
TRUMP
---------
Hard
UNDEC
---------
Lean
BIDEN
---------
All TRUMP
---------
All UNDEC
---------
All BIDEN
---------
600 286 15 22 15 258 301 273 2 21 3 303 21 276
100.00% 100.00% 100.00% 100.00% 100.00% 100.00% 100.00% 100.00% 100.00% 100.00% 100.00% 100.00% 100.00% 100.00%
121 42 5 10 5 57 47 62 1 10 1 48 10 63
20.17% 14.69% 33.33% 45.45% 33.33% 22.09% 15.61% 22.71% 50.00% 47.62% 33.33% 15.84% 47.62% 22.83%
35 25 2 2 1 5 27 6 1 1 - 28 1 6
5.83% 8.74% 13.33% 9.09% 6.67% 1.94% 8.97% 2.20% 50.00% 4.76% 9.24% 4.76% 2.17%
58 16 2 8 3 28 18 31 - 8 1 18 8 32
9.67% 5.59% 13.33% 36.36% 20.00% 10.85% 5.98% 11.36% 38.10% 33.33% 5.94% 38.10% 11.59%
28 1 1 - 1 24 2 25 - 1 - 2 1 25
4.67% 0.35% 6.67% 6.67% 9.30% 0.66% 9.16% 4.76% 0.66% 4.76% 9.06%
FIRM INDEPENDENT
LEAN DEMOCRAT
BIDEN BALLOT Q7A
----------------------------------------------------------------------------
UNDECIDED Q7B
--------------------------------
SUMMARY Q7
--------------------------------
Total
Total Answering
LEAN REPUBLICAN
Restoration PAC, Pennsylvania Statewide - May 2020 Banner 7 Page 198 of 290

14. Party Summary
Total
---------
Def TRUMP
---------
Prob
TRUMP
---------
UNDEC
---------
Prob BIDEN
---------
Def BIDEN
---------
TOT
TRUMP
---------
TOT BIDEN
---------
Lean
TRUMP
---------
Hard
UNDEC
---------
Lean
BIDEN
---------
All TRUMP
---------
All UNDEC
---------
All BIDEN
---------
600 286 15 22 15 258 301 273 2 21 3 303 21 276
100.00% 100.00% 100.00% 100.00% 100.00% 100.00% 100.00% 100.00% 100.00% 100.00% 100.00% 100.00% 100.00% 100.00%
600 286 15 22 15 258 301 273 2 21 3 303 21 276
100.00% 100.00% 100.00% 100.00% 100.00% 100.00% 100.00% 100.00% 100.00% 100.00% 100.00% 100.00% 100.00% 100.00%
294 253 12 7 4 18 265 22 2 5 - 267 5 22
49.00% 88.46% 80.00% 31.82% 26.67% 6.98% 88.04% 8.06% 100.00% 23.81% 88.12% 23.81% 7.97%
58 16 2 8 3 28 18 31 - 8 1 18 8 32
9.67% 5.59% 13.33% 36.36% 20.00% 10.85% 5.98% 11.36% 38.10% 33.33% 5.94% 38.10% 11.59%
248 17 1 7 8 212 18 220 - 8 2 18 8 222
41.33% 5.94% 6.67% 31.82% 53.33% 82.17% 5.98% 80.59% 38.10% 66.67% 5.94% 38.10% 80.43%
ALL DEMOCRAT
BIDEN BALLOT Q7A
----------------------------------------------------------------------------
UNDECIDED Q7B
--------------------------------
SUMMARY Q7
--------------------------------
Total
Total Answering
ALL REPUBLICAN
ALL INDEPENDENT
Restoration PAC, Pennsylvania Statewide - May 2020 Banner 7 Page 199 of 290

BALLOT. If a mail-in ballot was mailed to you, how likely would you be to vote by mail this fall, as opposed to voting in-person at your polling place?
Total
---------
Def TRUMP
---------
Prob
TRUMP
---------
UNDEC
---------
Prob BIDEN
---------
Def BIDEN
---------
TOT
TRUMP
---------
TOT BIDEN
---------
Lean
TRUMP
---------
Hard
UNDEC
---------
Lean
BIDEN
---------
All TRUMP
---------
All UNDEC
---------
All BIDEN
---------
600 286 15 22 15 258 301 273 2 21 3 303 21 276
100.00% 100.00% 100.00% 100.00% 100.00% 100.00% 100.00% 100.00% 100.00% 100.00% 100.00% 100.00% 100.00% 100.00%
600 286 15 22 15 258 301 273 2 21 3 303 21 276
100.00% 100.00% 100.00% 100.00% 100.00% 100.00% 100.00% 100.00% 100.00% 100.00% 100.00% 100.00% 100.00% 100.00%
84 32 4 6 2 39 36 41 - 5 2 36 5 43
14.00% 11.19% 26.67% 27.27% 13.33% 15.12% 11.96% 15.02% 23.81% 66.67% 11.88% 23.81% 15.58%
247 42 4 9 9 182 46 191 1 8 1 47 8 192
41.17% 14.69% 26.67% 40.91% 60.00% 70.54% 15.28% 69.96% 50.00% 38.10% 33.33% 15.51% 38.10% 69.57%
269 212 7 7 4 37 219 41 1 8 - 220 8 41
44.83% 74.13% 46.67% 31.82% 26.67% 14.34% 72.76% 15.02% 50.00% 38.10% 72.61% 38.10% 14.86%
BIDEN BALLOT Q7A
----------------------------------------------------------------------------
UNDECIDED Q7B
--------------------------------
SUMMARY Q7
--------------------------------
Total
Total Answering
Somewhat likely to vote by mail
Very likely to vote by mail
Not likely/Would still vote at
polling place
Restoration PAC, Pennsylvania Statewide - May 2020 Banner 7 Page 200 of 290

15. What was the last grade you completed in school?
Total
---------
Def TRUMP
---------
Prob
TRUMP
---------
UNDEC
---------
Prob BIDEN
---------
Def BIDEN
---------
TOT
TRUMP
---------
TOT BIDEN
---------
Lean
TRUMP
---------
Hard
UNDEC
---------
Lean
BIDEN
---------
All TRUMP
---------
All UNDEC
---------
All BIDEN
---------
600 286 15 22 15 258 301 273 2 21 3 303 21 276
100.00% 100.00% 100.00% 100.00% 100.00% 100.00% 100.00% 100.00% 100.00% 100.00% 100.00% 100.00% 100.00% 100.00%
600 286 15 22 15 258 301 273 2 21 3 303 21 276
100.00% 100.00% 100.00% 100.00% 100.00% 100.00% 100.00% 100.00% 100.00% 100.00% 100.00% 100.00% 100.00% 100.00%
3 1 - - - 2 1 2 - - - 1 - 2
0.50% 0.35% 0.78% 0.33% 0.73% 0.33% 0.72%
153 86 4 6 7 48 90 55 1 6 1 91 6 56
25.50% 30.07% 26.67% 27.27% 46.67% 18.60% 29.90% 20.15% 50.00% 28.57% 33.33% 30.03% 28.57% 20.29%
30 17 1 - - 12 18 12 - - - 18 - 12
5.00% 5.94% 6.67% 4.65% 5.98% 4.40% 5.94% 4.35%
282 143 9 10 6 113 152 119 - 10 1 152 10 120
47.00% 50.00% 60.00% 45.45% 40.00% 43.80% 50.50% 43.59% 47.62% 33.33% 50.17% 47.62% 43.48%
130 39 1 6 2 81 40 83 1 5 1 41 5 84
21.67% 13.64% 6.67% 27.27% 13.33% 31.40% 13.29% 30.40% 50.00% 23.81% 33.33% 13.53% 23.81% 30.43%
2 - - - - 2 - 2 - - - - - 2
0.33% 0.78% 0.73% 0.72%
156 87 4 6 7 50 91 57 1 6 1 92 6 58
26.00% 30.42% 26.67% 27.27% 46.67% 19.38% 30.23% 20.88% 50.00% 28.57% 33.33% 30.36% 28.57% 21.01%
312 160 10 10 6 125 170 131 - 10 1 170 10 132
52.00% 55.94% 66.67% 45.45% 40.00% 48.45% 56.48% 47.99% 47.62% 33.33% 56.11% 47.62% 47.83%
130 39 1 6 2 81 40 83 1 5 1 41 5 84
21.67% 13.64% 6.67% 27.27% 13.33% 31.40% 13.29% 30.40% 50.00% 23.81% 33.33% 13.53% 23.81% 30.43%
GRADUATE SCHOOL
REFUSED
High School
College
College+
BIDEN BALLOT Q7A
----------------------------------------------------------------------------
UNDECIDED Q7B
--------------------------------
SUMMARY Q7
--------------------------------
Total
Total Answering
GRADE SCHOOL [1-8]
HIGH SCHOOL [9-12]
TECHNICAL/VOCATIONAL
SCHOOL
COLLEGE
Restoration PAC, Pennsylvania Statewide - May 2020 Banner 7 Page 201 of 290

16. Thinking about where you live, do you consider it to be urban, suburban or rural?
Total
---------
Def TRUMP
---------
Prob
TRUMP
---------
UNDEC
---------
Prob BIDEN
---------
Def BIDEN
---------
TOT
TRUMP
---------
TOT BIDEN
---------
Lean
TRUMP
---------
Hard
UNDEC
---------
Lean
BIDEN
---------
All TRUMP
---------
All UNDEC
---------
All BIDEN
---------
600 286 15 22 15 258 301 273 2 21 3 303 21 276
100.00% 100.00% 100.00% 100.00% 100.00% 100.00% 100.00% 100.00% 100.00% 100.00% 100.00% 100.00% 100.00% 100.00%
600 286 15 22 15 258 301 273 2 21 3 303 21 276
100.00% 100.00% 100.00% 100.00% 100.00% 100.00% 100.00% 100.00% 100.00% 100.00% 100.00% 100.00% 100.00% 100.00%
103 42 2 3 1 55 44 56 - 2 1 44 2 57
17.17% 14.69% 13.33% 13.64% 6.67% 21.32% 14.62% 20.51% 9.52% 33.33% 14.52% 9.52% 20.65%
299 132 10 13 9 133 142 142 2 12 1 144 12 143
49.83% 46.15% 66.67% 59.09% 60.00% 51.55% 47.18% 52.01% 100.00% 57.14% 33.33% 47.52% 57.14% 51.81%
196 110 3 6 5 70 113 75 - 7 1 113 7 76
32.67% 38.46% 20.00% 27.27% 33.33% 27.13% 37.54% 27.47% 33.33% 33.33% 37.29% 33.33% 27.54%
2 2 - - - - 2 - - - - 2 - -
0.33% 0.70% 0.66% 0.66%
Total Answering
URBAN
SUBURBAN
RURAL
DON'T KNOW
BIDEN BALLOT Q7A
----------------------------------------------------------------------------
UNDECIDED Q7B
--------------------------------
SUMMARY Q7
--------------------------------
Total
Restoration PAC, Pennsylvania Statewide - May 2020 Banner 7 Page 202 of 290

17. Gender
Total
---------
Def TRUMP
---------
Prob
TRUMP
---------
UNDEC
---------
Prob BIDEN
---------
Def BIDEN
---------
TOT
TRUMP
---------
TOT BIDEN
---------
Lean
TRUMP
---------
Hard
UNDEC
---------
Lean
BIDEN
---------
All TRUMP
---------
All UNDEC
---------
All BIDEN
---------
600 286 15 22 15 258 301 273 2 21 3 303 21 276
100.00% 100.00% 100.00% 100.00% 100.00% 100.00% 100.00% 100.00% 100.00% 100.00% 100.00% 100.00% 100.00% 100.00%
600 286 15 22 15 258 301 273 2 21 3 303 21 276
100.00% 100.00% 100.00% 100.00% 100.00% 100.00% 100.00% 100.00% 100.00% 100.00% 100.00% 100.00% 100.00% 100.00%
286 151 13 13 7 100 164 107 1 12 2 165 12 109
47.67% 52.80% 86.67% 59.09% 46.67% 38.76% 54.49% 39.19% 50.00% 57.14% 66.67% 54.46% 57.14% 39.49%
314 135 2 9 8 158 137 166 1 9 1 138 9 167
52.33% 47.20% 13.33% 40.91% 53.33% 61.24% 45.51% 60.81% 50.00% 42.86% 33.33% 45.54% 42.86% 60.51%
Total Answering
Male
Female
BIDEN BALLOT Q7A
----------------------------------------------------------------------------
UNDECIDED Q7B
--------------------------------
SUMMARY Q7
--------------------------------
Total
Restoration PAC, Pennsylvania Statewide - May 2020 Banner 7 Page 203 of 290

Table of contents
Banner 8
Table market
Table q1
Table q2
Table q3
Table q4
Table q5
Table q6
Table q7a
Table q7b
Table q7Summ
Table q8
Table corona_1
Table corona_2
Table corona_3
Table q10
Table q11a
Table q11b
Table q11_Summ
Table age
Table q13
Table q14a
Table q14b
Table q14_SUMM
Table ballot
14a. In politics today, do you generally consider yourself .... a republican, a democrat, an independent or something else?
14b. Do you think of yourself closer to the Republican Party or Democratic Party?
14. Party Summary
BALLOT. If a mail-in ballot was mailed to you, how likely would you be to vote by mail this fall, as opposed to voting in-person at your polling place?
11a. If the election for US Congress were being held today, for whom would you vote.... the Republican candidate or the Democrat candidate?
11b. Would you say you are leaning toward the Republican candidate or leaning toward the Democrat candidate?
11. Summary Generic US Congress
12. Age
13. Which two of the following issues do you believe are the most important issues facing the country? [Select up to 2]
CORONAVIRUS 1. With over 60,000 Americans dead from the pandemic, how worried are you that you, or someone close to you, will be infected with coronavirus?
CORONAVIRUS 2. Which statement do you agree with, or agree with more: "It's time for people to get back to work." or "It's too early to lift stay-at-home restrictions."
CORONAVIRUS 3. Which statement do you agree with, or agree with more: "We should re-open the economy, even if that means more people will get coronavirus." or "We should
continue the shelter-in-place restrictions, even if that means severe job losses and economic disruption."
10. Do you think it was fair or unfair that Democrat President Obama's administration investigated and surveilled Republican Donald Trump as both a presidential candidate and president-
elect for allegedly colluding with Russia?
Media Market
1. Thinking ahead to the November election, how likely would you say you are to vote in these elections? Would you say you are…
2. Do you think the country is going in the right direction, or have things pretty seriously gone off on the wrong track?
3. Do you think the economy is going in the right direction, or have things pretty seriously gone off on the wrong track?
4. Do you approve or disapprove of the job Donald Trump is doing as President? Would that be strongly or somewhat (approve or disapprove)?
5. Do you think the impeachment of President Trump was good for the country, bad for the country, or did the impeachment not really matter that much?
6. Do you have a favorable or unfavorable impression of Donald Trump?
7a. If the election for President were being held today, and the candidates were Donald Trump and Joe Biden, for whom would you vote?
7b. Would you say you are leaning toward Donald Trump or leaning toward Joe Biden?
7. Biden Ballot Summary
8. Do you approve or disapprove of the way President Trump is handling the Coronavirus crisis?
Restoration PAC, Pennsylvania Statewide - May 2020 Banner 8 Page 204 of 290

Table q15
Table q16
Table q17
15. What was the last grade you completed in school?
16. Thinking about where you live, do you consider it to be urban, suburban or rural?
17. Gender
Restoration PAC, Pennsylvania Statewide - May 2020 Banner 8 Page 205 of 290

Media Market
Total
-----
Str
GOP
-----
NotStr
GOP
-----
INDEP
-----
NotStr
DEM
-----
Str
DEM
-----
Tot
GOP
-----
INDEP
-----
Tot
DEM
-----
Lean
GOP
-----
Firm
INDEP
-----
Lean
DEM
-----
All
REP
-----
All
INDEP
-----
All
DEM
-----
600 225 34 119 36 184 259 119 220 35 58 28 294 58 248
100.00% 100.00% 100.00% 100.00% 100.00% 100.00% 100.00% 100.00% 100.00% 100.00% 100.00% 100.00% 100.00% 100.00% 100.00%
600 225 34 119 36 184 259 119 220 35 58 28 294 58 248
100.00% 100.00% 100.00% 100.00% 100.00% 100.00% 100.00% 100.00% 100.00% 100.00% 100.00% 100.00% 100.00% 100.00% 100.00%
3 - 1 2 - - 1 2 - 1 1 - 2 1 -
0.50% 2.94% 1.68% 0.39% 1.68% 2.86% 1.72% 0.68% 1.72%
248 80 13 46 19 89 93 46 108 13 24 10 106 24 118
41.33% 35.56% 38.24% 38.66% 52.78% 48.37% 35.91% 38.66% 49.09% 37.14% 41.38% 35.71% 36.05% 41.38% 47.58%
132 49 5 22 7 48 54 22 55 5 13 5 59 13 60
22.00% 21.78% 14.71% 18.49% 19.44% 26.09% 20.85% 18.49% 25.00% 14.29% 22.41% 17.86% 20.07% 22.41% 24.19%
1 - - 1 - - - 1 - 1 - - 1 - -
0.17% 0.84% 0.84% 2.86% 0.34%
2 - - 2 - - - 2 - 1 - 1 1 - 1
0.33% 1.68% 1.68% 2.86% 3.57% 0.34% 0.40%
19 7 2 3 2 5 9 3 7 2 - 1 11 - 8
3.17% 3.11% 5.88% 2.52% 5.56% 2.72% 3.47% 2.52% 3.18% 5.71% 3.57% 3.74% 3.23%
5 3 - 1 - 1 3 1 1 - 1 - 3 1 1
0.83% 1.33% 0.84% 0.54% 1.16% 0.84% 0.45% 1.72% 1.02% 1.72% 0.40%
2 1 - - - 1 1 - 1 - - - 1 - 1
0.33% 0.44% 0.54% 0.39% 0.45% 0.34% 0.40%
89 40 10 20 2 17 50 20 19 7 7 6 57 7 25
14.83% 17.78% 29.41% 16.81% 5.56% 9.24% 19.31% 16.81% 8.64% 20.00% 12.07% 21.43% 19.39% 12.07% 10.08%
33 18 - 8 - 7 18 8 7 3 5 - 21 5 7
5.50% 8.00% 6.72% 3.80% 6.95% 6.72% 3.18% 8.57% 8.62% 7.14% 8.62% 2.82%
66 27 3 14 6 16 30 14 22 2 7 5 32 7 27
11.00% 12.00% 8.82% 11.76% 16.67% 8.70% 11.58% 11.76% 10.00% 5.71% 12.07% 17.86% 10.88% 12.07% 10.89%
514 - BUFFALO
516 - ERIE
536 - YOUNGSTOWN
565 - ELMIRA (CORNING)
566 - HARRISBURG-LNCSTR-
LEB-YORK
574 - JOHNSTOWN-ALTOONA-
ST COLGE
577 - WILKES BARRE-
SCRANTON-HZTN
PARTY Q14A
-------------------------------------------------------
INDEPENDENTS Q14B
--------------------
SUMMARY Q14
--------------------
Total
Total Answering
501 - NEW YORK
504 - PHILADELPHIA
508 - PITTSBURGH
511 - WASHINGTON, DC
(HAGRSTWN)
Restoration PAC, Pennsylvania Statewide - May 2020 Banner 8 Page 206 of 290

1. Thinking ahead to the November election, how likely would you say you are to vote in these elections? Would you say you are…
Total
-----
Str
GOP
-----
NotStr
GOP
-----
INDEP
-----
NotStr
DEM
-----
Str
DEM
-----
Tot
GOP
-----
INDEP
-----
Tot
DEM
-----
Lean
GOP
-----
Firm
INDEP
-----
Lean
DEM
-----
All
REP
-----
All
INDEP
-----
All
DEM
-----
600 225 34 119 36 184 259 119 220 35 58 28 294 58 248
100.00% 100.00% 100.00% 100.00% 100.00% 100.00% 100.00% 100.00% 100.00% 100.00% 100.00% 100.00% 100.00% 100.00% 100.00%
600 225 34 119 36 184 259 119 220 35 58 28 294 58 248
100.00% 100.00% 100.00% 100.00% 100.00% 100.00% 100.00% 100.00% 100.00% 100.00% 100.00% 100.00% 100.00% 100.00% 100.00%
579 222 32 116 33 174 254 116 207 34 56 28 288 56 235
96.50% 98.67% 94.12% 97.48% 91.67% 94.57% 98.07% 97.48% 94.09% 97.14% 96.55% 100.00% 97.96% 96.55% 94.76%
21 3 2 3 3 10 5 3 13 1 2 - 6 2 13
3.50% 1.33% 5.88% 2.52% 8.33% 5.43% 1.93% 2.52% 5.91% 2.86% 3.45% 2.04% 3.45% 5.24%
SUMMARY Q14
--------------------
Total
Total Answering
VERY LIKELY
SOMEWHAT LIKELY
PARTY Q14A
-------------------------------------------------------
INDEPENDENTS Q14B
--------------------
Restoration PAC, Pennsylvania Statewide - May 2020 Banner 8 Page 207 of 290

2. Do you think the country is going in the right direction, or have things pretty seriously gone off on the wrong track?
Total
-----
Str
GOP
-----
NotStr
GOP
-----
INDEP
-----
NotStr
DEM
-----
Str
DEM
-----
Tot
GOP
-----
INDEP
-----
Tot
DEM
-----
Lean
GOP
-----
Firm
INDEP
-----
Lean
DEM
-----
All
REP
-----
All
INDEP
-----
All
DEM
-----
600 225 34 119 36 184 259 119 220 35 58 28 294 58 248
100.00% 100.00% 100.00% 100.00% 100.00% 100.00% 100.00% 100.00% 100.00% 100.00% 100.00% 100.00% 100.00% 100.00% 100.00%
600 225 34 119 36 184 259 119 220 35 58 28 294 58 248
100.00% 100.00% 100.00% 100.00% 100.00% 100.00% 100.00% 100.00% 100.00% 100.00% 100.00% 100.00% 100.00% 100.00% 100.00%
230 156 17 39 6 11 173 39 17 20 15 5 193 15 22
38.33% 69.33% 50.00% 32.77% 16.67% 5.98% 66.80% 32.77% 7.73% 57.14% 25.86% 17.86% 65.65% 25.86% 8.87%
339 52 16 72 28 170 68 72 198 11 39 23 79 39 221
56.50% 23.11% 47.06% 60.50% 77.78% 92.39% 26.25% 60.50% 90.00% 31.43% 67.24% 82.14% 26.87% 67.24% 89.11%
27 14 1 7 2 3 15 7 5 3 4 - 18 4 5
4.50% 6.22% 2.94% 5.88% 5.56% 1.63% 5.79% 5.88% 2.27% 8.57% 6.90% 6.12% 6.90% 2.02%
4 3 - 1 - - 3 1 - 1 - - 4 - -
0.67% 1.33% 0.84% 1.16% 0.84% 2.86% 1.36%
Total Answering
RIGHT DIRECTION
WRONG TRACK
DON’T KNOW
REFUSED
PARTY Q14A
-------------------------------------------------------
INDEPENDENTS Q14B
--------------------
SUMMARY Q14
--------------------
Total
Restoration PAC, Pennsylvania Statewide - May 2020 Banner 8 Page 208 of 290

3. Do you think the economy is going in the right direction, or have things pretty seriously gone off on the wrong track?
Total
-----
Str
GOP
-----
NotStr
GOP
-----
INDEP
-----
NotStr
DEM
-----
Str
DEM
-----
Tot
GOP
-----
INDEP
-----
Tot
DEM
-----
Lean
GOP
-----
Firm
INDEP
-----
Lean
DEM
-----
All
REP
-----
All
INDEP
-----
All
DEM
-----
600 225 34 119 36 184 259 119 220 35 58 28 294 58 248
100.00% 100.00% 100.00% 100.00% 100.00% 100.00% 100.00% 100.00% 100.00% 100.00% 100.00% 100.00% 100.00% 100.00% 100.00%
600 225 34 119 36 184 259 119 220 35 58 28 294 58 248
100.00% 100.00% 100.00% 100.00% 100.00% 100.00% 100.00% 100.00% 100.00% 100.00% 100.00% 100.00% 100.00% 100.00% 100.00%
202 135 16 36 4 11 151 36 15 15 14 7 166 14 22
33.67% 60.00% 47.06% 30.25% 11.11% 5.98% 58.30% 30.25% 6.82% 42.86% 24.14% 25.00% 56.46% 24.14% 8.87%
362 77 17 74 31 162 94 74 193 17 39 19 111 39 212
60.33% 34.22% 50.00% 62.18% 86.11% 88.04% 36.29% 62.18% 87.73% 48.57% 67.24% 67.86% 37.76% 67.24% 85.48%
32 11 1 8 1 10 12 8 11 2 5 2 14 5 13
5.33% 4.89% 2.94% 6.72% 2.78% 5.43% 4.63% 6.72% 5.00% 5.71% 8.62% 7.14% 4.76% 8.62% 5.24%
4 2 - 1 - 1 2 1 1 1 - - 3 - 1
0.67% 0.89% 0.84% 0.54% 0.77% 0.84% 0.45% 2.86% 1.02% 0.40%
Total Answering
RIGHT DIRECTION
WRONG TRACK
DON’T KNOW
REFUSED
PARTY Q14A
-------------------------------------------------------
INDEPENDENTS Q14B
--------------------
SUMMARY Q14
--------------------
Total
Restoration PAC, Pennsylvania Statewide - May 2020 Banner 8 Page 209 of 290

4. Do you approve or disapprove of the job Donald Trump is doing as President? Would that be strongly or somewhat (approve or disapprove)?
Total
-----
Str
GOP
-----
NotStr
GOP
-----
INDEP
-----
NotStr
DEM
-----
Str
DEM
-----
Tot
GOP
-----
INDEP
-----
Tot
DEM
-----
Lean
GOP
-----
Firm
INDEP
-----
Lean
DEM
-----
All
REP
-----
All
INDEP
-----
All
DEM
-----
600 225 34 119 36 184 259 119 220 35 58 28 294 58 248
100.00% 100.00% 100.00% 100.00% 100.00% 100.00% 100.00% 100.00% 100.00% 100.00% 100.00% 100.00% 100.00% 100.00% 100.00%
600 225 34 119 36 184 259 119 220 35 58 28 294 58 248
100.00% 100.00% 100.00% 100.00% 100.00% 100.00% 100.00% 100.00% 100.00% 100.00% 100.00% 100.00% 100.00% 100.00% 100.00%
268 192 17 40 7 12 209 40 19 23 16 1 232 16 20
44.67% 85.33% 50.00% 33.61% 19.44% 6.52% 80.69% 33.61% 8.64% 65.71% 27.59% 3.57% 78.91% 27.59% 8.06%
46 22 8 8 6 2 30 8 8 4 3 1 34 3 9
7.67% 9.78% 23.53% 6.72% 16.67% 1.09% 11.58% 6.72% 3.64% 11.43% 5.17% 3.57% 11.56% 5.17% 3.63%
18 1 2 12 - 3 3 12 3 4 2 6 7 2 9
3.00% 0.44% 5.88% 10.08% 1.63% 1.16% 10.08% 1.36% 11.43% 3.45% 21.43% 2.38% 3.45% 3.63%
256 9 7 55 21 163 16 55 184 3 33 20 19 33 204
42.67% 4.00% 20.59% 46.22% 58.33% 88.59% 6.18% 46.22% 83.64% 8.57% 56.90% 71.43% 6.46% 56.90% 82.26%
12 1 - 4 2 4 1 4 6 1 4 - 2 4 6
2.00% 0.44% 3.36% 5.56% 2.17% 0.39% 3.36% 2.73% 2.86% 6.90% 0.68% 6.90% 2.42%
314 214 25 48 13 14 239 48 27 27 19 2 266 19 29
52.33% 95.11% 73.53% 40.34% 36.11% 7.61% 92.28% 40.34% 12.27% 77.14% 32.76% 7.14% 90.48% 32.76% 11.69%
274 10 9 67 21 166 19 67 187 7 35 26 26 35 213
45.67% 4.44% 26.47% 56.30% 58.33% 90.22% 7.34% 56.30% 85.00% 20.00% 60.34% 92.86% 8.84% 60.34% 85.89%
Total Answering
STRONGLY APPROVE
SOMEWHAT APPROVE
SOMEWHAT DISAPPROVE
STRONGLY DISAPPROVE
DON’T KNOW/NO ANSWER
Total Approve
Total Disapprove
PARTY Q14A
-------------------------------------------------------
INDEPENDENTS Q14B
--------------------
SUMMARY Q14
--------------------
Total
Restoration PAC, Pennsylvania Statewide - May 2020 Banner 8 Page 210 of 290

5. Do you think the impeachment of President Trump was good for the country, bad for the country, or did the impeachment not really matter that much?
Total
-----
Str
GOP
-----
NotStr
GOP
-----
INDEP
-----
NotStr
DEM
-----
Str
DEM
-----
Tot
GOP
-----
INDEP
-----
Tot
DEM
-----
Lean
GOP
-----
Firm
INDEP
-----
Lean
DEM
-----
All
REP
-----
All
INDEP
-----
All
DEM
-----
600 225 34 119 36 184 259 119 220 35 58 28 294 58 248
100.00% 100.00% 100.00% 100.00% 100.00% 100.00% 100.00% 100.00% 100.00% 100.00% 100.00% 100.00% 100.00% 100.00% 100.00%
600 225 34 119 36 184 259 119 220 35 58 28 294 58 248
100.00% 100.00% 100.00% 100.00% 100.00% 100.00% 100.00% 100.00% 100.00% 100.00% 100.00% 100.00% 100.00% 100.00% 100.00%
107 14 5 20 7 61 19 20 68 2 8 10 21 8 78
17.83% 6.22% 14.71% 16.81% 19.44% 33.15% 7.34% 16.81% 30.91% 5.71% 13.79% 35.71% 7.14% 13.79% 31.45%
289 179 24 48 13 23 203 48 36 22 21 7 225 21 43
48.17% 79.56% 70.59% 40.34% 36.11% 12.50% 78.38% 40.34% 16.36% 62.86% 36.21% 25.00% 76.53% 36.21% 17.34%
204 32 5 51 16 100 37 51 116 11 29 11 48 29 127
34.00% 14.22% 14.71% 42.86% 44.44% 54.35% 14.29% 42.86% 52.73% 31.43% 50.00% 39.29% 16.33% 50.00% 51.21%
INDEPENDENTS Q14B
--------------------
SUMMARY Q14
--------------------
Total
Total Answering
GOOD
BAD
DOESN'T MATTER/DON'T KNOW
PARTY Q14A
-------------------------------------------------------
Restoration PAC, Pennsylvania Statewide - May 2020 Banner 8 Page 211 of 290

6. Do you have a favorable or unfavorable impression of Donald Trump?
Total
-----
Str
GOP
-----
NotStr
GOP
-----
INDEP
-----
NotStr
DEM
-----
Str
DEM
-----
Tot
GOP
-----
INDEP
-----
Tot
DEM
-----
Lean
GOP
-----
Firm
INDEP
-----
Lean
DEM
-----
All
REP
-----
All
INDEP
-----
All
DEM
-----
600 225 34 119 36 184 259 119 220 35 58 28 294 58 248
100.00% 100.00% 100.00% 100.00% 100.00% 100.00% 100.00% 100.00% 100.00% 100.00% 100.00% 100.00% 100.00% 100.00% 100.00%
600 225 34 119 36 184 259 119 220 35 58 28 294 58 248
100.00% 100.00% 100.00% 100.00% 100.00% 100.00% 100.00% 100.00% 100.00% 100.00% 100.00% 100.00% 100.00% 100.00% 100.00%
243 181 14 35 5 8 195 35 13 20 14 1 215 14 14
40.50% 80.44% 41.18% 29.41% 13.89% 4.35% 75.29% 29.41% 5.91% 57.14% 24.14% 3.57% 73.13% 24.14% 5.65%
53 27 10 8 6 2 37 8 8 4 2 2 41 2 10
8.83% 12.00% 29.41% 6.72% 16.67% 1.09% 14.29% 6.72% 3.64% 11.43% 3.45% 7.14% 13.95% 3.45% 4.03%
11 1 1 2 1 6 2 2 7 2 - - 4 - 7
1.83% 0.44% 2.94% 1.68% 2.78% 3.26% 0.77% 1.68% 3.18% 5.71% 1.36% 2.82%
24 4 - 12 - 8 4 12 8 3 9 - 7 9 8
4.00% 1.78% 10.08% 4.35% 1.54% 10.08% 3.64% 8.57% 15.52% 2.38% 15.52% 3.23%
268 12 9 62 24 160 21 62 184 6 32 25 27 32 209
44.67% 5.33% 26.47% 52.10% 66.67% 86.96% 8.11% 52.10% 83.64% 17.14% 55.17% 89.29% 9.18% 55.17% 84.27%
- - - - - - - - - - - - - - -
1 - - - - - - - - - 1 - - 1 -
0.17% 1.72% 1.72%
296 208 24 43 11 10 232 43 21 24 16 3 256 16 24
49.33% 92.44% 70.59% 36.13% 30.56% 5.43% 89.58% 36.13% 9.55% 68.57% 27.59% 10.71% 87.07% 27.59% 9.68%
292 16 9 74 24 168 25 74 192 9 41 25 34 41 217
48.67% 7.11% 26.47% 62.18% 66.67% 91.30% 9.65% 62.18% 87.27% 25.71% 70.69% 89.29% 11.56% 70.69% 87.50%
Total Favorable
Total Unfavorable
Total
Total Answering
Strongly FAVORABLE
Somewhat FAVORABLE
NO OPINION
Somewhat UNFAVORABLE
Strongly UNFAVORABLE
DON’T KNOW/NOT SURE
REFUSED
PARTY Q14A
-------------------------------------------------------
INDEPENDENTS Q14B
--------------------
SUMMARY Q14
--------------------
Restoration PAC, Pennsylvania Statewide - May 2020 Banner 8 Page 212 of 290

7a. If the election for President were being held today, and the candidates were Donald Trump and Joe Biden, for whom would you vote?
Total
-----
Str
GOP
-----
NotStr
GOP
-----
INDEP
-----
NotStr
DEM
-----
Str
DEM
-----
Tot
GOP
-----
INDEP
-----
Tot
DEM
-----
Lean
GOP
-----
Firm
INDEP
-----
Lean
DEM
-----
All
REP
-----
All
INDEP
-----
All
DEM
-----
600 225 34 119 36 184 259 119 220 35 58 28 294 58 248
100.00% 100.00% 100.00% 100.00% 100.00% 100.00% 100.00% 100.00% 100.00% 100.00% 100.00% 100.00% 100.00% 100.00% 100.00%
600 225 34 119 36 184 259 119 220 35 58 28 294 58 248
100.00% 100.00% 100.00% 100.00% 100.00% 100.00% 100.00% 100.00% 100.00% 100.00% 100.00% 100.00% 100.00% 100.00% 100.00%
286 206 22 42 9 7 228 42 16 25 16 1 253 16 17
47.67% 91.56% 64.71% 35.29% 25.00% 3.80% 88.03% 35.29% 7.27% 71.43% 27.59% 3.57% 86.05% 27.59% 6.85%
15 7 3 5 - - 10 5 - 2 2 1 12 2 1
2.50% 3.11% 8.82% 4.20% 3.86% 4.20% 5.71% 3.45% 3.57% 4.08% 3.45% 0.40%
22 5 - 10 5 2 5 10 7 2 8 - 7 8 7
3.67% 2.22% 8.40% 13.89% 1.09% 1.93% 8.40% 3.18% 5.71% 13.79% 2.38% 13.79% 2.82%
15 2 1 5 2 5 3 5 7 1 3 1 4 3 8
2.50% 0.89% 2.94% 4.20% 5.56% 2.72% 1.16% 4.20% 3.18% 2.86% 5.17% 3.57% 1.36% 5.17% 3.23%
258 5 8 56 19 169 13 56 188 5 28 24 18 28 212
43.00% 2.22% 23.53% 47.06% 52.78% 91.85% 5.02% 47.06% 85.45% 14.29% 48.28% 85.71% 6.12% 48.28% 85.48%
4 - - 1 1 1 - 1 2 - 1 1 - 1 3
0.67% 0.84% 2.78% 0.54% 0.84% 0.91% 1.72% 3.57% 1.72% 1.21%
301 213 25 47 9 7 238 47 16 27 18 2 265 18 18
50.17% 94.67% 73.53% 39.50% 25.00% 3.80% 91.89% 39.50% 7.27% 77.14% 31.03% 7.14% 90.14% 31.03% 7.26%
22 5 - 10 5 2 5 10 7 2 8 - 7 8 7
3.67% 2.22% 8.40% 13.89% 1.09% 1.93% 8.40% 3.18% 5.71% 13.79% 2.38% 13.79% 2.82%
273 7 9 61 21 174 16 61 195 6 31 25 22 31 220
45.50% 3.11% 26.47% 51.26% 58.33% 94.57% 6.18% 51.26% 88.64% 17.14% 53.45% 89.29% 7.48% 53.45% 88.71%
UNDECIDED
Probably BIDEN
Definitely BIDEN
Refused
Total Trump
Total Undecided
Total Biden
PARTY Q14A
-------------------------------------------------------
INDEPENDENTS Q14B
--------------------
SUMMARY Q14
--------------------
Total
Total Answering
Definitely TRUMP
Probably TRUMP
Restoration PAC, Pennsylvania Statewide - May 2020 Banner 8 Page 213 of 290

7b. Would you say you are leaning toward Donald Trump or leaning toward Joe Biden?
Total
-----
Str
GOP
-----
NotStr
GOP
-----
INDEP
-----
NotStr
DEM
-----
Str
DEM
-----
Tot
GOP
-----
INDEP
-----
Tot
DEM
-----
Lean
GOP
-----
Firm
INDEP
-----
Lean
DEM
-----
All
REP
-----
All
INDEP
-----
All
DEM
-----
600 225 34 119 36 184 259 119 220 35 58 28 294 58 248
100.00% 100.00% 100.00% 100.00% 100.00% 100.00% 100.00% 100.00% 100.00% 100.00% 100.00% 100.00% 100.00% 100.00% 100.00%
26 5 - 11 6 3 5 11 9 2 9 1 7 9 10
4.33% 2.22% 9.24% 16.67% 1.63% 1.93% 9.24% 4.09% 5.71% 15.52% 3.57% 2.38% 15.52% 4.03%
2 1 - 1 - - 1 1 - 1 - - 2 - -
0.33% 0.44% 0.84% 0.39% 0.84% 2.86% 0.68%
21 4 - 9 4 3 4 9 7 1 8 1 5 8 8
3.50% 1.78% 7.56% 11.11% 1.63% 1.54% 7.56% 3.18% 2.86% 13.79% 3.57% 1.70% 13.79% 3.23%
3 - - 1 2 - - 1 2 - 1 - - 1 2
0.50% 0.84% 5.56% 0.84% 0.91% 1.72% 1.72% 0.81%
SUMMARY Q14
--------------------
Total
Total Answering
LEAN TRUMP
HARD UNDECIDED
LEAN BIDEN
PARTY Q14A
-------------------------------------------------------
INDEPENDENTS Q14B
--------------------
Restoration PAC, Pennsylvania Statewide - May 2020 Banner 8 Page 214 of 290

7. Biden Ballot Summary
Total
-----
Str
GOP
-----
NotStr
GOP
-----
INDEP
-----
NotStr
DEM
-----
Str
DEM
-----
Tot
GOP
-----
INDEP
-----
Tot
DEM
-----
Lean
GOP
-----
Firm
INDEP
-----
Lean
DEM
-----
All
REP
-----
All
INDEP
-----
All
DEM
-----
600 225 34 119 36 184 259 119 220 35 58 28 294 58 248
100.00% 100.00% 100.00% 100.00% 100.00% 100.00% 100.00% 100.00% 100.00% 100.00% 100.00% 100.00% 100.00% 100.00% 100.00%
600 225 34 119 36 184 259 119 220 35 58 28 294 58 248
100.00% 100.00% 100.00% 100.00% 100.00% 100.00% 100.00% 100.00% 100.00% 100.00% 100.00% 100.00% 100.00% 100.00% 100.00%
303 214 25 48 9 7 239 48 16 28 18 2 267 18 18
50.50% 95.11% 73.53% 40.34% 25.00% 3.80% 92.28% 40.34% 7.27% 80.00% 31.03% 7.14% 90.82% 31.03% 7.26%
21 4 - 9 4 3 4 9 7 1 8 1 5 8 8
3.50% 1.78% 7.56% 11.11% 1.63% 1.54% 7.56% 3.18% 2.86% 13.79% 3.57% 1.70% 13.79% 3.23%
276 7 9 62 23 174 16 62 197 6 32 25 22 32 222
46.00% 3.11% 26.47% 52.10% 63.89% 94.57% 6.18% 52.10% 89.55% 17.14% 55.17% 89.29% 7.48% 55.17% 89.52%
Total
Total Answering
ALL TRUMP
ALL UNDECIDED
ALL BIDEN
PARTY Q14A
-------------------------------------------------------
INDEPENDENTS Q14B
--------------------
SUMMARY Q14
--------------------
Restoration PAC, Pennsylvania Statewide - May 2020 Banner 8 Page 215 of 290

8. Do you approve or disapprove of the way President Trump is handling the Coronavirus crisis?
Total
-----
Str
GOP
-----
NotStr
GOP
-----
INDEP
-----
NotStr
DEM
-----
Str
DEM
-----
Tot
GOP
-----
INDEP
-----
Tot
DEM
-----
Lean
GOP
-----
Firm
INDEP
-----
Lean
DEM
-----
All
REP
-----
All
INDEP
-----
All
DEM
-----
600 225 34 119 36 184 259 119 220 35 58 28 294 58 248
100.00% 100.00% 100.00% 100.00% 100.00% 100.00% 100.00% 100.00% 100.00% 100.00% 100.00% 100.00% 100.00% 100.00% 100.00%
600 225 34 119 36 184 259 119 220 35 58 28 294 58 248
100.00% 100.00% 100.00% 100.00% 100.00% 100.00% 100.00% 100.00% 100.00% 100.00% 100.00% 100.00% 100.00% 100.00% 100.00%
222 167 12 26 4 12 179 26 16 14 13 - 193 13 16
37.00% 74.22% 35.29% 21.85% 11.11% 6.52% 69.11% 21.85% 7.27% 40.00% 22.41% 65.65% 22.41% 6.45%
89 42 14 21 7 5 56 21 12 12 6 3 68 6 15
14.83% 18.67% 41.18% 17.65% 19.44% 2.72% 21.62% 17.65% 5.45% 34.29% 10.34% 10.71% 23.13% 10.34% 6.05%
24 2 1 12 3 6 3 12 9 3 5 4 6 5 13
4.00% 0.89% 2.94% 10.08% 8.33% 3.26% 1.16% 10.08% 4.09% 8.57% 8.62% 14.29% 2.04% 8.62% 5.24%
253 10 7 55 21 159 17 55 180 3 32 21 20 32 201
42.17% 4.44% 20.59% 46.22% 58.33% 86.41% 6.56% 46.22% 81.82% 8.57% 55.17% 75.00% 6.80% 55.17% 81.05%
12 4 - 5 1 2 4 5 3 3 2 - 7 2 3
2.00% 1.78% 4.20% 2.78% 1.09% 1.54% 4.20% 1.36% 8.57% 3.45% 2.38% 3.45% 1.21%
311 209 26 47 11 17 235 47 28 26 19 3 261 19 31
51.83% 92.89% 76.47% 39.50% 30.56% 9.24% 90.73% 39.50% 12.73% 74.29% 32.76% 10.71% 88.78% 32.76% 12.50%
277 12 8 67 24 165 20 67 189 6 37 25 26 37 214
46.17% 5.33% 23.53% 56.30% 66.67% 89.67% 7.72% 56.30% 85.91% 17.14% 63.79% 89.29% 8.84% 63.79% 86.29%
Total Answering
STRONGLY APPROVE
SOMEWHAT APPROVE
SOMEWHAT DISAPPROVE
STRONGLY DISAPPROVE
DON’T KNOW/NO ANSWER
Total Approve
Total Disapprove
PARTY Q14A
-------------------------------------------------------
INDEPENDENTS Q14B
--------------------
SUMMARY Q14
--------------------
Total
Restoration PAC, Pennsylvania Statewide - May 2020 Banner 8 Page 216 of 290

CORONAVIRUS 1. With over 60,000 Americans dead from the pandemic, how worried are you that you, or someone close to you, will be infected with coronavirus?
Total
-----
Str
GOP
-----
NotStr
GOP
-----
INDEP
-----
NotStr
DEM
-----
Str
DEM
-----
Tot
GOP
-----
INDEP
-----
Tot
DEM
-----
Lean
GOP
-----
Firm
INDEP
-----
Lean
DEM
-----
All
REP
-----
All
INDEP
-----
All
DEM
-----
600 225 34 119 36 184 259 119 220 35 58 28 294 58 248
100.00% 100.00% 100.00% 100.00% 100.00% 100.00% 100.00% 100.00% 100.00% 100.00% 100.00% 100.00% 100.00% 100.00% 100.00%
600 225 34 119 36 184 259 119 220 35 58 28 294 58 248
100.00% 100.00% 100.00% 100.00% 100.00% 100.00% 100.00% 100.00% 100.00% 100.00% 100.00% 100.00% 100.00% 100.00% 100.00%
168 102 12 32 6 15 114 32 21 16 13 4 130 13 25
28.00% 45.33% 35.29% 26.89% 16.67% 8.15% 44.02% 26.89% 9.55% 45.71% 22.41% 14.29% 44.22% 22.41% 10.08%
223 84 14 49 16 60 98 49 76 15 19 15 113 19 91
37.17% 37.33% 41.18% 41.18% 44.44% 32.61% 37.84% 41.18% 34.55% 42.86% 32.76% 53.57% 38.44% 32.76% 36.69%
209 39 8 38 14 109 47 38 123 4 26 9 51 26 132
34.83% 17.33% 23.53% 31.93% 38.89% 59.24% 18.15% 31.93% 55.91% 11.43% 44.83% 32.14% 17.35% 44.83% 53.23%
INDEPENDENTS Q14B
--------------------
SUMMARY Q14
--------------------
Total
Total Answering
NOT WORRIED
SOMEWHAT WORRIED
VERY WORRIED
PARTY Q14A
-------------------------------------------------------
Restoration PAC, Pennsylvania Statewide - May 2020 Banner 8 Page 217 of 290

CORONAVIRUS 2. Which statement do you agree with, or agree with more: "It's time for people to get back to work." or "It's too early to lift stay-at-home restrictions."
Total
-----
Str
GOP
-----
NotStr
GOP
-----
INDEP
-----
NotStr
DEM
-----
Str
DEM
-----
Tot
GOP
-----
INDEP
-----
Tot
DEM
-----
Lean
GOP
-----
Firm
INDEP
-----
Lean
DEM
-----
All
REP
-----
All
INDEP
-----
All
DEM
-----
600 225 34 119 36 184 259 119 220 35 58 28 294 58 248
100.00% 100.00% 100.00% 100.00% 100.00% 100.00% 100.00% 100.00% 100.00% 100.00% 100.00% 100.00% 100.00% 100.00% 100.00%
600 225 34 119 36 184 259 119 220 35 58 28 294 58 248
100.00% 100.00% 100.00% 100.00% 100.00% 100.00% 100.00% 100.00% 100.00% 100.00% 100.00% 100.00% 100.00% 100.00% 100.00%
309 185 22 61 11 29 207 61 40 29 26 7 236 26 47
51.50% 82.22% 64.71% 51.26% 30.56% 15.76% 79.92% 51.26% 18.18% 82.86% 44.83% 25.00% 80.27% 44.83% 18.95%
291 40 12 58 25 155 52 58 180 6 32 21 58 32 201
48.50% 17.78% 35.29% 48.74% 69.44% 84.24% 20.08% 48.74% 81.82% 17.14% 55.17% 75.00% 19.73% 55.17% 81.05%
Total
Total Answering
WORK
STAY HOME
PARTY Q14A
-------------------------------------------------------
INDEPENDENTS Q14B
--------------------
SUMMARY Q14
--------------------
Restoration PAC, Pennsylvania Statewide - May 2020 Banner 8 Page 218 of 290

Total
-----
Str
GOP
-----
NotStr
GOP
-----
INDEP
-----
NotStr
DEM
-----
Str
DEM
-----
Tot
GOP
-----
INDEP
-----
Tot
DEM
-----
Lean
GOP
-----
Firm
INDEP
-----
Lean
DEM
-----
All
REP
-----
All
INDEP
-----
All
DEM
-----
600 225 34 119 36 184 259 119 220 35 58 28 294 58 248
100.00% 100.00% 100.00% 100.00% 100.00% 100.00% 100.00% 100.00% 100.00% 100.00% 100.00% 100.00% 100.00% 100.00% 100.00%
600 225 34 119 36 184 259 119 220 35 58 28 294 58 248
100.00% 100.00% 100.00% 100.00% 100.00% 100.00% 100.00% 100.00% 100.00% 100.00% 100.00% 100.00% 100.00% 100.00% 100.00%
301 182 23 58 10 27 205 58 37 27 25 7 232 25 44
50.17% 80.89% 67.65% 48.74% 27.78% 14.67% 79.15% 48.74% 16.82% 77.14% 43.10% 25.00% 78.91% 43.10% 17.74%
299 43 11 61 26 157 54 61 183 8 33 21 62 33 204
49.83% 19.11% 32.35% 51.26% 72.22% 85.33% 20.85% 51.26% 83.18% 22.86% 56.90% 75.00% 21.09% 56.90% 82.26%
CORONAVIRUS 3. Which statement do you agree with, or agree with more: "We should re-open the economy, even if that means more people will get coronavirus." or "We should continue the shelter-in-place
restrictions, even if that means severe job losses and economic disruption."
OPEN/VIRUS
SHUTDOWN/JOBS
PARTY Q14A
-------------------------------------------------------
INDEPENDENTS Q14B
--------------------
SUMMARY Q14
--------------------
Total
Total Answering
Restoration PAC, Pennsylvania Statewide - May 2020 Banner 8 Page 219 of 290

Total
-----
Str
GOP
-----
NotStr
GOP
-----
INDEP
-----
NotStr
DEM
-----
Str
DEM
-----
Tot
GOP
-----
INDEP
-----
Tot
DEM
-----
Lean
GOP
-----
Firm
INDEP
-----
Lean
DEM
-----
All
REP
-----
All
INDEP
-----
All
DEM
-----
600 225 34 119 36 184 259 119 220 35 58 28 294 58 248
100.00% 100.00% 100.00% 100.00% 100.00% 100.00% 100.00% 100.00% 100.00% 100.00% 100.00% 100.00% 100.00% 100.00% 100.00%
600 225 34 119 36 184 259 119 220 35 58 28 294 58 248
100.00% 100.00% 100.00% 100.00% 100.00% 100.00% 100.00% 100.00% 100.00% 100.00% 100.00% 100.00% 100.00% 100.00% 100.00%
235 21 9 49 25 131 30 49 156 6 22 21 36 22 177
39.17% 9.33% 26.47% 41.18% 69.44% 71.20% 11.58% 41.18% 70.91% 17.14% 37.93% 75.00% 12.24% 37.93% 71.37%
285 183 22 54 7 18 205 54 25 25 27 3 230 27 28
47.50% 81.33% 64.71% 45.38% 19.44% 9.78% 79.15% 45.38% 11.36% 71.43% 46.55% 10.71% 78.23% 46.55% 11.29%
80 21 3 16 4 35 24 16 39 4 9 4 28 9 43
13.33% 9.33% 8.82% 13.45% 11.11% 19.02% 9.27% 13.45% 17.73% 11.43% 15.52% 14.29% 9.52% 15.52% 17.34%
10. Do you think it was fair or unfair that Democrat President Obama's administration investigated and surveilled Republican Donald Trump as both a presidential candidate and president-elect for allegedly colluding with
Russia?
DON'T KNOW
PARTY Q14A
-------------------------------------------------------
INDEPENDENTS Q14B
--------------------
SUMMARY Q14
--------------------
Total
Total Answering
FAIR
NOT FAIR
Restoration PAC, Pennsylvania Statewide - May 2020 Banner 8 Page 220 of 290

11a. If the election for US Congress were being held today, for whom would you vote.... the Republican candidate or the Democrat candidate?
Total
-----
Str
GOP
-----
NotStr
GOP
-----
INDEP
-----
NotStr
DEM
-----
Str
DEM
-----
Tot
GOP
-----
INDEP
-----
Tot
DEM
-----
Lean
GOP
-----
Firm
INDEP
-----
Lean
DEM
-----
All
REP
-----
All
INDEP
-----
All
DEM
-----
600 225 34 119 36 184 259 119 220 35 58 28 294 58 248
100.00% 100.00% 100.00% 100.00% 100.00% 100.00% 100.00% 100.00% 100.00% 100.00% 100.00% 100.00% 100.00% 100.00% 100.00%
600 225 34 119 36 184 259 119 220 35 58 28 294 58 248
100.00% 100.00% 100.00% 100.00% 100.00% 100.00% 100.00% 100.00% 100.00% 100.00% 100.00% 100.00% 100.00% 100.00% 100.00%
248 192 12 32 1 11 204 32 12 20 12 - 224 12 12
41.33% 85.33% 35.29% 26.89% 2.78% 5.98% 78.76% 26.89% 5.45% 57.14% 20.69% 76.19% 20.69% 4.84%
34 13 7 10 3 1 20 10 4 8 2 - 28 2 4
5.67% 5.78% 20.59% 8.40% 8.33% 0.54% 7.72% 8.40% 1.82% 22.86% 3.45% 9.52% 3.45% 1.61%
92 16 10 39 14 12 26 39 26 6 28 6 32 28 32
15.33% 7.11% 29.41% 32.77% 38.89% 6.52% 10.04% 32.77% 11.82% 17.14% 48.28% 21.43% 10.88% 48.28% 12.90%
25 2 1 4 5 13 3 4 18 1 2 1 4 2 19
4.17% 0.89% 2.94% 3.36% 13.89% 7.07% 1.16% 3.36% 8.18% 2.86% 3.45% 3.57% 1.36% 3.45% 7.66%
198 2 4 33 13 146 6 33 159 - 12 21 6 12 180
33.00% 0.89% 11.76% 27.73% 36.11% 79.35% 2.32% 27.73% 72.27% 20.69% 75.00% 2.04% 20.69% 72.58%
3 - - 1 - 1 - 1 1 - 2 - - 2 1
0.50% 0.84% 0.54% 0.84% 0.45% 3.45% 3.45% 0.40%
282 205 19 42 4 12 224 42 16 28 14 - 252 14 16
47.00% 91.11% 55.88% 35.29% 11.11% 6.52% 86.49% 35.29% 7.27% 80.00% 24.14% 85.71% 24.14% 6.45%
223 4 5 37 18 159 9 37 177 1 14 22 10 14 199
37.17% 1.78% 14.71% 31.09% 50.00% 86.41% 3.47% 31.09% 80.45% 2.86% 24.14% 78.57% 3.40% 24.14% 80.24%
Probably DEMOCRAT
Definitely DEMOCRAT
Refused
Total Republican
Total Democrat
PARTY Q14A
-------------------------------------------------------
INDEPENDENTS Q14B
--------------------
SUMMARY Q14
--------------------
Total
Total Answering
Definitely REPUBLICAN
Probably REPUBLICAN
UNDECIDED
Restoration PAC, Pennsylvania Statewide - May 2020 Banner 8 Page 221 of 290

11b. Would you say you are leaning toward the Republican candidate or leaning toward the Democrat candidate?
Total
-----
Str
GOP
-----
NotStr
GOP
-----
INDEP
-----
NotStr
DEM
-----
Str
DEM
-----
Tot
GOP
-----
INDEP
-----
Tot
DEM
-----
Lean
GOP
-----
Firm
INDEP
-----
Lean
DEM
-----
All
REP
-----
All
INDEP
-----
All
DEM
-----
600 225 34 119 36 184 259 119 220 35 58 28 294 58 248
100.00% 100.00% 100.00% 100.00% 100.00% 100.00% 100.00% 100.00% 100.00% 100.00% 100.00% 100.00% 100.00% 100.00% 100.00%
95 16 10 40 14 13 26 40 27 6 30 6 32 30 33
15.83% 7.11% 29.41% 33.61% 38.89% 7.07% 10.04% 33.61% 12.27% 17.14% 51.72% 21.43% 10.88% 51.72% 13.31%
14 8 2 3 1 - 10 3 1 2 - 1 12 - 2
2.33% 3.56% 5.88% 2.52% 2.78% 3.86% 2.52% 0.45% 5.71% 3.57% 4.08% 0.81%
63 7 8 30 10 6 15 30 16 3 26 3 18 26 19
10.50% 3.11% 23.53% 25.21% 27.78% 3.26% 5.79% 25.21% 7.27% 8.57% 44.83% 10.71% 6.12% 44.83% 7.66%
18 1 - 7 3 7 1 7 10 1 4 2 2 4 12
3.00% 0.44% 5.88% 8.33% 3.80% 0.39% 5.88% 4.55% 2.86% 6.90% 7.14% 0.68% 6.90% 4.84%
Total Answering
LEAN GOP
HARD UNDECIDED/NOT SURE
LEAN DEM
PARTY Q14A
-------------------------------------------------------
INDEPENDENTS Q14B
--------------------
SUMMARY Q14
--------------------
Total
Restoration PAC, Pennsylvania Statewide - May 2020 Banner 8 Page 222 of 290

11. Summary Generic US Congress
Total
-----
Str
GOP
-----
NotStr
GOP
-----
INDEP
-----
NotStr
DEM
-----
Str
DEM
-----
Tot
GOP
-----
INDEP
-----
Tot
DEM
-----
Lean
GOP
-----
Firm
INDEP
-----
Lean
DEM
-----
All
REP
-----
All
INDEP
-----
All
DEM
-----
600 225 34 119 36 184 259 119 220 35 58 28 294 58 248
100.00% 100.00% 100.00% 100.00% 100.00% 100.00% 100.00% 100.00% 100.00% 100.00% 100.00% 100.00% 100.00% 100.00% 100.00%
600 225 34 119 36 184 259 119 220 35 58 28 294 58 248
100.00% 100.00% 100.00% 100.00% 100.00% 100.00% 100.00% 100.00% 100.00% 100.00% 100.00% 100.00% 100.00% 100.00% 100.00%
296 213 21 45 5 12 234 45 17 30 14 1 264 14 18
49.33% 94.67% 61.76% 37.82% 13.89% 6.52% 90.35% 37.82% 7.73% 85.71% 24.14% 3.57% 89.80% 24.14% 7.26%
63 7 8 30 10 6 15 30 16 3 26 3 18 26 19
10.50% 3.11% 23.53% 25.21% 27.78% 3.26% 5.79% 25.21% 7.27% 8.57% 44.83% 10.71% 6.12% 44.83% 7.66%
241 5 5 44 21 166 10 44 187 2 18 24 12 18 211
40.17% 2.22% 14.71% 36.97% 58.33% 90.22% 3.86% 36.97% 85.00% 5.71% 31.03% 85.71% 4.08% 31.03% 85.08%
ALL GOP
HARD UNDECIDED
ALL DEM
PARTY Q14A
-------------------------------------------------------
INDEPENDENTS Q14B
--------------------
SUMMARY Q14
--------------------
Total
Total Answering
Restoration PAC, Pennsylvania Statewide - May 2020 Banner 8 Page 223 of 290

12. Age
Total
-----
Str
GOP
-----
NotStr
GOP
-----
INDEP
-----
NotStr
DEM
-----
Str
DEM
-----
Tot
GOP
-----
INDEP
-----
Tot
DEM
-----
Lean
GOP
-----
Firm
INDEP
-----
Lean
DEM
-----
All
REP
-----
All
INDEP
-----
All
DEM
-----
600 225 34 119 36 184 259 119 220 35 58 28 294 58 248
100.00% 100.00% 100.00% 100.00% 100.00% 100.00% 100.00% 100.00% 100.00% 100.00% 100.00% 100.00% 100.00% 100.00% 100.00%
600 225 34 119 36 184 259 119 220 35 58 28 294 58 248
100.00% 100.00% 100.00% 100.00% 100.00% 100.00% 100.00% 100.00% 100.00% 100.00% 100.00% 100.00% 100.00% 100.00% 100.00%
34 12 1 6 1 13 13 6 14 1 5 1 14 5 15
5.67% 5.33% 2.94% 5.04% 2.78% 7.07% 5.02% 5.04% 6.36% 2.86% 8.62% 3.57% 4.76% 8.62% 6.05%
81 27 5 20 4 24 32 20 28 5 11 5 37 11 33
13.50% 12.00% 14.71% 16.81% 11.11% 13.04% 12.36% 16.81% 12.73% 14.29% 18.97% 17.86% 12.59% 18.97% 13.31%
91 26 7 24 6 28 33 24 34 5 14 5 38 14 39
15.17% 11.56% 20.59% 20.17% 16.67% 15.22% 12.74% 20.17% 15.45% 14.29% 24.14% 17.86% 12.93% 24.14% 15.73%
98 38 4 17 8 31 42 17 39 8 5 4 50 5 43
16.33% 16.89% 11.76% 14.29% 22.22% 16.85% 16.22% 14.29% 17.73% 22.86% 8.62% 14.29% 17.01% 8.62% 17.34%
118 47 7 21 4 39 54 21 43 7 8 6 61 8 49
19.67% 20.89% 20.59% 17.65% 11.11% 21.20% 20.85% 17.65% 19.55% 20.00% 13.79% 21.43% 20.75% 13.79% 19.76%
155 62 8 30 11 44 70 30 55 9 14 7 79 14 62
25.83% 27.56% 23.53% 25.21% 30.56% 23.91% 27.03% 25.21% 25.00% 25.71% 24.14% 25.00% 26.87% 24.14% 25.00%
23 13 2 1 2 5 15 1 7 - 1 - 15 1 7
3.83% 5.78% 5.88% 0.84% 5.56% 2.72% 5.79% 0.84% 3.18% 1.72% 5.10% 1.72% 2.82%
115 39 6 26 5 37 45 26 42 6 16 6 51 16 48
19.17% 17.33% 17.65% 21.85% 13.89% 20.11% 17.37% 21.85% 19.09% 17.14% 27.59% 21.43% 17.35% 27.59% 19.35%
189 64 11 41 14 59 75 41 73 13 19 9 88 19 82
31.50% 28.44% 32.35% 34.45% 38.89% 32.07% 28.96% 34.45% 33.18% 37.14% 32.76% 32.14% 29.93% 32.76% 33.06%
273 109 15 51 15 83 124 51 98 16 22 13 140 22 111
45.50% 48.44% 44.12% 42.86% 41.67% 45.11% 47.88% 42.86% 44.55% 45.71% 37.93% 46.43% 47.62% 37.93% 44.76%
25-34
35-44
45-54
55-64
65+
Refused
Young Adult 18-34
Family Age 35-54
Seniors 55+
PARTY Q14A
-------------------------------------------------------
INDEPENDENTS Q14B
--------------------
SUMMARY Q14
--------------------
Total
Total Answering
18-24
Restoration PAC, Pennsylvania Statewide - May 2020 Banner 8 Page 224 of 290

13. Which two of the following issues do you believe are the most important issues facing the country? [Select up to 2]
Total
-----
Str
GOP
-----
NotStr
GOP
-----
INDEP
-----
NotStr
DEM
-----
Str
DEM
-----
Tot
GOP
-----
INDEP
-----
Tot
DEM
-----
Lean
GOP
-----
Firm
INDEP
-----
Lean
DEM
-----
All
REP
-----
All
INDEP
-----
All
DEM
-----
600 225 34 119 36 184 259 119 220 35 58 28 294 58 248
100.00% 100.00% 100.00% 100.00% 100.00% 100.00% 100.00% 100.00% 100.00% 100.00% 100.00% 100.00% 100.00% 100.00% 100.00%
600 225 34 119 36 184 259 119 220 35 58 28 294 58 248
100.00% 100.00% 100.00% 100.00% 100.00% 100.00% 100.00% 100.00% 100.00% 100.00% 100.00% 100.00% 100.00% 100.00% 100.00%
264 129 17 57 12 48 146 57 60 25 29 4 171 29 64
44.00% 57.33% 50.00% 47.90% 33.33% 26.09% 56.37% 47.90% 27.27% 71.43% 50.00% 14.29% 58.16% 50.00% 25.81%
190 50 6 40 17 77 56 40 94 8 21 11 64 21 105
31.67% 22.22% 17.65% 33.61% 47.22% 41.85% 21.62% 33.61% 42.73% 22.86% 36.21% 39.29% 21.77% 36.21% 42.34%
271 76 15 53 22 104 91 53 126 13 24 17 104 24 143
45.17% 33.78% 44.12% 44.54% 61.11% 56.52% 35.14% 44.54% 57.27% 37.14% 41.38% 60.71% 35.37% 41.38% 57.66%
77 43 3 19 - 12 46 19 12 7 9 3 53 9 15
12.83% 19.11% 8.82% 15.97% 6.52% 17.76% 15.97% 5.45% 20.00% 15.52% 10.71% 18.03% 15.52% 6.05%
71 27 5 19 4 16 32 19 20 4 8 7 36 8 27
11.83% 12.00% 14.71% 15.97% 11.11% 8.70% 12.36% 15.97% 9.09% 11.43% 13.79% 25.00% 12.24% 13.79% 10.89%
47 14 2 3 2 26 16 3 28 2 1 - 18 1 28
7.83% 6.22% 5.88% 2.52% 5.56% 14.13% 6.18% 2.52% 12.73% 5.71% 1.72% 6.12% 1.72% 11.29%
31 16 5 2 3 5 21 2 8 2 - - 23 - 8
5.17% 7.11% 14.71% 1.68% 8.33% 2.72% 8.11% 1.68% 3.64% 5.71% 7.82% 3.23%
79 13 3 19 4 40 16 19 44 - 9 10 16 9 54
13.17% 5.78% 8.82% 15.97% 11.11% 21.74% 6.18% 15.97% 20.00% 15.52% 35.71% 5.44% 15.52% 21.77%
72 41 5 13 2 11 46 13 13 7 6 - 53 6 13
12.00% 18.22% 14.71% 10.92% 5.56% 5.98% 17.76% 10.92% 5.91% 20.00% 10.34% 18.03% 10.34% 5.24%
39 17 1 5 1 15 18 5 16 1 3 1 19 3 17
6.50% 7.56% 2.94% 4.20% 2.78% 8.15% 6.95% 4.20% 7.27% 2.86% 5.17% 3.57% 6.46% 5.17% 6.85%
15 6 2 2 2 2 8 2 4 - 2 1 8 2 5
2.50% 2.67% 5.88% 1.68% 5.56% 1.09% 3.09% 1.68% 1.82% 3.45% 3.57% 2.72% 3.45% 2.02%
EDUCATION
GUNS
FOREIGN TRADE
CLIMATE CHANGE
IMMIGRATION
IMPEACHMENT OR
INVESTIGATING GOVERNMENT
SOMETHING ELSE
PARTY Q14A
-------------------------------------------------------
INDEPENDENTS Q14B
--------------------
SUMMARY Q14
--------------------
Total
Total Answering
JOBS AND THE ECONOMY
HEALTH CARE
STOPPING CORONAVIRUS
NATIONAL SECURITY
Restoration PAC, Pennsylvania Statewide - May 2020 Banner 8 Page 225 of 290

14a. In politics today, do you generally consider yourself .... a republican, a democrat, an independent or something else?
Total
-----
Str
GOP
-----
NotStr
GOP
-----
INDEP
-----
NotStr
DEM
-----
Str
DEM
-----
Tot
GOP
-----
INDEP
-----
Tot
DEM
-----
Lean
GOP
-----
Firm
INDEP
-----
Lean
DEM
-----
All
REP
-----
All
INDEP
-----
All
DEM
-----
600 225 34 119 36 184 259 119 220 35 58 28 294 58 248
100.00% 100.00% 100.00% 100.00% 100.00% 100.00% 100.00% 100.00% 100.00% 100.00% 100.00% 100.00% 100.00% 100.00% 100.00%
600 225 34 119 36 184 259 119 220 35 58 28 294 58 248
100.00% 100.00% 100.00% 100.00% 100.00% 100.00% 100.00% 100.00% 100.00% 100.00% 100.00% 100.00% 100.00% 100.00% 100.00%
225 225 - - - - 225 - - - - - 225 - -
37.50% 100.00% 86.87% 76.53%
34 - 34 - - - 34 - - - - - 34 - -
5.67% 100.00% 13.13% 11.56%
119 - - 119 - - - 119 - 35 56 28 35 56 28
19.83% 100.00% 100.00% 100.00% 96.55% 100.00% 11.90% 96.55% 11.29%
36 - - - 36 - - - 36 - - - - - 36
6.00% 100.00% 16.36% 14.52%
184 - - - - 184 - - 184 - - - - - 184
30.67% 100.00% 83.64% 74.19%
2 - - - - - - - - - 2 - - 2 -
0.33% 3.45% 3.45%
259 225 34 - - - 259 - - - - - 259 - -
43.17% 100.00% 100.00% 100.00% 88.10%
220 - - - 36 184 - - 220 - - - - - 220
36.67% 100.00% 100.00% 100.00% 88.71%
119 - - 119 - - - 119 - 35 56 28 35 56 28
19.83% 100.00% 100.00% 100.00% 96.55% 100.00% 11.90% 96.55% 11.29%
Total Republican
Total Democrat
Independent
SUMMARY Q14
--------------------
Total
Total Answering
Strong REPUBLICAN
Not so Strong Republican
AN INDEPENDENT, OR
SOMETHING ELSE
Not so Strong DEMOCRAT
Strong DEMOCRAT
Refused
PARTY Q14A
-------------------------------------------------------
INDEPENDENTS Q14B
--------------------
Restoration PAC, Pennsylvania Statewide - May 2020 Banner 8 Page 226 of 290

14b. Do you think of yourself closer to the Republican Party or Democratic Party?
Total
-----
Str
GOP
-----
NotStr
GOP
-----
INDEP
-----
NotStr
DEM
-----
Str
DEM
-----
Tot
GOP
-----
INDEP
-----
Tot
DEM
-----
Lean
GOP
-----
Firm
INDEP
-----
Lean
DEM
-----
All
REP
-----
All
INDEP
-----
All
DEM
-----
600 225 34 119 36 184 259 119 220 35 58 28 294 58 248
100.00% 100.00% 100.00% 100.00% 100.00% 100.00% 100.00% 100.00% 100.00% 100.00% 100.00% 100.00% 100.00% 100.00% 100.00%
121 - - 119 - - - 119 - 35 58 28 35 58 28
20.17% 100.00% 100.00% 100.00% 100.00% 100.00% 11.90% 100.00% 11.29%
35 - - 35 - - - 35 - 35 - - 35 - -
5.83% 29.41% 29.41% 100.00% 11.90%
58 - - 56 - - - 56 - - 58 - - 58 -
9.67% 47.06% 47.06% 100.00% 100.00%
28 - - 28 - - - 28 - - - 28 - - 28
4.67% 23.53% 23.53% 100.00% 11.29%
FIRM INDEPENDENT
LEAN DEMOCRAT
PARTY Q14A
-------------------------------------------------------
INDEPENDENTS Q14B
--------------------
SUMMARY Q14
--------------------
Total
Total Answering
LEAN REPUBLICAN
Restoration PAC, Pennsylvania Statewide - May 2020 Banner 8 Page 227 of 290

14. Party Summary
Total
-----
Str
GOP
-----
NotStr
GOP
-----
INDEP
-----
NotStr
DEM
-----
Str
DEM
-----
Tot
GOP
-----
INDEP
-----
Tot
DEM
-----
Lean
GOP
-----
Firm
INDEP
-----
Lean
DEM
-----
All
REP
-----
All
INDEP
-----
All
DEM
-----
600 225 34 119 36 184 259 119 220 35 58 28 294 58 248
100.00% 100.00% 100.00% 100.00% 100.00% 100.00% 100.00% 100.00% 100.00% 100.00% 100.00% 100.00% 100.00% 100.00% 100.00%
600 225 34 119 36 184 259 119 220 35 58 28 294 58 248
100.00% 100.00% 100.00% 100.00% 100.00% 100.00% 100.00% 100.00% 100.00% 100.00% 100.00% 100.00% 100.00% 100.00% 100.00%
294 225 34 35 - - 259 35 - 35 - - 294 - -
49.00% 100.00% 100.00% 29.41% 100.00% 29.41% 100.00% 100.00%
58 - - 56 - - - 56 - - 58 - - 58 -
9.67% 47.06% 47.06% 100.00% 100.00%
248 - - 28 36 184 - 28 220 - - 28 - - 248
41.33% 23.53% 100.00% 100.00% 23.53% 100.00% 100.00% 100.00%
ALL DEMOCRAT
PARTY Q14A
-------------------------------------------------------
INDEPENDENTS Q14B
--------------------
SUMMARY Q14
--------------------
Total
Total Answering
ALL REPUBLICAN
ALL INDEPENDENT
Restoration PAC, Pennsylvania Statewide - May 2020 Banner 8 Page 228 of 290

BALLOT. If a mail-in ballot was mailed to you, how likely would you be to vote by mail this fall, as opposed to voting in-person at your polling place?
Total
-----
Str
GOP
-----
NotStr
GOP
-----
INDEP
-----
NotStr
DEM
-----
Str
DEM
-----
Tot
GOP
-----
INDEP
-----
Tot
DEM
-----
Lean
GOP
-----
Firm
INDEP
-----
Lean
DEM
-----
All
REP
-----
All
INDEP
-----
All
DEM
-----
600 225 34 119 36 184 259 119 220 35 58 28 294 58 248
100.00% 100.00% 100.00% 100.00% 100.00% 100.00% 100.00% 100.00% 100.00% 100.00% 100.00% 100.00% 100.00% 100.00% 100.00%
600 225 34 119 36 184 259 119 220 35 58 28 294 58 248
100.00% 100.00% 100.00% 100.00% 100.00% 100.00% 100.00% 100.00% 100.00% 100.00% 100.00% 100.00% 100.00% 100.00% 100.00%
84 29 5 14 10 25 34 14 35 4 7 4 38 7 39
14.00% 12.89% 14.71% 11.76% 27.78% 13.59% 13.13% 11.76% 15.91% 11.43% 12.07% 14.29% 12.93% 12.07% 15.73%
247 40 10 54 16 126 50 54 142 5 30 20 55 30 162
41.17% 17.78% 29.41% 45.38% 44.44% 68.48% 19.31% 45.38% 64.55% 14.29% 51.72% 71.43% 18.71% 51.72% 65.32%
269 156 19 51 10 33 175 51 43 26 21 4 201 21 47
44.83% 69.33% 55.88% 42.86% 27.78% 17.93% 67.57% 42.86% 19.55% 74.29% 36.21% 14.29% 68.37% 36.21% 18.95%
PARTY Q14A
-------------------------------------------------------
INDEPENDENTS Q14B
--------------------
SUMMARY Q14
--------------------
Total
Total Answering
Somewhat likely to vote by mail
Very likely to vote by mail
Not likely/Would still vote at polling
place
Restoration PAC, Pennsylvania Statewide - May 2020 Banner 8 Page 229 of 290

15. What was the last grade you completed in school?
Total
-----
Str
GOP
-----
NotStr
GOP
-----
INDEP
-----
NotStr
DEM
-----
Str
DEM
-----
Tot
GOP
-----
INDEP
-----
Tot
DEM
-----
Lean
GOP
-----
Firm
INDEP
-----
Lean
DEM
-----
All
REP
-----
All
INDEP
-----
All
DEM
-----
600 225 34 119 36 184 259 119 220 35 58 28 294 58 248
100.00% 100.00% 100.00% 100.00% 100.00% 100.00% 100.00% 100.00% 100.00% 100.00% 100.00% 100.00% 100.00% 100.00% 100.00%
600 225 34 119 36 184 259 119 220 35 58 28 294 58 248
100.00% 100.00% 100.00% 100.00% 100.00% 100.00% 100.00% 100.00% 100.00% 100.00% 100.00% 100.00% 100.00% 100.00% 100.00%
3 1 - 1 - 1 1 1 1 - - 1 1 - 2
0.50% 0.44% 0.84% 0.54% 0.39% 0.84% 0.45% 3.57% 0.34% 0.81%
153 68 9 26 9 41 77 26 50 12 10 4 89 10 54
25.50% 30.22% 26.47% 21.85% 25.00% 22.28% 29.73% 21.85% 22.73% 34.29% 17.24% 14.29% 30.27% 17.24% 21.77%
30 14 - 7 1 8 14 7 9 3 2 2 17 2 11
5.00% 6.22% 5.88% 2.78% 4.35% 5.41% 5.88% 4.09% 8.57% 3.45% 7.14% 5.78% 3.45% 4.44%
282 115 18 60 13 76 133 60 89 14 33 13 147 33 102
47.00% 51.11% 52.94% 50.42% 36.11% 41.30% 51.35% 50.42% 40.45% 40.00% 56.90% 46.43% 50.00% 56.90% 41.13%
130 27 7 25 13 56 34 25 69 6 13 8 40 13 77
21.67% 12.00% 20.59% 21.01% 36.11% 30.43% 13.13% 21.01% 31.36% 17.14% 22.41% 28.57% 13.61% 22.41% 31.05%
2 - - - - 2 - - 2 - - - - - 2
0.33% 1.09% 0.91% 0.81%
156 69 9 27 9 42 78 27 51 12 10 5 90 10 56
26.00% 30.67% 26.47% 22.69% 25.00% 22.83% 30.12% 22.69% 23.18% 34.29% 17.24% 17.86% 30.61% 17.24% 22.58%
312 129 18 67 14 84 147 67 98 17 35 15 164 35 113
52.00% 57.33% 52.94% 56.30% 38.89% 45.65% 56.76% 56.30% 44.55% 48.57% 60.34% 53.57% 55.78% 60.34% 45.56%
130 27 7 25 13 56 34 25 69 6 13 8 40 13 77
21.67% 12.00% 20.59% 21.01% 36.11% 30.43% 13.13% 21.01% 31.36% 17.14% 22.41% 28.57% 13.61% 22.41% 31.05%
GRADUATE SCHOOL
REFUSED
High School
College
College+
PARTY Q14A
-------------------------------------------------------
INDEPENDENTS Q14B
--------------------
SUMMARY Q14
--------------------
Total
Total Answering
GRADE SCHOOL [1-8]
HIGH SCHOOL [9-12]
TECHNICAL/VOCATIONAL
SCHOOL
COLLEGE
Restoration PAC, Pennsylvania Statewide - May 2020 Banner 8 Page 230 of 290

16. Thinking about where you live, do you consider it to be urban, suburban or rural?
Total
-----
Str
GOP
-----
NotStr
GOP
-----
INDEP
-----
NotStr
DEM
-----
Str
DEM
-----
Tot
GOP
-----
INDEP
-----
Tot
DEM
-----
Lean
GOP
-----
Firm
INDEP
-----
Lean
DEM
-----
All
REP
-----
All
INDEP
-----
All
DEM
-----
600 225 34 119 36 184 259 119 220 35 58 28 294 58 248
100.00% 100.00% 100.00% 100.00% 100.00% 100.00% 100.00% 100.00% 100.00% 100.00% 100.00% 100.00% 100.00% 100.00% 100.00%
600 225 34 119 36 184 259 119 220 35 58 28 294 58 248
100.00% 100.00% 100.00% 100.00% 100.00% 100.00% 100.00% 100.00% 100.00% 100.00% 100.00% 100.00% 100.00% 100.00% 100.00%
103 27 6 15 9 46 33 15 55 5 7 3 38 7 58
17.17% 12.00% 17.65% 12.61% 25.00% 25.00% 12.74% 12.61% 25.00% 14.29% 12.07% 10.71% 12.93% 12.07% 23.39%
299 109 18 64 17 90 127 64 107 16 32 17 143 32 124
49.83% 48.44% 52.94% 53.78% 47.22% 48.91% 49.03% 53.78% 48.64% 45.71% 55.17% 60.71% 48.64% 55.17% 50.00%
196 87 10 40 10 48 97 40 58 14 19 8 111 19 66
32.67% 38.67% 29.41% 33.61% 27.78% 26.09% 37.45% 33.61% 26.36% 40.00% 32.76% 28.57% 37.76% 32.76% 26.61%
2 2 - - - - 2 - - - - - 2 - -
0.33% 0.89% 0.77% 0.68%
Total Answering
URBAN
SUBURBAN
RURAL
DON'T KNOW
PARTY Q14A
-------------------------------------------------------
INDEPENDENTS Q14B
--------------------
SUMMARY Q14
--------------------
Total
Restoration PAC, Pennsylvania Statewide - May 2020 Banner 8 Page 231 of 290

17. Gender
Total
-----
Str
GOP
-----
NotStr
GOP
-----
INDEP
-----
NotStr
DEM
-----
Str
DEM
-----
Tot
GOP
-----
INDEP
-----
Tot
DEM
-----
Lean
GOP
-----
Firm
INDEP
-----
Lean
DEM
-----
All
REP
-----
All
INDEP
-----
All
DEM
-----
600 225 34 119 36 184 259 119 220 35 58 28 294 58 248
100.00% 100.00% 100.00% 100.00% 100.00% 100.00% 100.00% 100.00% 100.00% 100.00% 100.00% 100.00% 100.00% 100.00% 100.00%
600 225 34 119 36 184 259 119 220 35 58 28 294 58 248
100.00% 100.00% 100.00% 100.00% 100.00% 100.00% 100.00% 100.00% 100.00% 100.00% 100.00% 100.00% 100.00% 100.00% 100.00%
286 119 19 72 16 60 138 72 76 27 29 16 165 29 92
47.67% 52.89% 55.88% 60.50% 44.44% 32.61% 53.28% 60.50% 34.55% 77.14% 50.00% 57.14% 56.12% 50.00% 37.10%
314 106 15 47 20 124 121 47 144 8 29 12 129 29 156
52.33% 47.11% 44.12% 39.50% 55.56% 67.39% 46.72% 39.50% 65.45% 22.86% 50.00% 42.86% 43.88% 50.00% 62.90%
Total Answering
Male
Female
PARTY Q14A
-------------------------------------------------------
INDEPENDENTS Q14B
--------------------
SUMMARY Q14
--------------------
Total
Restoration PAC, Pennsylvania Statewide - May 2020 Banner 8 Page 232 of 290

Table of contents
Banner 9
Table market
Table q1
Table q2
Table q3
Table q4
Table q5
Table q6
Table q7a
Table q7b
Table q7Summ
Table q8
Table corona_1
Table corona_2
Table corona_3
Table q10
Table q11a
Table q11b
Table q11_Summ
Table age
Table q13
Table q14a
Table q14b
Table q14_SUMM
12. Age
13. Which two of the following issues do you believe are the most important issues facing the country? [Select up to 2]
14a. In politics today, do you generally consider yourself .... a republican, a democrat, an independent or something else?
14b. Do you think of yourself closer to the Republican Party or Democratic Party?
14. Party Summary
10. Do you think it was fair or unfair that Democrat President Obama's administration investigated and surveilled Republican Donald Trump as both a presidential candidate and
president-elect for allegedly colluding with Russia?
11a. If the election for US Congress were being held today, for whom would you vote.... the Republican candidate or the Democrat candidate?
11b. Would you say you are leaning toward the Republican candidate or leaning toward the Democrat candidate?
11. Summary Generic US Congress
7. Biden Ballot Summary
8. Do you approve or disapprove of the way President Trump is handling the Coronavirus crisis?
CORONAVIRUS 1. With over 60,000 Americans dead from the pandemic, how worried are you that you, or someone close to you, will be infected with coronavirus?
CORONAVIRUS 2. Which statement do you agree with, or agree with more: "It's time for people to get back to work." or "It's too early to lift stay-at-home restrictions."
CORONAVIRUS 3. Which statement do you agree with, or agree with more: "We should re-open the economy, even if that means more people will get coronavirus." or "We
should continue the shelter-in-place restrictions, even if that means severe job losses and economic disruption."
Media Market
1. Thinking ahead to the November election, how likely would you say you are to vote in these elections? Would you say you are…
2. Do you think the country is going in the right direction, or have things pretty seriously gone off on the wrong track?
3. Do you think the economy is going in the right direction, or have things pretty seriously gone off on the wrong track?
4. Do you approve or disapprove of the job Donald Trump is doing as President? Would that be strongly or somewhat (approve or disapprove)?
5. Do you think the impeachment of President Trump was good for the country, bad for the country, or did the impeachment not really matter that much?
6. Do you have a favorable or unfavorable impression of Donald Trump?
7a. If the election for President were being held today, and the candidates were Donald Trump and Joe Biden, for whom would you vote?
7b. Would you say you are leaning toward Donald Trump or leaning toward Joe Biden?
Restoration PAC, Pennsylvania Statewide - May 2020 Banner 9 Page 233 of 290

Table ballot
Table q15
Table q16
Table q17
BALLOT. If a mail-in ballot was mailed to you, how likely would you be to vote by mail this fall, as opposed to voting in-person at your polling place?
15. What was the last grade you completed in school?
16. Thinking about where you live, do you consider it to be urban, suburban or rural?
17. Gender
Restoration PAC, Pennsylvania Statewide - May 2020 Banner 9 Page 234 of 290

Media Market
Total
---------
Jobs-Econ
---------
Healthcare
---------
Corona-
virus
---------
Nat'l-Sec
---------
Educat
---------
Guns
---------
Trade
---------
Climate
---------
Immigrt
---------
Impeach-
Scandal
---------
Other
---------
600 264 190 271 77 71 47 31 79 72 39 15
100.00% 100.00% 100.00% 100.00% 100.00% 100.00% 100.00% 100.00% 100.00% 100.00% 100.00% 100.00%
600 264 190 271 77 71 47 31 79 72 39 15
100.00% 100.00% 100.00% 100.00% 100.00% 100.00% 100.00% 100.00% 100.00% 100.00% 100.00% 100.00%
3 2 1 1 - - - - - 1 1 -
0.50% 0.76% 0.53% 0.37% 1.39% 2.56%
248 105 75 138 25 26 18 12 35 23 11 5
41.33% 39.77% 39.47% 50.92% 32.47% 36.62% 38.30% 38.71% 44.30% 31.94% 28.21% 33.33%
132 58 47 46 16 19 12 9 14 20 13 3
22.00% 21.97% 24.74% 16.97% 20.78% 26.76% 25.53% 29.03% 17.72% 27.78% 33.33% 20.00%
1 - 1 1 - - - - - - - -
0.17% 0.53% 0.37%
2 1 - - 1 - - - - 1 1 -
0.33% 0.38% 1.30% 1.39% 2.56%
19 8 5 6 5 4 - 3 4 3 - -
3.17% 3.03% 2.63% 2.21% 6.49% 5.63% 9.68% 5.06% 4.17%
5 2 2 2 2 2 - - - - - -
0.83% 0.76% 1.05% 0.74% 2.60% 2.82%
2 1 1 1 - - - - - - 1 -
0.33% 0.38% 0.53% 0.37% 2.56%
89 47 19 37 14 8 5 4 17 12 4 5
14.83% 17.80% 10.00% 13.65% 18.18% 11.27% 10.64% 12.90% 21.52% 16.67% 10.26% 33.33%
33 18 15 12 4 - 5 1 2 2 3 -
5.50% 6.82% 7.89% 4.43% 5.19% 10.64% 3.23% 2.53% 2.78% 7.69%
66 22 24 27 10 12 7 2 7 10 5 2
11.00% 8.33% 12.63% 9.96% 12.99% 16.90% 14.89% 6.45% 8.86% 13.89% 12.82% 13.33%
536 - YOUNGSTOWN
565 - ELMIRA (CORNING)
566 - HARRISBURG-LNCSTR-
LEB-YORK
574 - JOHNSTOWN-ALTOONA-
ST COLGE
577 - WILKES BARRE-
SCRANTON-HZTN
ISSUE PRIORITY Q13
------------------------------------------------------------------------------------------------------------------------
Total
Total Answering
501 - NEW YORK
504 - PHILADELPHIA
508 - PITTSBURGH
511 - WASHINGTON, DC
(HAGRSTWN)
514 - BUFFALO
516 - ERIE
Restoration PAC, Pennsylvania Statewide - May 2020 Banner 9 Page 235 of 290

1. Thinking ahead to the November election, how likely would you say you are to vote in these elections? Would you say you are…
Total
---------
Jobs-Econ
---------
Healthcare
---------
Corona-
virus
---------
Nat'l-Sec
---------
Educat
---------
Guns
---------
Trade
---------
Climate
---------
Immigrt
---------
Impeach-
Scandal
---------
Other
---------
600 264 190 271 77 71 47 31 79 72 39 15
100.00% 100.00% 100.00% 100.00% 100.00% 100.00% 100.00% 100.00% 100.00% 100.00% 100.00% 100.00%
600 264 190 271 77 71 47 31 79 72 39 15
100.00% 100.00% 100.00% 100.00% 100.00% 100.00% 100.00% 100.00% 100.00% 100.00% 100.00% 100.00%
579 257 182 259 76 69 43 31 76 70 39 14
96.50% 97.35% 95.79% 95.57% 98.70% 97.18% 91.49% 100.00% 96.20% 97.22% 100.00% 93.33%
21 7 8 12 1 2 4 - 3 2 - 1
3.50% 2.65% 4.21% 4.43% 1.30% 2.82% 8.51% 3.80% 2.78% 6.67%
SOMEWHAT LIKELY
ISSUE PRIORITY Q13
------------------------------------------------------------------------------------------------------------------------
Total
Total Answering
VERY LIKELY
Restoration PAC, Pennsylvania Statewide - May 2020 Banner 9 Page 236 of 290

2. Do you think the country is going in the right direction, or have things pretty seriously gone off on the wrong track?
Total
---------
Jobs-Econ
---------
Healthcare
---------
Corona-
virus
---------
Nat'l-Sec
---------
Educat
---------
Guns
---------
Trade
---------
Climate
---------
Immigrt
---------
Impeach-
Scandal
---------
Other
---------
600 264 190 271 77 71 47 31 79 72 39 15
100.00% 100.00% 100.00% 100.00% 100.00% 100.00% 100.00% 100.00% 100.00% 100.00% 100.00% 100.00%
600 264 190 271 77 71 47 31 79 72 39 15
100.00% 100.00% 100.00% 100.00% 100.00% 100.00% 100.00% 100.00% 100.00% 100.00% 100.00% 100.00%
230 123 51 73 47 30 10 20 10 49 20 8
38.33% 46.59% 26.84% 26.94% 61.04% 42.25% 21.28% 64.52% 12.66% 68.06% 51.28% 53.33%
339 122 133 187 27 39 33 8 67 16 19 5
56.50% 46.21% 70.00% 69.00% 35.06% 54.93% 70.21% 25.81% 84.81% 22.22% 48.72% 33.33%
27 17 6 11 2 2 4 3 1 4 - 1
4.50% 6.44% 3.16% 4.06% 2.60% 2.82% 8.51% 9.68% 1.27% 5.56% 6.67%
4 2 - - 1 - - - 1 3 - 1
0.67% 0.76% 1.30% 1.27% 4.17% 6.67%
ISSUE PRIORITY Q13
------------------------------------------------------------------------------------------------------------------------
Total
Total Answering
RIGHT DIRECTION
WRONG TRACK
DON’T KNOW
REFUSED
Restoration PAC, Pennsylvania Statewide - May 2020 Banner 9 Page 237 of 290

3. Do you think the economy is going in the right direction, or have things pretty seriously gone off on the wrong track?
Total
---------
Jobs-Econ
---------
Healthcare
---------
Corona-
virus
---------
Nat'l-Sec
---------
Educat
---------
Guns
---------
Trade
---------
Climate
---------
Immigrt
---------
Impeach-
Scandal
---------
Other
---------
600 264 190 271 77 71 47 31 79 72 39 15
100.00% 100.00% 100.00% 100.00% 100.00% 100.00% 100.00% 100.00% 100.00% 100.00% 100.00% 100.00%
600 264 190 271 77 71 47 31 79 72 39 15
100.00% 100.00% 100.00% 100.00% 100.00% 100.00% 100.00% 100.00% 100.00% 100.00% 100.00% 100.00%
202 105 50 63 37 31 10 18 12 42 21 6
33.67% 39.77% 26.32% 23.25% 48.05% 43.66% 21.28% 58.06% 15.19% 58.33% 53.85% 40.00%
362 143 133 193 35 35 31 12 64 24 17 6
60.33% 54.17% 70.00% 71.22% 45.45% 49.30% 65.96% 38.71% 81.01% 33.33% 43.59% 40.00%
32 14 6 15 5 5 5 1 2 3 1 3
5.33% 5.30% 3.16% 5.54% 6.49% 7.04% 10.64% 3.23% 2.53% 4.17% 2.56% 20.00%
4 2 1 - - - 1 - 1 3 - -
0.67% 0.76% 0.53% 2.13% 1.27% 4.17%
Total
Total Answering
RIGHT DIRECTION
WRONG TRACK
DON’T KNOW
REFUSED
ISSUE PRIORITY Q13
------------------------------------------------------------------------------------------------------------------------
Restoration PAC, Pennsylvania Statewide - May 2020 Banner 9 Page 238 of 290

4. Do you approve or disapprove of the job Donald Trump is doing as President? Would that be strongly or somewhat (approve or disapprove)?
Total
---------
Jobs-Econ
---------
Healthcare
---------
Corona-
virus
---------
Nat'l-Sec
---------
Educat
---------
Guns
---------
Trade
---------
Climate
---------
Immigrt
---------
Impeach-
Scandal
---------
Other
---------
600 264 190 271 77 71 47 31 79 72 39 15
100.00% 100.00% 100.00% 100.00% 100.00% 100.00% 100.00% 100.00% 100.00% 100.00% 100.00% 100.00%
600 264 190 271 77 71 47 31 79 72 39 15
100.00% 100.00% 100.00% 100.00% 100.00% 100.00% 100.00% 100.00% 100.00% 100.00% 100.00% 100.00%
268 159 61 82 56 28 15 22 12 56 21 6
44.67% 60.23% 32.11% 30.26% 72.73% 39.44% 31.91% 70.97% 15.19% 77.78% 53.85% 40.00%
46 25 12 23 2 7 3 3 2 7 2 2
7.67% 9.47% 6.32% 8.49% 2.60% 9.86% 6.38% 9.68% 2.53% 9.72% 5.13% 13.33%
18 8 6 7 2 3 2 1 2 - 2 1
3.00% 3.03% 3.16% 2.58% 2.60% 4.23% 4.26% 3.23% 2.53% 5.13% 6.67%
256 69 108 154 17 32 27 4 60 8 14 3
42.67% 26.14% 56.84% 56.83% 22.08% 45.07% 57.45% 12.90% 75.95% 11.11% 35.90% 20.00%
12 3 3 5 - 1 - 1 3 1 - 3
2.00% 1.14% 1.58% 1.85% 1.41% 3.23% 3.80% 1.39% 20.00%
314 184 73 105 58 35 18 25 14 63 23 8
52.33% 69.70% 38.42% 38.75% 75.32% 49.30% 38.30% 80.65% 17.72% 87.50% 58.97% 53.33%
274 77 114 161 19 35 29 5 62 8 16 4
45.67% 29.17% 60.00% 59.41% 24.68% 49.30% 61.70% 16.13% 78.48% 11.11% 41.03% 26.67%
STRONGLY APPROVE
SOMEWHAT APPROVE
SOMEWHAT DISAPPROVE
STRONGLY DISAPPROVE
DON’T KNOW/NO ANSWER
Total Approve
Total Disapprove
ISSUE PRIORITY Q13
------------------------------------------------------------------------------------------------------------------------
Total
Total Answering
Restoration PAC, Pennsylvania Statewide - May 2020 Banner 9 Page 239 of 290

5. Do you think the impeachment of President Trump was good for the country, bad for the country, or did the impeachment not really matter that much?
Total
---------
Jobs-Econ
---------
Healthcare
---------
Corona-
virus
---------
Nat'l-Sec
---------
Educat
---------
Guns
---------
Trade
---------
Climate
---------
Immigrt
---------
Impeach-
Scandal
---------
Other
---------
600 264 190 271 77 71 47 31 79 72 39 15
100.00% 100.00% 100.00% 100.00% 100.00% 100.00% 100.00% 100.00% 100.00% 100.00% 100.00% 100.00%
600 264 190 271 77 71 47 31 79 72 39 15
100.00% 100.00% 100.00% 100.00% 100.00% 100.00% 100.00% 100.00% 100.00% 100.00% 100.00% 100.00%
107 23 48 59 12 10 9 4 20 9 6 4
17.83% 8.71% 25.26% 21.77% 15.58% 14.08% 19.15% 12.90% 25.32% 12.50% 15.38% 26.67%
289 168 65 102 50 34 17 21 22 47 23 7
48.17% 63.64% 34.21% 37.64% 64.94% 47.89% 36.17% 67.74% 27.85% 65.28% 58.97% 46.67%
204 73 77 110 15 27 21 6 37 16 10 4
34.00% 27.65% 40.53% 40.59% 19.48% 38.03% 44.68% 19.35% 46.84% 22.22% 25.64% 26.67%
Total Answering
GOOD
BAD
DOESN'T MATTER/DON'T
KNOW
ISSUE PRIORITY Q13
------------------------------------------------------------------------------------------------------------------------
Total
Restoration PAC, Pennsylvania Statewide - May 2020 Banner 9 Page 240 of 290

6. Do you have a favorable or unfavorable impression of Donald Trump?
Total
---------
Jobs-Econ
---------
Healthcare
---------
Corona-
virus
---------
Nat'l-Sec
---------
Educat
---------
Guns
---------
Trade
---------
Climate
---------
Immigrt
---------
Impeach-
Scandal
---------
Other
---------
600 264 190 271 77 71 47 31 79 72 39 15
100.00% 100.00% 100.00% 100.00% 100.00% 100.00% 100.00% 100.00% 100.00% 100.00% 100.00% 100.00%
600 264 190 271 77 71 47 31 79 72 39 15
100.00% 100.00% 100.00% 100.00% 100.00% 100.00% 100.00% 100.00% 100.00% 100.00% 100.00% 100.00%
243 142 57 73 52 29 13 16 8 51 21 7
40.50% 53.79% 30.00% 26.94% 67.53% 40.85% 27.66% 51.61% 10.13% 70.83% 53.85% 46.67%
53 31 10 22 6 5 2 9 5 8 2 2
8.83% 11.74% 5.26% 8.12% 7.79% 7.04% 4.26% 29.03% 6.33% 11.11% 5.13% 13.33%
11 3 2 6 1 1 2 - 2 2 1 1
1.83% 1.14% 1.05% 2.21% 1.30% 1.41% 4.26% 2.53% 2.78% 2.56% 6.67%
24 12 10 11 1 2 4 - 2 3 1 -
4.00% 4.55% 5.26% 4.06% 1.30% 2.82% 8.51% 2.53% 4.17% 2.56%
268 76 111 159 17 34 26 6 62 8 14 4
44.67% 28.79% 58.42% 58.67% 22.08% 47.89% 55.32% 19.35% 78.48% 11.11% 35.90% 26.67%
- - - - - - - - - - - -
1 - - - - - - - - - - 1
0.17% 6.67%
296 173 67 95 58 34 15 25 13 59 23 9
49.33% 65.53% 35.26% 35.06% 75.32% 47.89% 31.91% 80.65% 16.46% 81.94% 58.97% 60.00%
292 88 121 170 18 36 30 6 64 11 15 4
48.67% 33.33% 63.68% 62.73% 23.38% 50.70% 63.83% 19.35% 81.01% 15.28% 38.46% 26.67%
NO OPINION
Somewhat UNFAVORABLE
Strongly UNFAVORABLE
DON’T KNOW/NOT SURE
REFUSED
Total Favorable
Total Unfavorable
ISSUE PRIORITY Q13
------------------------------------------------------------------------------------------------------------------------
Total
Total Answering
Strongly FAVORABLE
Somewhat FAVORABLE
Restoration PAC, Pennsylvania Statewide - May 2020 Banner 9 Page 241 of 290

7a. If the election for President were being held today, and the candidates were Donald Trump and Joe Biden, for whom would you vote?
Total
---------
Jobs-Econ
---------
Healthcare
---------
Corona-
virus
---------
Nat'l-Sec
---------
Educat
---------
Guns
---------
Trade
---------
Climate
---------
Immigrt
---------
Impeach-
Scandal
---------
Other
---------
600 264 190 271 77 71 47 31 79 72 39 15
100.00% 100.00% 100.00% 100.00% 100.00% 100.00% 100.00% 100.00% 100.00% 100.00% 100.00% 100.00%
600 264 190 271 77 71 47 31 79 72 39 15
100.00% 100.00% 100.00% 100.00% 100.00% 100.00% 100.00% 100.00% 100.00% 100.00% 100.00% 100.00%
286 169 62 90 59 30 15 25 12 58 22 8
47.67% 64.02% 32.63% 33.21% 76.62% 42.25% 31.91% 80.65% 15.19% 80.56% 56.41% 53.33%
15 10 4 8 1 4 - 1 - 2 - -
2.50% 3.79% 2.11% 2.95% 1.30% 5.63% 3.23% 2.78%
22 10 9 9 - 5 1 1 3 3 2 -
3.67% 3.79% 4.74% 3.32% 7.04% 2.13% 3.23% 3.80% 4.17% 5.13%
15 6 4 10 2 1 2 - 1 - 1 -
2.50% 2.27% 2.11% 3.69% 2.60% 1.41% 4.26% 1.27% 2.56%
258 67 110 153 15 31 29 4 62 9 14 5
43.00% 25.38% 57.89% 56.46% 19.48% 43.66% 61.70% 12.90% 78.48% 12.50% 35.90% 33.33%
4 2 1 1 - - - - 1 - - 2
0.67% 0.76% 0.53% 0.37% 1.27% 13.33%
301 179 66 98 60 34 15 26 12 60 22 8
50.17% 67.80% 34.74% 36.16% 77.92% 47.89% 31.91% 83.87% 15.19% 83.33% 56.41% 53.33%
22 10 9 9 - 5 1 1 3 3 2 -
3.67% 3.79% 4.74% 3.32% 7.04% 2.13% 3.23% 3.80% 4.17% 5.13%
273 73 114 163 17 32 31 4 63 9 15 5
45.50% 27.65% 60.00% 60.15% 22.08% 45.07% 65.96% 12.90% 79.75% 12.50% 38.46% 33.33%
Total Biden
Total Answering
Definitely TRUMP
Probably TRUMP
UNDECIDED
Probably BIDEN
Definitely BIDEN
Refused
Total Trump
Total Undecided
ISSUE PRIORITY Q13
------------------------------------------------------------------------------------------------------------------------
Total
Restoration PAC, Pennsylvania Statewide - May 2020 Banner 9 Page 242 of 290

7b. Would you say you are leaning toward Donald Trump or leaning toward Joe Biden?
Total
---------
Jobs-Econ
---------
Healthcare
---------
Corona-
virus
---------
Nat'l-Sec
---------
Educat
---------
Guns
---------
Trade
---------
Climate
---------
Immigrt
---------
Impeach-
Scandal
---------
Other
---------
600 264 190 271 77 71 47 31 79 72 39 15
100.00% 100.00% 100.00% 100.00% 100.00% 100.00% 100.00% 100.00% 100.00% 100.00% 100.00% 100.00%
26 12 10 10 - 5 1 1 4 3 2 2
4.33% 4.55% 5.26% 3.69% 7.04% 2.13% 3.23% 5.06% 4.17% 5.13% 13.33%
2 1 - 1 - - 1 - - 1 - -
0.33% 0.38% 0.37% 2.13% 1.39%
21 10 8 8 - 4 - 1 3 2 2 2
3.50% 3.79% 4.21% 2.95% 5.63% 3.23% 3.80% 2.78% 5.13% 13.33%
3 1 2 1 - 1 - - 1 - - -
0.50% 0.38% 1.05% 0.37% 1.41% 1.27%
ISSUE PRIORITY Q13
------------------------------------------------------------------------------------------------------------------------
Total
Total Answering
LEAN TRUMP
HARD UNDECIDED
LEAN BIDEN
Restoration PAC, Pennsylvania Statewide - May 2020 Banner 9 Page 243 of 290

7. Biden Ballot Summary
Total
---------
Jobs-Econ
---------
Healthcare
---------
Corona-
virus
---------
Nat'l-Sec
---------
Educat
---------
Guns
---------
Trade
---------
Climate
---------
Immigrt
---------
Impeach-
Scandal
---------
Other
---------
600 264 190 271 77 71 47 31 79 72 39 15
100.00% 100.00% 100.00% 100.00% 100.00% 100.00% 100.00% 100.00% 100.00% 100.00% 100.00% 100.00%
600 264 190 271 77 71 47 31 79 72 39 15
100.00% 100.00% 100.00% 100.00% 100.00% 100.00% 100.00% 100.00% 100.00% 100.00% 100.00% 100.00%
303 180 66 99 60 34 16 26 12 61 22 8
50.50% 68.18% 34.74% 36.53% 77.92% 47.89% 34.04% 83.87% 15.19% 84.72% 56.41% 53.33%
21 10 8 8 - 4 - 1 3 2 2 2
3.50% 3.79% 4.21% 2.95% 5.63% 3.23% 3.80% 2.78% 5.13% 13.33%
276 74 116 164 17 33 31 4 64 9 15 5
46.00% 28.03% 61.05% 60.52% 22.08% 46.48% 65.96% 12.90% 81.01% 12.50% 38.46% 33.33%
Total Answering
ALL TRUMP
ALL UNDECIDED
ALL BIDEN
ISSUE PRIORITY Q13
------------------------------------------------------------------------------------------------------------------------
Total
Restoration PAC, Pennsylvania Statewide - May 2020 Banner 9 Page 244 of 290

8. Do you approve or disapprove of the way President Trump is handling the Coronavirus crisis?
Total
---------
Jobs-Econ
---------
Healthcare
---------
Corona-
virus
---------
Nat'l-Sec
---------
Educat
---------
Guns
---------
Trade
---------
Climate
---------
Immigrt
---------
Impeach-
Scandal
---------
Other
---------
600 264 190 271 77 71 47 31 79 72 39 15
100.00% 100.00% 100.00% 100.00% 100.00% 100.00% 100.00% 100.00% 100.00% 100.00% 100.00% 100.00%
600 264 190 271 77 71 47 31 79 72 39 15
100.00% 100.00% 100.00% 100.00% 100.00% 100.00% 100.00% 100.00% 100.00% 100.00% 100.00% 100.00%
222 124 54 71 41 26 12 22 7 46 19 6
37.00% 46.97% 28.42% 26.20% 53.25% 36.62% 25.53% 70.97% 8.86% 63.89% 48.72% 40.00%
89 57 16 31 16 11 4 5 5 14 4 6
14.83% 21.59% 8.42% 11.44% 20.78% 15.49% 8.51% 16.13% 6.33% 19.44% 10.26% 40.00%
24 8 12 12 3 1 3 - 4 1 1 1
4.00% 3.03% 6.32% 4.43% 3.90% 1.41% 6.38% 5.06% 1.39% 2.56% 6.67%
253 70 104 150 15 31 28 4 63 9 14 2
42.17% 26.52% 54.74% 55.35% 19.48% 43.66% 59.57% 12.90% 79.75% 12.50% 35.90% 13.33%
12 5 4 7 2 2 - - - 2 1 -
2.00% 1.89% 2.11% 2.58% 2.60% 2.82% 2.78% 2.56%
311 181 70 102 57 37 16 27 12 60 23 12
51.83% 68.56% 36.84% 37.64% 74.03% 52.11% 34.04% 87.10% 15.19% 83.33% 58.97% 80.00%
277 78 116 162 18 32 31 4 67 10 15 3
46.17% 29.55% 61.05% 59.78% 23.38% 45.07% 65.96% 12.90% 84.81% 13.89% 38.46% 20.00%
SOMEWHAT DISAPPROVE
STRONGLY DISAPPROVE
DON’T KNOW/NO ANSWER
Total Approve
Total Disapprove
ISSUE PRIORITY Q13
------------------------------------------------------------------------------------------------------------------------
Total
Total Answering
STRONGLY APPROVE
SOMEWHAT APPROVE
Restoration PAC, Pennsylvania Statewide - May 2020 Banner 9 Page 245 of 290

CORONAVIRUS 1. With over 60,000 Americans dead from the pandemic, how worried are you that you, or someone close to you, will be infected with coronavirus?
Total
---------
Jobs-Econ
---------
Healthcare
---------
Corona-
virus
---------
Nat'l-Sec
---------
Educat
---------
Guns
---------
Trade
---------
Climate
---------
Immigrt
---------
Impeach-
Scandal
---------
Other
---------
600 264 190 271 77 71 47 31 79 72 39 15
100.00% 100.00% 100.00% 100.00% 100.00% 100.00% 100.00% 100.00% 100.00% 100.00% 100.00% 100.00%
600 264 190 271 77 71 47 31 79 72 39 15
100.00% 100.00% 100.00% 100.00% 100.00% 100.00% 100.00% 100.00% 100.00% 100.00% 100.00% 100.00%
168 93 40 41 32 23 15 15 9 32 16 6
28.00% 35.23% 21.05% 15.13% 41.56% 32.39% 31.91% 48.39% 11.39% 44.44% 41.03% 40.00%
223 104 63 107 34 24 11 11 26 30 16 5
37.17% 39.39% 33.16% 39.48% 44.16% 33.80% 23.40% 35.48% 32.91% 41.67% 41.03% 33.33%
209 67 87 123 11 24 21 5 44 10 7 4
34.83% 25.38% 45.79% 45.39% 14.29% 33.80% 44.68% 16.13% 55.70% 13.89% 17.95% 26.67%
SOMEWHAT WORRIED
VERY WORRIED
ISSUE PRIORITY Q13
------------------------------------------------------------------------------------------------------------------------
Total
Total Answering
NOT WORRIED
Restoration PAC, Pennsylvania Statewide - May 2020 Banner 9 Page 246 of 290

CORONAVIRUS 2. Which statement do you agree with, or agree with more: "It's time for people to get back to work." or "It's too early to lift stay-at-home restrictions."
Total
---------
Jobs-Econ
---------
Healthcare
---------
Corona-
virus
---------
Nat'l-Sec
---------
Educat
---------
Guns
---------
Trade
---------
Climate
---------
Immigrt
---------
Impeach-
Scandal
---------
Other
---------
600 264 190 271 77 71 47 31 79 72 39 15
100.00% 100.00% 100.00% 100.00% 100.00% 100.00% 100.00% 100.00% 100.00% 100.00% 100.00% 100.00%
600 264 190 271 77 71 47 31 79 72 39 15
100.00% 100.00% 100.00% 100.00% 100.00% 100.00% 100.00% 100.00% 100.00% 100.00% 100.00% 100.00%
309 184 84 87 62 34 16 24 16 56 21 11
51.50% 69.70% 44.21% 32.10% 80.52% 47.89% 34.04% 77.42% 20.25% 77.78% 53.85% 73.33%
291 80 106 184 15 37 31 7 63 16 18 4
48.50% 30.30% 55.79% 67.90% 19.48% 52.11% 65.96% 22.58% 79.75% 22.22% 46.15% 26.67%
ISSUE PRIORITY Q13
------------------------------------------------------------------------------------------------------------------------
Total
Total Answering
WORK
STAY HOME
Restoration PAC, Pennsylvania Statewide - May 2020 Banner 9 Page 247 of 290

Total
---------
Jobs-Econ
---------
Healthcare
---------
Corona-
virus
---------
Nat'l-Sec
---------
Educat
---------
Guns
---------
Trade
---------
Climate
---------
Immigrt
---------
Impeach-
Scandal
---------
Other
---------
600 264 190 271 77 71 47 31 79 72 39 15
100.00% 100.00% 100.00% 100.00% 100.00% 100.00% 100.00% 100.00% 100.00% 100.00% 100.00% 100.00%
600 264 190 271 77 71 47 31 79 72 39 15
100.00% 100.00% 100.00% 100.00% 100.00% 100.00% 100.00% 100.00% 100.00% 100.00% 100.00% 100.00%
301 177 78 87 60 33 17 25 16 54 24 9
50.17% 67.05% 41.05% 32.10% 77.92% 46.48% 36.17% 80.65% 20.25% 75.00% 61.54% 60.00%
299 87 112 184 17 38 30 6 63 18 15 6
49.83% 32.95% 58.95% 67.90% 22.08% 53.52% 63.83% 19.35% 79.75% 25.00% 38.46% 40.00%
CORONAVIRUS 3. Which statement do you agree with, or agree with more: "We should re-open the economy, even if that means more people will get coronavirus." or "We should continue the shelter-in-place
restrictions, even if that means severe job losses and economic disruption."
Total Answering
OPEN/VIRUS
SHUTDOWN/JOBS
ISSUE PRIORITY Q13
------------------------------------------------------------------------------------------------------------------------
Total
Restoration PAC, Pennsylvania Statewide - May 2020 Banner 9 Page 248 of 290

Total
---------
Jobs-Econ
---------
Healthcare
---------
Corona-
virus
---------
Nat'l-Sec
---------
Educat
---------
Guns
---------
Trade
---------
Climate
---------
Immigrt
---------
Impeach-
Scandal
---------
Other
---------
600 264 190 271 77 71 47 31 79 72 39 15
100.00% 100.00% 100.00% 100.00% 100.00% 100.00% 100.00% 100.00% 100.00% 100.00% 100.00% 100.00%
600 264 190 271 77 71 47 31 79 72 39 15
100.00% 100.00% 100.00% 100.00% 100.00% 100.00% 100.00% 100.00% 100.00% 100.00% 100.00% 100.00%
235 66 104 134 16 31 22 5 48 10 15 5
39.17% 25.00% 54.74% 49.45% 20.78% 43.66% 46.81% 16.13% 60.76% 13.89% 38.46% 33.33%
285 159 63 94 56 31 18 22 14 60 22 9
47.50% 60.23% 33.16% 34.69% 72.73% 43.66% 38.30% 70.97% 17.72% 83.33% 56.41% 60.00%
80 39 23 43 5 9 7 4 17 2 2 1
13.33% 14.77% 12.11% 15.87% 6.49% 12.68% 14.89% 12.90% 21.52% 2.78% 5.13% 6.67%
10. Do you think it was fair or unfair that Democrat President Obama's administration investigated and surveilled Republican Donald Trump as both a presidential candidate and president-elect for allegedly colluding
with Russia?
ISSUE PRIORITY Q13
------------------------------------------------------------------------------------------------------------------------
Total
Total Answering
FAIR
NOT FAIR
DON'T KNOW
Restoration PAC, Pennsylvania Statewide - May 2020 Banner 9 Page 249 of 290

11a. If the election for US Congress were being held today, for whom would you vote.... the Republican candidate or the Democrat candidate?
Total
---------
Jobs-Econ
---------
Healthcare
---------
Corona-
virus
---------
Nat'l-Sec
---------
Educat
---------
Guns
---------
Trade
---------
Climate
---------
Immigrt
---------
Impeach-
Scandal
---------
Other
---------
600 264 190 271 77 71 47 31 79 72 39 15
100.00% 100.00% 100.00% 100.00% 100.00% 100.00% 100.00% 100.00% 100.00% 100.00% 100.00% 100.00%
600 264 190 271 77 71 47 31 79 72 39 15
100.00% 100.00% 100.00% 100.00% 100.00% 100.00% 100.00% 100.00% 100.00% 100.00% 100.00% 100.00%
248 144 59 82 53 26 14 20 10 45 20 7
41.33% 54.55% 31.05% 30.26% 68.83% 36.62% 29.79% 64.52% 12.66% 62.50% 51.28% 46.67%
34 22 6 17 2 2 1 3 2 8 2 -
5.67% 8.33% 3.16% 6.27% 2.60% 2.82% 2.13% 9.68% 2.53% 11.11% 5.13%
92 42 25 38 14 14 7 4 16 11 4 2
15.33% 15.91% 13.16% 14.02% 18.18% 19.72% 14.89% 12.90% 20.25% 15.28% 10.26% 13.33%
25 8 11 11 - 5 3 - 6 2 1 2
4.17% 3.03% 5.79% 4.06% 7.04% 6.38% 7.59% 2.78% 2.56% 13.33%
198 48 87 122 8 24 22 4 45 6 12 3
33.00% 18.18% 45.79% 45.02% 10.39% 33.80% 46.81% 12.90% 56.96% 8.33% 30.77% 20.00%
3 - 2 1 - - - - - - - 1
0.50% 1.05% 0.37% 6.67%
282 166 65 99 55 28 15 23 12 53 22 7
47.00% 62.88% 34.21% 36.53% 71.43% 39.44% 31.91% 74.19% 15.19% 73.61% 56.41% 46.67%
223 56 98 133 8 29 25 4 51 8 13 5
37.17% 21.21% 51.58% 49.08% 10.39% 40.85% 53.19% 12.90% 64.56% 11.11% 33.33% 33.33%
Total Republican
Total Democrat
ISSUE PRIORITY Q13
------------------------------------------------------------------------------------------------------------------------
Total
Total Answering
Definitely REPUBLICAN
Probably REPUBLICAN
UNDECIDED
Probably DEMOCRAT
Definitely DEMOCRAT
Refused
Restoration PAC, Pennsylvania Statewide - May 2020 Banner 9 Page 250 of 290

11b. Would you say you are leaning toward the Republican candidate or leaning toward the Democrat candidate?
Total
---------
Jobs-Econ
---------
Healthcare
---------
Corona-
virus
---------
Nat'l-Sec
---------
Educat
---------
Guns
---------
Trade
---------
Climate
---------
Immigrt
---------
Impeach-
Scandal
---------
Other
---------
600 264 190 271 77 71 47 31 79 72 39 15
100.00% 100.00% 100.00% 100.00% 100.00% 100.00% 100.00% 100.00% 100.00% 100.00% 100.00% 100.00%
95 42 27 39 14 14 7 4 16 11 4 3
15.83% 15.91% 14.21% 14.39% 18.18% 19.72% 14.89% 12.90% 20.25% 15.28% 10.26% 20.00%
14 5 2 2 4 5 1 2 1 5 - -
2.33% 1.89% 1.05% 0.74% 5.19% 7.04% 2.13% 6.45% 1.27% 6.94%
63 31 20 25 7 8 4 1 12 5 3 3
10.50% 11.74% 10.53% 9.23% 9.09% 11.27% 8.51% 3.23% 15.19% 6.94% 7.69% 20.00%
18 6 5 12 3 1 2 1 3 1 1 -
3.00% 2.27% 2.63% 4.43% 3.90% 1.41% 4.26% 3.23% 3.80% 1.39% 2.56%
ISSUE PRIORITY Q13
------------------------------------------------------------------------------------------------------------------------
Total
Total Answering
LEAN GOP
HARD UNDECIDED/NOT SURE
LEAN DEM
Restoration PAC, Pennsylvania Statewide - May 2020 Banner 9 Page 251 of 290

11. Summary Generic US Congress
Total
---------
Jobs-Econ
---------
Healthcare
---------
Corona-
virus
---------
Nat'l-Sec
---------
Educat
---------
Guns
---------
Trade
---------
Climate
---------
Immigrt
---------
Impeach-
Scandal
---------
Other
---------
600 264 190 271 77 71 47 31 79 72 39 15
100.00% 100.00% 100.00% 100.00% 100.00% 100.00% 100.00% 100.00% 100.00% 100.00% 100.00% 100.00%
600 264 190 271 77 71 47 31 79 72 39 15
100.00% 100.00% 100.00% 100.00% 100.00% 100.00% 100.00% 100.00% 100.00% 100.00% 100.00% 100.00%
296 171 67 101 59 33 16 25 13 58 22 7
49.33% 64.77% 35.26% 37.27% 76.62% 46.48% 34.04% 80.65% 16.46% 80.56% 56.41% 46.67%
63 31 20 25 7 8 4 1 12 5 3 3
10.50% 11.74% 10.53% 9.23% 9.09% 11.27% 8.51% 3.23% 15.19% 6.94% 7.69% 20.00%
241 62 103 145 11 30 27 5 54 9 14 5
40.17% 23.48% 54.21% 53.51% 14.29% 42.25% 57.45% 16.13% 68.35% 12.50% 35.90% 33.33%
Total
Total Answering
ALL GOP
HARD UNDECIDED
ALL DEM
ISSUE PRIORITY Q13
------------------------------------------------------------------------------------------------------------------------
Restoration PAC, Pennsylvania Statewide - May 2020 Banner 9 Page 252 of 290

12. Age
Total
---------
Jobs-Econ
---------
Healthcare
---------
Corona-
virus
---------
Nat'l-Sec
---------
Educat
---------
Guns
---------
Trade
---------
Climate
---------
Immigrt
---------
Impeach-
Scandal
---------
Other
---------
600 264 190 271 77 71 47 31 79 72 39 15
100.00% 100.00% 100.00% 100.00% 100.00% 100.00% 100.00% 100.00% 100.00% 100.00% 100.00% 100.00%
600 264 190 271 77 71 47 31 79 72 39 15
100.00% 100.00% 100.00% 100.00% 100.00% 100.00% 100.00% 100.00% 100.00% 100.00% 100.00% 100.00%
34 13 12 15 3 4 3 1 6 1 2 1
5.67% 4.92% 6.32% 5.54% 3.90% 5.63% 6.38% 3.23% 7.59% 1.39% 5.13% 6.67%
81 35 20 37 10 8 6 6 10 16 3 3
13.50% 13.26% 10.53% 13.65% 12.99% 11.27% 12.77% 19.35% 12.66% 22.22% 7.69% 20.00%
91 36 30 43 12 16 3 4 14 11 5 1
15.17% 13.64% 15.79% 15.87% 15.58% 22.54% 6.38% 12.90% 17.72% 15.28% 12.82% 6.67%
98 54 27 52 19 5 6 7 9 8 4 1
16.33% 20.45% 14.21% 19.19% 24.68% 7.04% 12.77% 22.58% 11.39% 11.11% 10.26% 6.67%
118 57 43 44 12 17 11 6 16 16 8 2
19.67% 21.59% 22.63% 16.24% 15.58% 23.94% 23.40% 19.35% 20.25% 22.22% 20.51% 13.33%
155 58 49 70 18 18 16 6 21 19 16 6
25.83% 21.97% 25.79% 25.83% 23.38% 25.35% 34.04% 19.35% 26.58% 26.39% 41.03% 40.00%
23 11 9 10 3 3 2 1 3 1 1 1
3.83% 4.17% 4.74% 3.69% 3.90% 4.23% 4.26% 3.23% 3.80% 1.39% 2.56% 6.67%
115 48 32 52 13 12 9 7 16 17 5 4
19.17% 18.18% 16.84% 19.19% 16.88% 16.90% 19.15% 22.58% 20.25% 23.61% 12.82% 26.67%
189 90 57 95 31 21 9 11 23 19 9 2
31.50% 34.09% 30.00% 35.06% 40.26% 29.58% 19.15% 35.48% 29.11% 26.39% 23.08% 13.33%
273 115 92 114 30 35 27 12 37 35 24 8
45.50% 43.56% 48.42% 42.07% 38.96% 49.30% 57.45% 38.71% 46.84% 48.61% 61.54% 53.33%
25-34
35-44
45-54
55-64
65+
Refused
Young Adult 18-34
Family Age 35-54
Seniors 55+
ISSUE PRIORITY Q13
------------------------------------------------------------------------------------------------------------------------
Total
Total Answering
18-24
Restoration PAC, Pennsylvania Statewide - May 2020 Banner 9 Page 253 of 290

13. Which two of the following issues do you believe are the most important issues facing the country? [Select up to 2]
Total
---------
Jobs-Econ
---------
Healthcare
---------
Corona-
virus
---------
Nat'l-Sec
---------
Educat
---------
Guns
---------
Trade
---------
Climate
---------
Immigrt
---------
Impeach-
Scandal
---------
Other
---------
600 264 190 271 77 71 47 31 79 72 39 15
100.00% 100.00% 100.00% 100.00% 100.00% 100.00% 100.00% 100.00% 100.00% 100.00% 100.00% 100.00%
600 264 190 271 77 71 47 31 79 72 39 15
100.00% 100.00% 100.00% 100.00% 100.00% 100.00% 100.00% 100.00% 100.00% 100.00% 100.00% 100.00%
264 264 58 90 22 21 6 10 11 21 12 3
44.00% 100.00% 30.53% 33.21% 28.57% 29.58% 12.77% 32.26% 13.92% 29.17% 30.77% 20.00%
190 58 190 64 5 17 8 1 24 6 3 -
31.67% 21.97% 100.00% 23.62% 6.49% 23.94% 17.02% 3.23% 30.38% 8.33% 7.69%
271 90 64 271 19 14 15 5 29 13 12 -
45.17% 34.09% 33.68% 100.00% 24.68% 19.72% 31.91% 16.13% 36.71% 18.06% 30.77%
77 22 5 19 77 4 1 6 4 10 2 2
12.83% 8.33% 2.63% 7.01% 100.00% 5.63% 2.13% 19.35% 5.06% 13.89% 5.13% 13.33%
71 21 17 14 4 71 3 1 3 4 1 1
11.83% 7.95% 8.95% 5.17% 5.19% 100.00% 6.38% 3.23% 3.80% 5.56% 2.56% 6.67%
47 6 8 15 1 3 47 4 4 3 2 -
7.83% 2.27% 4.21% 5.54% 1.30% 4.23% 100.00% 12.90% 5.06% 4.17% 5.13%
31 10 1 5 6 1 4 31 2 1 1 -
5.17% 3.79% 0.53% 1.85% 7.79% 1.41% 8.51% 100.00% 2.53% 1.39% 2.56%
79 11 24 29 4 3 4 2 79 1 - -
13.17% 4.17% 12.63% 10.70% 5.19% 4.23% 8.51% 6.45% 100.00% 1.39%
72 21 6 13 10 4 3 1 1 72 6 1
12.00% 7.95% 3.16% 4.80% 12.99% 5.63% 6.38% 3.23% 1.27% 100.00% 15.38% 6.67%
39 12 3 12 2 1 2 1 - 6 39 -
6.50% 4.55% 1.58% 4.43% 2.60% 1.41% 4.26% 3.23% 8.33% 100.00%
15 3 - - 2 1 - - - 1 - 15
2.50% 1.14% 2.60% 1.41% 1.39% 100.00%
FOREIGN TRADE
CLIMATE CHANGE
IMMIGRATION
IMPEACHMENT OR
INVESTIGATING GOVERNMENT
SOMETHING ELSE
ISSUE PRIORITY Q13
------------------------------------------------------------------------------------------------------------------------
Total
Total Answering
JOBS AND THE ECONOMY
HEALTH CARE
STOPPING CORONAVIRUS
NATIONAL SECURITY
EDUCATION
GUNS
Restoration PAC, Pennsylvania Statewide - May 2020 Banner 9 Page 254 of 290

14a. In politics today, do you generally consider yourself .... a republican, a democrat, an independent or something else?
Total
---------
Jobs-Econ
---------
Healthcare
---------
Corona-
virus
---------
Nat'l-Sec
---------
Educat
---------
Guns
---------
Trade
---------
Climate
---------
Immigrt
---------
Impeach-
Scandal
---------
Other
---------
600 264 190 271 77 71 47 31 79 72 39 15
100.00% 100.00% 100.00% 100.00% 100.00% 100.00% 100.00% 100.00% 100.00% 100.00% 100.00% 100.00%
600 264 190 271 77 71 47 31 79 72 39 15
100.00% 100.00% 100.00% 100.00% 100.00% 100.00% 100.00% 100.00% 100.00% 100.00% 100.00% 100.00%
225 129 50 76 43 27 14 16 13 41 17 6
37.50% 48.86% 26.32% 28.04% 55.84% 38.03% 29.79% 51.61% 16.46% 56.94% 43.59% 40.00%
34 17 6 15 3 5 2 5 3 5 1 2
5.67% 6.44% 3.16% 5.54% 3.90% 7.04% 4.26% 16.13% 3.80% 6.94% 2.56% 13.33%
119 57 40 53 19 19 3 2 19 13 5 2
19.83% 21.59% 21.05% 19.56% 24.68% 26.76% 6.38% 6.45% 24.05% 18.06% 12.82% 13.33%
36 12 17 22 - 4 2 3 4 2 1 2
6.00% 4.55% 8.95% 8.12% 5.63% 4.26% 9.68% 5.06% 2.78% 2.56% 13.33%
184 48 77 104 12 16 26 5 40 11 15 2
30.67% 18.18% 40.53% 38.38% 15.58% 22.54% 55.32% 16.13% 50.63% 15.28% 38.46% 13.33%
2 1 - 1 - - - - - - - 1
0.33% 0.38% 0.37% 6.67%
259 146 56 91 46 32 16 21 16 46 18 8
43.17% 55.30% 29.47% 33.58% 59.74% 45.07% 34.04% 67.74% 20.25% 63.89% 46.15% 53.33%
220 60 94 126 12 20 28 8 44 13 16 4
36.67% 22.73% 49.47% 46.49% 15.58% 28.17% 59.57% 25.81% 55.70% 18.06% 41.03% 26.67%
119 57 40 53 19 19 3 2 19 13 5 2
19.83% 21.59% 21.05% 19.56% 24.68% 26.76% 6.38% 6.45% 24.05% 18.06% 12.82% 13.33%
Not so Strong Republican
AN INDEPENDENT, OR
SOMETHING ELSE
Not so Strong DEMOCRAT
Strong DEMOCRAT
Refused
Total Republican
Total Democrat
Independent
ISSUE PRIORITY Q13
------------------------------------------------------------------------------------------------------------------------
Total
Total Answering
Strong REPUBLICAN
Restoration PAC, Pennsylvania Statewide - May 2020 Banner 9 Page 255 of 290

14b. Do you think of yourself closer to the Republican Party or Democratic Party?
Total
---------
Jobs-Econ
---------
Healthcare
---------
Corona-
virus
---------
Nat'l-Sec
---------
Educat
---------
Guns
---------
Trade
---------
Climate
---------
Immigrt
---------
Impeach-
Scandal
---------
Other
---------
600 264 190 271 77 71 47 31 79 72 39 15
100.00% 100.00% 100.00% 100.00% 100.00% 100.00% 100.00% 100.00% 100.00% 100.00% 100.00% 100.00%
121 58 40 54 19 19 3 2 19 13 5 3
20.17% 21.97% 21.05% 19.93% 24.68% 26.76% 6.38% 6.45% 24.05% 18.06% 12.82% 20.00%
35 25 8 13 7 4 2 2 - 7 1 -
5.83% 9.47% 4.21% 4.80% 9.09% 5.63% 4.26% 6.45% 9.72% 2.56%
58 29 21 24 9 8 1 - 9 6 3 2
9.67% 10.98% 11.05% 8.86% 11.69% 11.27% 2.13% 11.39% 8.33% 7.69% 13.33%
28 4 11 17 3 7 - - 10 - 1 1
4.67% 1.52% 5.79% 6.27% 3.90% 9.86% 12.66% 2.56% 6.67%
Total
Total Answering
LEAN REPUBLICAN
FIRM INDEPENDENT
LEAN DEMOCRAT
ISSUE PRIORITY Q13
------------------------------------------------------------------------------------------------------------------------
Restoration PAC, Pennsylvania Statewide - May 2020 Banner 9 Page 256 of 290

14. Party Summary
Total
---------
Jobs-Econ
---------
Healthcare
---------
Corona-
virus
---------
Nat'l-Sec
---------
Educat
---------
Guns
---------
Trade
---------
Climate
---------
Immigrt
---------
Impeach-
Scandal
---------
Other
---------
600 264 190 271 77 71 47 31 79 72 39 15
100.00% 100.00% 100.00% 100.00% 100.00% 100.00% 100.00% 100.00% 100.00% 100.00% 100.00% 100.00%
600 264 190 271 77 71 47 31 79 72 39 15
100.00% 100.00% 100.00% 100.00% 100.00% 100.00% 100.00% 100.00% 100.00% 100.00% 100.00% 100.00%
294 171 64 104 53 36 18 23 16 53 19 8
49.00% 64.77% 33.68% 38.38% 68.83% 50.70% 38.30% 74.19% 20.25% 73.61% 48.72% 53.33%
58 29 21 24 9 8 1 - 9 6 3 2
9.67% 10.98% 11.05% 8.86% 11.69% 11.27% 2.13% 11.39% 8.33% 7.69% 13.33%
248 64 105 143 15 27 28 8 54 13 17 5
41.33% 24.24% 55.26% 52.77% 19.48% 38.03% 59.57% 25.81% 68.35% 18.06% 43.59% 33.33%
ALL INDEPENDENT
ALL DEMOCRAT
ISSUE PRIORITY Q13
------------------------------------------------------------------------------------------------------------------------
Total
Total Answering
ALL REPUBLICAN
Restoration PAC, Pennsylvania Statewide - May 2020 Banner 9 Page 257 of 290

BALLOT. If a mail-in ballot was mailed to you, how likely would you be to vote by mail this fall, as opposed to voting in-person at your polling place?
Total
---------
Jobs-Econ
---------
Healthcare
---------
Corona-
virus
---------
Nat'l-Sec
---------
Educat
---------
Guns
---------
Trade
---------
Climate
---------
Immigrt
---------
Impeach-
Scandal
---------
Other
---------
600 264 190 271 77 71 47 31 79 72 39 15
100.00% 100.00% 100.00% 100.00% 100.00% 100.00% 100.00% 100.00% 100.00% 100.00% 100.00% 100.00%
600 264 190 271 77 71 47 31 79 72 39 15
100.00% 100.00% 100.00% 100.00% 100.00% 100.00% 100.00% 100.00% 100.00% 100.00% 100.00% 100.00%
84 31 23 47 5 14 5 6 10 8 6 4
14.00% 11.74% 12.11% 17.34% 6.49% 19.72% 10.64% 19.35% 12.66% 11.11% 15.38% 26.67%
247 78 98 143 20 25 23 6 55 14 12 4
41.17% 29.55% 51.58% 52.77% 25.97% 35.21% 48.94% 19.35% 69.62% 19.44% 30.77% 26.67%
269 155 69 81 52 32 19 19 14 50 21 7
44.83% 58.71% 36.32% 29.89% 67.53% 45.07% 40.43% 61.29% 17.72% 69.44% 53.85% 46.67%
ISSUE PRIORITY Q13
------------------------------------------------------------------------------------------------------------------------
Total
Total Answering
Somewhat likely to vote by mail
Very likely to vote by mail
Not likely/Would still vote at polling
place
Restoration PAC, Pennsylvania Statewide - May 2020 Banner 9 Page 258 of 290

15. What was the last grade you completed in school?
Total
---------
Jobs-Econ
---------
Healthcare
---------
Corona-
virus
---------
Nat'l-Sec
---------
Educat
---------
Guns
---------
Trade
---------
Climate
---------
Immigrt
---------
Impeach-
Scandal
---------
Other
---------
600 264 190 271 77 71 47 31 79 72 39 15
100.00% 100.00% 100.00% 100.00% 100.00% 100.00% 100.00% 100.00% 100.00% 100.00% 100.00% 100.00%
600 264 190 271 77 71 47 31 79 72 39 15
100.00% 100.00% 100.00% 100.00% 100.00% 100.00% 100.00% 100.00% 100.00% 100.00% 100.00% 100.00%
3 1 - 1 - 1 1 1 - - 1 -
0.50% 0.38% 0.37% 1.41% 2.13% 3.23% 2.56%
153 68 45 68 23 19 11 5 11 22 16 6
25.50% 25.76% 23.68% 25.09% 29.87% 26.76% 23.40% 16.13% 13.92% 30.56% 41.03% 40.00%
30 16 12 9 3 3 3 1 2 4 1 1
5.00% 6.06% 6.32% 3.32% 3.90% 4.23% 6.38% 3.23% 2.53% 5.56% 2.56% 6.67%
282 127 86 124 38 33 18 20 43 35 18 6
47.00% 48.11% 45.26% 45.76% 49.35% 46.48% 38.30% 64.52% 54.43% 48.61% 46.15% 40.00%
130 52 47 67 13 15 12 4 23 11 3 2
21.67% 19.70% 24.74% 24.72% 16.88% 21.13% 25.53% 12.90% 29.11% 15.28% 7.69% 13.33%
2 - - 2 - - 2 - - - - -
0.33% 0.74% 4.26%
156 69 45 69 23 20 12 6 11 22 17 6
26.00% 26.14% 23.68% 25.46% 29.87% 28.17% 25.53% 19.35% 13.92% 30.56% 43.59% 40.00%
312 143 98 133 41 36 21 21 45 39 19 7
52.00% 54.17% 51.58% 49.08% 53.25% 50.70% 44.68% 67.74% 56.96% 54.17% 48.72% 46.67%
130 52 47 67 13 15 12 4 23 11 3 2
21.67% 19.70% 24.74% 24.72% 16.88% 21.13% 25.53% 12.90% 29.11% 15.28% 7.69% 13.33%
College
College+
Total
Total Answering
GRADE SCHOOL [1-8]
HIGH SCHOOL [9-12]
TECHNICAL/VOCATIONAL
SCHOOL
COLLEGE
GRADUATE SCHOOL
REFUSED
High School
ISSUE PRIORITY Q13
------------------------------------------------------------------------------------------------------------------------
Restoration PAC, Pennsylvania Statewide - May 2020 Banner 9 Page 259 of 290

16. Thinking about where you live, do you consider it to be urban, suburban or rural?
Total
---------
Jobs-Econ
---------
Healthcare
---------
Corona-
virus
---------
Nat'l-Sec
---------
Educat
---------
Guns
---------
Trade
---------
Climate
---------
Immigrt
---------
Impeach-
Scandal
---------
Other
---------
600 264 190 271 77 71 47 31 79 72 39 15
100.00% 100.00% 100.00% 100.00% 100.00% 100.00% 100.00% 100.00% 100.00% 100.00% 100.00% 100.00%
600 264 190 271 77 71 47 31 79 72 39 15
100.00% 100.00% 100.00% 100.00% 100.00% 100.00% 100.00% 100.00% 100.00% 100.00% 100.00% 100.00%
103 41 38 44 7 16 11 6 16 9 10 1
17.17% 15.53% 20.00% 16.24% 9.09% 22.54% 23.40% 19.35% 20.25% 12.50% 25.64% 6.67%
299 132 85 148 37 31 20 14 43 38 14 10
49.83% 50.00% 44.74% 54.61% 48.05% 43.66% 42.55% 45.16% 54.43% 52.78% 35.90% 66.67%
196 90 66 77 33 24 16 11 20 25 15 4
32.67% 34.09% 34.74% 28.41% 42.86% 33.80% 34.04% 35.48% 25.32% 34.72% 38.46% 26.67%
2 1 1 2 - - - - - - - -
0.33% 0.38% 0.53% 0.74%
ISSUE PRIORITY Q13
------------------------------------------------------------------------------------------------------------------------
Total
Total Answering
URBAN
SUBURBAN
RURAL
DON'T KNOW
Restoration PAC, Pennsylvania Statewide - May 2020 Banner 9 Page 260 of 290

17. Gender
Total
---------
Jobs-Econ
---------
Healthcare
---------
Corona-
virus
---------
Nat'l-Sec
---------
Educat
---------
Guns
---------
Trade
---------
Climate
---------
Immigrt
---------
Impeach-
Scandal
---------
Other
---------
600 264 190 271 77 71 47 31 79 72 39 15
100.00% 100.00% 100.00% 100.00% 100.00% 100.00% 100.00% 100.00% 100.00% 100.00% 100.00% 100.00%
600 264 190 271 77 71 47 31 79 72 39 15
100.00% 100.00% 100.00% 100.00% 100.00% 100.00% 100.00% 100.00% 100.00% 100.00% 100.00% 100.00%
286 132 88 118 45 33 22 20 31 35 22 5
47.67% 50.00% 46.32% 43.54% 58.44% 46.48% 46.81% 64.52% 39.24% 48.61% 56.41% 33.33%
314 132 102 153 32 38 25 11 48 37 17 10
52.33% 50.00% 53.68% 56.46% 41.56% 53.52% 53.19% 35.48% 60.76% 51.39% 43.59% 66.67%
ISSUE PRIORITY Q13
------------------------------------------------------------------------------------------------------------------------
Total
Total Answering
Male
Female
Restoration PAC, Pennsylvania Statewide - May 2020 Banner 9 Page 261 of 290

Table of contents
Banner 10
Table market
Table q1
Table q2
Table q3
Table q4
Table q5
Table q6
Table q7a
Table q7b
Table q7Summ
Table q8
Table corona_1
Table corona_2
Table corona_3
Table q10
Table q11a
Table q11b
Table q11_Summ
Table age
Table q13
Table q14a
Table q14b
Table q14_SUMM
14a. In politics today, do you generally consider yourself .... a republican, a democrat, an independent or something else?
14b. Do you think of yourself closer to the Republican Party or Democratic Party?
14. Party Summary
11b. Would you say you are leaning toward the Republican candidate or leaning toward the Democrat candidate?
11. Summary Generic US Congress
12. Age
13. Which two of the following issues do you believe are the most important issues facing the country? [Select up to 2]
CORONAVIRUS 1. With over 60,000 Americans dead from the pandemic, how worried are you that you, or someone close to you, will be infected with coronavirus?
CORONAVIRUS 2. Which statement do you agree with, or agree with more: "It's time for people to get back to work." or "It's too early to lift stay-at-home restrictions."
CORONAVIRUS 3. Which statement do you agree with, or agree with more: "We should re-open the economy, even if that means more people will get coronavirus." or "We
should continue the shelter-in-place restrictions, even if that means severe job losses and economic disruption."
10. Do you think it was fair or unfair that Democrat President Obama's administration investigated and surveilled Republican Donald Trump as both a presidential candidate and
president-elect for allegedly colluding with Russia?
11a. If the election for US Congress were being held today, for whom would you vote.... the Republican candidate or the Democrat candidate?
Media Market
1. Thinking ahead to the November election, how likely would you say you are to vote in these elections? Would you say you are…
2. Do you think the country is going in the right direction, or have things pretty seriously gone off on the wrong track?
3. Do you think the economy is going in the right direction, or have things pretty seriously gone off on the wrong track?
4. Do you approve or disapprove of the job Donald Trump is doing as President? Would that be strongly or somewhat (approve or disapprove)?
5. Do you think the impeachment of President Trump was good for the country, bad for the country, or did the impeachment not really matter that much?
6. Do you have a favorable or unfavorable impression of Donald Trump?
7a. If the election for President were being held today, and the candidates were Donald Trump and Joe Biden, for whom would you vote?
7b. Would you say you are leaning toward Donald Trump or leaning toward Joe Biden?
7. Biden Ballot Summary
8. Do you approve or disapprove of the way President Trump is handling the Coronavirus crisis?
Restoration PAC, Pennsylvania Statewide - May 2020 Banner 10 Page 262 of 290

Table ballot
Table q15
Table q16
Table q17
16. Thinking about where you live, do you consider it to be urban, suburban or rural?
17. Gender
BALLOT. If a mail-in ballot was mailed to you, how likely would you be to vote by mail this fall, as opposed to voting in-person at your polling place?
15. What was the last grade you completed in school?
Restoration PAC, Pennsylvania Statewide - May 2020 Banner 10 Page 263 of 290

Media Market
Total
---------
NOT
WORRIED
---------
SOMEWHAT
WORRIED
---------
VERY
WORRIED
---------
BACK TO
WORK
---------
STAY HOME
---------
OPEN/MORE
VIRUS
---------
SHUTDOWN/
JOB LOSS
-----------
SOMEWHAT
LIKELY MAIL
-----------
VERY
LIKELY MAIL
-----------
POLLING
PLACE
---------
600 168 223 209 309 291 301 299 84 247 269
100.00% 100.00% 100.00% 100.00% 100.00% 100.00% 100.00% 100.00% 100.00% 100.00% 100.00%
600 168 223 209 309 291 301 299 84 247 269
100.00% 100.00% 100.00% 100.00% 100.00% 100.00% 100.00% 100.00% 100.00% 100.00% 100.00%
3 2 1 - 2 1 1 2 - 1 2
0.50% 1.19% 0.45% 0.65% 0.34% 0.33% 0.67% 0.40% 0.74%
248 56 85 107 106 142 105 143 37 111 100
41.33% 33.33% 38.12% 51.20% 34.30% 48.80% 34.88% 47.83% 44.05% 44.94% 37.17%
132 48 45 39 76 56 72 60 20 58 54
22.00% 28.57% 20.18% 18.66% 24.60% 19.24% 23.92% 20.07% 23.81% 23.48% 20.07%
1 - 1 - 1 - 1 - - - 1
0.17% 0.45% 0.32% 0.33% 0.37%
2 1 1 - 2 - 2 - 1 - 1
0.33% 0.60% 0.45% 0.65% 0.66% 1.19% 0.37%
19 2 10 7 12 7 11 8 5 3 11
3.17% 1.19% 4.48% 3.35% 3.88% 2.41% 3.65% 2.68% 5.95% 1.21% 4.09%
5 3 1 1 3 2 3 2 - 2 3
0.83% 1.79% 0.45% 0.48% 0.97% 0.69% 1.00% 0.67% 0.81% 1.12%
2 - 2 - 1 1 1 1 1 - 1
0.33% 0.90% 0.32% 0.34% 0.33% 0.33% 1.19% 0.37%
89 31 36 22 58 31 55 34 10 35 44
14.83% 18.45% 16.14% 10.53% 18.77% 10.65% 18.27% 11.37% 11.90% 14.17% 16.36%
33 13 14 6 23 10 23 10 4 8 21
5.50% 7.74% 6.28% 2.87% 7.44% 3.44% 7.64% 3.34% 4.76% 3.24% 7.81%
66 12 27 27 25 41 27 39 6 29 31
11.00% 7.14% 12.11% 12.92% 8.09% 14.09% 8.97% 13.04% 7.14% 11.74% 11.52%
511 - WASHINGTON, DC
(HAGRSTWN)
514 - BUFFALO
516 - ERIE
536 - YOUNGSTOWN
565 - ELMIRA (CORNING)
566 - HARRISBURG-LNCSTR-
LEB-YORK
574 - JOHNSTOWN-ALTOONA-
ST COLGE
577 - WILKES BARRE-
SCRANTON-HZTN
CORONA WORRY
--------------------------------
WORK/HOME
---------------------
OPENING ECONOMY
-----------------------
MAIL BALLOT
-----------------------------------
Total
Total Answering
501 - NEW YORK
504 - PHILADELPHIA
508 - PITTSBURGH
Restoration PAC, Pennsylvania Statewide - May 2020 Banner 10 Page 264 of 290

1. Thinking ahead to the November election, how likely would you say you are to vote in these elections? Would you say you are…
Total
---------
NOT
WORRIED
---------
SOMEWHAT
WORRIED
---------
VERY
WORRIED
---------
BACK TO
WORK
---------
STAY HOME
---------
OPEN/MORE
VIRUS
---------
SHUTDOWN/
JOB LOSS
-----------
SOMEWHAT
LIKELY MAIL
-----------
VERY
LIKELY MAIL
-----------
POLLING
PLACE
---------
600 168 223 209 309 291 301 299 84 247 269
100.00% 100.00% 100.00% 100.00% 100.00% 100.00% 100.00% 100.00% 100.00% 100.00% 100.00%
600 168 223 209 309 291 301 299 84 247 269
100.00% 100.00% 100.00% 100.00% 100.00% 100.00% 100.00% 100.00% 100.00% 100.00% 100.00%
579 164 215 200 303 276 295 284 78 236 265
96.50% 97.62% 96.41% 95.69% 98.06% 94.85% 98.01% 94.98% 92.86% 95.55% 98.51%
21 4 8 9 6 15 6 15 6 11 4
3.50% 2.38% 3.59% 4.31% 1.94% 5.15% 1.99% 5.02% 7.14% 4.45% 1.49%
WORK/HOME
---------------------
OPENING ECONOMY
-----------------------
MAIL BALLOT
-----------------------------------
Total
Total Answering
VERY LIKELY
SOMEWHAT LIKELY
CORONA WORRY
--------------------------------
Restoration PAC, Pennsylvania Statewide - May 2020 Banner 10 Page 265 of 290

2. Do you think the country is going in the right direction, or have things pretty seriously gone off on the wrong track?
Total
---------
NOT
WORRIED
---------
SOMEWHAT
WORRIED
---------
VERY
WORRIED
---------
BACK TO
WORK
---------
STAY HOME
---------
OPEN/MORE
VIRUS
---------
SHUTDOWN/
JOB LOSS
-----------
SOMEWHAT
LIKELY MAIL
-----------
VERY
LIKELY MAIL
-----------
POLLING
PLACE
---------
600 168 223 209 309 291 301 299 84 247 269
100.00% 100.00% 100.00% 100.00% 100.00% 100.00% 100.00% 100.00% 100.00% 100.00% 100.00%
600 168 223 209 309 291 301 299 84 247 269
100.00% 100.00% 100.00% 100.00% 100.00% 100.00% 100.00% 100.00% 100.00% 100.00% 100.00%
230 105 93 32 194 36 192 38 33 34 163
38.33% 62.50% 41.70% 15.31% 62.78% 12.37% 63.79% 12.71% 39.29% 13.77% 60.59%
339 53 117 169 95 244 89 250 46 201 92
56.50% 31.55% 52.47% 80.86% 30.74% 83.85% 29.57% 83.61% 54.76% 81.38% 34.20%
27 8 12 7 16 11 16 11 3 11 13
4.50% 4.76% 5.38% 3.35% 5.18% 3.78% 5.32% 3.68% 3.57% 4.45% 4.83%
4 2 1 1 4 - 4 - 2 1 1
0.67% 1.19% 0.45% 0.48% 1.29% 1.33% 2.38% 0.40% 0.37%
Total
Total Answering
RIGHT DIRECTION
WRONG TRACK
DON’T KNOW
REFUSED
CORONA WORRY
--------------------------------
WORK/HOME
---------------------
OPENING ECONOMY
-----------------------
MAIL BALLOT
-----------------------------------
Restoration PAC, Pennsylvania Statewide - May 2020 Banner 10 Page 266 of 290

3. Do you think the economy is going in the right direction, or have things pretty seriously gone off on the wrong track?
Total
---------
NOT
WORRIED
---------
SOMEWHAT
WORRIED
---------
VERY
WORRIED
---------
BACK TO
WORK
---------
STAY HOME
---------
OPEN/MORE
VIRUS
---------
SHUTDOWN/
JOB LOSS
-----------
SOMEWHAT
LIKELY MAIL
-----------
VERY
LIKELY MAIL
-----------
POLLING
PLACE
---------
600 168 223 209 309 291 301 299 84 247 269
100.00% 100.00% 100.00% 100.00% 100.00% 100.00% 100.00% 100.00% 100.00% 100.00% 100.00%
600 168 223 209 309 291 301 299 84 247 269
100.00% 100.00% 100.00% 100.00% 100.00% 100.00% 100.00% 100.00% 100.00% 100.00% 100.00%
202 86 77 39 161 41 159 43 27 41 134
33.67% 51.19% 34.53% 18.66% 52.10% 14.09% 52.82% 14.38% 32.14% 16.60% 49.81%
362 71 128 163 131 231 125 237 45 196 121
60.33% 42.26% 57.40% 77.99% 42.39% 79.38% 41.53% 79.26% 53.57% 79.35% 44.98%
32 9 17 6 13 19 14 18 11 9 12
5.33% 5.36% 7.62% 2.87% 4.21% 6.53% 4.65% 6.02% 13.10% 3.64% 4.46%
4 2 1 1 4 - 3 1 1 1 2
0.67% 1.19% 0.45% 0.48% 1.29% 1.00% 0.33% 1.19% 0.40% 0.74%
MAIL BALLOT
-----------------------------------
Total
Total Answering
RIGHT DIRECTION
WRONG TRACK
DON’T KNOW
REFUSED
CORONA WORRY
--------------------------------
WORK/HOME
---------------------
OPENING ECONOMY
-----------------------
Restoration PAC, Pennsylvania Statewide - May 2020 Banner 10 Page 267 of 290

4. Do you approve or disapprove of the job Donald Trump is doing as President? Would that be strongly or somewhat (approve or disapprove)?
Total
---------
NOT
WORRIED
---------
SOMEWHAT
WORRIED
---------
VERY
WORRIED
---------
BACK TO
WORK
---------
STAY HOME
---------
OPEN/MORE
VIRUS
---------
SHUTDOWN/
JOB LOSS
-----------
SOMEWHAT
LIKELY MAIL
-----------
VERY
LIKELY MAIL
-----------
POLLING
PLACE
---------
600 168 223 209 309 291 301 299 84 247 269
100.00% 100.00% 100.00% 100.00% 100.00% 100.00% 100.00% 100.00% 100.00% 100.00% 100.00%
600 168 223 209 309 291 301 299 84 247 269
100.00% 100.00% 100.00% 100.00% 100.00% 100.00% 100.00% 100.00% 100.00% 100.00% 100.00%
268 126 102 40 233 35 230 38 32 42 194
44.67% 75.00% 45.74% 19.14% 75.40% 12.03% 76.41% 12.71% 38.10% 17.00% 72.12%
46 23 14 9 34 12 32 14 9 10 27
7.67% 13.69% 6.28% 4.31% 11.00% 4.12% 10.63% 4.68% 10.71% 4.05% 10.04%
18 2 11 5 6 12 8 10 3 8 7
3.00% 1.19% 4.93% 2.39% 1.94% 4.12% 2.66% 3.34% 3.57% 3.24% 2.60%
256 15 93 148 31 225 27 229 37 182 37
42.67% 8.93% 41.70% 70.81% 10.03% 77.32% 8.97% 76.59% 44.05% 73.68% 13.75%
12 2 3 7 5 7 4 8 3 5 4
2.00% 1.19% 1.35% 3.35% 1.62% 2.41% 1.33% 2.68% 3.57% 2.02% 1.49%
314 149 116 49 267 47 262 52 41 52 221
52.33% 88.69% 52.02% 23.44% 86.41% 16.15% 87.04% 17.39% 48.81% 21.05% 82.16%
274 17 104 153 37 237 35 239 40 190 44
45.67% 10.12% 46.64% 73.21% 11.97% 81.44% 11.63% 79.93% 47.62% 76.92% 16.36%
Total
Total Answering
STRONGLY APPROVE
SOMEWHAT APPROVE
SOMEWHAT DISAPPROVE
STRONGLY DISAPPROVE
DON’T KNOW/NO ANSWER
Total Approve
Total Disapprove
CORONA WORRY
--------------------------------
WORK/HOME
---------------------
OPENING ECONOMY
-----------------------
MAIL BALLOT
-----------------------------------
Restoration PAC, Pennsylvania Statewide - May 2020 Banner 10 Page 268 of 290

5. Do you think the impeachment of President Trump was good for the country, bad for the country, or did the impeachment not really matter that much?
Total
---------
NOT
WORRIED
---------
SOMEWHAT
WORRIED
---------
VERY
WORRIED
---------
BACK TO
WORK
---------
STAY HOME
---------
OPEN/MORE
VIRUS
---------
SHUTDOWN/
JOB LOSS
-----------
SOMEWHAT
LIKELY MAIL
-----------
VERY
LIKELY MAIL
-----------
POLLING
PLACE
---------
600 168 223 209 309 291 301 299 84 247 269
100.00% 100.00% 100.00% 100.00% 100.00% 100.00% 100.00% 100.00% 100.00% 100.00% 100.00%
600 168 223 209 309 291 301 299 84 247 269
100.00% 100.00% 100.00% 100.00% 100.00% 100.00% 100.00% 100.00% 100.00% 100.00% 100.00%
107 17 37 53 29 78 28 79 20 65 22
17.83% 10.12% 16.59% 25.36% 9.39% 26.80% 9.30% 26.42% 23.81% 26.32% 8.18%
289 119 117 53 222 67 217 72 33 65 191
48.17% 70.83% 52.47% 25.36% 71.84% 23.02% 72.09% 24.08% 39.29% 26.32% 71.00%
204 32 69 103 58 146 56 148 31 117 56
34.00% 19.05% 30.94% 49.28% 18.77% 50.17% 18.60% 49.50% 36.90% 47.37% 20.82%
CORONA WORRY
--------------------------------
WORK/HOME
---------------------
OPENING ECONOMY
-----------------------
MAIL BALLOT
-----------------------------------
Total
Total Answering
GOOD
BAD
DOESN'T MATTER/DON'T
KNOW
Restoration PAC, Pennsylvania Statewide - May 2020 Banner 10 Page 269 of 290

6. Do you have a favorable or unfavorable impression of Donald Trump?
Total
---------
NOT
WORRIED
---------
SOMEWHAT
WORRIED
---------
VERY
WORRIED
---------
BACK TO
WORK
---------
STAY HOME
---------
OPEN/MORE
VIRUS
---------
SHUTDOWN/
JOB LOSS
-----------
SOMEWHAT
LIKELY MAIL
-----------
VERY
LIKELY MAIL
-----------
POLLING
PLACE
---------
600 168 223 209 309 291 301 299 84 247 269
100.00% 100.00% 100.00% 100.00% 100.00% 100.00% 100.00% 100.00% 100.00% 100.00% 100.00%
600 168 223 209 309 291 301 299 84 247 269
100.00% 100.00% 100.00% 100.00% 100.00% 100.00% 100.00% 100.00% 100.00% 100.00% 100.00%
243 119 89 35 210 33 206 37 25 35 183
40.50% 70.83% 39.91% 16.75% 67.96% 11.34% 68.44% 12.37% 29.76% 14.17% 68.03%
53 21 20 12 44 9 43 10 10 11 32
8.83% 12.50% 8.97% 5.74% 14.24% 3.09% 14.29% 3.34% 11.90% 4.45% 11.90%
11 1 8 2 5 6 4 7 2 6 3
1.83% 0.60% 3.59% 0.96% 1.62% 2.06% 1.33% 2.34% 2.38% 2.43% 1.12%
24 7 6 11 8 16 7 17 4 12 8
4.00% 4.17% 2.69% 5.26% 2.59% 5.50% 2.33% 5.69% 4.76% 4.86% 2.97%
268 19 100 149 41 227 40 228 42 183 43
44.67% 11.31% 44.84% 71.29% 13.27% 78.01% 13.29% 76.25% 50.00% 74.09% 15.99%
- - - - - - - - - - -
1 1 - - 1 - 1 - 1 - -
0.17% 0.60% 0.32% 0.33% 1.19%
296 140 109 47 254 42 249 47 35 46 215
49.33% 83.33% 48.88% 22.49% 82.20% 14.43% 82.72% 15.72% 41.67% 18.62% 79.93%
292 26 106 160 49 243 47 245 46 195 51
48.67% 15.48% 47.53% 76.56% 15.86% 83.51% 15.61% 81.94% 54.76% 78.95% 18.96%
Somewhat UNFAVORABLE
Strongly UNFAVORABLE
DON’T KNOW/NOT SURE
REFUSED
Total Favorable
Total Unfavorable
CORONA WORRY
--------------------------------
WORK/HOME
---------------------
OPENING ECONOMY
-----------------------
MAIL BALLOT
-----------------------------------
Total
Total Answering
Strongly FAVORABLE
Somewhat FAVORABLE
NO OPINION
Restoration PAC, Pennsylvania Statewide - May 2020 Banner 10 Page 270 of 290

7a. If the election for President were being held today, and the candidates were Donald Trump and Joe Biden, for whom would you vote?
Total
---------
NOT
WORRIED
---------
SOMEWHAT
WORRIED
---------
VERY
WORRIED
---------
BACK TO
WORK
---------
STAY HOME
---------
OPEN/MORE
VIRUS
---------
SHUTDOWN/
JOB LOSS
-----------
SOMEWHAT
LIKELY MAIL
-----------
VERY
LIKELY MAIL
-----------
POLLING
PLACE
---------
600 168 223 209 309 291 301 299 84 247 269
100.00% 100.00% 100.00% 100.00% 100.00% 100.00% 100.00% 100.00% 100.00% 100.00% 100.00%
600 168 223 209 309 291 301 299 84 247 269
100.00% 100.00% 100.00% 100.00% 100.00% 100.00% 100.00% 100.00% 100.00% 100.00% 100.00%
286 135 110 41 248 38 245 41 32 42 212
47.67% 80.36% 49.33% 19.62% 80.26% 13.06% 81.40% 13.71% 38.10% 17.00% 78.81%
15 6 5 4 12 3 9 6 4 4 7
2.50% 3.57% 2.24% 1.91% 3.88% 1.03% 2.99% 2.01% 4.76% 1.62% 2.60%
22 7 8 7 11 11 9 13 6 9 7
3.67% 4.17% 3.59% 3.35% 3.56% 3.78% 2.99% 4.35% 7.14% 3.64% 2.60%
15 2 6 7 3 12 6 9 2 9 4
2.50% 1.19% 2.69% 3.35% 0.97% 4.12% 1.99% 3.01% 2.38% 3.64% 1.49%
258 17 92 149 32 226 29 229 39 182 37
43.00% 10.12% 41.26% 71.29% 10.36% 77.66% 9.63% 76.59% 46.43% 73.68% 13.75%
4 1 2 1 3 1 3 1 1 1 2
0.67% 0.60% 0.90% 0.48% 0.97% 0.34% 1.00% 0.33% 1.19% 0.40% 0.74%
301 141 115 45 260 41 254 47 36 46 219
50.17% 83.93% 51.57% 21.53% 84.14% 14.09% 84.39% 15.72% 42.86% 18.62% 81.41%
22 7 8 7 11 11 9 13 6 9 7
3.67% 4.17% 3.59% 3.35% 3.56% 3.78% 2.99% 4.35% 7.14% 3.64% 2.60%
273 19 98 156 35 238 35 238 41 191 41
45.50% 11.31% 43.95% 74.64% 11.33% 81.79% 11.63% 79.60% 48.81% 77.33% 15.24%
Total Trump
Total Undecided
Total Biden
MAIL BALLOT
-----------------------------------
Total
Total Answering
Definitely TRUMP
Probably TRUMP
UNDECIDED
Probably BIDEN
Definitely BIDEN
Refused
CORONA WORRY
--------------------------------
WORK/HOME
---------------------
OPENING ECONOMY
-----------------------
Restoration PAC, Pennsylvania Statewide - May 2020 Banner 10 Page 271 of 290

7b. Would you say you are leaning toward Donald Trump or leaning toward Joe Biden?
Total
---------
NOT
WORRIED
---------
SOMEWHAT
WORRIED
---------
VERY
WORRIED
---------
BACK TO
WORK
---------
STAY HOME
---------
OPEN/MORE
VIRUS
---------
SHUTDOWN/
JOB LOSS
-----------
SOMEWHAT
LIKELY MAIL
-----------
VERY
LIKELY MAIL
-----------
POLLING
PLACE
---------
600 168 223 209 309 291 301 299 84 247 269
100.00% 100.00% 100.00% 100.00% 100.00% 100.00% 100.00% 100.00% 100.00% 100.00% 100.00%
26 8 10 8 14 12 12 14 7 10 9
4.33% 4.76% 4.48% 3.83% 4.53% 4.12% 3.99% 4.68% 8.33% 4.05% 3.35%
2 2 - - 1 1 1 1 - 1 1
0.33% 1.19% 0.32% 0.34% 0.33% 0.33% 0.40% 0.37%
21 5 9 7 10 11 9 12 5 8 8
3.50% 2.98% 4.04% 3.35% 3.24% 3.78% 2.99% 4.01% 5.95% 3.24% 2.97%
3 1 1 1 3 - 2 1 2 1 -
0.50% 0.60% 0.45% 0.48% 0.97% 0.66% 0.33% 2.38% 0.40%
LEAN TRUMP
HARD UNDECIDED
LEAN BIDEN
CORONA WORRY
--------------------------------
WORK/HOME
---------------------
OPENING ECONOMY
-----------------------
MAIL BALLOT
-----------------------------------
Total
Total Answering
Restoration PAC, Pennsylvania Statewide - May 2020 Banner 10 Page 272 of 290

7. Biden Ballot Summary
Total
---------
NOT
WORRIED
---------
SOMEWHAT
WORRIED
---------
VERY
WORRIED
---------
BACK TO
WORK
---------
STAY HOME
---------
OPEN/MORE
VIRUS
---------
SHUTDOWN/
JOB LOSS
-----------
SOMEWHAT
LIKELY MAIL
-----------
VERY
LIKELY MAIL
-----------
POLLING
PLACE
---------
600 168 223 209 309 291 301 299 84 247 269
100.00% 100.00% 100.00% 100.00% 100.00% 100.00% 100.00% 100.00% 100.00% 100.00% 100.00%
600 168 223 209 309 291 301 299 84 247 269
100.00% 100.00% 100.00% 100.00% 100.00% 100.00% 100.00% 100.00% 100.00% 100.00% 100.00%
303 143 115 45 261 42 255 48 36 47 220
50.50% 85.12% 51.57% 21.53% 84.47% 14.43% 84.72% 16.05% 42.86% 19.03% 81.78%
21 5 9 7 10 11 9 12 5 8 8
3.50% 2.98% 4.04% 3.35% 3.24% 3.78% 2.99% 4.01% 5.95% 3.24% 2.97%
276 20 99 157 38 238 37 239 43 192 41
46.00% 11.90% 44.39% 75.12% 12.30% 81.79% 12.29% 79.93% 51.19% 77.73% 15.24%
ALL TRUMP
ALL UNDECIDED
ALL BIDEN
CORONA WORRY
--------------------------------
WORK/HOME
---------------------
OPENING ECONOMY
-----------------------
MAIL BALLOT
-----------------------------------
Total
Total Answering
Restoration PAC, Pennsylvania Statewide - May 2020 Banner 10 Page 273 of 290

8. Do you approve or disapprove of the way President Trump is handling the Coronavirus crisis?
Total
---------
NOT
WORRIED
---------
SOMEWHAT
WORRIED
---------
VERY
WORRIED
---------
BACK TO
WORK
---------
STAY HOME
---------
OPEN/MORE
VIRUS
---------
SHUTDOWN/
JOB LOSS
-----------
SOMEWHAT
LIKELY MAIL
-----------
VERY
LIKELY MAIL
-----------
POLLING
PLACE
---------
600 168 223 209 309 291 301 299 84 247 269
100.00% 100.00% 100.00% 100.00% 100.00% 100.00% 100.00% 100.00% 100.00% 100.00% 100.00%
600 168 223 209 309 291 301 299 84 247 269
100.00% 100.00% 100.00% 100.00% 100.00% 100.00% 100.00% 100.00% 100.00% 100.00% 100.00%
222 106 83 33 193 29 189 33 29 32 161
37.00% 63.10% 37.22% 15.79% 62.46% 9.97% 62.79% 11.04% 34.52% 12.96% 59.85%
89 38 34 17 68 21 65 24 10 23 56
14.83% 22.62% 15.25% 8.13% 22.01% 7.22% 21.59% 8.03% 11.90% 9.31% 20.82%
24 5 10 9 11 13 13 11 3 12 9
4.00% 2.98% 4.48% 4.31% 3.56% 4.47% 4.32% 3.68% 3.57% 4.86% 3.35%
253 17 88 148 33 220 30 223 40 176 37
42.17% 10.12% 39.46% 70.81% 10.68% 75.60% 9.97% 74.58% 47.62% 71.26% 13.75%
12 2 8 2 4 8 4 8 2 4 6
2.00% 1.19% 3.59% 0.96% 1.29% 2.75% 1.33% 2.68% 2.38% 1.62% 2.23%
311 144 117 50 261 50 254 57 39 55 217
51.83% 85.71% 52.47% 23.92% 84.47% 17.18% 84.39% 19.06% 46.43% 22.27% 80.67%
277 22 98 157 44 233 43 234 43 188 46
46.17% 13.10% 43.95% 75.12% 14.24% 80.07% 14.29% 78.26% 51.19% 76.11% 17.10%
STRONGLY APPROVE
SOMEWHAT APPROVE
SOMEWHAT DISAPPROVE
STRONGLY DISAPPROVE
DON’T KNOW/NO ANSWER
Total Approve
Total Disapprove
CORONA WORRY
--------------------------------
WORK/HOME
---------------------
OPENING ECONOMY
-----------------------
MAIL BALLOT
-----------------------------------
Total
Total Answering
Restoration PAC, Pennsylvania Statewide - May 2020 Banner 10 Page 274 of 290

CORONAVIRUS 1. With over 60,000 Americans dead from the pandemic, how worried are you that you, or someone close to you, will be infected with coronavirus?
Total
---------
NOT
WORRIED
---------
SOMEWHAT
WORRIED
---------
VERY
WORRIED
---------
BACK TO
WORK
---------
STAY HOME
---------
OPEN/MORE
VIRUS
---------
SHUTDOWN/
JOB LOSS
-----------
SOMEWHAT
LIKELY MAIL
-----------
VERY
LIKELY MAIL
-----------
POLLING
PLACE
---------
600 168 223 209 309 291 301 299 84 247 269
100.00% 100.00% 100.00% 100.00% 100.00% 100.00% 100.00% 100.00% 100.00% 100.00% 100.00%
600 168 223 209 309 291 301 299 84 247 269
100.00% 100.00% 100.00% 100.00% 100.00% 100.00% 100.00% 100.00% 100.00% 100.00% 100.00%
168 168 - - 149 19 145 23 23 22 123
28.00% 100.00% 48.22% 6.53% 48.17% 7.69% 27.38% 8.91% 45.72%
223 - 223 - 117 106 111 112 38 89 96
37.17% 100.00% 37.86% 36.43% 36.88% 37.46% 45.24% 36.03% 35.69%
209 - - 209 43 166 45 164 23 136 50
34.83% 100.00% 13.92% 57.04% 14.95% 54.85% 27.38% 55.06% 18.59%
OPENING ECONOMY
-----------------------
MAIL BALLOT
-----------------------------------
Total
Total Answering
NOT WORRIED
SOMEWHAT WORRIED
VERY WORRIED
CORONA WORRY
--------------------------------
WORK/HOME
---------------------
Restoration PAC, Pennsylvania Statewide - May 2020 Banner 10 Page 275 of 290

CORONAVIRUS 2. Which statement do you agree with, or agree with more: "It's time for people to get back to work." or "It's too early to lift stay-at-home restrictions."
Total
---------
NOT
WORRIED
---------
SOMEWHAT
WORRIED
---------
VERY
WORRIED
---------
BACK TO
WORK
---------
STAY HOME
---------
OPEN/MORE
VIRUS
---------
SHUTDOWN/
JOB LOSS
-----------
SOMEWHAT
LIKELY MAIL
-----------
VERY
LIKELY MAIL
-----------
POLLING
PLACE
---------
600 168 223 209 309 291 301 299 84 247 269
100.00% 100.00% 100.00% 100.00% 100.00% 100.00% 100.00% 100.00% 100.00% 100.00% 100.00%
600 168 223 209 309 291 301 299 84 247 269
100.00% 100.00% 100.00% 100.00% 100.00% 100.00% 100.00% 100.00% 100.00% 100.00% 100.00%
309 149 117 43 309 - 283 26 38 52 219
51.50% 88.69% 52.47% 20.57% 100.00% 94.02% 8.70% 45.24% 21.05% 81.41%
291 19 106 166 - 291 18 273 46 195 50
48.50% 11.31% 47.53% 79.43% 100.00% 5.98% 91.30% 54.76% 78.95% 18.59%
Total
Total Answering
WORK
STAY HOME
CORONA WORRY
--------------------------------
WORK/HOME
---------------------
OPENING ECONOMY
-----------------------
MAIL BALLOT
-----------------------------------
Restoration PAC, Pennsylvania Statewide - May 2020 Banner 10 Page 276 of 290

Total
---------
NOT
WORRIED
---------
SOMEWHAT
WORRIED
---------
VERY
WORRIED
---------
BACK TO
WORK
---------
STAY HOME
---------
OPEN/MORE
VIRUS
---------
SHUTDOWN/
JOB LOSS
-----------
SOMEWHAT
LIKELY MAIL
-----------
VERY
LIKELY MAIL
-----------
POLLING
PLACE
---------
600 168 223 209 309 291 301 299 84 247 269
100.00% 100.00% 100.00% 100.00% 100.00% 100.00% 100.00% 100.00% 100.00% 100.00% 100.00%
600 168 223 209 309 291 301 299 84 247 269
100.00% 100.00% 100.00% 100.00% 100.00% 100.00% 100.00% 100.00% 100.00% 100.00% 100.00%
301 145 111 45 283 18 301 - 40 49 212
50.17% 86.31% 49.78% 21.53% 91.59% 6.19% 100.00% 47.62% 19.84% 78.81%
299 23 112 164 26 273 - 299 44 198 57
49.83% 13.69% 50.22% 78.47% 8.41% 93.81% 100.00% 52.38% 80.16% 21.19%
CORONAVIRUS 3. Which statement do you agree with, or agree with more: "We should re-open the economy, even if that means more people will get coronavirus." or "We should continue the shelter-in-place
restrictions, even if that means severe job losses and economic disruption."
Total Answering
OPEN/VIRUS
SHUTDOWN/JOBS
CORONA WORRY
--------------------------------
WORK/HOME
---------------------
OPENING ECONOMY
-----------------------
MAIL BALLOT
-----------------------------------
Total
Restoration PAC, Pennsylvania Statewide - May 2020 Banner 10 Page 277 of 290

Total
---------
NOT
WORRIED
---------
SOMEWHAT
WORRIED
---------
VERY
WORRIED
---------
BACK TO
WORK
---------
STAY HOME
---------
OPEN/MORE
VIRUS
---------
SHUTDOWN/
JOB LOSS
-----------
SOMEWHAT
LIKELY MAIL
-----------
VERY
LIKELY MAIL
-----------
POLLING
PLACE
---------
600 168 223 209 309 291 301 299 84 247 269
100.00% 100.00% 100.00% 100.00% 100.00% 100.00% 100.00% 100.00% 100.00% 100.00% 100.00%
600 168 223 209 309 291 301 299 84 247 269
100.00% 100.00% 100.00% 100.00% 100.00% 100.00% 100.00% 100.00% 100.00% 100.00% 100.00%
235 26 85 124 47 188 46 189 43 149 43
39.17% 15.48% 38.12% 59.33% 15.21% 64.60% 15.28% 63.21% 51.19% 60.32% 15.99%
285 123 108 54 227 58 223 62 31 56 198
47.50% 73.21% 48.43% 25.84% 73.46% 19.93% 74.09% 20.74% 36.90% 22.67% 73.61%
80 19 30 31 35 45 32 48 10 42 28
13.33% 11.31% 13.45% 14.83% 11.33% 15.46% 10.63% 16.05% 11.90% 17.00% 10.41%
10. Do you think it was fair or unfair that Democrat President Obama's administration investigated and surveilled Republican Donald Trump as both a presidential candidate and president-elect for allegedly colluding
with Russia?
FAIR
NOT FAIR
DON'T KNOW
CORONA WORRY
--------------------------------
WORK/HOME
---------------------
OPENING ECONOMY
-----------------------
MAIL BALLOT
-----------------------------------
Total
Total Answering
Restoration PAC, Pennsylvania Statewide - May 2020 Banner 10 Page 278 of 290

11a. If the election for US Congress were being held today, for whom would you vote.... the Republican candidate or the Democrat candidate?
Total
---------
NOT
WORRIED
---------
SOMEWHAT
WORRIED
---------
VERY
WORRIED
---------
BACK TO
WORK
---------
STAY HOME
---------
OPEN/MORE
VIRUS
---------
SHUTDOWN/
JOB LOSS
-----------
SOMEWHAT
LIKELY MAIL
-----------
VERY
LIKELY MAIL
-----------
POLLING
PLACE
---------
600 168 223 209 309 291 301 299 84 247 269
100.00% 100.00% 100.00% 100.00% 100.00% 100.00% 100.00% 100.00% 100.00% 100.00% 100.00%
600 168 223 209 309 291 301 299 84 247 269
100.00% 100.00% 100.00% 100.00% 100.00% 100.00% 100.00% 100.00% 100.00% 100.00% 100.00%
248 121 87 40 210 38 206 42 29 41 178
41.33% 72.02% 39.01% 19.14% 67.96% 13.06% 68.44% 14.05% 34.52% 16.60% 66.17%
34 11 16 7 27 7 25 9 3 6 25
5.67% 6.55% 7.17% 3.35% 8.74% 2.41% 8.31% 3.01% 3.57% 2.43% 9.29%
92 20 44 28 44 48 41 51 13 45 34
15.33% 11.90% 19.73% 13.40% 14.24% 16.49% 13.62% 17.06% 15.48% 18.22% 12.64%
25 1 6 18 3 22 6 19 5 17 3
4.17% 0.60% 2.69% 8.61% 0.97% 7.56% 1.99% 6.35% 5.95% 6.88% 1.12%
198 13 70 115 23 175 21 177 32 137 29
33.00% 7.74% 31.39% 55.02% 7.44% 60.14% 6.98% 59.20% 38.10% 55.47% 10.78%
3 2 - 1 2 1 2 1 2 1 -
0.50% 1.19% 0.48% 0.65% 0.34% 0.66% 0.33% 2.38% 0.40%
282 132 103 47 237 45 231 51 32 47 203
47.00% 78.57% 46.19% 22.49% 76.70% 15.46% 76.74% 17.06% 38.10% 19.03% 75.46%
223 14 76 133 26 197 27 196 37 154 32
37.17% 8.33% 34.08% 63.64% 8.41% 67.70% 8.97% 65.55% 44.05% 62.35% 11.90%
Definitely REPUBLICAN
Probably REPUBLICAN
UNDECIDED
Probably DEMOCRAT
Definitely DEMOCRAT
Refused
Total Republican
Total Democrat
CORONA WORRY
--------------------------------
WORK/HOME
---------------------
OPENING ECONOMY
-----------------------
MAIL BALLOT
-----------------------------------
Total
Total Answering
Restoration PAC, Pennsylvania Statewide - May 2020 Banner 10 Page 279 of 290

11b. Would you say you are leaning toward the Republican candidate or leaning toward the Democrat candidate?
Total
---------
NOT
WORRIED
---------
SOMEWHAT
WORRIED
---------
VERY
WORRIED
---------
BACK TO
WORK
---------
STAY HOME
---------
OPEN/MORE
VIRUS
---------
SHUTDOWN/
JOB LOSS
-----------
SOMEWHAT
LIKELY MAIL
-----------
VERY
LIKELY MAIL
-----------
POLLING
PLACE
---------
600 168 223 209 309 291 301 299 84 247 269
100.00% 100.00% 100.00% 100.00% 100.00% 100.00% 100.00% 100.00% 100.00% 100.00% 100.00%
95 22 44 29 46 49 43 52 15 46 34
15.83% 13.10% 19.73% 13.88% 14.89% 16.84% 14.29% 17.39% 17.86% 18.62% 12.64%
14 8 6 - 11 3 10 4 1 3 10
2.33% 4.76% 2.69% 3.56% 1.03% 3.32% 1.34% 1.19% 1.21% 3.72%
63 13 31 19 31 32 29 34 12 32 19
10.50% 7.74% 13.90% 9.09% 10.03% 11.00% 9.63% 11.37% 14.29% 12.96% 7.06%
18 1 7 10 4 14 4 14 2 11 5
3.00% 0.60% 3.14% 4.78% 1.29% 4.81% 1.33% 4.68% 2.38% 4.45% 1.86%
WORK/HOME
---------------------
OPENING ECONOMY
-----------------------
MAIL BALLOT
-----------------------------------
Total
Total Answering
LEAN GOP
HARD UNDECIDED/NOT SURE
LEAN DEM
CORONA WORRY
--------------------------------
Restoration PAC, Pennsylvania Statewide - May 2020 Banner 10 Page 280 of 290

11. Summary Generic US Congress
Total
---------
NOT
WORRIED
---------
SOMEWHAT
WORRIED
---------
VERY
WORRIED
---------
BACK TO
WORK
---------
STAY HOME
---------
OPEN/MORE
VIRUS
---------
SHUTDOWN/
JOB LOSS
-----------
SOMEWHAT
LIKELY MAIL
-----------
VERY
LIKELY MAIL
-----------
POLLING
PLACE
---------
600 168 223 209 309 291 301 299 84 247 269
100.00% 100.00% 100.00% 100.00% 100.00% 100.00% 100.00% 100.00% 100.00% 100.00% 100.00%
600 168 223 209 309 291 301 299 84 247 269
100.00% 100.00% 100.00% 100.00% 100.00% 100.00% 100.00% 100.00% 100.00% 100.00% 100.00%
296 140 109 47 248 48 241 55 33 50 213
49.33% 83.33% 48.88% 22.49% 80.26% 16.49% 80.07% 18.39% 39.29% 20.24% 79.18%
63 13 31 19 31 32 29 34 12 32 19
10.50% 7.74% 13.90% 9.09% 10.03% 11.00% 9.63% 11.37% 14.29% 12.96% 7.06%
241 15 83 143 30 211 31 210 39 165 37
40.17% 8.93% 37.22% 68.42% 9.71% 72.51% 10.30% 70.23% 46.43% 66.80% 13.75%
Total
Total Answering
ALL GOP
HARD UNDECIDED
ALL DEM
CORONA WORRY
--------------------------------
WORK/HOME
---------------------
OPENING ECONOMY
-----------------------
MAIL BALLOT
-----------------------------------
Restoration PAC, Pennsylvania Statewide - May 2020 Banner 10 Page 281 of 290

12. Age
Total
---------
NOT
WORRIED
---------
SOMEWHAT
WORRIED
---------
VERY
WORRIED
---------
BACK TO
WORK
---------
STAY HOME
---------
OPEN/MORE
VIRUS
---------
SHUTDOWN/
JOB LOSS
-----------
SOMEWHAT
LIKELY MAIL
-----------
VERY
LIKELY MAIL
-----------
POLLING
PLACE
---------
600 168 223 209 309 291 301 299 84 247 269
100.00% 100.00% 100.00% 100.00% 100.00% 100.00% 100.00% 100.00% 100.00% 100.00% 100.00%
600 168 223 209 309 291 301 299 84 247 269
100.00% 100.00% 100.00% 100.00% 100.00% 100.00% 100.00% 100.00% 100.00% 100.00% 100.00%
34 12 7 15 14 20 14 20 5 21 8
5.67% 7.14% 3.14% 7.18% 4.53% 6.87% 4.65% 6.69% 5.95% 8.50% 2.97%
81 24 31 26 44 37 44 37 12 34 35
13.50% 14.29% 13.90% 12.44% 14.24% 12.71% 14.62% 12.37% 14.29% 13.77% 13.01%
91 21 38 32 35 56 37 54 10 42 39
15.17% 12.50% 17.04% 15.31% 11.33% 19.24% 12.29% 18.06% 11.90% 17.00% 14.50%
98 33 39 26 56 42 54 44 15 35 48
16.33% 19.64% 17.49% 12.44% 18.12% 14.43% 17.94% 14.72% 17.86% 14.17% 17.84%
118 28 39 51 64 54 56 62 14 45 59
19.67% 16.67% 17.49% 24.40% 20.71% 18.56% 18.60% 20.74% 16.67% 18.22% 21.93%
155 41 62 52 80 75 80 75 20 64 71
25.83% 24.40% 27.80% 24.88% 25.89% 25.77% 26.58% 25.08% 23.81% 25.91% 26.39%
23 9 7 7 16 7 16 7 8 6 9
3.83% 5.36% 3.14% 3.35% 5.18% 2.41% 5.32% 2.34% 9.52% 2.43% 3.35%
115 36 38 41 58 57 58 57 17 55 43
19.17% 21.43% 17.04% 19.62% 18.77% 19.59% 19.27% 19.06% 20.24% 22.27% 15.99%
189 54 77 58 91 98 91 98 25 77 87
31.50% 32.14% 34.53% 27.75% 29.45% 33.68% 30.23% 32.78% 29.76% 31.17% 32.34%
273 69 101 103 144 129 136 137 34 109 130
45.50% 41.07% 45.29% 49.28% 46.60% 44.33% 45.18% 45.82% 40.48% 44.13% 48.33%
Young Adult 18-34
Family Age 35-54
Seniors 55+
Total
Total Answering
18-24
25-34
35-44
45-54
55-64
65+
Refused
CORONA WORRY
--------------------------------
WORK/HOME
---------------------
OPENING ECONOMY
-----------------------
MAIL BALLOT
-----------------------------------
Restoration PAC, Pennsylvania Statewide - May 2020 Banner 10 Page 282 of 290

13. Which two of the following issues do you believe are the most important issues facing the country? [Select up to 2]
Total
---------
NOT
WORRIED
---------
SOMEWHAT
WORRIED
---------
VERY
WORRIED
---------
BACK TO
WORK
---------
STAY HOME
---------
OPEN/MORE
VIRUS
---------
SHUTDOWN/
JOB LOSS
-----------
SOMEWHAT
LIKELY MAIL
-----------
VERY
LIKELY MAIL
-----------
POLLING
PLACE
---------
600 168 223 209 309 291 301 299 84 247 269
100.00% 100.00% 100.00% 100.00% 100.00% 100.00% 100.00% 100.00% 100.00% 100.00% 100.00%
600 168 223 209 309 291 301 299 84 247 269
100.00% 100.00% 100.00% 100.00% 100.00% 100.00% 100.00% 100.00% 100.00% 100.00% 100.00%
264 93 104 67 184 80 177 87 31 78 155
44.00% 55.36% 46.64% 32.06% 59.55% 27.49% 58.80% 29.10% 36.90% 31.58% 57.62%
190 40 63 87 84 106 78 112 23 98 69
31.67% 23.81% 28.25% 41.63% 27.18% 36.43% 25.91% 37.46% 27.38% 39.68% 25.65%
271 41 107 123 87 184 87 184 47 143 81
45.17% 24.40% 47.98% 58.85% 28.16% 63.23% 28.90% 61.54% 55.95% 57.89% 30.11%
77 32 34 11 62 15 60 17 5 20 52
12.83% 19.05% 15.25% 5.26% 20.06% 5.15% 19.93% 5.69% 5.95% 8.10% 19.33%
71 23 24 24 34 37 33 38 14 25 32
11.83% 13.69% 10.76% 11.48% 11.00% 12.71% 10.96% 12.71% 16.67% 10.12% 11.90%
47 15 11 21 16 31 17 30 5 23 19
7.83% 8.93% 4.93% 10.05% 5.18% 10.65% 5.65% 10.03% 5.95% 9.31% 7.06%
31 15 11 5 24 7 25 6 6 6 19
5.17% 8.93% 4.93% 2.39% 7.77% 2.41% 8.31% 2.01% 7.14% 2.43% 7.06%
79 9 26 44 16 63 16 63 10 55 14
13.17% 5.36% 11.66% 21.05% 5.18% 21.65% 5.32% 21.07% 11.90% 22.27% 5.20%
72 32 30 10 56 16 54 18 8 14 50
12.00% 19.05% 13.45% 4.78% 18.12% 5.50% 17.94% 6.02% 9.52% 5.67% 18.59%
39 16 16 7 21 18 24 15 6 12 21
6.50% 9.52% 7.17% 3.35% 6.80% 6.19% 7.97% 5.02% 7.14% 4.86% 7.81%
15 6 5 4 11 4 9 6 4 4 7
2.50% 3.57% 2.24% 1.91% 3.56% 1.37% 2.99% 2.01% 4.76% 1.62% 2.60%
IMPEACHMENT OR
INVESTIGATING GOVERNMENT
SOMETHING ELSE
JOBS AND THE ECONOMY
HEALTH CARE
STOPPING CORONAVIRUS
NATIONAL SECURITY
EDUCATION
GUNS
FOREIGN TRADE
CLIMATE CHANGE
IMMIGRATION
CORONA WORRY
--------------------------------
WORK/HOME
---------------------
OPENING ECONOMY
-----------------------
MAIL BALLOT
-----------------------------------
Total
Total Answering
Restoration PAC, Pennsylvania Statewide - May 2020 Banner 10 Page 283 of 290

14a. In politics today, do you generally consider yourself .... a republican, a democrat, an independent or something else?
Total
---------
NOT
WORRIED
---------
SOMEWHAT
WORRIED
---------
VERY
WORRIED
---------
BACK TO
WORK
---------
STAY HOME
---------
OPEN/MORE
VIRUS
---------
SHUTDOWN/
JOB LOSS
-----------
SOMEWHAT
LIKELY MAIL
-----------
VERY
LIKELY MAIL
-----------
POLLING
PLACE
---------
600 168 223 209 309 291 301 299 84 247 269
100.00% 100.00% 100.00% 100.00% 100.00% 100.00% 100.00% 100.00% 100.00% 100.00% 100.00%
600 168 223 209 309 291 301 299 84 247 269
100.00% 100.00% 100.00% 100.00% 100.00% 100.00% 100.00% 100.00% 100.00% 100.00% 100.00%
225 102 84 39 185 40 182 43 29 40 156
37.50% 60.71% 37.67% 18.66% 59.87% 13.75% 60.47% 14.38% 34.52% 16.19% 57.99%
34 12 14 8 22 12 23 11 5 10 19
5.67% 7.14% 6.28% 3.83% 7.12% 4.12% 7.64% 3.68% 5.95% 4.05% 7.06%
119 32 49 38 61 58 58 61 14 54 51
19.83% 19.05% 21.97% 18.18% 19.74% 19.93% 19.27% 20.40% 16.67% 21.86% 18.96%
36 6 16 14 11 25 10 26 10 16 10
6.00% 3.57% 7.17% 6.70% 3.56% 8.59% 3.32% 8.70% 11.90% 6.48% 3.72%
184 15 60 109 29 155 27 157 25 126 33
30.67% 8.93% 26.91% 52.15% 9.39% 53.26% 8.97% 52.51% 29.76% 51.01% 12.27%
2 1 - 1 1 1 1 1 1 1 -
0.33% 0.60% 0.48% 0.32% 0.34% 0.33% 0.33% 1.19% 0.40%
259 114 98 47 207 52 205 54 34 50 175
43.17% 67.86% 43.95% 22.49% 66.99% 17.87% 68.11% 18.06% 40.48% 20.24% 65.06%
220 21 76 123 40 180 37 183 35 142 43
36.67% 12.50% 34.08% 58.85% 12.94% 61.86% 12.29% 61.20% 41.67% 57.49% 15.99%
119 32 49 38 61 58 58 61 14 54 51
19.83% 19.05% 21.97% 18.18% 19.74% 19.93% 19.27% 20.40% 16.67% 21.86% 18.96%
Not so Strong Republican
AN INDEPENDENT, OR
SOMETHING ELSE
Not so Strong DEMOCRAT
Strong DEMOCRAT
Refused
Total Republican
Total Democrat
Independent
CORONA WORRY
--------------------------------
WORK/HOME
---------------------
OPENING ECONOMY
-----------------------
MAIL BALLOT
-----------------------------------
Total
Total Answering
Strong REPUBLICAN
Restoration PAC, Pennsylvania Statewide - May 2020 Banner 10 Page 284 of 290

14b. Do you think of yourself closer to the Republican Party or Democratic Party?
Total
---------
NOT
WORRIED
---------
SOMEWHAT
WORRIED
---------
VERY
WORRIED
---------
BACK TO
WORK
---------
STAY HOME
---------
OPEN/MORE
VIRUS
---------
SHUTDOWN/
JOB LOSS
-----------
SOMEWHAT
LIKELY MAIL
-----------
VERY
LIKELY MAIL
-----------
POLLING
PLACE
---------
600 168 223 209 309 291 301 299 84 247 269
100.00% 100.00% 100.00% 100.00% 100.00% 100.00% 100.00% 100.00% 100.00% 100.00% 100.00%
121 33 49 39 62 59 59 62 15 55 51
20.17% 19.64% 21.97% 18.66% 20.06% 20.27% 19.60% 20.74% 17.86% 22.27% 18.96%
35 16 15 4 29 6 27 8 4 5 26
5.83% 9.52% 6.73% 1.91% 9.39% 2.06% 8.97% 2.68% 4.76% 2.02% 9.67%
58 13 19 26 26 32 25 33 7 30 21
9.67% 7.74% 8.52% 12.44% 8.41% 11.00% 8.31% 11.04% 8.33% 12.15% 7.81%
28 4 15 9 7 21 7 21 4 20 4
4.67% 2.38% 6.73% 4.31% 2.27% 7.22% 2.33% 7.02% 4.76% 8.10% 1.49%
WORK/HOME
---------------------
OPENING ECONOMY
-----------------------
MAIL BALLOT
-----------------------------------
Total
Total Answering
LEAN REPUBLICAN
FIRM INDEPENDENT
LEAN DEMOCRAT
CORONA WORRY
--------------------------------
Restoration PAC, Pennsylvania Statewide - May 2020 Banner 10 Page 285 of 290

14. Party Summary
Total
---------
NOT
WORRIED
---------
SOMEWHAT
WORRIED
---------
VERY
WORRIED
---------
BACK TO
WORK
---------
STAY HOME
---------
OPEN/MORE
VIRUS
---------
SHUTDOWN/
JOB LOSS
-----------
SOMEWHAT
LIKELY MAIL
-----------
VERY
LIKELY MAIL
-----------
POLLING
PLACE
---------
600 168 223 209 309 291 301 299 84 247 269
100.00% 100.00% 100.00% 100.00% 100.00% 100.00% 100.00% 100.00% 100.00% 100.00% 100.00%
600 168 223 209 309 291 301 299 84 247 269
100.00% 100.00% 100.00% 100.00% 100.00% 100.00% 100.00% 100.00% 100.00% 100.00% 100.00%
294 130 113 51 236 58 232 62 38 55 201
49.00% 77.38% 50.67% 24.40% 76.38% 19.93% 77.08% 20.74% 45.24% 22.27% 74.72%
58 13 19 26 26 32 25 33 7 30 21
9.67% 7.74% 8.52% 12.44% 8.41% 11.00% 8.31% 11.04% 8.33% 12.15% 7.81%
248 25 91 132 47 201 44 204 39 162 47
41.33% 14.88% 40.81% 63.16% 15.21% 69.07% 14.62% 68.23% 46.43% 65.59% 17.47%
Total
Total Answering
ALL REPUBLICAN
ALL INDEPENDENT
ALL DEMOCRAT
CORONA WORRY
--------------------------------
WORK/HOME
---------------------
OPENING ECONOMY
-----------------------
MAIL BALLOT
-----------------------------------
Restoration PAC, Pennsylvania Statewide - May 2020 Banner 10 Page 286 of 290

BALLOT. If a mail-in ballot was mailed to you, how likely would you be to vote by mail this fall, as opposed to voting in-person at your polling place?
Total
---------
NOT
WORRIED
---------
SOMEWHAT
WORRIED
---------
VERY
WORRIED
---------
BACK TO
WORK
---------
STAY HOME
---------
OPEN/MORE
VIRUS
---------
SHUTDOWN/
JOB LOSS
-----------
SOMEWHAT
LIKELY MAIL
-----------
VERY
LIKELY MAIL
-----------
POLLING
PLACE
---------
600 168 223 209 309 291 301 299 84 247 269
100.00% 100.00% 100.00% 100.00% 100.00% 100.00% 100.00% 100.00% 100.00% 100.00% 100.00%
600 168 223 209 309 291 301 299 84 247 269
100.00% 100.00% 100.00% 100.00% 100.00% 100.00% 100.00% 100.00% 100.00% 100.00% 100.00%
84 23 38 23 38 46 40 44 84 - -
14.00% 13.69% 17.04% 11.00% 12.30% 15.81% 13.29% 14.72% 100.00%
247 22 89 136 52 195 49 198 - 247 -
41.17% 13.10% 39.91% 65.07% 16.83% 67.01% 16.28% 66.22% 100.00%
269 123 96 50 219 50 212 57 - - 269
44.83% 73.21% 43.05% 23.92% 70.87% 17.18% 70.43% 19.06% 100.00%
Total
Total Answering
Somewhat likely to vote by mail
Very likely to vote by mail
Not likely/Would still vote at polling
place
CORONA WORRY
--------------------------------
WORK/HOME
---------------------
OPENING ECONOMY
-----------------------
MAIL BALLOT
-----------------------------------
Restoration PAC, Pennsylvania Statewide - May 2020 Banner 10 Page 287 of 290

15. What was the last grade you completed in school?
Total
---------
NOT
WORRIED
---------
SOMEWHAT
WORRIED
---------
VERY
WORRIED
---------
BACK TO
WORK
---------
STAY HOME
---------
OPEN/MORE
VIRUS
---------
SHUTDOWN/
JOB LOSS
-----------
SOMEWHAT
LIKELY MAIL
-----------
VERY
LIKELY MAIL
-----------
POLLING
PLACE
---------
600 168 223 209 309 291 301 299 84 247 269
100.00% 100.00% 100.00% 100.00% 100.00% 100.00% 100.00% 100.00% 100.00% 100.00% 100.00%
600 168 223 209 309 291 301 299 84 247 269
100.00% 100.00% 100.00% 100.00% 100.00% 100.00% 100.00% 100.00% 100.00% 100.00% 100.00%
3 1 1 1 1 2 1 2 1 1 1
0.50% 0.60% 0.45% 0.48% 0.32% 0.69% 0.33% 0.67% 1.19% 0.40% 0.37%
153 47 62 44 84 69 86 67 16 56 81
25.50% 27.98% 27.80% 21.05% 27.18% 23.71% 28.57% 22.41% 19.05% 22.67% 30.11%
30 11 11 8 22 8 21 9 6 7 17
5.00% 6.55% 4.93% 3.83% 7.12% 2.75% 6.98% 3.01% 7.14% 2.83% 6.32%
282 76 109 97 154 128 147 135 38 112 132
47.00% 45.24% 48.88% 46.41% 49.84% 43.99% 48.84% 45.15% 45.24% 45.34% 49.07%
130 33 39 58 48 82 46 84 23 69 38
21.67% 19.64% 17.49% 27.75% 15.53% 28.18% 15.28% 28.09% 27.38% 27.94% 14.13%
2 - 1 1 - 2 - 2 - 2 -
0.33% 0.45% 0.48% 0.69% 0.67% 0.81%
156 48 63 45 85 71 87 69 17 57 82
26.00% 28.57% 28.25% 21.53% 27.51% 24.40% 28.90% 23.08% 20.24% 23.08% 30.48%
312 87 120 105 176 136 168 144 44 119 149
52.00% 51.79% 53.81% 50.24% 56.96% 46.74% 55.81% 48.16% 52.38% 48.18% 55.39%
130 33 39 58 48 82 46 84 23 69 38
21.67% 19.64% 17.49% 27.75% 15.53% 28.18% 15.28% 28.09% 27.38% 27.94% 14.13%
College
College+
Total
Total Answering
GRADE SCHOOL [1-8]
HIGH SCHOOL [9-12]
TECHNICAL/VOCATIONAL
SCHOOL
COLLEGE
GRADUATE SCHOOL
REFUSED
High School
CORONA WORRY
--------------------------------
WORK/HOME
---------------------
OPENING ECONOMY
-----------------------
MAIL BALLOT
-----------------------------------
Restoration PAC, Pennsylvania Statewide - May 2020 Banner 10 Page 288 of 290

16. Thinking about where you live, do you consider it to be urban, suburban or rural?
Total
---------
NOT
WORRIED
---------
SOMEWHAT
WORRIED
---------
VERY
WORRIED
---------
BACK TO
WORK
---------
STAY HOME
---------
OPEN/MORE
VIRUS
---------
SHUTDOWN/
JOB LOSS
-----------
SOMEWHAT
LIKELY MAIL
-----------
VERY
LIKELY MAIL
-----------
POLLING
PLACE
---------
600 168 223 209 309 291 301 299 84 247 269
100.00% 100.00% 100.00% 100.00% 100.00% 100.00% 100.00% 100.00% 100.00% 100.00% 100.00%
600 168 223 209 309 291 301 299 84 247 269
100.00% 100.00% 100.00% 100.00% 100.00% 100.00% 100.00% 100.00% 100.00% 100.00% 100.00%
103 23 35 45 50 53 45 58 12 45 46
17.17% 13.69% 15.70% 21.53% 16.18% 18.21% 14.95% 19.40% 14.29% 18.22% 17.10%
299 81 110 108 148 151 144 155 50 129 120
49.83% 48.21% 49.33% 51.67% 47.90% 51.89% 47.84% 51.84% 59.52% 52.23% 44.61%
196 63 77 56 111 85 112 84 21 72 103
32.67% 37.50% 34.53% 26.79% 35.92% 29.21% 37.21% 28.09% 25.00% 29.15% 38.29%
2 1 1 - - 2 - 2 1 1 -
0.33% 0.60% 0.45% 0.69% 0.67% 1.19% 0.40%
SUBURBAN
RURAL
DON'T KNOW
CORONA WORRY
--------------------------------
WORK/HOME
---------------------
OPENING ECONOMY
-----------------------
MAIL BALLOT
-----------------------------------
Total
Total Answering
URBAN
Restoration PAC, Pennsylvania Statewide - May 2020 Banner 10 Page 289 of 290

17. Gender
Total
---------
NOT
WORRIED
---------
SOMEWHAT
WORRIED
---------
VERY
WORRIED
---------
BACK TO
WORK
---------
STAY HOME
---------
OPEN/MORE
VIRUS
---------
SHUTDOWN/
JOB LOSS
-----------
SOMEWHAT
LIKELY MAIL
-----------
VERY
LIKELY MAIL
-----------
POLLING
PLACE
---------
600 168 223 209 309 291 301 299 84 247 269
100.00% 100.00% 100.00% 100.00% 100.00% 100.00% 100.00% 100.00% 100.00% 100.00% 100.00%
600 168 223 209 309 291 301 299 84 247 269
100.00% 100.00% 100.00% 100.00% 100.00% 100.00% 100.00% 100.00% 100.00% 100.00% 100.00%
286 86 117 83 172 114 166 120 45 99 142
47.67% 51.19% 52.47% 39.71% 55.66% 39.18% 55.15% 40.13% 53.57% 40.08% 52.79%
314 82 106 126 137 177 135 179 39 148 127
52.33% 48.81% 47.53% 60.29% 44.34% 60.82% 44.85% 59.87% 46.43% 59.92% 47.21%
Male
Female
CORONA WORRY
--------------------------------
WORK/HOME
---------------------
OPENING ECONOMY
-----------------------
MAIL BALLOT
-----------------------------------
Total
Total Answering
Restoration PAC, Pennsylvania Statewide - May 2020 Banner 10 Page 290 of 290