1 The Transparency Movement: Collecting and Communicating Price and Quality Information to Consumers...
27
1 The Transparency Movement: Collecting and Communicating Price and Quality Information to Consumers Professor Jean Abraham Division of Health Policy and Management School of Public Health December 1, 2006
-
Upload
kelley-banks -
Category
Documents
-
view
213 -
download
0
Transcript of 1 The Transparency Movement: Collecting and Communicating Price and Quality Information to Consumers...

1
The Transparency Movement: Collecting and Communicating Price and
Quality Information to Consumers
Professor Jean AbrahamDivision of Health Policy and Management
School of Public Health
December 1, 2006
2
Presentation Outline
• Motivation
• Hospital Prices and Quality
• Consumer Decision-Making– Factors influencing provider choice– Consumer information use and impact
• Communicating price and quality information effectively
3
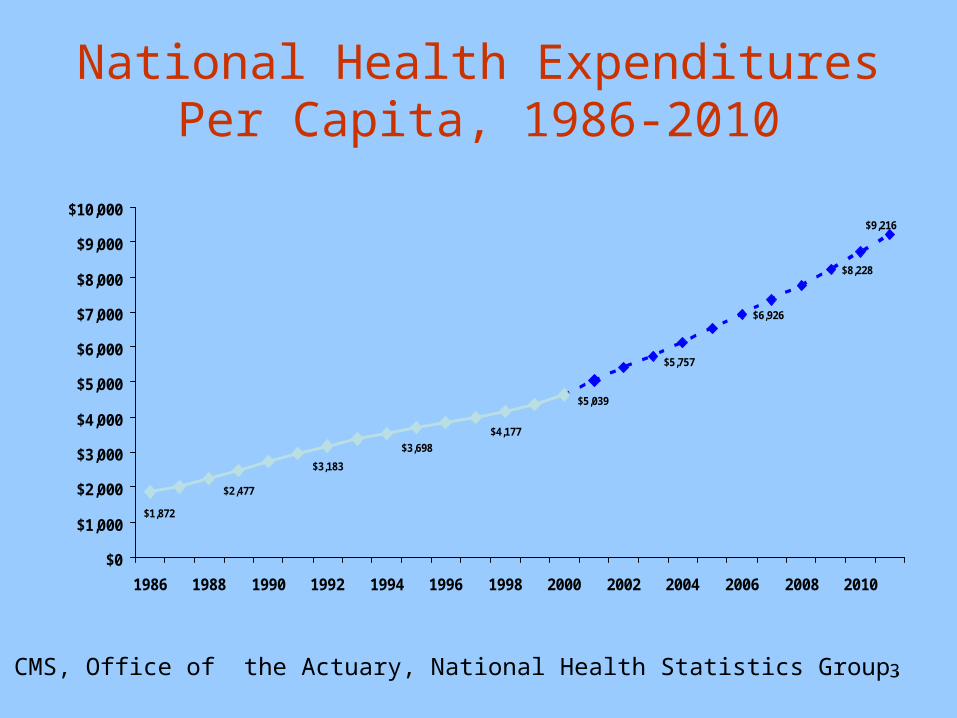
National Health Expenditures Per Capita, 1986-2010
$2,477
$3,183
$3,698
$4,177
$5,039
$6,926
$8,228
$1,872
$5,757
$9,216
$0
$1,000
$2,000
$3,000
$4,000
$5,000
$6,000
$7,000
$8,000
$9,000
$10,000
1986 1988 1990 1992 1994 1996 1998 2000 2002 2004 2006 2008 2010
Source: CMS, Office of the Actuary, National Health Statistics Group.
4
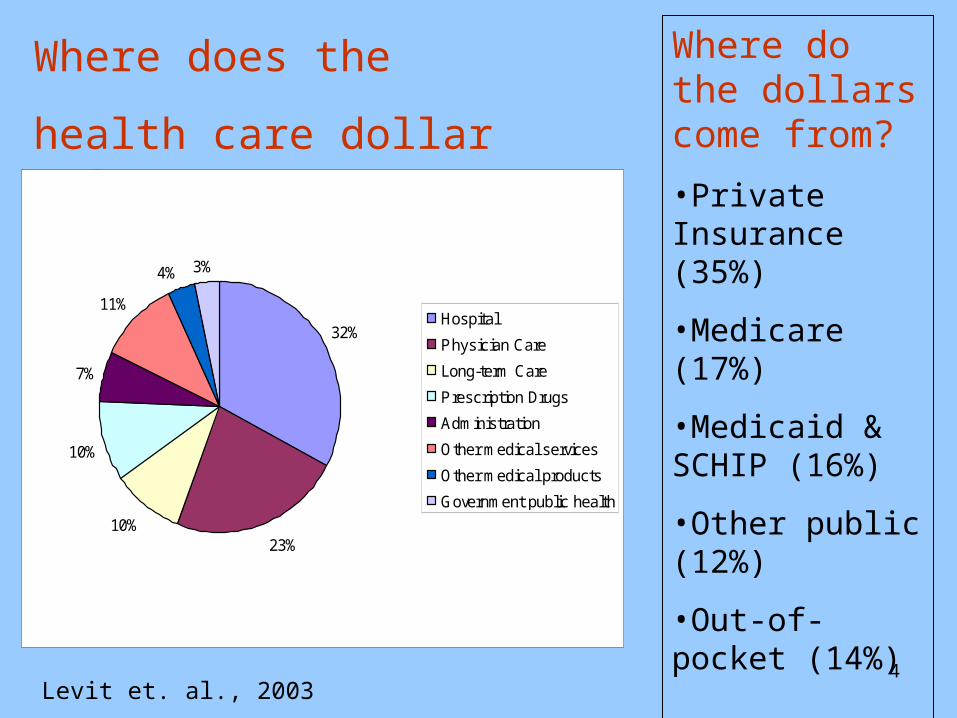
Where does the
health care dollar go?
Where do the dollars come from?
•Private Insurance (35%)
•Medicare (17%)
•Medicaid & SCHIP (16%)
•Other public (12%)
•Out-of-pocket (14%)
Levit et. al., 2003
32%
23%10%
10%
7%
11%
4% 3%
Hospital
Physician Care
Long-term Care
Prescription Drugs
Administration
Other medical services
Other medical products
Government public health
5
Transparency Movement
• Efforts by federal and state governments, associations, consumer groups, payers, and health care delivery organizations to create and disseminate price and quality information to consumers in order to support their decision-making.
6
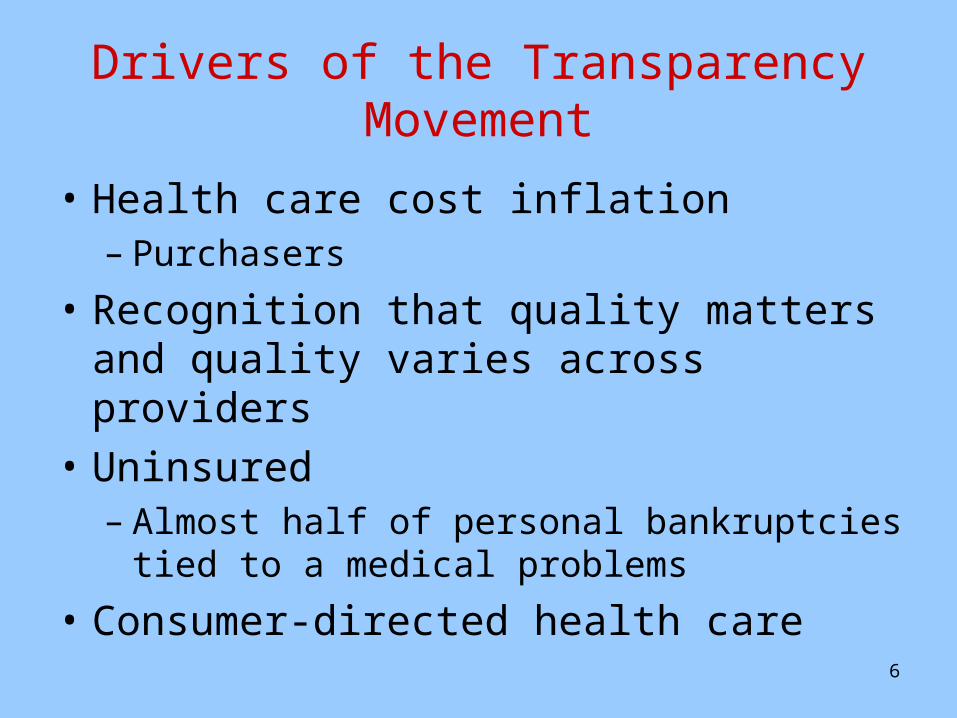
Drivers of the Transparency Movement
• Health care cost inflation– Purchasers
• Recognition that quality matters and quality varies across providers
• Uninsured– Almost half of personal bankruptcies tied to a
medical problems
• Consumer-directed health care
7
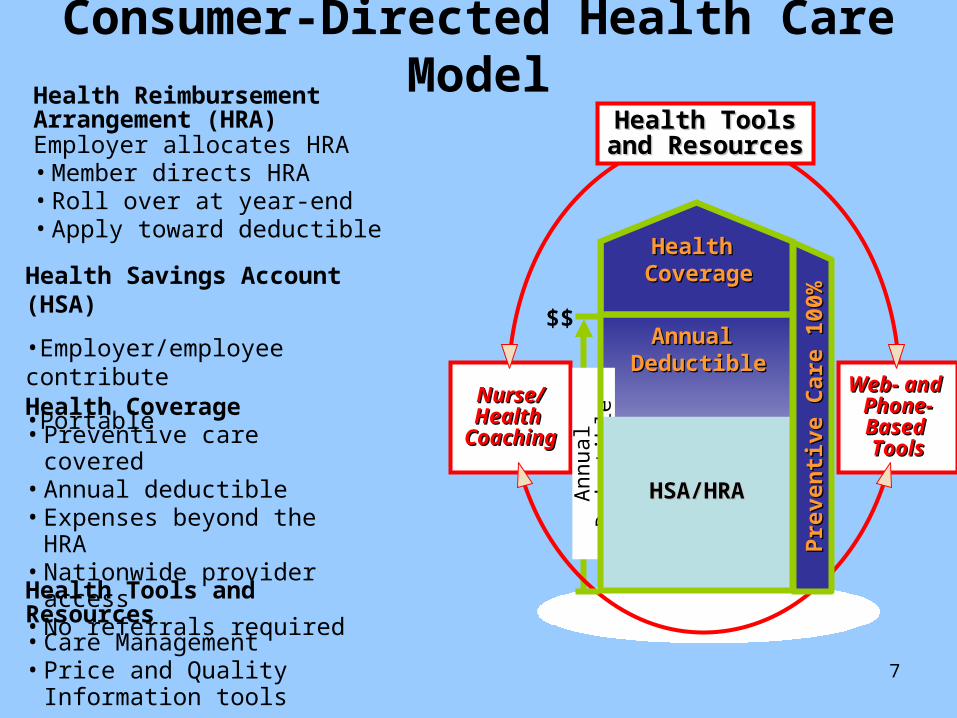
Consumer-Directed Health Care Model
Nurse/Nurse/Health Health
CoachingCoaching
Web- and Web- and Phone-Phone-Based Based ToolsTools
Health ToolsHealth Toolsand Resourcesand Resources
Health Tools and Resources• Care Management • Price and Quality
Information tools
Health Coverage• Preventive care covered • Annual deductible• Expenses beyond the
HRA• Nationwide provider
access• No referrals required
Health Reimbursement Arrangement (HRA)Employer allocates HRA• Member directs HRA• Roll over at year-end • Apply toward deductible
Annual Annual DeductibleDeductible
Annual Annual DeductibleDeductible
Pre
ven
tive
Care
10
0%
Pre
ven
tive
Care
10
0%
Health Health CoverageCoverage
An
nu
al
Ded
uct
ible
HSA/HRAHSA/HRAHSA/HRAHSA/HRA
$$
Health Savings Account (HSA)
•Employer/employee contribute
•Portable
8
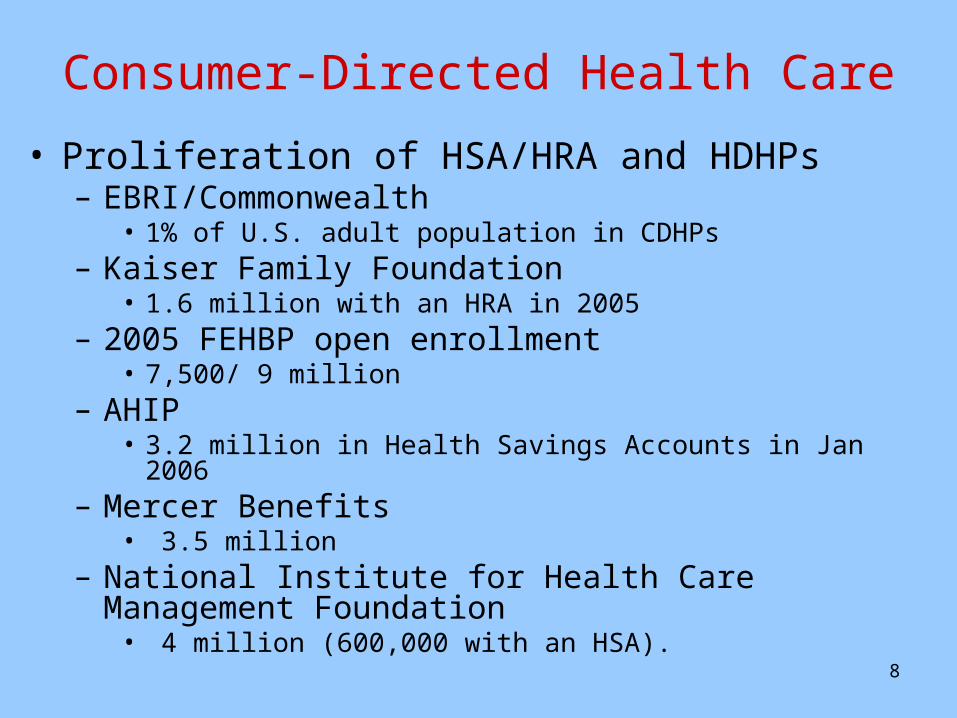
Consumer-Directed Health Care
• Proliferation of HSA/HRA and HDHPs– EBRI/Commonwealth
• 1% of U.S. adult population in CDHPs– Kaiser Family Foundation
• 1.6 million with an HRA in 2005– 2005 FEHBP open enrollment
• 7,500/ 9 million– AHIP
• 3.2 million in Health Savings Accounts in Jan 2006– Mercer Benefits
• 3.5 million – National Institute for Health Care Management
Foundation• 4 million (600,000 with an HSA).
9
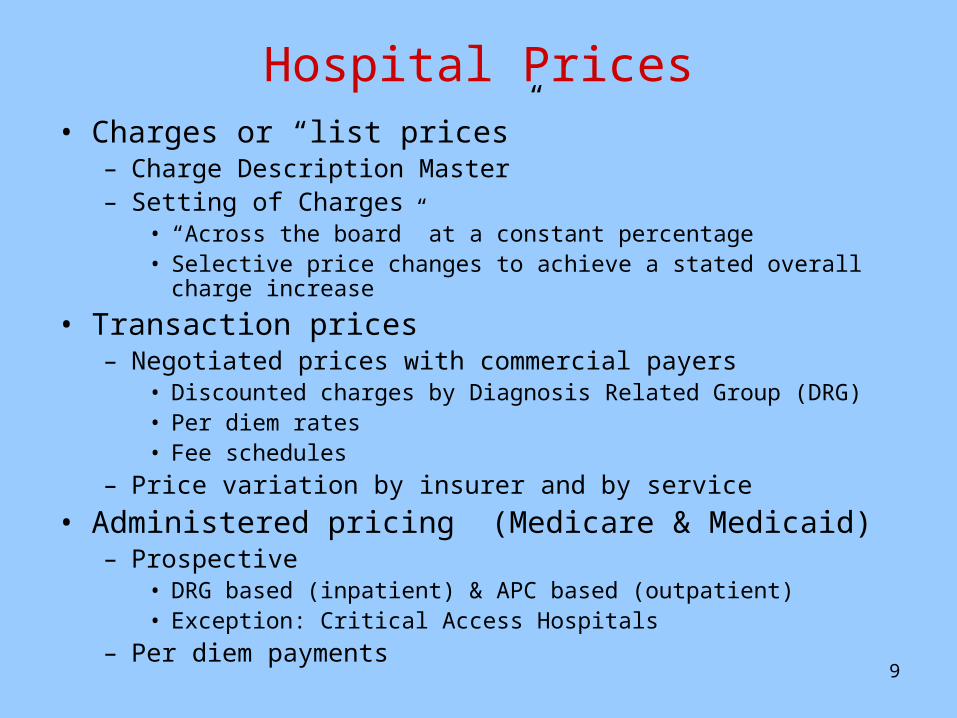
Hospital Prices• Charges or “list prices”
– Charge Description Master– Setting of Charges
• “Across the board” at a constant percentage• Selective price changes to achieve a stated overall charge increase
• Transaction prices– Negotiated prices with commercial payers
• Discounted charges by Diagnosis Related Group (DRG)• Per diem rates • Fee schedules
– Price variation by insurer and by service
• Administered pricing (Medicare & Medicaid)– Prospective
• DRG based (inpatient) & APC based (outpatient)• Exception: Critical Access Hospitals
– Per diem payments
10
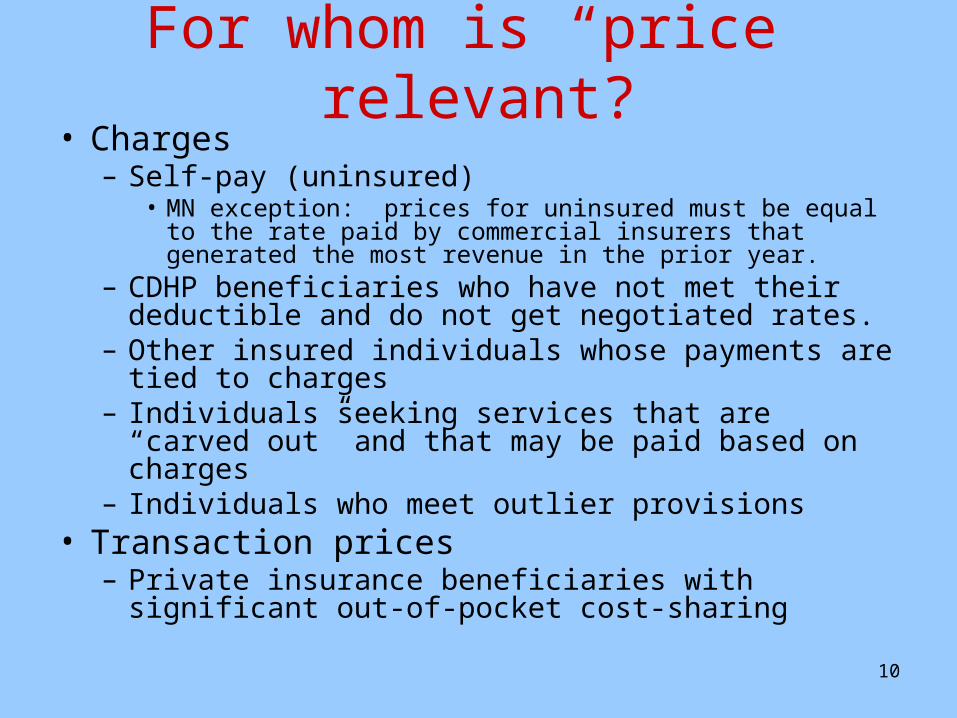
For whom is “price” relevant?• Charges
– Self-pay (uninsured)• MN exception: prices for uninsured must be equal to the rate
paid by commercial insurers that generated the most revenue in the prior year.
– CDHP beneficiaries who have not met their deductible and do not get negotiated rates.
– Other insured individuals whose payments are tied to charges
– Individuals seeking services that are “carved out” and that may be paid based on charges
– Individuals who meet outlier provisions• Transaction prices
– Private insurance beneficiaries with significant out-of-pocket cost-sharing
11
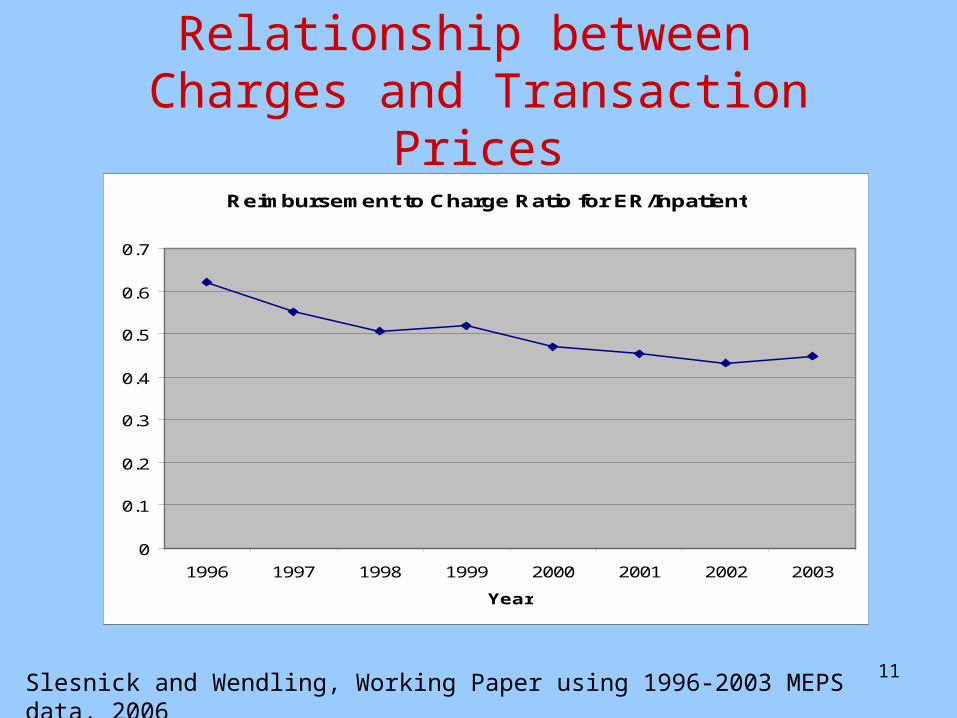
Relationship between Charges and Transaction Prices
Slesnick and Wendling, Working Paper using 1996-2003 MEPS data, 2006
Reimbursement to Charge Ratio for ER/Inpatient
0
0.1
0.2
0.3
0.4
0.5
0.6
0.7
1996 1997 1998 1999 2000 2001 2002 2003
Year

12
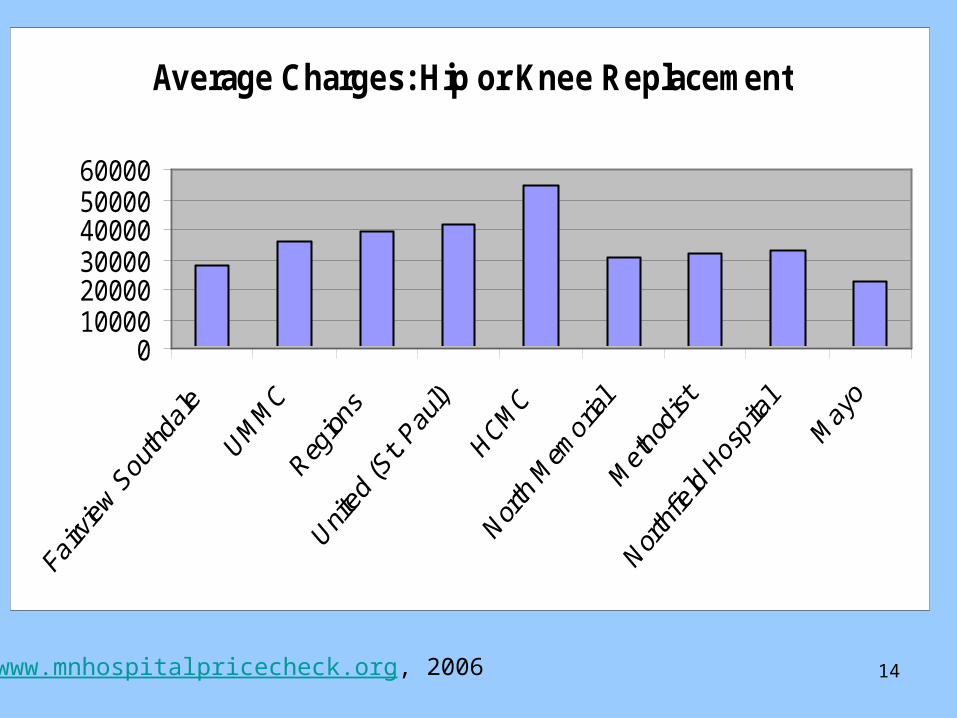
Variability in Charges
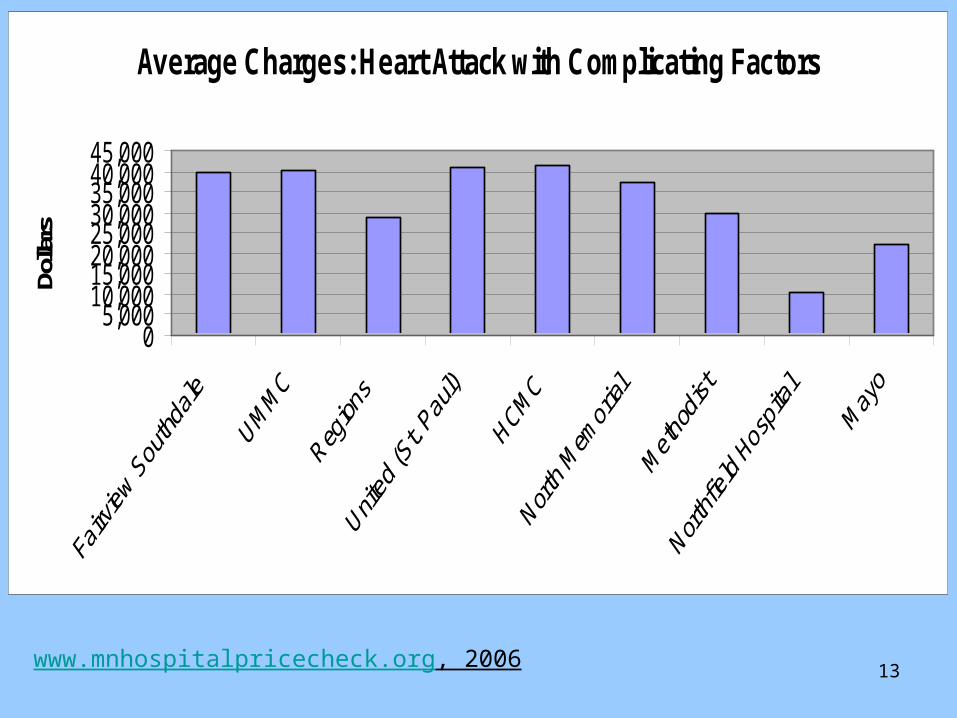
13
Average Charges: Heart Attack with Complicating Factors
05,000
10,00015,00020,00025,00030,00035,00040,00045,000
Dolla
rs
www.mnhospitalpricecheck.org, 2006
14
Average Charges: Hip or Knee Replacement
0100002000030000400005000060000
www.mnhospitalpricecheck.org, 2006
15
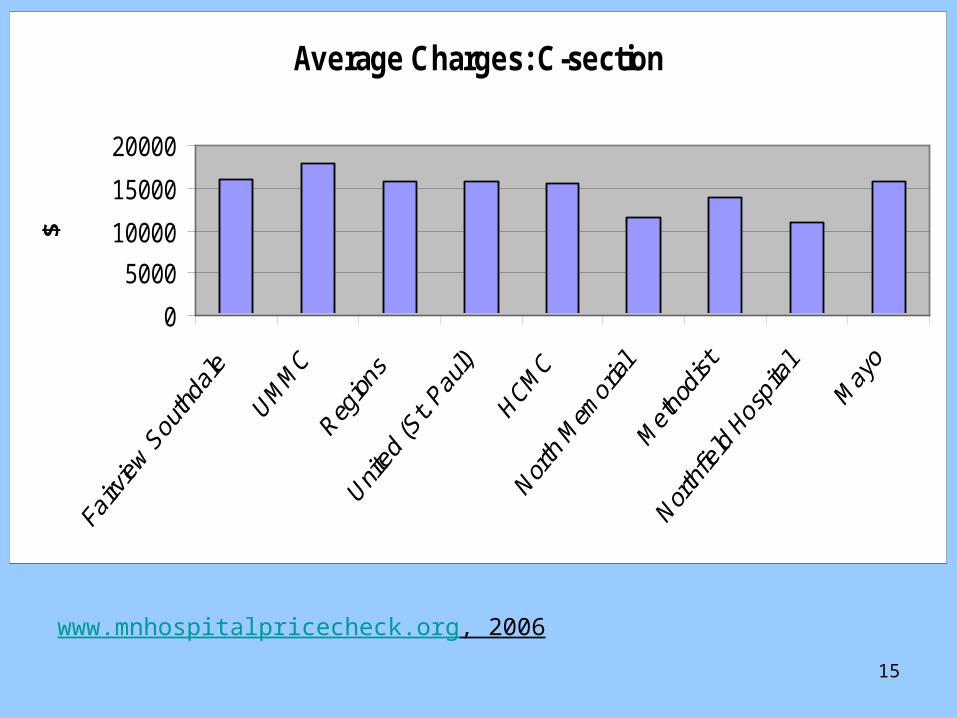
Average Charges: C-section
0
5000
10000
15000
20000
$
www.mnhospitalpricecheck.org, 2006
16
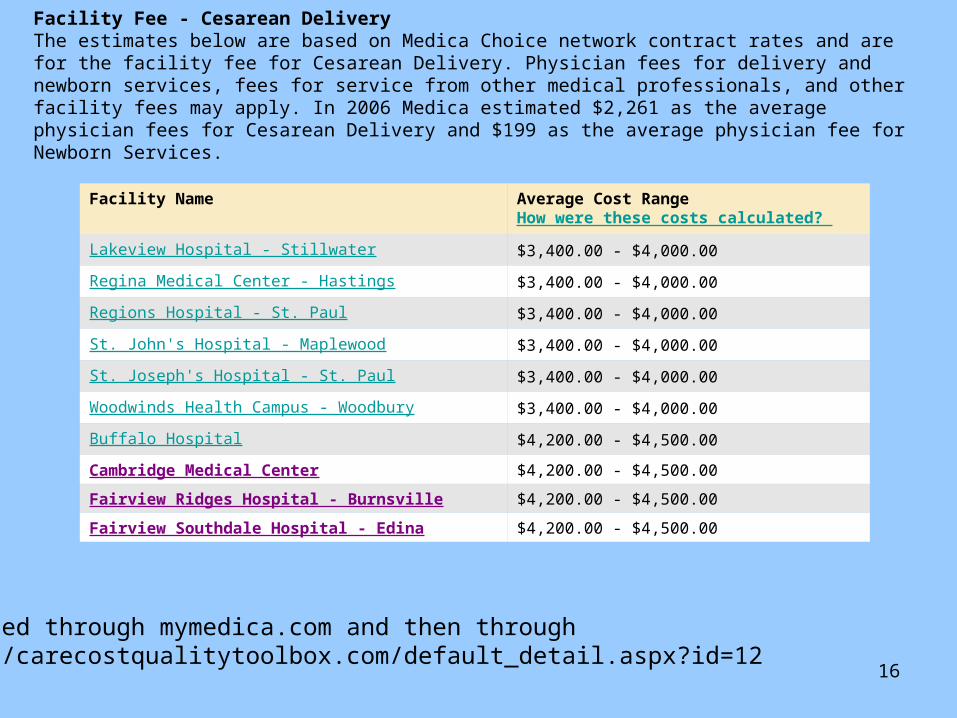
Facility Name Average Cost RangeHow were these costs calculated?
Lakeview Hospital - Stillwater $3,400.00 - $4,000.00
Regina Medical Center - Hastings $3,400.00 - $4,000.00
Regions Hospital - St. Paul $3,400.00 - $4,000.00
St. John's Hospital - Maplewood $3,400.00 - $4,000.00
St. Joseph's Hospital - St. Paul $3,400.00 - $4,000.00
Woodwinds Health Campus - Woodbury $3,400.00 - $4,000.00
Buffalo Hospital $4,200.00 - $4,500.00
Cambridge Medical Center $4,200.00 - $4,500.00
Fairview Ridges Hospital - Burnsville $4,200.00 - $4,500.00
Fairview Southdale Hospital - Edina $4,200.00 - $4,500.00
Facility Fee - Cesarean Delivery The estimates below are based on Medica Choice network contract rates and are for the facility fee for Cesarean Delivery. Physician fees for delivery and newborn services, fees for service from other medical professionals, and other facility fees may apply. In 2006 Medica estimated $2,261 as the average physician fees for Cesarean Delivery and $199 as the average physician fee for Newborn Services.
Accessed through mymedica.com and then throughhttp://carecostqualitytoolbox.com/default_detail.aspx?id=12
17
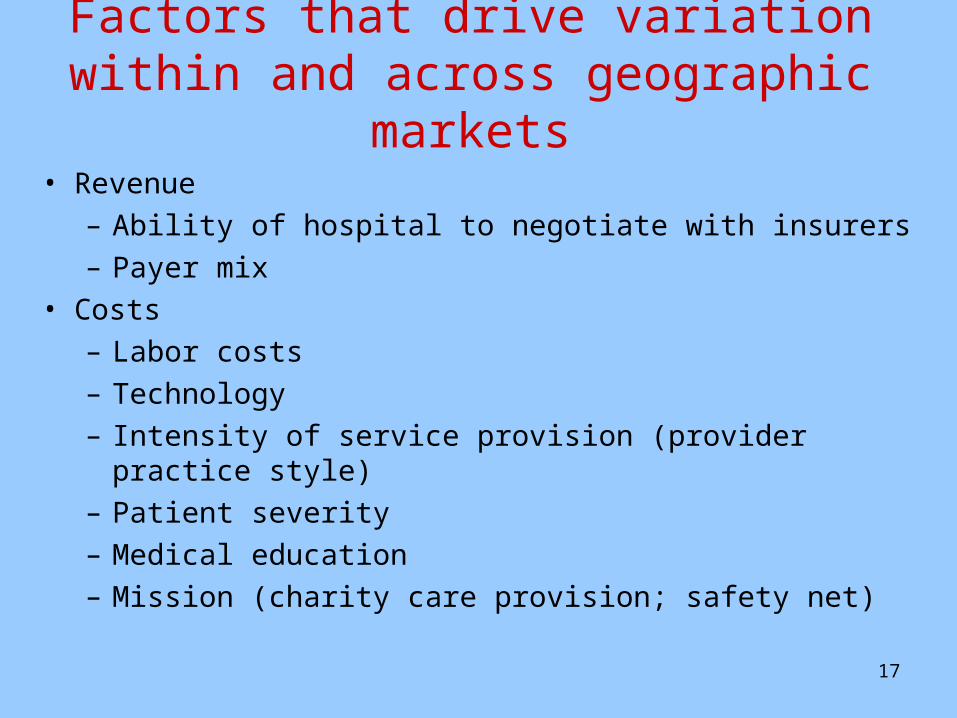
Factors that drive variation within and across geographic markets
• Revenue– Ability of hospital to negotiate with insurers– Payer mix
• Costs– Labor costs– Technology– Intensity of service provision (provider practice style)– Patient severity – Medical education– Mission (charity care provision; safety net)
18
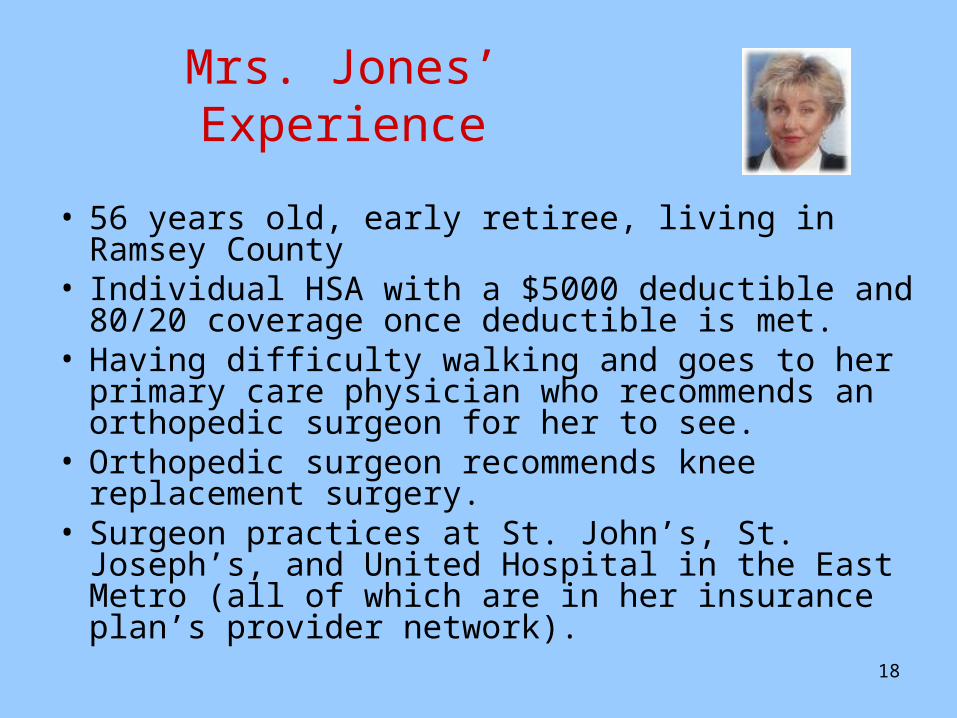
Mrs. Jones’ Experience
• 56 years old, early retiree, living in Ramsey County
• Individual HSA with a $5000 deductible and 80/20 coverage once deductible is met.
• Having difficulty walking and goes to her primary care physician who recommends an orthopedic surgeon for her to see.
• Orthopedic surgeon recommends knee replacement surgery.
• Surgeon practices at St. John’s, St. Joseph’s, and United Hospital in the East Metro (all of which are in her insurance plan’s provider network).
19
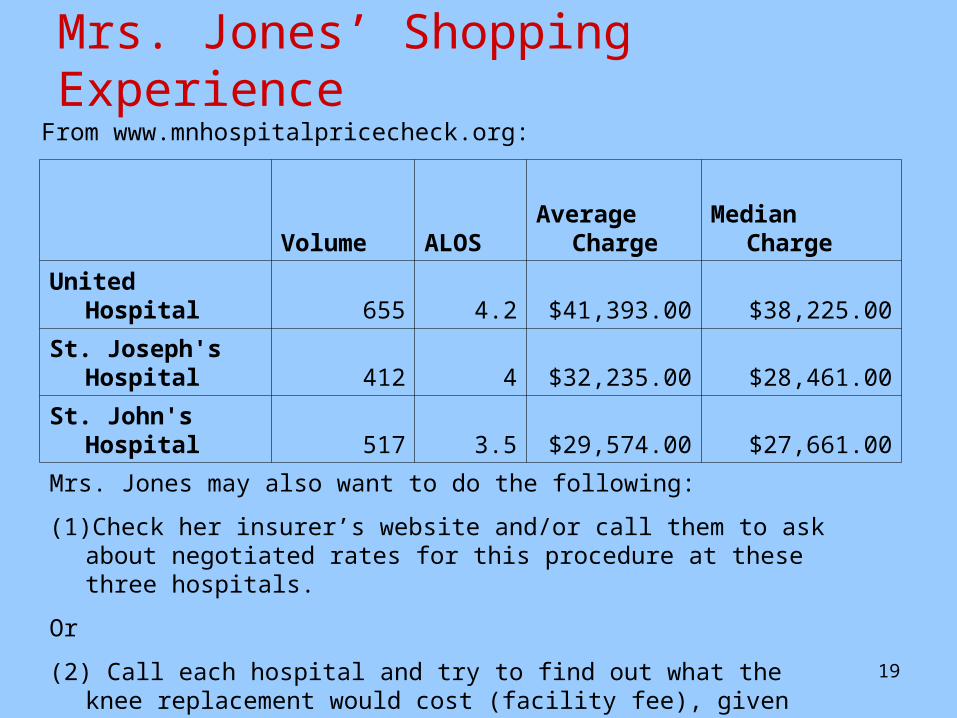
Mrs. Jones’ Shopping Experience
Volume ALOSAverage
Charge Median Charge
United Hospital 655 4.2 $41,393.00 $38,225.00
St. Joseph's Hospital 412 4 $32,235.00 $28,461.00
St. John's Hospital 517 3.5 $29,574.00 $27,661.00
From www.mnhospitalpricecheck.org:
Mrs. Jones may also want to do the following:
(1) Check her insurer’s website and/or call them to ask about negotiated rates for this procedure at these three hospitals.
Or
(2) Call each hospital and try to find out what the knee replacement would cost (facility fee), given her particular type of insurance.

20
Mrs. Jones’ Shopping Experience
HealthPartners’
Hospital
Report Card
Also, Mrs. Jones wants to check the credentials of her surgeon. She goes to the MN Board of Medical Practice website where she can access the Professional Profile search engine to learn more about her surgeon.
21
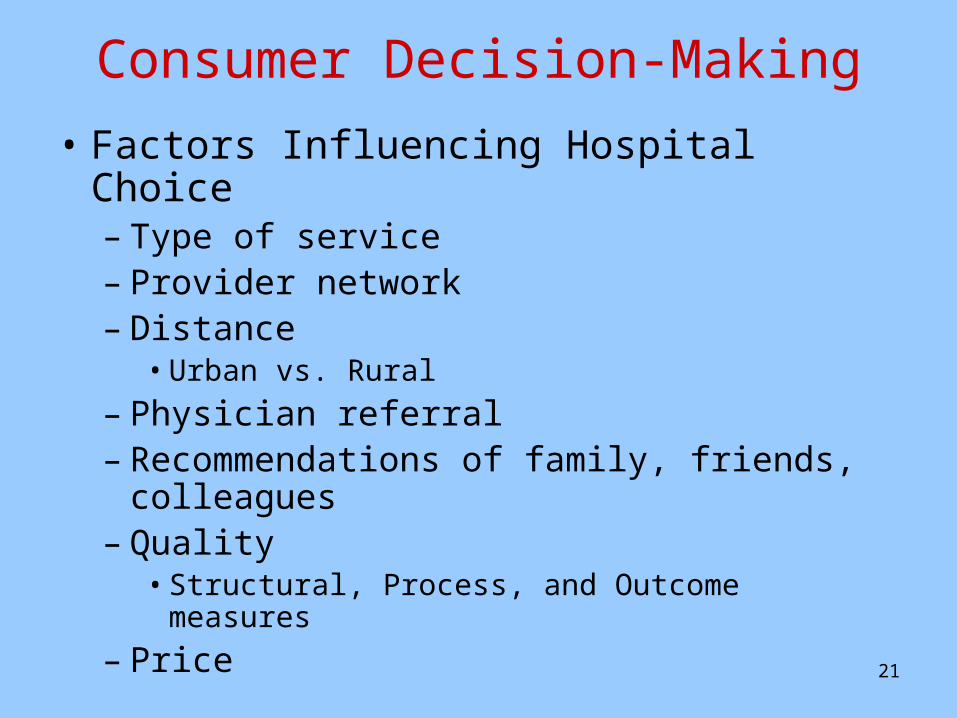
Consumer Decision-Making
• Factors Influencing Hospital Choice– Type of service– Provider network– Distance
• Urban vs. Rural
– Physician referral– Recommendations of family, friends,
colleagues– Quality
• Structural, Process, and Outcome measures
– Price
22
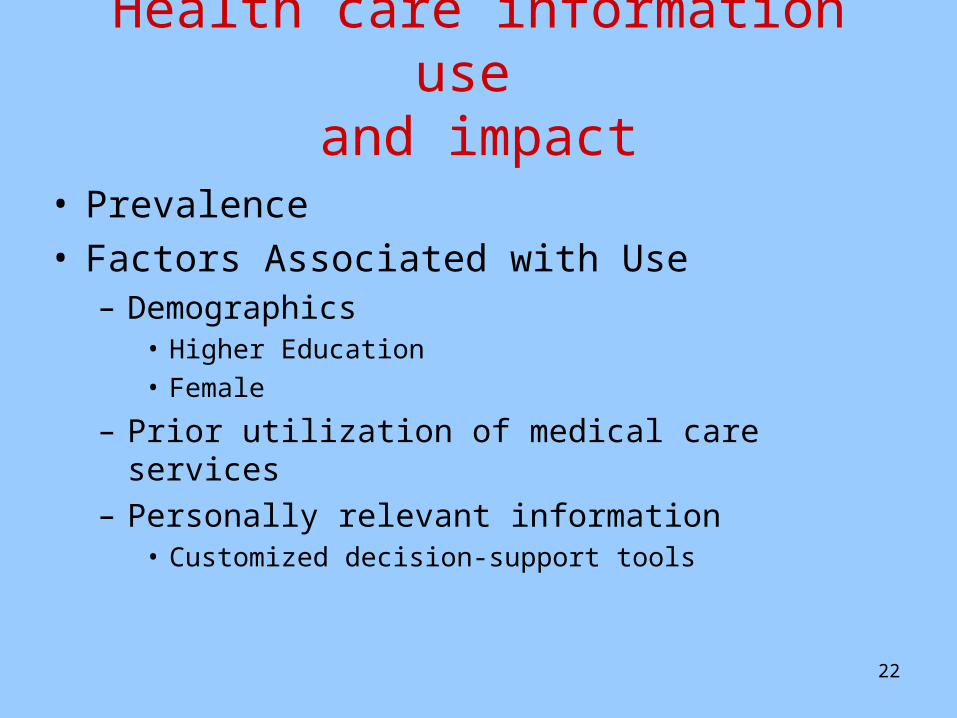
Health care information use and impact
• Prevalence• Factors Associated with Use
– Demographics• Higher Education• Female
– Prior utilization of medical care services– Personally relevant information
• Customized decision-support tools
23
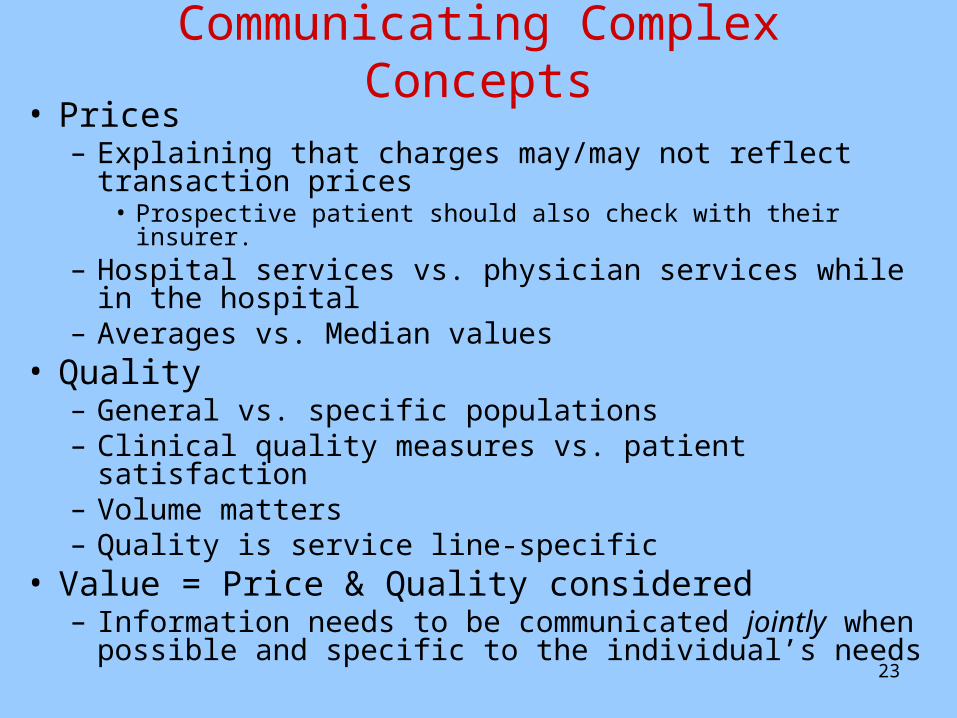
Communicating Complex Concepts• Prices
– Explaining that charges may/may not reflect transaction prices
• Prospective patient should also check with their insurer.– Hospital services vs. physician services while in the
hospital– Averages vs. Median values
• Quality– General vs. specific populations– Clinical quality measures vs. patient satisfaction– Volume matters– Quality is service line-specific
• Value = Price & Quality considered– Information needs to be communicated jointly when
possible and specific to the individual’s needs
24
Effective Communication of Price and
Quality Information
• Method of communication– Who is the audience?– On-line, Hard copy, Verbally
• Presentation – Layperson language– Differing levels of detail– Side-by-side comparisons
• Logistical Issues– How easily will prospective hospital patients be able to
comparison shop in order to make an informed choice?– How will hospitals respond to increasing demand by
consumers for relevant, accurate, and comprehensive price and quality information?
25
Concluding Remarks
• Transparency movement– Not likely to be a “magic bullet” to solve the
fundamental problems associated with the health care system
– Very important step for increasing consumer and provider awareness regarding absolute and relative performance differences across the system
– May help to facilitate performance improvement

26
Resources:• Minnesota Hospital Price Check
– www.mnhospitalpricecheck.org• Minnesota Board of Medical Practice
– http://www.state.mn.us/portal/mn/jsp/home.do?agency=BMP
• Minnesota Community Measurement (medical groups)– http://www.mnhealthcare.org/~main.cfm
• Medicare– Medicare payments by county (inpatient, outpatient,
physicians)• http://www.cms.hhs.gov/HealthCareConInit/02_Hospital.asp
– Hospital Compare (Quality metrics for heart attack, heart failure, pneumonia, and surgical site infection prevention)
• http://www.hospitalcompare.hhs.gov/

27
Thank You!
Contact Information:
Professor Jean Abraham
Division of Health Policy and Management
School of Public Health
University of Minnesota
Email: [email protected]
Phone: 612-625-4375