WINTER FEEDING OF BEEF COWS By Tom Hoagland University of Connecticut.
Upload
bertram-johnstonCategory
view
212download
0
1
The Federal BudgetPast – Present – Uncertain Future
Stanford Institute for Economic Policy Research
G. William Hoagland
March 9, 2012

2
Recession as announced by National Bureau of EconomicResearch
Surplus
Deficit
Trend
Actual Alternative Projections
Source: Congressional Budget Office; The Budget and Economic Outlook: Fiscal Years 2012 to 2022. January 2012.Office of Management and Budget: FY 2013 Budget of the United States. February 2012.
“The Past, Present & Future”
Total Budget Surplus/Deficit
CBO Baseline. Alternative Baseline & The President’s Projections: January 2012 FY 1965 - 2022
22

3
“The Past”Changes in Projections of Surplus Since January 2001
($ in billions)
2001-2011 % of Swing
Surplus Projected in January 2001:
$ 5,610 NA
Legislative Changes:
•Revenues
•Outlays (Afghan/Iraq/Related Activities)
Total
- 2,808
+ 5,712(+ 1,263)
- 8,520
23%
48%(11%)
(71%)
Economic/Technical Changes:
•Revenues
•Outlays
•Total
- 3,412
-83
- 3,329
28%
1%
(29%)
Total Swing
Actual Deficit
$11,849
- $ 6,239
100%NA
Source: Congressional Budget Office; Joint Committee on Taxation

4
“The Future” Budget Outlook FY 2011 – 2017
(In Billions of Dollars – % of GDP)President’s FY 2013 Budget
2011Actual
2012Est
2013Proj →
2014 2015 2016 2017% ∆ annual
2012-2017
Receipts 2,302 2,469 2,902 3,215 3,450 3,680 3,919 + 9.6%
Spending 3,603 3,796 3,803 3,883 4,060 4,329 4,532 + 3.6%
Deficits
% of GDP
1,300
8.7%
1,327
8.5%
901
5.5%
668
3.9%
610
3.4%
649
3.4%
612
3.0%
NA
NA
Public Debt
% GDP
Debt Subject Limit*
% GDP
10,128
68%
14,747
98%
11,578
74%
16,334
104%
12,637
77%
17,532
106%
13,445
78%
18,485
106%
14,198
78%
19,412
105%
14,980
78%
20,379
104%
15,713
77%
21,315
103%
+ 9.1%
+5.4%
Source: Office of Management and Budget, Fiscal Year 2013 Budget of the U.S. Government. February 2012.
Nominal GDP estimated to increase 5.5 % annually 2012-2017: Real GDP estimated to increase 4.3% annually 2012-
2017.

5
Federal Debt Held by the Public Baseline, Alternative Fiscal Scenario, President’s Budget
% of GDP
CBO’s Alternative Fiscal Scenario assumes expiring tax provisions (other than the payroll tax reduction) are extended, the AMT is indexed for inflation after 2011, Medicare’s payment rates for physicians’ services are held constant at their current level, and automatic spending reductions required by the Budget Control Act do not take effect. CBO January 2012. President’s Budget estimates from FY 2013 Federal Budget, OMB, February 2012.
%
President’s BudgetAvg. 2012-22: 77%Avg. 2012-22:
84.4%Avg. 2012-22:
68.6%
62.0%
94.2%
76.5%
72.5%
6
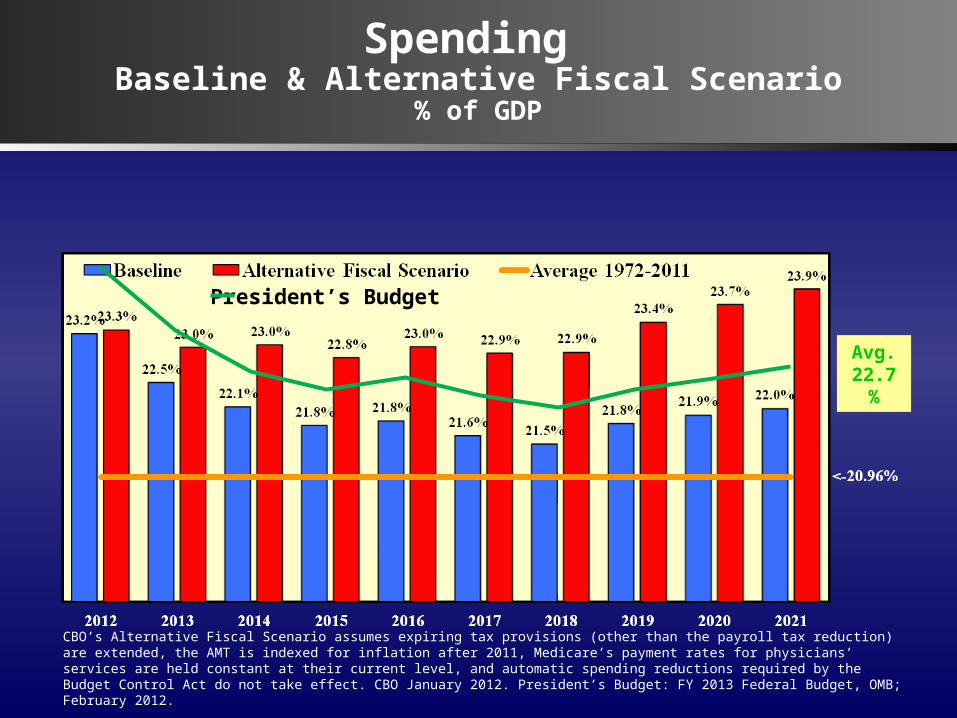
Spending Baseline & Alternative Fiscal Scenario
% of GDP
CBO’s Alternative Fiscal Scenario assumes expiring tax provisions (other than the payroll tax reduction) are extended, the AMT is indexed for inflation after 2011, Medicare’s payment rates for physicians’ services are held constant at their current level, and automatic spending reductions required by the Budget Control Act do not take effect. CBO January 2012. President’s Budget: FY 2013 Federal Budget, OMB; February 2012.
President’s Budget
Avg. 22.7
%

7
Revenues Baseline & Alternative Fiscal Scenario
% of GDP
CBO’s Alternative Fiscal Scenario assumes expiring tax provisions (other than the payroll tax reduction) are extended, the AMT is indexed for inflation after 2011, Medicare’s payment rates for physicians’ services are held constant at their current level, and automatic spending reductions required by the Budget Control Act do not take effect. CBO January 2012. President’s Budget: FY 2013 Federal Budget, OMB; February 2012.
President’s Budget
Avg. 20.8%
8
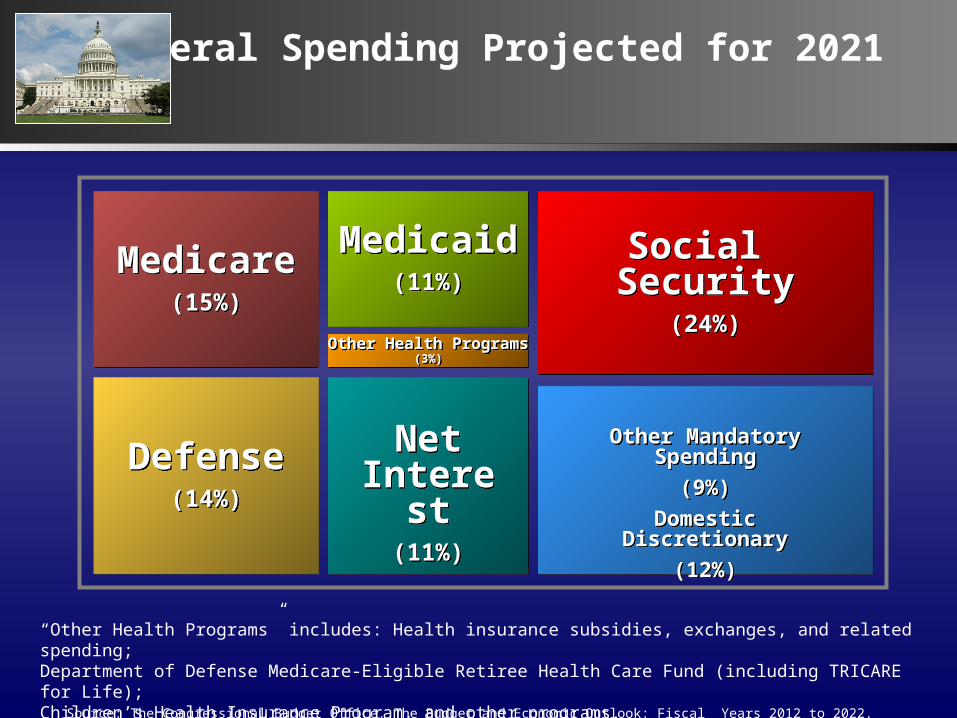
Federal Spending Projected for 2021
“Other Health Programs” includes: Health insurance subsidies, exchanges, and related spending;Department of Defense Medicare-Eligible Retiree Health Care Fund (including TRICARE for Life);Children’s Health Insurance Program, and other programs.
Medicare(15%)
Medicare(15%)
Defense(14%)
Defense(14%)
Medicaid(11%)
Medicaid(11%)
Social Security
(24%)
Social Security
(24%)
Other Mandatory Spending
(9%)
Domestic Discretionary
(12%)
Other Mandatory Spending
(9%)
Domestic Discretionary
(12%)
NetInterest
(11%)
NetInterest
(11%)
Other Health Programs(3%)
Other Health Programs(3%)
Source: The Congressional Budget Office. The Budget and Economic Outlook: Fiscal Years 2012 to 2022. January 2012.

9
Major Components of Federal Expenditures% of GDP 2011-2051
Source: Congressional Budget Office.
Other Mandatory Spending
Healthcare
Social SecurityDiscretionary Spending
0%
2%
4%
6%
8%
10%
12%
14%
2011 2021 2031 2041 2051
% of GDP

10
Alternative Medicare Spending PathsSpending Relative to GDP
8
14
12
10
The unstainable pathwe are on
6
2
0
4
2010 2015 2020 2025 2030 2035 2040 2045 2050 2055 2060 2065 2070 2075 2080
GDP+2%
Goal of:Bowles/Simpson, Rivlin/Ryan, Domenici/Rivlin, Ryan/Wyden,and Obama/CBO
GDP+1%
Medicare Trustees Report Estimate of PPACA
Ryan (House Republican)
GDP+0%
Year
% G
DP

11
Health Benefit Costs as a Share of Wages forFull-Time, Full-Year Workers Receiving
Health Care Benefits through Their Own Employer
Deciles 1980 1990 2000 2009
1 15.4% 30.9% 38.1%
2 9.5 18.7 22.9 30.9
3 8.0 15.3 18.6 25.5
4 7.2 13.3 16.0 22.3
5 6.3 11.6 14.0 19.4
6 5.8 9.9 12.1 16.8
7 5.4 9.2 10.8 14.8
8 4.9 8.2 9.2 12.5
9 4.3 6.9 7.8 10.2
10 3.2 4.9 4.7 6.3
Source: Steven A. Nyce and Sylvester Schieber, “Treating Our Ills and Killing Our Prospects” paper prepared for the Coalition for Affordable Health Care, July 2011.
49.5%
12
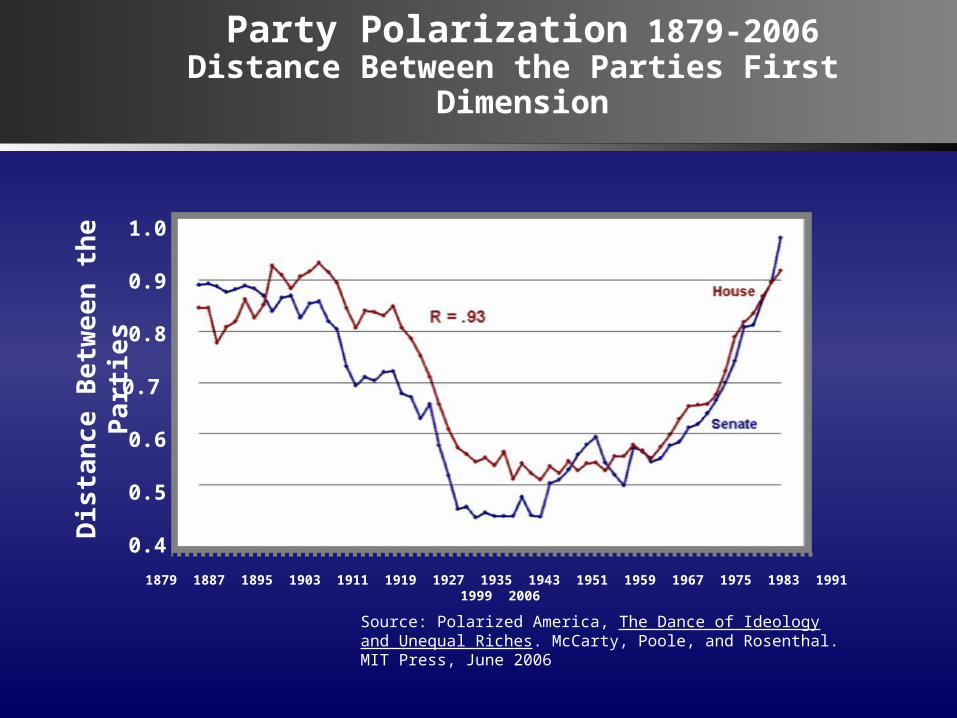
1879 1887 1895 1903 1911 1919 1927 1935 1943 1951 1959 1967 1975 1983 1991 1999 2006
Party Polarization 1879-2006Distance Between the Parties First
Dimension
1.0
0.9
0.8
0.7
0.6
0.5
0.4Dis
tan
ce B
etw
een
th
e
Part
ies
Source: Polarized America, The Dance of Ideology and Unequal Riches. McCarty, Poole, and Rosenthal. MIT Press, June 2006

13
It could be worse.


![Hoagland long c.v. - Woods Hole Oceanographic Institution082316]_237864.pdf · Hoagland P, Kite-Powell HL, Jin D, Solow AR. 2013. Supply-side approaches to the economic valuation](https://static.fdocuments.us/doc/165x107/5ec40dc68f881e5c8033479d/hoagland-long-cv-woods-hole-oceanographic-institution-082316-hoagland-p.jpg)