1 Thai Shrimp Farming How much should be taxed? Presented by Tipparat Pongthanapanich Department of...
19
1 Thai Shrimp Farming How much should be taxed? Presented by Tipparat Pongthanapanich Department of Environmental and Business Economics Faculty of Social Sciences, University of Southern Denmark Niels Bohrs vej 9, DK-6700 Esbjerg, Denmark Tel: +45 6550 4151; Fax: +45 6550 1091; E-mail: [email protected]
-
Upload
brianna-lawrence -
Category
Documents
-
view
214 -
download
0
Transcript of 1 Thai Shrimp Farming How much should be taxed? Presented by Tipparat Pongthanapanich Department of...
1
Thai Shrimp FarmingHow much should be taxed?
Presented by Tipparat PongthanapanichDepartment of Environmental and Business Economics
Faculty of Social Sciences, University of Southern DenmarkNiels Bohrs vej 9, DK-6700 Esbjerg, Denmark
Tel: +45 6550 4151; Fax: +45 6550 1091; E-mail: [email protected]

2
SOME FACTS…
Thailand is one of the world largest producers 27% of global farm production 0.3 m ton; 32000 farms; 75000 ha Mostly intensive farms The Gulf of Thailand & Andaman Environmental tax has NOT been imposed

3
IN THIS PAPER
Derive optimal corrective tax corrected for environmental problems
4
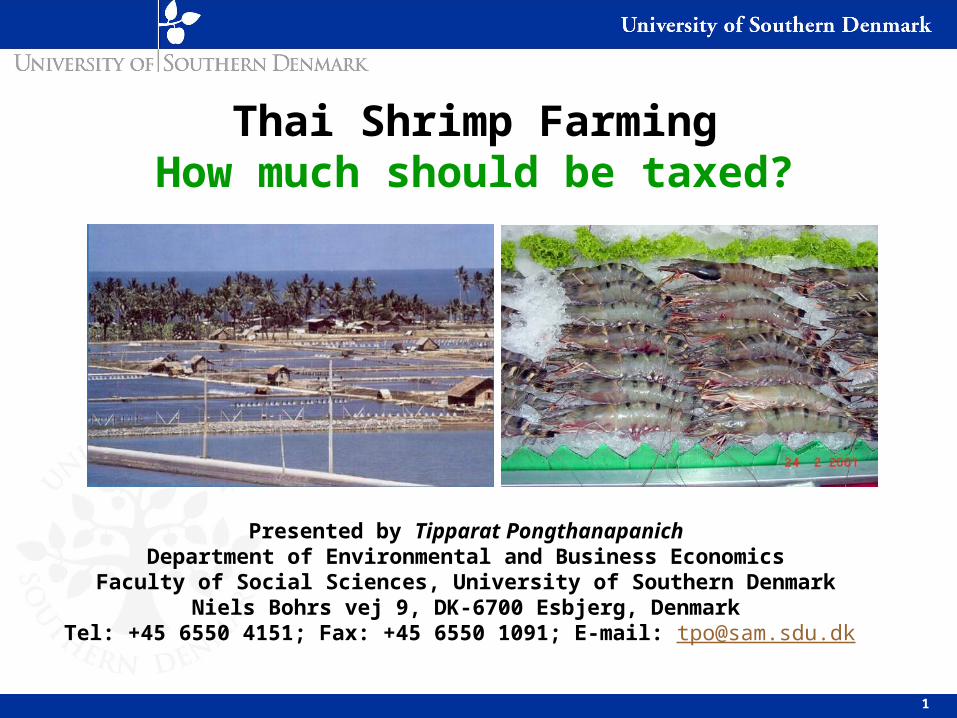
IN THIS PAPER
Introduce taxation?
As an alternative instrument among others (C&C and voluntary adoptions—likely inadequated) To encourage farmers to “change”from pollutive farming (common practice) to env.friendly farming (e.g. CoC, GAPs)

5
EXTERNALITIES
3 main environmental impacts of coastal shrimp farming * effect of cumulative nutrient to the sea (eutrophication) * mangrove conversion * abandoned farms

6
CONCLUSION…
TAX: USD/kg G1 G2 A1 A2 Total
1. Mangrove 0.72 - 0.54 -
2. Abandoned farm 0.22 0.06 0.17 0.04
3. Discharge 0.41 0.41 - -
1+2+3 1.35 0.48 0.71 0.04
Social.opt.prod (tons)
127,545 9,496 20,682 10,055 167,778(72%)
1USD=40THB; Avg.YG=3.125 ton/ha; Avg.YA=5 ton/ha; Avg.shrimp price 4.75 USD/kg

7
…CONCLUSION
TAX: USD/ha/yr G1 G2 A1 A2
1. Mangrove tax 57.26 - 69.65 -
2. Abandoned farm tax 17.51 4.93 21.29 5.48
3. Discharge tax 1,292.42 1,292.42 - -
1+2+3 1,367.19 1,297.35 90.94 5.48
1USD=40THB; Avg.YG=3.125 ton/ha; Avg.YA=5 ton/ha; Avg.shrimp price 4.75 USD/kg
8
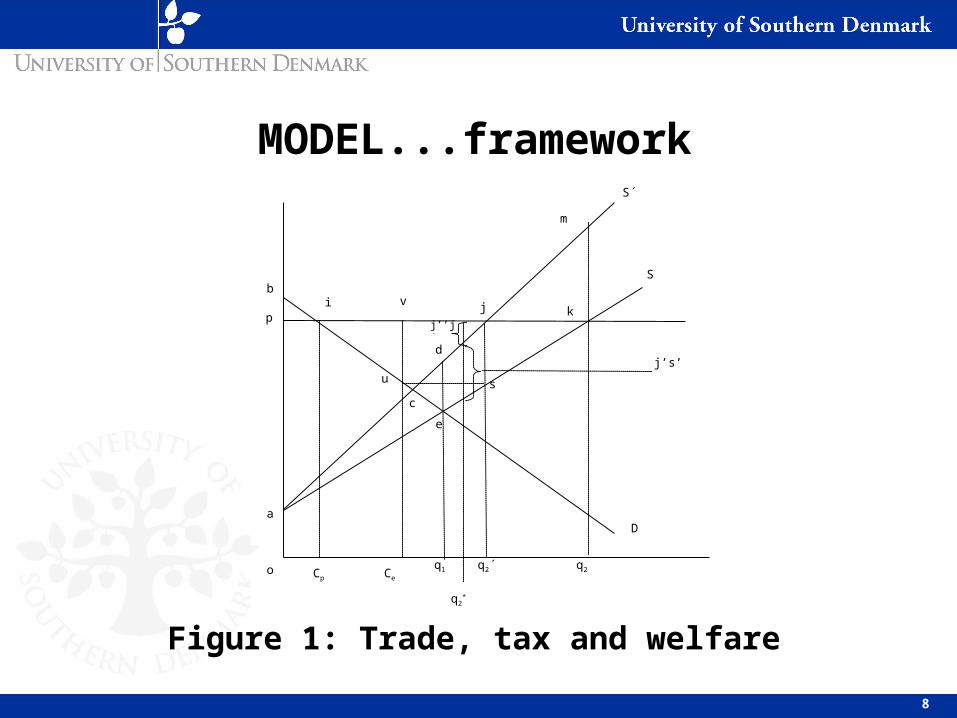
MODEL...framework
S
S´
q2´
b
a
o
j’’j’
j’s’
Ce
u
v
Cp
i
d
c
q1
s
q2
k
m
ji
e
D
p
q2*
Figure 1: Trade, tax and welfare

9
…MODEL
)(),(21
0
22
0
1121 NDTtndQSdQSpQpQWQQ
00,0
)(21
dtWeMax t
NQQN
2211
0)0( N^
)( NTN
s.t.
given
))(()( 2211 NQQtWH
..initial level
..D(N) exerts when N stock reaches threshold

10
RESULT…
))((* )( tTev
t
vt)(*
vt)(*
vt)(*
0<t≤T T≤t<∞
1))((
11*1 /}{)( be
vaptQ tT
111
*1 /}{)( b
vaptQ
2))((
22*2 /}{)( be
vaptQ tT
222
*2 /}{)( b
vaptQ

11
0
2000
4000
6000
8000
10000
12000
14000
16000
18000
t
THB/ton
μ*G
μ*A
Terminal time: TG = 30 yrs, TA = 150,696 yrs
Implies cumulative nutrient N has a negligible effect to the Andaman sea but significant to the Gulf of Thailand.
…RESULT…base case

12
Socially optimal production (SOP) paths decline after T
0
20000
40000
60000
80000
100000
120000
140000
1600001 5 9 13 17 21 25 29 34 39 44 49 54 59 120
200 t
tons
Q*G1
Q*G2
Q*A1
Q*A2
…RESULT…base case
13
To achieve SOP, overall productions should be reduced 20-30% of POP From where? * Farming in ex-mangrove both on G & A should be decreased in higher proportion than in outside mangrove * And production from G should be reduced more than from A
…RESULT…base case

14
SOP will provide higher “net welfare” than those from POP, if steady-state tax regime is in place. SOP provides higher “net gain from trade” through times Tax revenue = 160-200 m USD/yr
…RESULTS…base case

15
Numerical results are very sensitive to biogeochemical parameters (N assimilative rate, N load concentration, threshold), which could cause extremely varied the interpretation of the results On the other hand, shrimp price & env.value only affect the scale of the results
…RESULT…sensitivity analysis

16
For G , the steady-state tax can be applied as indicated by the result of short terminal time. For A, the initial tax—a zero discharge tax can be applied.
DISCUSSION…

17
Good farm practices should be encouraged as options for pollution management… …As the results show that, IF shrimp industry can reduce overall load concentration to at least 50% lower than the present level, then the adoption of POP could be seen as more economical as well as politically acceptable than SOP
…DISCUSSION

18
“If Thai shrimp farming were taxed, would it make farmers’ behavior change?”

19
THANK YOU…