1 Tests with two+ groups We have examined tests of means for a single group, and for a difference if...
23
1 Tests with two+ groups We have examined tests of means for a single group, and for a difference if we have a matched sample (as in husbands and wives) Now we consider differences of means between two or more groups
-
Upload
harvey-payne -
Category
Documents
-
view
214 -
download
0
Transcript of 1 Tests with two+ groups We have examined tests of means for a single group, and for a difference if...

1
Tests with two+ groups
We have examined tests of means for a single group, and for a difference if we have a matched sample (as in husbands and wives)
Now we consider differences of means between two or more groups

2
Two sample t test
Compare means on a variable for two different groups. Income differences between males and
femalesAverage SAT score for blacks and whitesMean time to failure for parts manufactured
using two different processes
3
New Test - Same Logic
Find the probability that the observed difference could be due to chance factors in taking the random sample.If probability is very low, then conclude that difference did not happen by chance (reject null hypothesis)If probability not low, cannot reject null hypothesis (no diff. between groups)
4
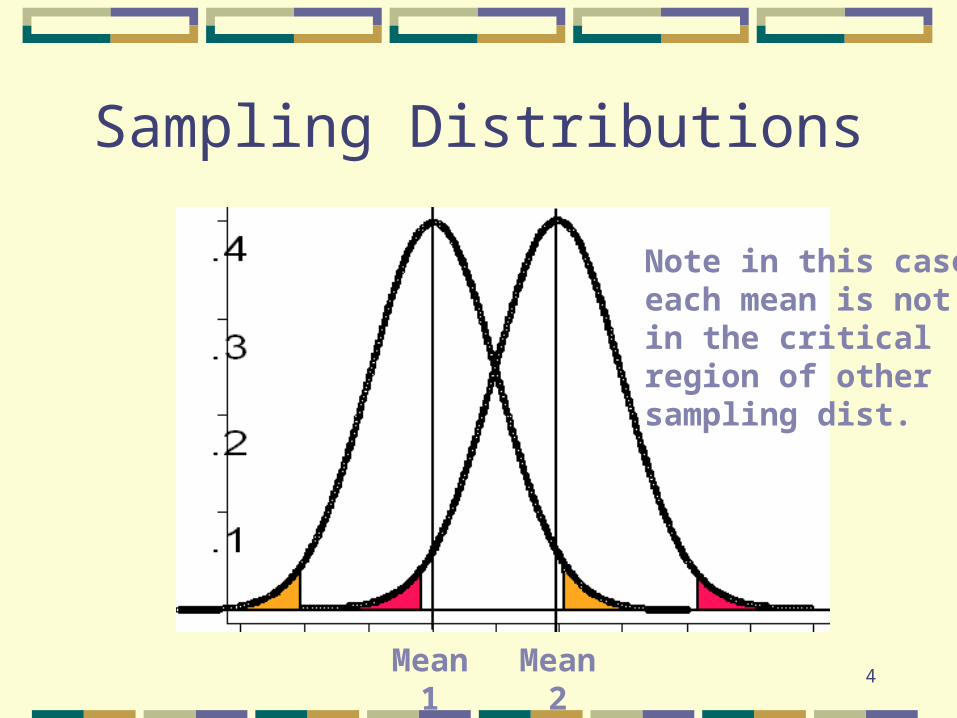
Sampling Distributions
Mean1
Mean2
Note in this caseeach mean is notin the criticalregion of othersampling dist.

5
Sampling Distributions
Mean1
Mean2
Note each meanis well into thecritical region ofother samplingdistribution.

6
Sampling Dist. of Difference
Differenceof Means
HypothesizeZero Diff.
Big Differences

7
ProcedureCalculate means for each group
Calculate difference
Calculate standard error of difference
Test to see if difference is bigger than “t” standard errors (small samples)z standard errors (large samples)
t and z are taken from tables at 95 or 99 percent confidence level.

8
Standard error of difference
2121
222
211 11
2
)1()1(21 nnnn
snsns yy
Pooled estimate of standard deviation
Divide bysamplesizes

9
t test
21
21
yys
yyt
Difference of Means
Standard error ofdifference of means
If t is greater than table value of t for 95%confidence level, reject null hypothesis

10
Three or more groups
If there are three or more groups, we cannot take a single difference, so we need a new test for differences among several means.This test is called ANOVA for ANalysis Of VArianceIt can also be used if there are only two groups

11
Analysis of Variance
Note the name of the test says that we are looking at variance or variability.The logic is to compare variability between groups (differences among the means) and variability within the group (variability of scores around the mean)These are call the between variance and the within variance, respectively
12
The logic
If the between variance is large relative to the within variance, we conclude that there are significant differences among the means.
If the between variance is not so large, we accept the null hypothesis
13
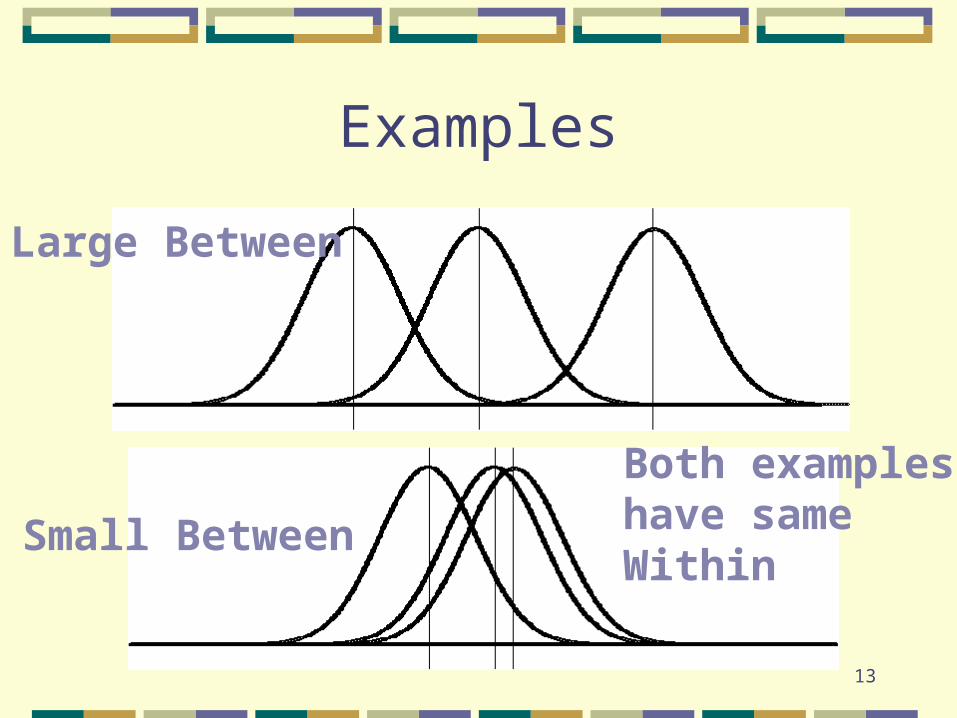
Examples
Large Between
Small Between
Both exampleshave sameWithin
14
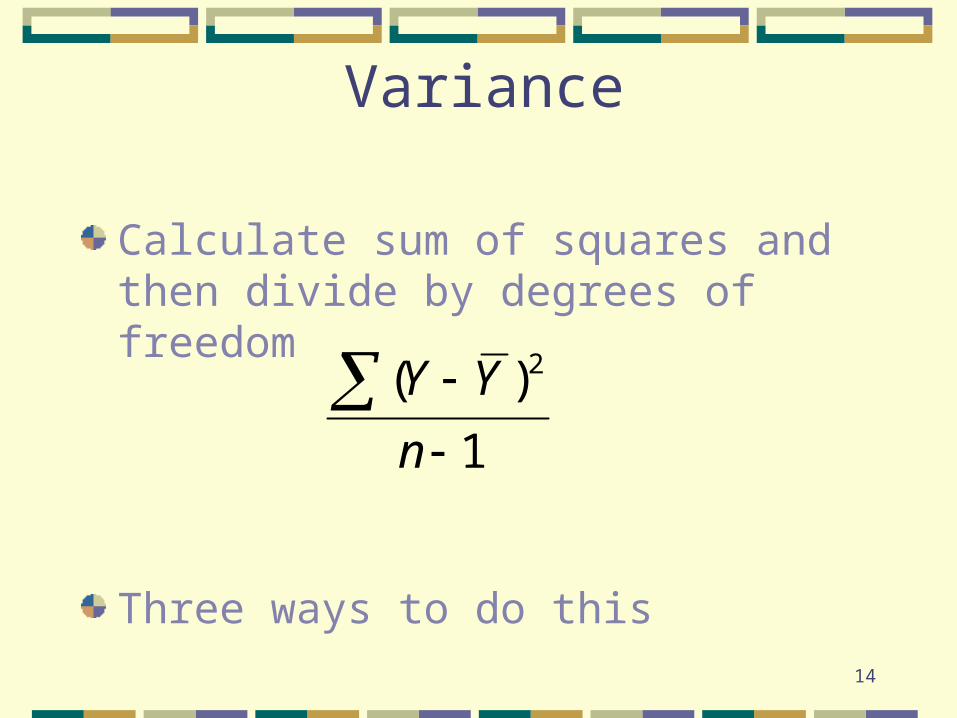
Variance
Calculate sum of squares and then divide by degrees of freedom
Three ways to do this
1
)( 2
n
YY

15
Total, Within, and BetweenTotal variance is the mean squared deviation of individual scores around the overall (total) mean
Within variance is the mean squared deviation of individual scores around each of the group means
Between variance is the mean squared deviation of group means around the overall (total) mean
16
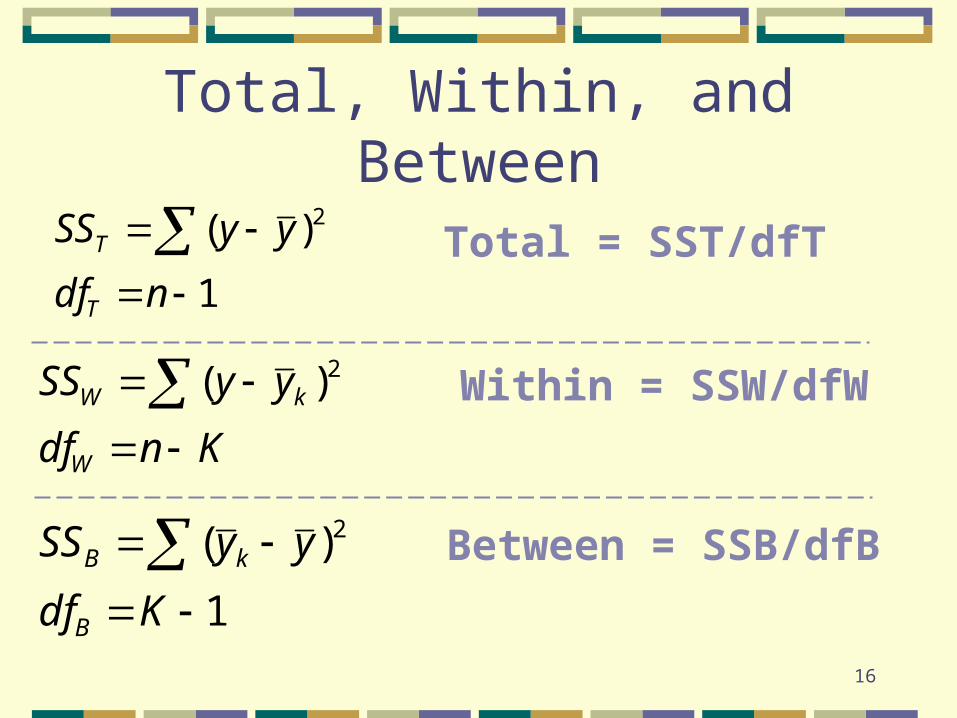
Total, Within, and Between
1
)( 2
ndf
yySS
T
T
Kndf
yySS
W
kW
2)(
1
)( 2
Kdf
yySS
B
kB
Total = SST/dfT
Within = SSW/dfW
Between = SSB/dfB

17
F test for ANOVA
The F statistic has a distribution somewhat like the chi-square. It made of the ratio of two variances.
For our purpose, we will compare the between and within estimates of variance
Create a ratio of the two -- called an F ratio. Between variance divided by the within variance
18
F-ratio
Table in the back of the book has critical values of the F statistic. Like the t distribution, we have to know degrees of freedom
Different than the t distribution, there are two different degrees of freedom we need
Between (numerator) and within (denominator)
19
Decision
If F-ratio for our sample is larger than the critical value, we reject the null hypothesis of no differences among the means
If F-ratio is not so large, we accept null hypothesis of no differences among the means

20
Example (three groups)
1 2 3 4 5 6 7 8 9 Observations
Overall mean is 5
222
222
222
)59()58()57(
)56()55()54(
)53()52()51(
TSS
60

21
Example (within)
1 2 3 4 5 6 7 8 9 Observations
222
222
222
)89()88()87(
)56()55()54(
)23()22()21(
WSS
2 5 8 Group Means
6
22
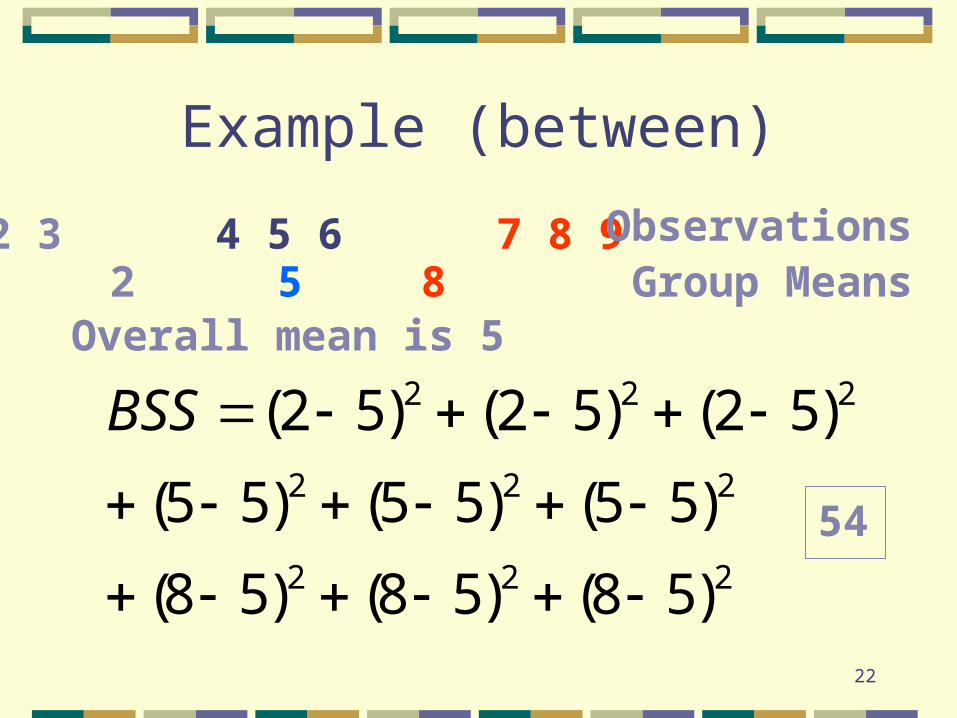
Example (between)
222
222
222
)58()58()58(
)55()55()55(
)52()52()52(
BSS
1 2 3 4 5 6 7 8 9 Observations2 5 8 Group MeansOverall mean is 5
54
23
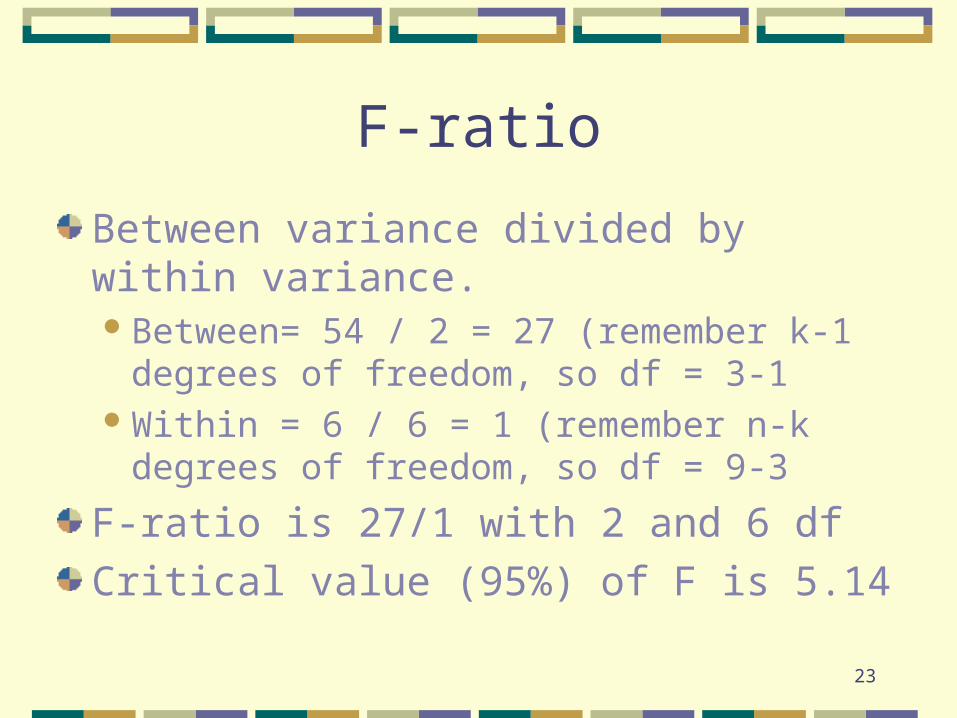
F-ratio
Between variance divided by within variance.Between= 54 / 2 = 27 (remember k-1 degrees
of freedom, so df = 3-1Within = 6 / 6 = 1 (remember n-k degrees of
freedom, so df = 9-3
F-ratio is 27/1 with 2 and 6 df
Critical value (95%) of F is 5.14