Massachusetts Joint Subcommittee on Student Debt: Student Loan Final Report
date post
21-Dec-2015Category
view
214download
1
1
Student Characteristics And Measurements of Student Satisfaction
Prepared for: The Faculty Council Subcommittee on Retention
The Office of Institutional Research and Policy StudiesNovember 19, 2003
Kevin B. Murphy, Research Analyst

2
This Presentation Will Report Data Collected From Three Main Sources
• The National Survey of Student Engagement Administered in Spring 2002 (NSSE 2002)– 270 UMB Respondents– Comparison Groups
• Urban Consortium• Aggregate of Other UMass Campuses• Other Doctoral Intensive Universities• National
• Retention Study of Fall 2000 First Time Full Time Freshmen (Retention 2001)– 209 Respondents
• Graduating Senior Satisfaction Survey of May 2003 (GSS 2003)– 1150 Respondents

3
UMass Boston Students Differed from the NSSE Comparison Groups On a Number of Background Characteristics
• Age• Race/Ethnicity• Entrance Status• Foreign Citizenship• Family Income• Hours Worked Off Campus Weekly for Pay• Hours Spent Weekly Caring for Dependents• Part Time Attendance

4
UMass Boston Students Are More Likely To Have Come Here From Other Colleges
Source: NSSE 2002
Percentage of Respondents Reporting That They Began College at a Different Institution
19%
4%
12%6% 7%
76%
39%
56%
45%39%
UMB UMass Urban Doc. Int. National
First YearStudents
Seniors

5
UMass Boston Students Are Also More Likely To Have Come Here from Other Countries
Source: NSSE 2002
Percentage of Respondents Who Report Being International Students or Foreign Nationals
21%
7%5% 6% 5%
18%
6% 5% 5% 5%
UMB UMass Urban Doc_Int National
First Year Students
Seniors
6
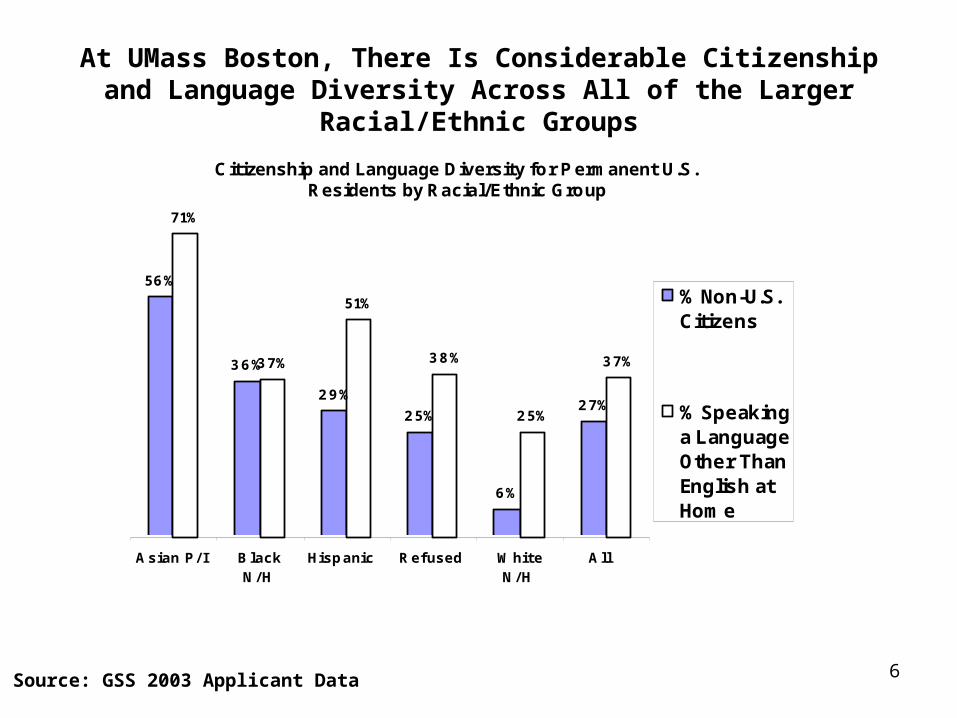
At UMass Boston, There Is Considerable Citizenship and Language Diversity Across All of the Larger Racial/Ethnic Groups
Source: GSS 2003 Applicant Data
Citizenship and Language Diversity for Permanent U.S. Residents by Racial/Ethnic Group
56%
36%
29%
25%
6%
27%
71%
37%
51%
38%
25%
37%
Asian P/ I BlackN/H
Hispanic Refused WhiteN/H
All
% Non-U.S.Citizens
% Speakinga LanguageOther ThanEnglish atHome
7
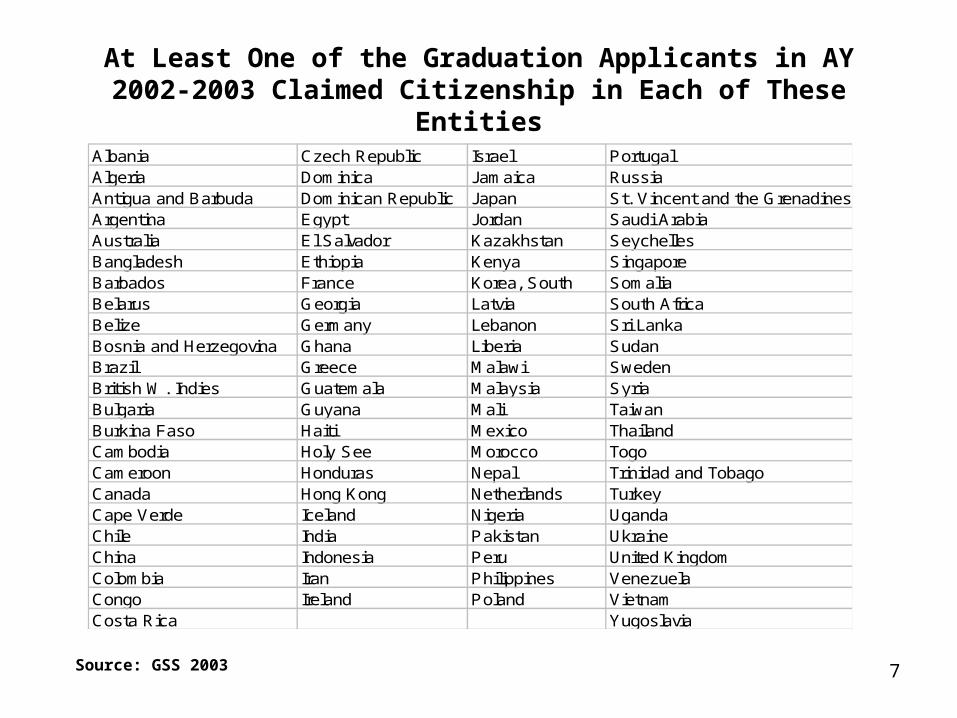
At Least One of the Graduation Applicants in AY 2002-2003 Claimed Citizenship in Each of These Entities
Albania Czech Republic Israel PortugalAlgeria Dominica Jamaica RussiaAntigua and Barbuda Dominican Republic Japan St. Vincent and the GrenadinesArgentina Egypt Jordan Saudi ArabiaAustralia El Salvador Kazakhstan SeychellesBangladesh Ethiopia Kenya SingaporeBarbados France Korea, South SomaliaBelarus Georgia Latvia South AfricaBelize Germany Lebanon Sri LankaBosnia and Herzegovina Ghana Liberia SudanBrazil Greece Malawi SwedenBritish W. Indies Guatemala Malaysia SyriaBulgaria Guyana Mali TaiwanBurkina Faso Haiti Mexico ThailandCambodia Holy See Morocco TogoCameroon Honduras Nepal Trinidad and TobagoCanada Hong Kong Netherlands TurkeyCape Verde Iceland Nigeria UgandaChile India Pakistan UkraineChina Indonesia Peru United KingdomColombia Iran Philippines VenezuelaCongo Ireland Poland VietnamCosta Rica Yugoslavia
Source: GSS 2003
8
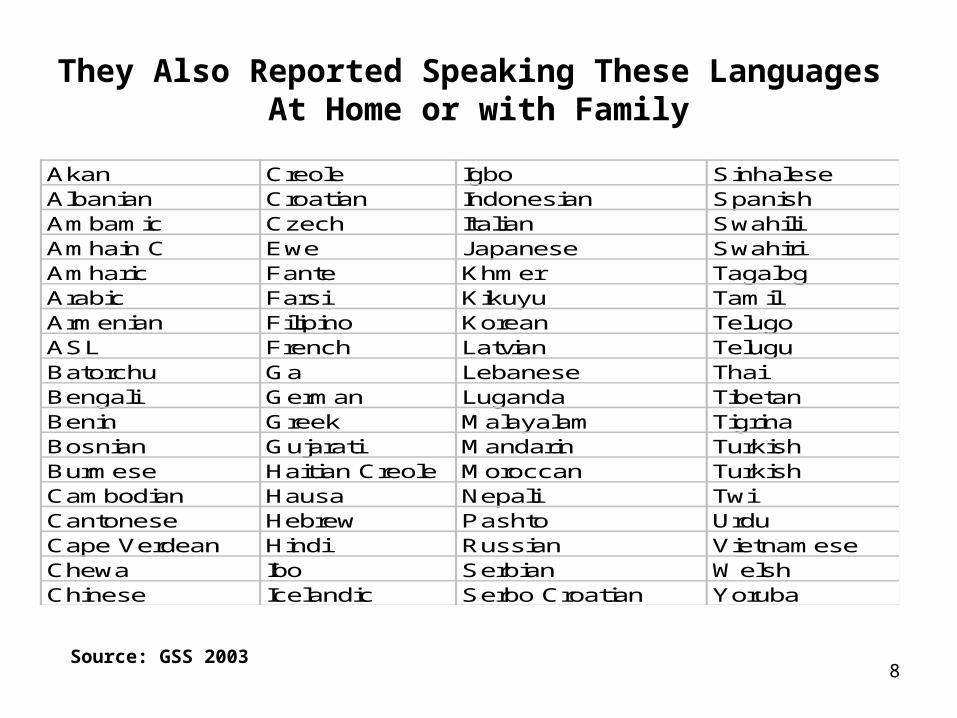
They Also Reported Speaking These Languages At Home or with Family
Akan Creole Igbo SinhaleseAlbanian Croatian Indonesian SpanishAmbamic Czech Italian Swahili Amhain C Ewe Japanese SwahiriAmharic Fante Khmer TagalogArabic Farsi Kikuyu TamilArmenian Filipino Korean TelugoASL French Latvian TeluguBatorchu Ga Lebanese ThaiBengali German Luganda TibetanBenin Greek Malayalam Tigrina Bosnian Gujarati Mandarin TurkishBurmese Haitian Creole Moroccan Turkish Cambodian Hausa Nepali TwiCantonese Hebrew Pashto UrduCape Verdean Hindi Russian VietnameseChewa Ibo Serbian WelshChinese Icelandic Serbo Croatian Yoruba
Source: GSS 2003

9
UMass Boston Students Reported Lower Levels Of Family Income than Did Their Colleagues at Other
Urban Institutions
Source: NSSE 2002
First Year Students' Best Estimates of Their Total Annual Income (Before Taxes) or the Combined Income of Their Parents if They Are
Listed as a Dependent on Their Parents' Taxes
23%
29%
22%20%
6%
1%
16%
21% 21%
12% 12%
18%
Less than$10,000
$10,000 to$24,999
$25,000 to$49,999
$50,000 to$74,999
$75,000 to$99,999
$100,000 orover
UMB
Urban

10
UMass Boston Students Tend To Work More Hours Off Campus Each Week
Source: NSSE 2002
Percent of Respondents Who Reported Working More Than 20 Hours Per Week Off Campus for Pay
45%
12%
31%
17%13%
52%
24%
51%
38%
30%
UMB UMass Urban Doc. Int. National
First YearStudents
Seniors
11
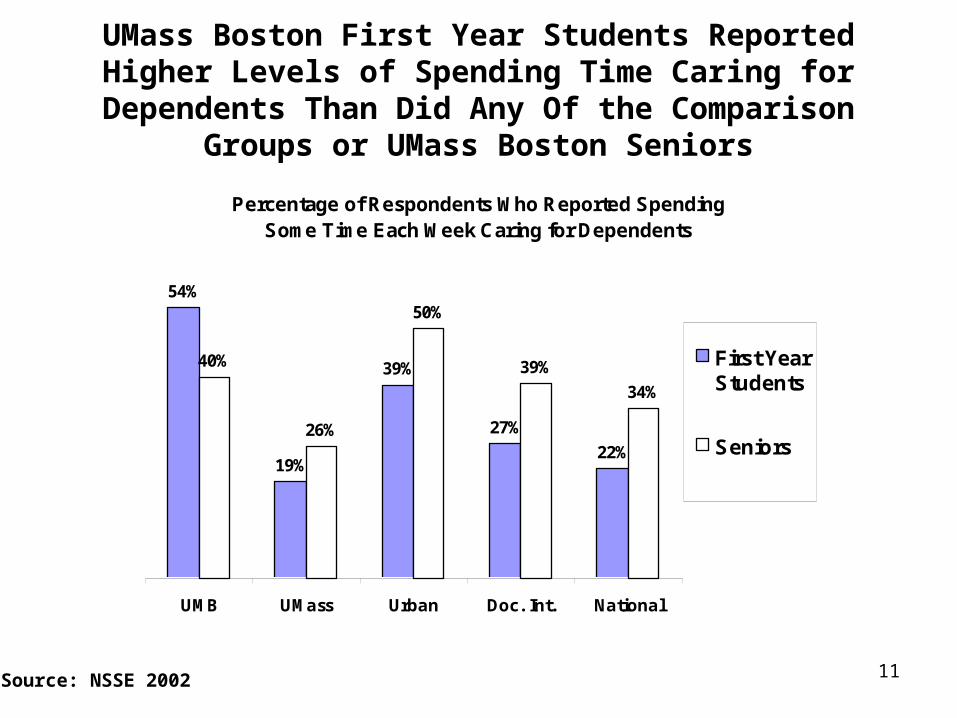
UMass Boston First Year Students Reported Higher Levels of Spending Time Caring for Dependents Than Did Any Of the Comparison Groups or UMass Boston Seniors
Source: NSSE 2002
Percentage of Respondents Who Reported Spending Some Time Each Week Caring for Dependents
54%
19%
39%
27%
22%
40%
26%
50%
39%
34%
UMB UMass Urban Doc. Int. National
First YearStudents
Seniors
12
All of these time constraints and outside pressures
keep UMB students from engaging with the college
experience as much as they otherwise might.

13
UMass Boston Students Are LessLikely to Attend School Full Time
Source: NSSE 2002
Percentage of Respondents Who Attend School Full Time
73%
98%
87%94% 95%
62%
93%
68%
79%83%
UMB UMass Urban Doc. Int. National
First YearStudents
Seniors

14
UMass Boston First Year Students and Seniors Spend Much Less Time Working with other Students outside of Class Than Do Their Colleagues at the other Doctoral Intensives
Or in any other Comparison Group
Source: NSSE 2002
Percentage of Respondents Who Reported Working With Other Students Outside of Class To Prepare
Class Projects "Often" or "Very Often"
17%
31% 30%
38%41%43%
50% 49%
56% 56%
UMB UMass Urban Doc. Int. National
FirstYearStudents
Seniors
15
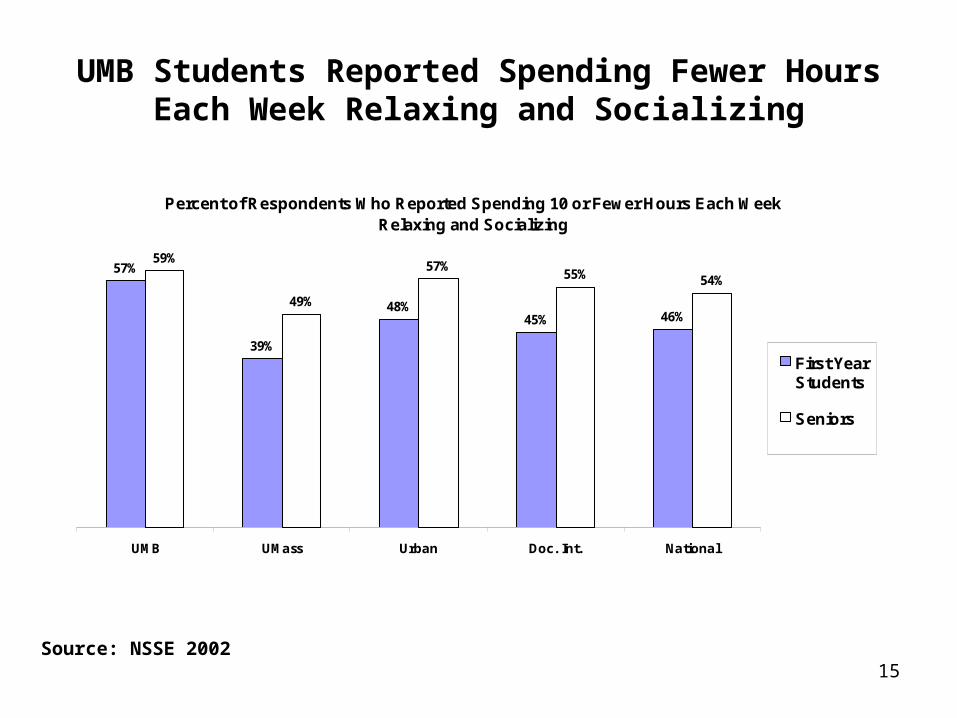
UMB Students Reported Spending Fewer Hours Each Week Relaxing and Socializing
Percent of Respondents Who Reported Spending 10 or Fewer Hours Each Week Relaxing and Socializing
57%
39%
48%45% 46%
59%
49%
57%55% 54%
UMB UMass Urban Doc. Int. National
First YearStudents
Seniors
Source: NSSE 2002

16
UMass Boston First Year Students and Seniors are More Likely To Have Never Worked with Faculty on outside Activities than Are Their
Colleagues at the other Doctoral Intensives
Source: NSSE 2002
Percentage of Respondents Who Reported "Never" Working with Faculty on Activities
Other than Coursework
74% 74% 74%
66%62%
66%
52%
64%
56%
47%
UMB UMass Urban Doc. Int. National
First YearStudents
Seniors

17
UMass Boston First Year Students Were Also Significantly Less Likely to Have Talked with a Faculty Member about Career Plans
Percentage of First Year Students Who Reported That They "Never" Talked about Career Plans with a Faculty
Member or Advisor
40%
36%
30%
24% 23%
UMB UMass Urban Doc_Int National
Source: NSSE 2002
18
Social Life and Recreational Opportunities

19
Social Life, Recreational and Co-Curricular Opportunities, and Campus Events Ranked Very Low in the Recent Graduating Senior Satisfaction Survey, but Recreational etc. and Campus Events Showed Significant
Improvement over August 2002.
Source: GSS 2003
Mean General Satisfaction Ratings
3.1
4.0
4.0
4.2
4.3
4.4
4.7
4.9
5.0
5.1
5.1
5.3
5.3
5.3
5.7
Parking
Social Life on Campus
Appearance of the Campus
Recreational and Co-curricular Opps.
Campus Events and Activities
Acad. Adv. at the Advising Center
Financial Aid Services
Science Teaching Labs
Registration Procedures
Library Resources
Computing Facilities
Overall Experience at UMass Boston
Safety on Campus
Email and Internet Access
Public Transportation (if used)

20
UMB NSSE Respondents Reported that UMB Emphasized Providing Support for Them to Succeed Academically
Percent of Students Reporting that Their Institution Emphasizes Providing Support for Them to Succeed Academically
"Quite a Bit" or "Very Much"
65%59%
63%69%
74%
63%
53% 53%59%
65%
UMB OtherUMass
Urban Doc.Intensive
National
First YearStudents
Seniors
Source: NSSE 2002

21
However, Only Half as Many Reported that UMB Emphasized Providing Support for Them to Thrive Socially
Percent of Students Reporting that Their Institution Emphasizes Providing Support for Them to Thrive Socially
"Quite a Bit" or "Very Much"
29%32%
30%
36%
41%
21%25%
19%
24%
32%
UMB Other UMass Urban Doc.Intensive
National
First YearStudents
Seniors
Source: NSSE 2002
22
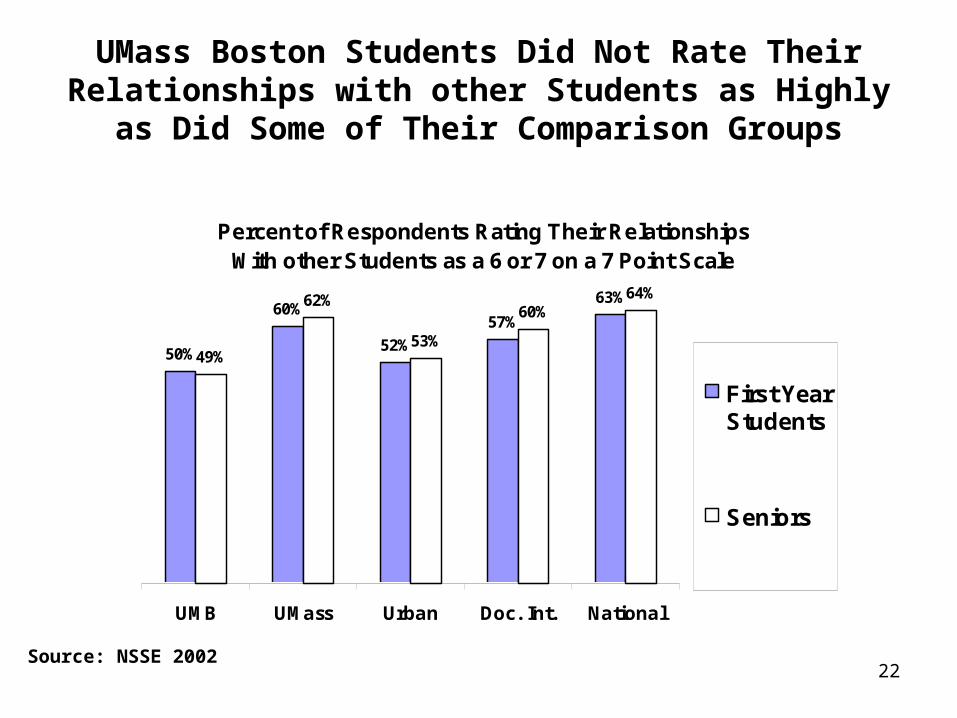
UMass Boston Students Did Not Rate Their Relationships with other Students as Highly as Did
Some of Their Comparison Groups
Percent of Respondents Rating Their Relationships With other Students as a 6 or 7 on a 7 Point Scale
50%
60%
52%
57%
63%
49%
62%
53%
60%64%
UMB UMass Urban Doc. Int. National
First YearStudents
Seniors
Source: NSSE 2002
23
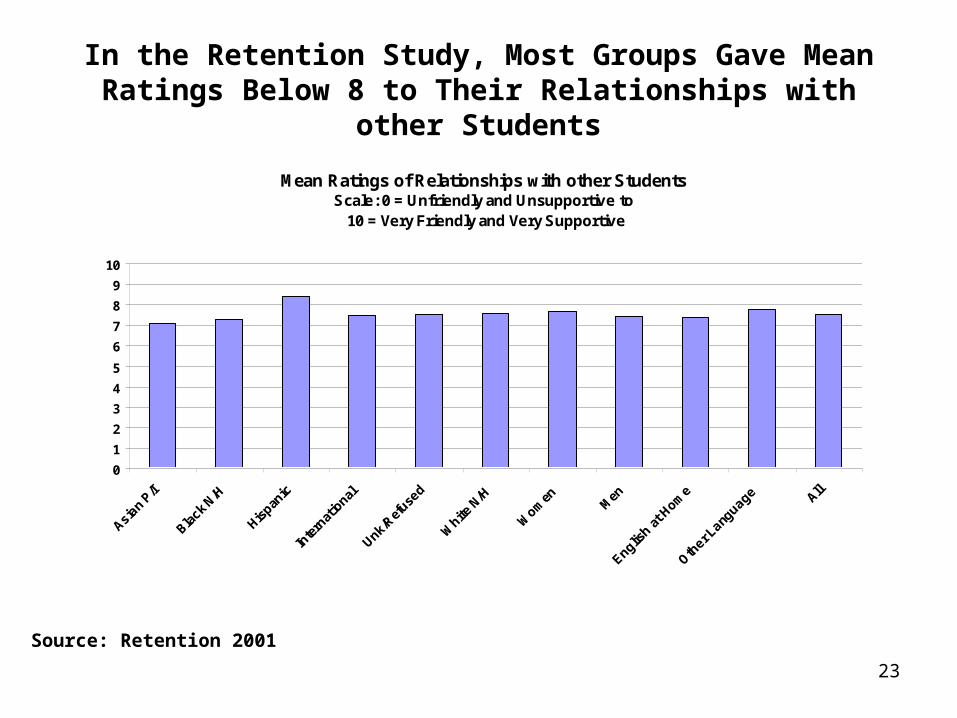
In the Retention Study, Most Groups Gave Mean Ratings Below 8 to Their Relationships with other Students
Mean Ratings of Relationships with other StudentsScale: 0 = Unfriendly and Unsupportive to
10 = Very Friendly and Very Supportive
0
1
2
3
4
5
6
7
8
9
10
Asian
P/I
Black N
/H
Hispan
ic
Inte
rnat
ional
Unk/Ref
used
White
N/H
Wom
en Men
English a
t Hom
e
Other L
anguage All
Source: Retention 2001

24
This Was About the Same as Their Ratings of Faculty
Mean Ratings of Relationships with FacultyScale: 0 = Unhelpful and Unavailable to 10 = Very Helpful & Available
0
1
2
3
4
5
6
7
8
9
10
Asian
P/I
Black N
/H
Hispan
ic
Inte
rnat
ional
Unk/Ref
used
White
N/H
Wom
en Men
English a
t Hom
e
Other L
anguage All
Source: Retention 2001
25
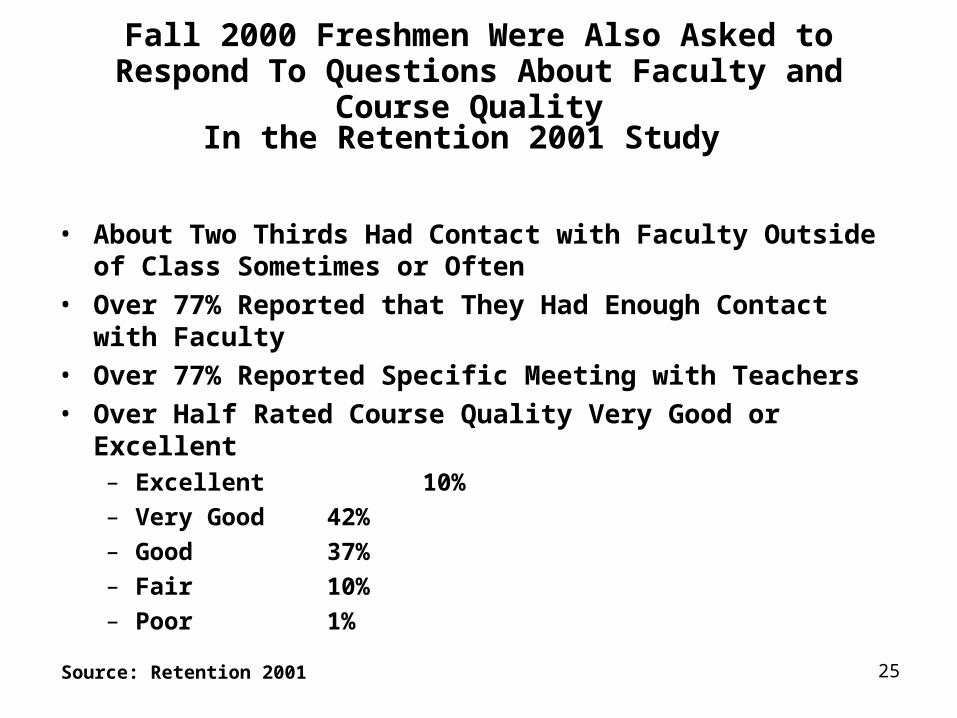
Fall 2000 Freshmen Were Also Asked to Respond To Questions About Faculty and Course Quality
In the Retention 2001 Study
• About Two Thirds Had Contact with Faculty Outside of Class Sometimes or Often
• Over 77% Reported that They Had Enough Contact with Faculty• Over 77% Reported Specific Meeting with Teachers• Over Half Rated Course Quality Very Good or Excellent
– Excellent 10%
– Very Good 42%
– Good 37%
– Fair 10%
– Poor 1%
Source: Retention 2001

26
Various Administrative Departments Also TendedTo Have Mean Ratings Below 8
Scale: 0 = Worst Possible to 10 = Best Possible
Department % of Students w/Contact Mean Rating
Bursar 77% 7.2
Admissions 52% 7.4
Registrar 76% 7.4
Financial Aid 55% 6.9
Staff from Student Advising 65% 7.6
Staff from Student Life 17% 7.5
Source: Retention 2001

27
UMB NSSE Respondents Were Much Less Likely to Report That the University Emphasized Attending
Campus Events and Activities
Percent of Respondents Reporting that Their Institution Emphasizes Attending Campus Events and Activities "Quite a Bit" or "Very Much"
25%
47%
42%
54%
62%
26%
40%
32%
40%
50%
UMB UMass Urban Doc. Int. National
First YearStudents
Seniors
Source: NSSE 2002

28
Graduating Seniors Ranked Communication Regarding Campus Events And Activities Next to Last in the Communications Area, but the Mean Was
Significantly Improved Over August 2002 (Internships etc. also Improved)
Source: GSS 2003
Mean Satisfaction with Communication Ratings
4.0
4.5
4.8
4.8
5.0
5.1
5.1
5.3
5.3
5.5
Internships and Service Learning
Campus Events and Activities
Academic Support Services
Disability Accommodations
Health Services
Placement Testing at First Enrollment
Other Graduation Requirement
The Writing Proficiency Requirement
General Education Requirements
Major Requirements

29
UMB NSSE Respondents Were the Least Likely To Participate In Co-curricular Activities
Percent of Respondents Who Reported Spending No Time In Co-curricular Activities
78%
54%
66%
49%42%
71%
52%
69%
54%
46%
UMB OtherUMass
Urban Doc.Intensive
National
First YearStudents
Seniors
Source: NSSE 2002

30
Conclusions
• UMass Boston Students Are Particularly Stressed for Time and Subject to Outside Pressures
• First Year Students Seem to Be Even More Stressed than Seniors
• UMass Boston Students are also Especially Diverse– Even Within Racial/Ethnic Groups, there is Considerable Cultural Diversity
• Students Invest Time in the Business of UMB– They study and are prepared for class
• They Don’t Spend Time in the “Frills” of Attending College– They don’t attend events– They don’t participate in co-curricular or recreational opportunities
– They don’t spend much time developing relationships with other students • Part of this may be that they don’t believe that UMB emphasizes this type of
behavior.