1 Student Achievement Data Displays Mathematics, Reading & Writing-Grade 7 Revised: October 30, 2009...
41
1 Displays Displays Mathematics, Reading & Mathematics, Reading & Writing-Grade 7 Writing-Grade 7 Revised: October 30, 2009 fficial WASL Results YP Status istrict Reading & Writing Baseline Res
-
Upload
jade-barnett -
Category
Documents
-
view
217 -
download
0
Transcript of 1 Student Achievement Data Displays Mathematics, Reading & Writing-Grade 7 Revised: October 30, 2009...

1
Student Achievement Data DisplaysStudent Achievement Data DisplaysMathematics, Reading & Writing-Grade 7 Mathematics, Reading & Writing-Grade 7
Revised: October 30, 2009
Official WASL Results
AYP Status
District Reading & Writing Baseline Results

2
WASL WASL MathematicsMathematics: 2005-2009: 2005-2009
Grade 7Grade 7
G atew ay M id d le

3
Grade 7 WASL: Grade 7 WASL: Mathematics PerformanceMathematics Performance
P e rc e n t M e e t in g M a th S ta n d a rd
0
20
40
60
80
100
% M
eeti
ng
Sta
nd
ard
G a tew ay M id d le 59 54 70 61 66
2004-05 2005-06 2006-07 2007-08 2008-09

4
Grade 7 WASL: Grade 7 WASL: Mathematics PerformanceMathematics Performance
P e rc e n t M e e t in g M a th S ta n d a rd S c h o o l, D is tr ic t , & S ta te
0
20
40
60
80
100
% M
eeti
ng
Sta
nd
ard
2004-05 59 54 46
2005-06 54 49 51
2006-07 70 58 55
2007-08 61 53 50
2008-09 66 56 52
G ate w ay M id d le D is tr ic t S ta te

5
Adequate Yearly Progress: Adequate Yearly Progress: Annual Targets for Grade 7 MathAnnual Targets for Grade 7 Math
MATHAdequate Yearly Progress (AYP) Targets
17.3
38.0
58.7
79.3
100.0
0
10
20
30
40
50
60
70
80
90
100
2001-02
2002-03
2003-04
2004-05
2005-06
2006-07
2007-08
2008-09
2009-10
2010-11
2011-12
2012-13
2013-14
Per
cen
t M
eeti
ng
Sta
nd
ard

6
Grade 7 WASL-Mathematics: Grade 7 WASL-Mathematics: Adequate Yearly Progress GoalsAdequate Yearly Progress Goals
7 th G r a d e M a th A Y P
67.2
0 0
64.3
67.3
0
71.7
25
47.6
0
1 0
2 0
3 0
4 0
5 0
6 0
7 0
8 0
9 0
1 0 0
All
Am
eric
anIn
dian
Bla
ck
His
pani
c
Whi
te
Lim
ited
Eng
lish
Asi
an
Spe
cial
Edu
catio
n
Low
Inc
ome
Marg in o f E rro r
P erc en t m ee ting s tanda rd (07 -08 th ru 09 -10 G oa l= 58 .7 )
G oa l

7
Grade 7 WASL Mathematics: Grade 7 WASL Mathematics: Proficiency Level TrendsProficiency Level Trends
P e rc e n t o f S tu d e n ts S c o rin g in E a c h P e rfo rm a n c e L e v e l M a th G ra d e 7
2 2 1 9
3 4
2 42 2
2 5
3 2
2 2
1 21 7
3 73 3
1 72 1
2 83 3
1 51 9
2 4
4 3
0
20
40
60
80
100
L e ve l 1 L e ve l 2 L e ve l 3 L e ve l 4
P e rfo rm a n ce L e ve l
Per
cen
t in
Lev
el
2004-05
2005-06
2006-07
2007-08
2008-09
M e e ts S ta n d a rdD o e s N o t M e e t S ta n d a rd

8
Grade 7 Content:Grade 7 Content:Comparison of School to StateComparison of School to State
C o n te n t
0
20
40
60
80
100
% w
ith s
imila
r per
form
ance
% 60 .7 53 .2 51
G ate w ay M id d le D is tr ic t S ta te
D iffer en ce B etw een S ch o o l an d S ta te P er cen ts
9 .7
-50 .0
-25 .0
0 .0
25 .0
50 .0
2008 -09Pe
rcen
t Poi
nt D
iffer
ence
Spring 2009

9
Grade 7 Processes:Grade 7 Processes:Comparison of School to StateComparison of School to State
P ro c e s s e s
0
2 0
4 0
6 0
8 0
1 0 0
% w
ith s
imila
r per
form
ance
% 7 1 .3 6 0 .5 5 4 .5
G a te w a y M id d le D is t r ic t S ta te
D iffe re n c e B e tw e e n S ch o o l a n d S ta te P e rce n ts
16 .8
-5 0 .0
-2 5 .0
0 .0
25 .0
50 .0
20 08 -09Pe
rcen
t Poi
nt D
iffer
ence
Spring 2009

10
Grade 7 Number Sense:Grade 7 Number Sense:Comparison of School to StateComparison of School to State
N u m b e r S e n s e
0
20
40
60
80
100
% w
ith
sim
ilar
per
form
ance
S e r ie s1 46 .1 43 .5 50 .9
G ate w ay M id d le D is tr ic t S ta te
0%10%20%30%40%50%60%70%80%90%100%LiteraryInformationalPerc
en
tSchool 1997School 1998School 1999District 1997District 1998District 1999School 2000District 2000School 2001District 2001D iffer en ce B etw een S ch o o l an d S tate P ercen ts
7 .5
-8 .8
17 .5
-4 .8
-50 .0
-25 .0
0 .0
25 .0
50 .0
2004 -05 2005 -06 2006 -07 2007 -08
Per
cen
t P
oin
t D
iffe
ren
ce
2005-2008

11
Grade 7 Measurement:Grade 7 Measurement:Comparison of School to StateComparison of School to State
M e a s u re m e n t
0
2 0
4 0
6 0
8 0
1 0 0
% w
ith
sim
ila
r p
erf
orm
an
ce
S e r ie s 1 6 4 .7 5 8 .4 5 3 .2
G a te w a y M id d le D is t r ic t S ta te
0%10%20%30%40%50%60%70%80%90%100%LiteraryInformationalPerc
en
tSchool 1997School 1998School 1999District 1997District 1998District 1999School 2000District 2000School 2001District 2001D iffe re n c e B e tw e e n S ch o o l a n d S ta te P e rce n ts
3 .57 .1
16 .911 .5
-5 0 .0
-2 5 .0
0 .0
25 .0
50 .0
20 04 -05 20 05 -06 20 06 -07 20 07 -08
Per
cen
t P
oin
t D
iffe
ren
ce
2005-2008

12
Grade 7 Geometric Sense:Grade 7 Geometric Sense:Comparison of School to StateComparison of School to State
D iffe re n c e B e tw e e n S c h o o l a n d S ta te P e rc e n ts
3 .5 7 .1 9 .1 1 1 .5
-5 0 .0
-2 5 .0
0 .0
2 5 .0
5 0 .0
2 0 0 4 -0 5 2 0 0 5 -0 6 2 0 0 6 -0 7 2 0 0 7 -0 8
Per
cen
t P
oin
t D
iffe
ren
ce 0%10%20%30%40%50%60%70%80%90%100%LiteraryInformationalPerc
en
tSchool 1997School 1998School 1999District 1997District 1998District 1999School 2000District 2000School 2001District 2001G e o m e tr ic S e n se
0
20
40
60
80
10 0
% w
ith
sim
ilar
per
form
ance
S e r ie s1 76 .6 72 .1 65 .1
G a te w a y M id d le D istr ic t S ta te
2005-2008

13
Grade 7 Probability & Statistics:Grade 7 Probability & Statistics:Comparison of School to StateComparison of School to State
D iffe re n ce B e tw e e n S ch o o l a n d S ta te P e rce n ts
-1 .1
3 .87 .6
14 .8
-50 .0
-25 .0
0 .0
25 .0
50 .0
2004 -05 2005 -06 2006 -07 2007 -08
Per
cen
t P
oin
t D
iffe
ren
ce 0%10%20%30%40%50%60%70%80%90%100%LiteraryInformationalPerc
en
tSchool 1997School 1998School 1999District 1997District 1998District 1999School 2000District 2000School 2001District 2001P ro b ab ility & S ta tis tics
0
2 0
4 0
6 0
8 0
1 0 0
% w
ith
sim
ilar
per
form
ance
S e r ie s1 7 1 .6 6 1 .9 5 6 .8
G a te w a y M id d le D istr ic t S ta te
2005-2008

14
Grade 7 Algebraic Sense:Grade 7 Algebraic Sense:Comparison of School to StateComparison of School to State
D iffe re n ce B e tw e e n S ch o o l a n d S ta te P e rce n ts
-3 .3
4 .8 4 .9 2 .7
-50 .0
-25 .0
0 .0
25 .0
50 .0
2004 -05 2005 -06 2006 -07 2007 -08
Per
cen
t P
oin
t D
iffe
ren
ce 0%10%20%30%40%50%60%70%80%90%100%LiteraryInformationalPerc
en
tSchool 1997School 1998School 1999District 1997District 1998District 1999School 2000District 2000School 2001District 2001Alg eb ra ic S en se
0
2 0
4 0
6 0
8 0
1 0 0
% w
ith
sim
ila
r p
erf
orm
an
ce
S e r ie s 1 5 4 .5 4 8 .6 5 1 .8
G a te w a y M id d le D is t r ic t S ta te
2005-2008

15
Grade 7 Solves Problems/Reasons Logically:Grade 7 Solves Problems/Reasons Logically:Comparison of School to StateComparison of School to State
D iffe re n c e B e tw e e n S c h o o l a n d S ta te P e rc e n ts
4 .9 7 .9 1 0 .2 1 3 .0
-5 0 .0
-2 5 .0
0 .0
2 5 .0
5 0 .0
2 0 0 4 -0 5 2 0 0 5 -0 6 2 0 0 6 -0 7 2 0 0 7 -0 8
Per
cen
t P
oin
t D
iffe
ren
ce 0%10%20%30%40%50%60%70%80%90%100%LiteraryInformationalPerc
en
tSchool 1997School 1998School 1999District 1997District 1998District 1999School 2000District 2000School 2001District 2001S o lves P r o b lem s & R easo n s L o g ica lly
0
2 0
4 0
6 0
8 0
1 0 0
% w
ith
sim
ila
r p
erf
orm
an
ce
% 6 5 .0 5 5 .5 5 2
G a te w a y M id d le D is t r ic t S ta te
2005-2008

16
Grade 7 Communicates Understanding:Grade 7 Communicates Understanding:Comparison of School to StateComparison of School to State
D iffe re n ce B e tw e e n S ch o o l a n d S ta te P e rce n ts
5 .4 5 .4
16 .2 14 .3
-50 .0
-25 .0
0 .0
25 .0
50 .0
2004 -05 2005 -06 2006 -07 2007 -08
Per
cen
t P
oin
t D
iffe
ren
ce 0%10%20%30%40%50%60%70%80%90%100%LiteraryInformationalPerc
en
tSchool 1997School 1998School 1999District 1997District 1998District 1999School 2000District 2000School 2001District 2001C o m m u n ic a te s U n d e rs ta n d in g
0
20
40
60
80
10 0
% w
ith
sim
ilar
per
form
ance
S e r ie s1 62 .6 54 .5 48 .3
G a te w a y M id d le D istr ic t S ta te
2005-2008

17
Grade 7 Makes Connections:Grade 7 Makes Connections:Comparison of School to StateComparison of School to State
D iffe re n c e B e tw e e n S c h o o l a n d S ta te P e rc e n ts
5 .4 4 .01 1 .1 1 1 .9
-5 0 .0
-2 5 .0
0 .0
2 5 .0
5 0 .0
2 0 0 4 -0 5 2 0 0 5 -0 6 2 0 0 6 -0 7 2 0 0 7 -0 8
Per
cen
t P
oin
t D
iffe
ren
ce 0%10%20%30%40%50%60%70%80%90%100%LiteraryInformationalPerc
en
tSchool 1997School 1998School 1999District 1997District 1998District 1999School 2000District 2000School 2001District 2001M ake C o n n ect io n s
0
2 0
4 0
6 0
8 0
1 0 0
% w
ith
sim
ila
r p
erf
orm
an
ce
S e r ie s 1 6 5 .3 5 8 .0 5 3 .4
G a te w a y M id d le D is t r ic t S ta te
2005-2008

18
WASL WASL ReadingReading: 2005-2009: 2005-2009
Grade 7Grade 7
G atew ay M id d le

19
Grade 7 WASL Grade 7 WASL Reading PerformanceReading Performance
P e rc e n t M e e t in g R e a d in g S ta n d a rd
0
20
40
60
80
100
% M
eeti
ng
Sta
nd
ard
G a tew ay M id d le 81 78 84 80 84
2004-05 2005-06 2006-07 2007-08 2008-09

20
Grade 7 WASL Grade 7 WASL Reading PerformanceReading Performance
P e rc e n t M e e t in g R e a d in g S ta n d a rd S c h o o l, D is tr ic t , & S ta te
0
2 0
4 0
6 0
8 0
1 0 0
% M
eeti
ng
Sta
nd
ard
2 0 0 4 -0 5 8 1 7 6 6 0
2 0 0 5 -0 6 7 8 6 9 6 9
2 0 0 6 -0 7 8 4 7 6 6 9
2 0 0 7 -0 8 8 0 7 3 6 3
2 0 0 8 -0 9 8 4 6 9 5 9
G a te w a y M id d le D is t r ic t S ta te
21
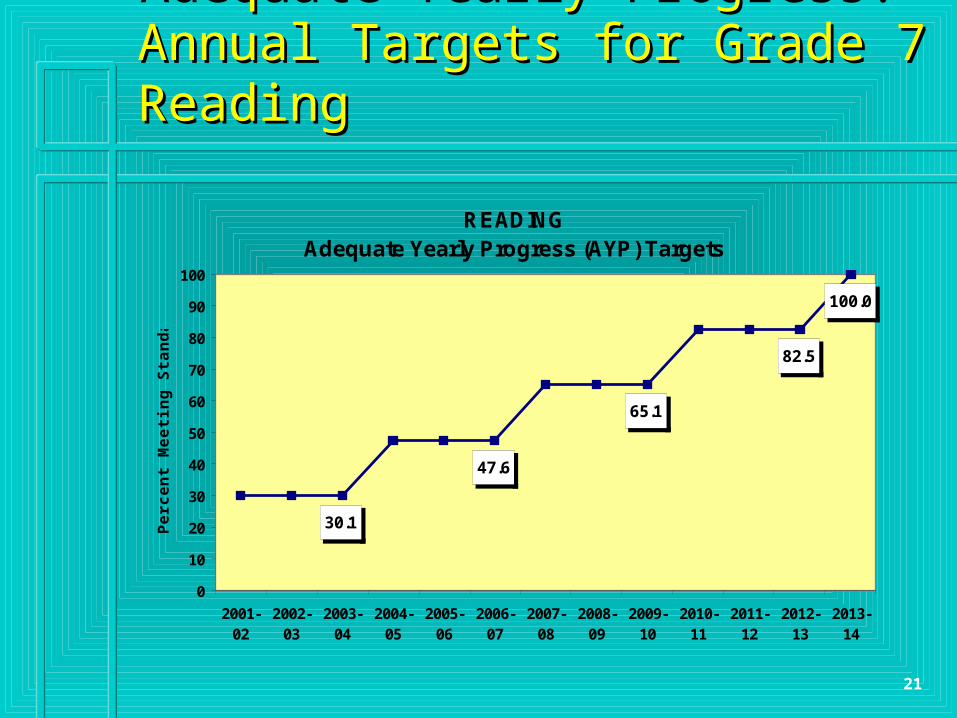
Adequate Yearly Progress: Adequate Yearly Progress: Annual Targets for Grade 7 ReadingAnnual Targets for Grade 7 Reading
READINGAdequate Yearly Progress (AYP) Targets
30.1
47.6
65.1
82.5
100.0
0
10
20
30
40
50
60
70
80
90
100
2001-02
2002-03
2003-04
2004-05
2005-06
2006-07
2007-08
2008-09
2009-10
2010-11
2011-12
2012-13
2013-14
Per
cen
t M
eeti
ng
Sta
nd
ard

22
Grade 7 WASL-Reading: Grade 7 WASL-Reading: Adequate Yearly Progress GoalsAdequate Yearly Progress Goals
7 th G r a d e R e a d in g A Y P
84.5
0 0
92.9
82.7
0
91.3
12.5
61.9
0
1 0
2 0
3 0
4 0
5 0
6 0
7 0
8 0
9 0
1 0 0
All
Am
eric
anIn
dian
Bla
ck
His
pani
c
Whi
te
Lim
ited
Eng
lish
Asi
an
Spe
cial
Edu
catio
n
Low
Inc
ome
Marg in o f E rro r
P erc en t m ee ting s tanda rd (07 -08 th ru 09 -10 G oa l= 65 .1 )
G oa l

23
Grade 7 WASL Reading Grade 7 WASL Reading Proficiency Level TrendsProficiency Level Trends
P e rc e n t o f S tu d e n ts S c o rin g in E a c h P e rfo rm a n c e L e v e l R e a d in g G ra d e 7
5
14
29
51
5
17
30
48
2
14
26
57
4
16
25
55
2
14
27
58
0
20
40
60
80
10 0
L e ve l 1 L e ve l 2 L e ve l 3 L e ve l 4
P e rfo rm a n c e L e v e l
Per
cen
t in
Lev
el
2004-05
2005-06
2006-07
2007-08
2008-09
M e e ts S ta n d a rdD o e s N o t M e e t S ta n d a rd

24
Grade 7 Comprehension:Grade 7 Comprehension:Comparison of School to StateComparison of School to State
C o m p re h e n s io n
0
20
40
60
80
100
% w
ith s
imila
r per
form
ance
% 82 .0 68 .4 63 .8
G ate w ay M id d le D is tr ic t S ta te
D iffer en ce B etw een S ch o o l an d S tate P ercen ts
18 .2
-50 .0
-25 .0
0 .0
25 .0
50 .0
2008-09Pe
rcen
t Poi
nt D
iffer
ence
Spring 2009

25
Grade 7 Analysis:Grade 7 Analysis:Comparison of School to StateComparison of School to State
A n a ly s is
0
20
40
60
80
100
% w
ith s
imila
r per
form
ance
% 81 .4 68 .2 55 .5
G ate w ay M id d le D is tr ic t S ta te
D iffer en ce B etw een S ch o o l an d S ta te P er cen ts
25 .9
-50 .0
-25 .0
0 .0
25 .0
50 .0
2008-09
Perc
ent P
oint
Diff
eren
ce
Spring 2009

26
Grade 7 Critical Thinking:Grade 7 Critical Thinking:Comparison of School to StateComparison of School to State
C r it ica l T h in k in g
0
2 0
4 0
6 0
8 0
1 0 0
% w
ith s
imila
r per
form
ance
% 8 2 .6 6 9 .7 6 1 .6
G a te w a y M id d le D is t r ic t S ta te
D iffer en ce B etw een S ch o o l an d S ta te P er cen ts
21 .0
-50 .0
-25 .0
0 .0
25 .0
50 .0
2008-09Pe
rcen
t Poi
nt D
iffer
ence
Spring 2009

27
Grade 7 Literary Comprehension:Grade 7 Literary Comprehension:Comparison of School and StateComparison of School and State
D iffer en ce B etw een S ch o o l an d S tate P ercen ts
5 .5 7 .715 .4 13 .3
-50 .0
-25 .0
0 .0
25 .0
50 .0
2004-05 2005-06 2006-07 2007-08
Per
cen
t P
oin
t D
iffe
ren
ce 0%10%20%30%40%50%60%70%80%90%100%LiteraryInformationalPerc
en
tSchool 1997School 1998School 1999District 1997District 1998District 1999School 2000District 2000School 2001District 2001C o m p re h e n s io n o f L ite ra ry T e x t
0
20
40
60
80
100
% w
ith
sim
ilar
per
form
ance
S e r ie s1 73 .7 67 .6 60 .4
G ate w ay M id d le D is tr ic t S ta te
2005-2008

28
Grade 7 Literary Analysis :Grade 7 Literary Analysis :Comparison of School to StateComparison of School to State
D iffer en ce B etw een S ch o o l an d S tate P ercen ts
7 .8
16 .2 15 .218 .8
-50 .0
-25 .0
0 .0
25 .0
50 .0
2004-05 2005-06 2006-07 2007-08
Per
cen
t P
oin
t D
iffe
ren
ce 0%10%20%30%40%50%60%70%80%90%100%LiteraryInformationalPerc
en
tSchool 1997School 1998School 1999District 1997District 1998District 1999School 2000District 2000School 2001District 2001A n a ly z e a n d In te rp re t - L ite ra ry T e x t
0
20
40
60
80
100
% w
ith
sim
ilar
per
form
ance
S e r ie s1 72 .8 67 .9 54
G ate w ay M id d le D is tr ic t S ta te
2005-2008

29
0%10%20%30%40%50%60%70%80%90%100%LiteraryInformationalPerc
en
tSchool 1997School 1998School 1999District 1997District 1998District 1999School 2000District 2000School 2001District 2001
Grade 7 Literary Thinking Critically: Grade 7 Literary Thinking Critically: Comparison of School to StateComparison of School to State
D iffer en ce B etw een S ch o o l an d S ta te P er cen ts
6 .29 .7
17 .3 14 .9
-50 .0
-25 .0
0 .0
25 .0
50 .0
2004-05 2005-06 2006-07 2007-08
Per
cen
t P
oin
t D
iffe
ren
ce
C r it ica l T h in k in g L iter ar y T ext
0
2 0
4 0
6 0
8 0
1 0 0
% w
ith
sim
ila
r p
erf
orm
an
ce
S e r ie s 1 6 3 .8 5 9 .4 4 8 .9
G a te w a y M id d le D is t r ic t S ta te
2005-2008

30
Grade 7 Informational Comprehension:Grade 7 Informational Comprehension:Comparison of School to StateComparison of School to State
D iffer en ce B etw een S ch o o l an d S ta te P er cen ts
15 .4 13 .9 14 .710 .7
-50 .0
-25 .0
0 .0
25 .0
50 .0
2004-05 2005-06 2006-07 2007-08
Per
cen
t P
oin
t D
iffe
ren
ce 0%10%20%30%40%50%60%70%80%90%100%LiteraryInformationalPerc
en
tSchool 1997School 1998School 1999District 1997District 1998District 1999School 2000District 2000School 2001District 2001C o m p r eh en sio n o f In fo r m at io n al T ext
0
2 0
4 0
6 0
8 0
1 0 0
% w
ith
sim
ila
r p
erf
orm
an
ce
S e r ie s 1 7 7 .2 7 2 .8 6 6 .5
G a te w a y M id d le D is t r ic t S ta te
2005-2008

31
Grade 7 Informational Analysis:Grade 7 Informational Analysis:Comparison of School to StateComparison of School to State
D iffer en ce B etw een S ch o o l an d S tate P ercen ts
4 .9 7 .4
20 .8 21 .0
-50 .0
-25 .0
0 .0
25 .0
50 .0
2004 -05 2005-06 2006-07 2007-08
Per
cen
t P
oin
t D
iffe
ren
ce 0%10%20%30%40%50%60%70%80%90%100%LiteraryInformationalPerc
en
tSchool 1997School 1998School 1999District 1997District 1998District 1999School 2000District 2000School 2001District 2001An alyz e an d In ter p r e t - In fo r m at io n a l T ext
0
2 0
4 0
6 0
8 0
1 0 0
% w
ith
sim
ila
r p
erf
orm
an
ce
S e r ie s 1 6 7 .1 5 7 .9 4 6 .1
G a te w a y M id d le D is t r ic t S ta te
2005-2008

32
0%10%20%30%40%50%60%70%80%90%100%LiteraryInformationalPerc
en
tSchool 1997School 1998School 1999District 1997District 1998District 1999School 2000District 2000School 2001District 2001
Grade 7 Informational Thinking Critically: Grade 7 Informational Thinking Critically: Comparison of School to StateComparison of School to State
D iffer en ce B etw een S ch o o l an d S ta te P er cen ts
5 .611 .6 9 .6
15 .3
-50 .0
-25 .0
0 .0
25 .0
50 .0
2004 -05 2005 -06 2006 -07 2007 -08
Per
cen
t P
oin
t D
iffe
ren
ce
C r it ica l T h in kin g In fo r m at io n al T ext
0
2 0
4 0
6 0
8 0
1 0 0
% w
ith
sim
ila
r p
erf
orm
an
ce
S e r ie s 1 6 8 .9 6 5 .6 5 3 .6
G a te w a y M id d le D is t r ic t S ta te
2005-2008

33
SRA Reading Baseline – Grade 7SRA Reading Baseline – Grade 7Reading StrandsReading Strands
G a te w a y M id d le S c h o o l - G ra d e 7S e c o n d a ry R e a d in g A s s e s s m e n ts 2 0 0 9 -1 0
B a s e l in e
0.0%
10.0%
20.0%
30.0%
40.0%
50.0%
60.0%
R e a d in g S tra n d s
Per
cen
tag
e o
f S
tud
ents
Leve l 1
Leve l 2
Leve l 3
Leve l 4
Leve l 1 9 .5% 6.9% 3.2%
Leve l 2 43 .9% 34.9% 21.2%
Leve l 3 23 .8% 22.2% 20.1%
Leve l 4 22 .8% 36.0% 55.6%
B ase lineC om prehension
B ase line A na ly sis
B ase lineC r itic a l Th inking
C O M P R E H E N S IO N A N A LY S IS C R ITIC A L TH IN K IN G

34
SRA Reading Baseline – Grade 7SRA Reading Baseline – Grade 7Informational and Literary Sub-StrandsInformational and Literary Sub-Strands
G a te w a y M id d le S c h o o l - G ra d e 7S e c o n d a ry R e a d in g A s s e s s m e n ts 2 0 0 9 -1 0
B a s e l in e b y In fo rm a tio n a l & L ite ra ry S u b -S tra n d s
0 .0%
10.0%
20.0%
30.0%
40.0%
50.0%
60.0%
70.0%
In fo rm a t io n a l & L ite ra ry R e a d in g S tra n d s
Per
cen
tag
e o
f S
tud
ents
L e ve l 1
L e ve l 2
L e ve l 3
L e ve l 4
Leve l 1 7 .4% 21.2% 10.6% 10.1% 18.0% 13.2%
Leve l 2 0 .0% 0.0% 0.0% 35.4% 20.6% 16.4%
Leve l 3 27 .0% 42.3% 31.2% 25.9% 40.2% 31.7%
Leve l 4 65 .6% 36.5% 58.2% 28.6% 21.2% 38.6%
B ase lineIn fo rm a tiona l
C om prehension
B ase lineIn fo rm a tiona l
A na ly s is
B ase lineIn fo rm a tiona l
C r itic a l Th ink ing
B ase lineL ite ra ry
C om prehension
B ase lineL ite ra ry A na ly s is
B ase lineL ite ra ry C r itic a l
Th ink ing
IN F O R M A TIO N A LC O M P R E H E N S IO N
IN F O R M A TIO N A LA N A LY S IS
IN F O R M A TIO N A LC R ITIC A L TH IN K IN G
LITE R A R YC O M P R E H E N S IO N
L ITE R A R YA N A LY S IS
L ITE R A R YC R ITIC A L TH IN K IN G

35
WASL WASL WritingWriting: 2005-2009: 2005-2009
Grade 7Grade 7
G atew ay M id d le

36
Grade 7 WASL Grade 7 WASL Writing PerformanceWriting Performance
P e rc e n t M e e t in g W ri t in g S ta n d a rd
0
20
40
60
80
100
% M
eeti
ng
Sta
nd
ard
G a tew ay M id d le 79 82 90 85 89
2004-05 2005-06 2006-07 2007-08 2008-09

37
Grade 7 WASL Grade 7 WASL Writing PerformanceWriting Performance
P e r c e n t M e e tin g W r itin g S ta n d a r d S c h o o l, D is tr ic t, & S ta te
0
2 0
4 0
6 0
8 0
1 0 0
% M
eeti
ng
Sta
nd
ard
2 0 0 4 -0 5 7 9 7 1 5 8
2 0 0 5 -0 6 8 2 6 8 6 1
2 0 0 6 -0 7 9 0 7 6 6 8
2 0 0 7 -0 8 8 5 8 0 7 0
2 0 0 8 -0 9 8 9 7 7 7 0
G a te w a y M id d le D is t r ic t S ta te

38
WASL Writing:WASL Writing:Proficiency Level TrendsProficiency Level Trends
P er cen t o f S tu d en ts S co r in g in E ach P er fo r m an ce L evelW r it in g G r ad e 7
5
15
46
33
612
4240
1
9
39
51
3
11
30
56
2
9
34
55
0
10
20
30
40
50
60
70
80
90
100
L evel 1 L evel 2 L evel 3 L evel 4
P er fo r m an ce L eve l
% i
n L
evel
2 0 0 4 -0 5
2 0 0 5 -0 6
2 0 0 6 -0 7
2 0 0 7 -0 8
2 0 0 8 -0 9
M e e ts S ta n d a rdD o e s N o t M e e t S ta n d a rd

39
Grade 7 Content, Organization, and Style:Grade 7 Content, Organization, and Style:Comparison of School to StateComparison of School to State
D iffer en ce B etw een S ch o o l an d S tate P ercen ts
21 .0 20 .9 23 .8 24 .020 .4
-50 .0
-25 .0
0 .0
25 .0
50 .0
2004-05 2005-06 2006-07 2007-08 2008-09
Per
cen
t P
oin
t D
iffe
ren
ce 0%10%20%30%40%50%60%70%80%90%100%LiteraryInformationalPerc
en
tSchool 1997School 1998School 1999District 1997District 1998District 1999School 2000District 2000School 2001District 2001C o n te n t/O rg a n iz a tio n /S ty le
0
20
40
60
80
100
% w
ith
sim
ilar
per
form
ance
% 87 .9 80 .0 67 .5
G ate w ay M id d le D is tr ic t S ta te
2005-2009

40
Grade 7 Conventions (CON): Grade 7 Conventions (CON): Comparison of School to StateComparison of School to State
D iffer en ce B etw een S ch o o l an d S tate P er cen ts
6 .8 6 .411 .7
7 .212 .0
-50 .0
-25 .0
0 .0
25 .0
50 .0
2004-05 2005-06 2006-07 2007-08 2008-09
Per
cen
t P
oin
t D
iffe
ren
ce 0%10%20%30%40%50%60%70%80%90%100%LiteraryInformationalPerc
en
tSchool 1997School 1998School 1999District 1997District 1998District 1999School 2000District 2000School 2001District 2001C o n v e n tio n s
0
20
40
60
80
100
% w
ith
sim
ilar
per
form
ance
% 96 .0 87 .1 84
G ate w ay M id d le D is tr ic t S ta te
2005-2009

41
SWA Writing Baseline – Grade 7SWA Writing Baseline – Grade 7Writing StrandsWriting Strands
G a te w a y M id d le S c h o o l - G ra d e 7S e c o n d a ry W r it in g As s e s s m e n t 2 0 0 9 -1 0
B a s e lin e
0 .0%
10 .0 %
20 .0 %
30 .0 %
40 .0 %
50 .0 %
60 .0 %
70 .0 %
80 .0 %
W ritin g S tran d s
Per
cen
tag
e o
f S
tud
ents
L e ve l 1
L e ve l 2
L e ve l 3
L e ve l 4
Le ve l 1 1 .6% 3 .2% 0 .0% 0 .5%
Le ve l 2 40 .7 % 47 .1 % 25 .9 % 37 .0 %
Le ve l 3 54 .5 % 49 .7 % 68 .3 % 62 .4 %
Le ve l 4 3 .2% 0 .0% 5 .8% 0 .0%
B as e lin eC on ten t
B as e lin eO rga n iz a t ion
B as e lin eS ty le
B as e lin eC onven t io ns
C O NT EN T C O NV EN T IO NSS T Y L EO R G A N IZA T IO N