1 Statistical Power And Sample Size Calculations Minitab calculations Manual calculations Tuesday,...
68
1 Statistical Power And Sample Size Calculations Minitab calculatio ns Manual calculations Tuesday 15 March 2022 08:41 AM
Transcript of 1 Statistical Power And Sample Size Calculations Minitab calculations Manual calculations Tuesday,...
1
Statistical Power And Sample Size Calculations
Minitab calculations
Manual calculations
Tuesday 18 April 2023 03:10 PM
2
When Do You Need Statistical Power Calculations, And Why?
A prospective power analysis is used before collecting data, to consider design sensitivity .
3
When Do You Need Statistical Power Calculations, And Why?
A retrospective power analysis is used in order to know whether the studies you are interpreting were well enough designed.

4
When Do You Need Statistical Power Calculations, And Why?
In Cohen’s (1962) seminal power analysis of the journal of Abnormal and Social Psychology he concluded that over half of the published studies were insufficiently powered to result in statistical significance for the main hypothesis.
Cohen, J. 1962 “The statistical power of abnormal-social psychological research: A review” Journal of Abnormal and Social Psychology 65 145-153.

5
What Is Statistical Power?Essential concepts
• the null hypothesis Ho
• significance level, α
• Type I error
• Type II error
6
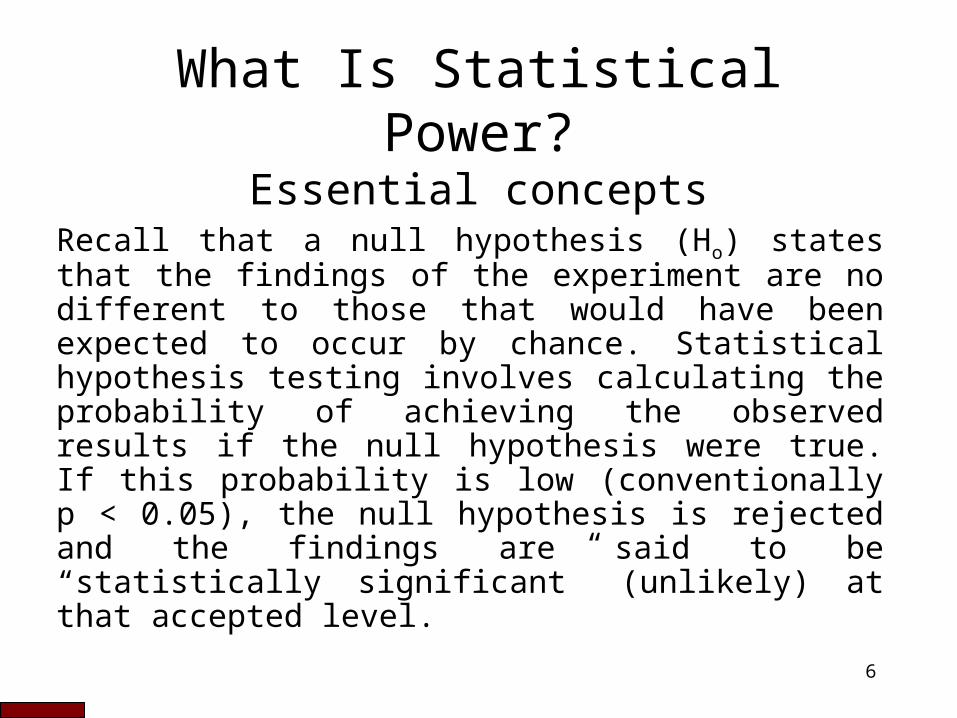
What Is Statistical Power?Essential concepts
Recall that a null hypothesis (Ho) states that the findings of the experiment are no different to those that would have been expected to occur by chance. Statistical hypothesis testing involves calculating the probability of achieving the observed results if the null hypothesis were true. If this probability is low (conventionally p < 0.05), the null hypothesis is rejected and the findings are said to be “statistically significant” (unlikely) at that accepted level.
7
Statistical Hypothesis Testing
When you perform a statistical hypothesis test, there are four possible outcomes
8
Statistical Hypothesis Testing
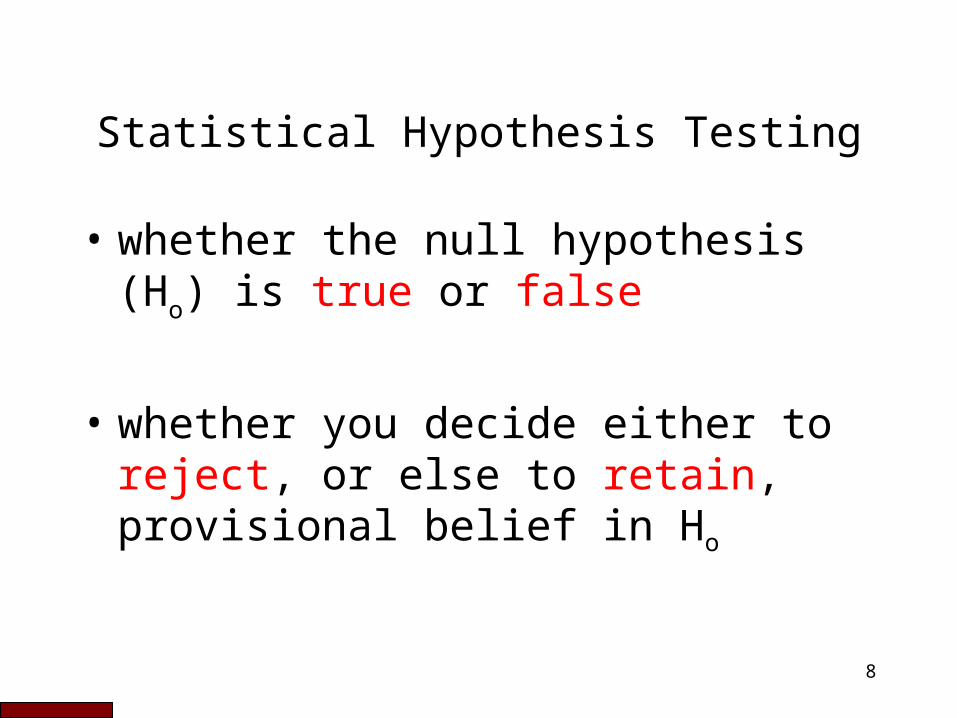
• whether the null hypothesis (Ho) is true or false
• whether you decide either to reject, or else to retain, provisional belief in Ho
9
Statistical Hypothesis Testing
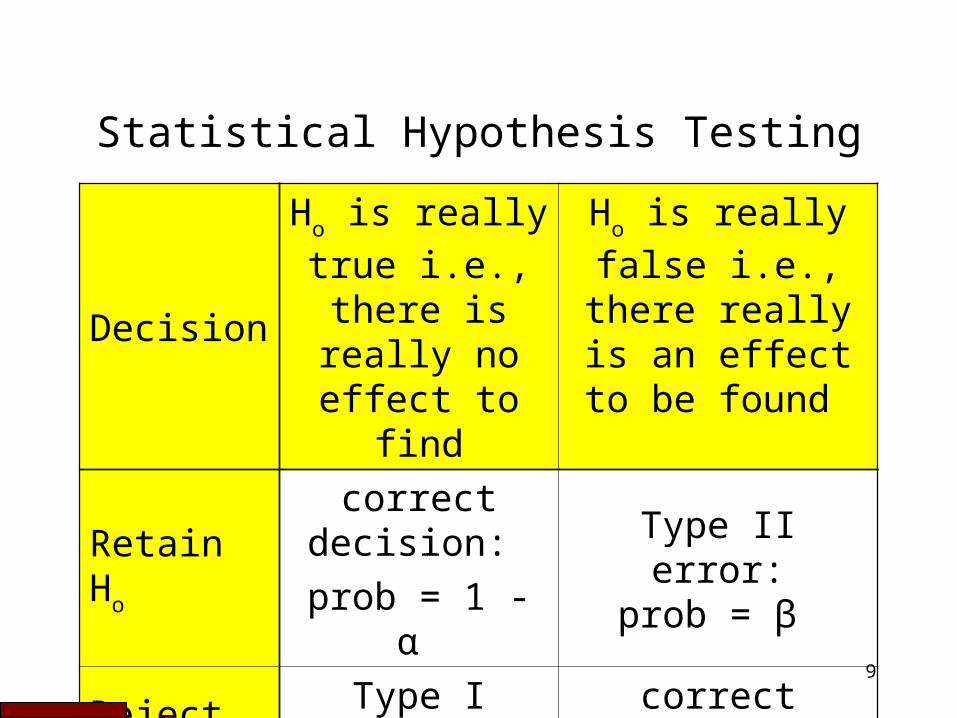
Decision
Ho is really true i.e.,
there is really no effect to
find
Ho is really false i.e., there really is an effect to
be found
Retain Ho
correct decision:
prob = 1 - α
Type II error: prob = β
Reject HoType I error:
prob = α
correct decision:
prob = 1 - β
10
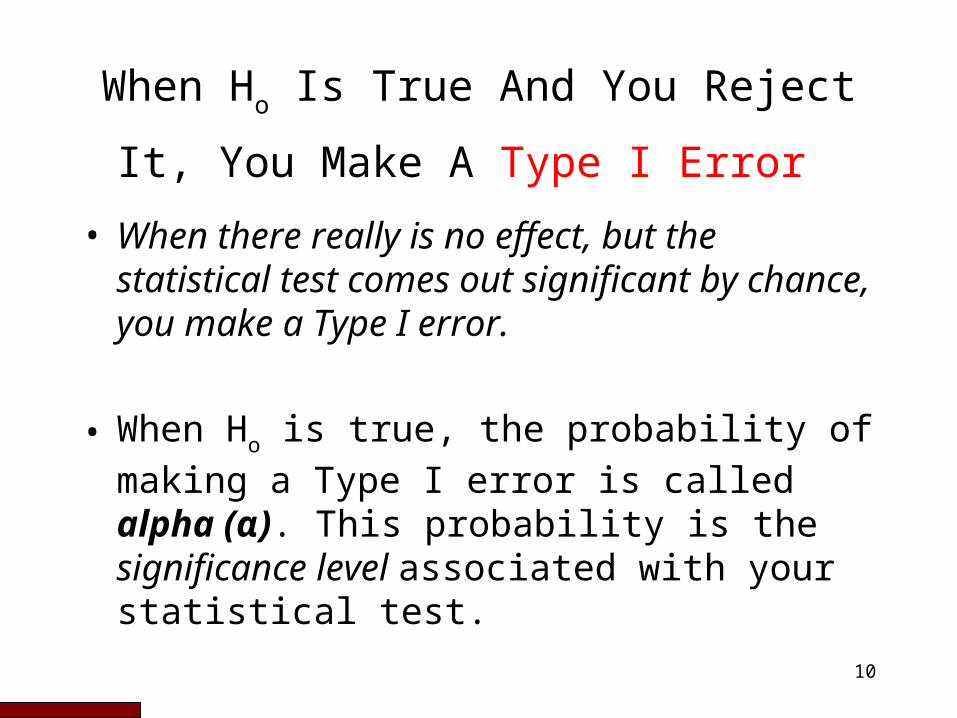
When Ho Is True And You Reject It,
You Make A Type I Error • When there really is no effect, but the
statistical test comes out significant by chance, you make a Type I error.
• When Ho is true, the probability of making a Type I error is called alpha (α). This probability is the significance level associated with your statistical test.

11
When Ho is False And You Fail To
Reject It, You Make A Type II Error • When, in the population, there really is
an effect, but your statistical test comes out non-significant, due to inadequate power and/or bad luck with sampling error, you make a Type II error.
• When Ho is false, (so that there really is an effect there waiting to be found) the probability of making a Type II error is called beta (β).
12
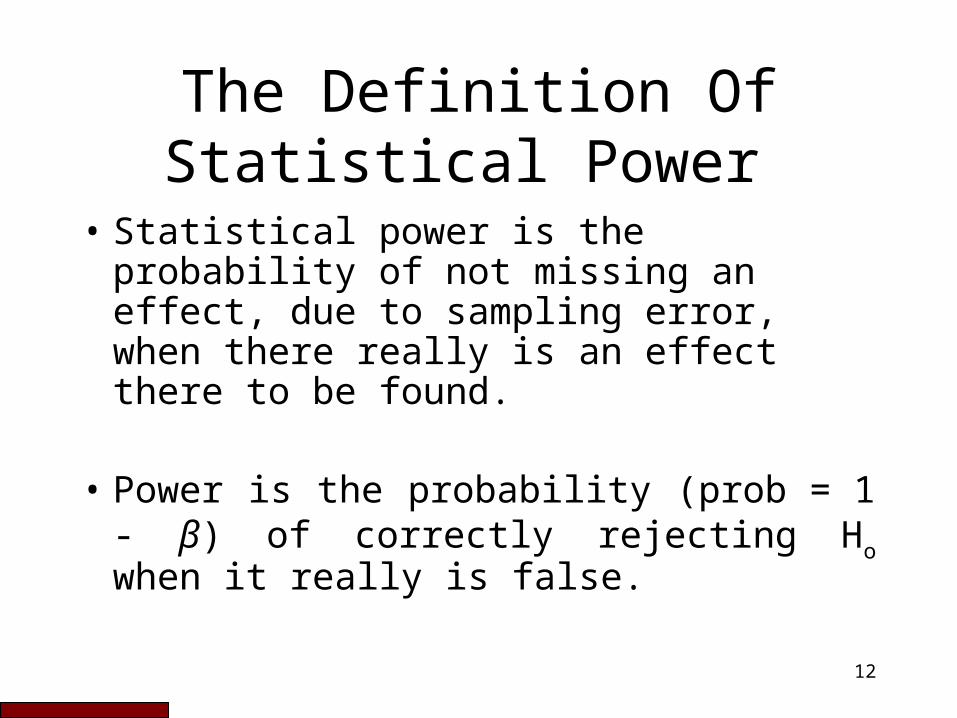
The Definition Of Statistical Power
• Statistical power is the probability of not missing an effect, due to sampling error, when there really is an effect there to be found.
• Power is the probability (prob = 1 - β) of correctly rejecting Ho when it really is false.

13
Calculating Statistical PowerDepends On
1. the sample size2. the level of statistical significance
required3. the minimum size of effect that it
is reasonable to expect.

14
How Do We Measure Effect Size?
• Cohen's d • Defined as the difference between
the means for the two groups, divided by an estimate of the standard deviation in the population.
• Often we use the average of the standard deviations of the samples as a rough guide for the latter.
15
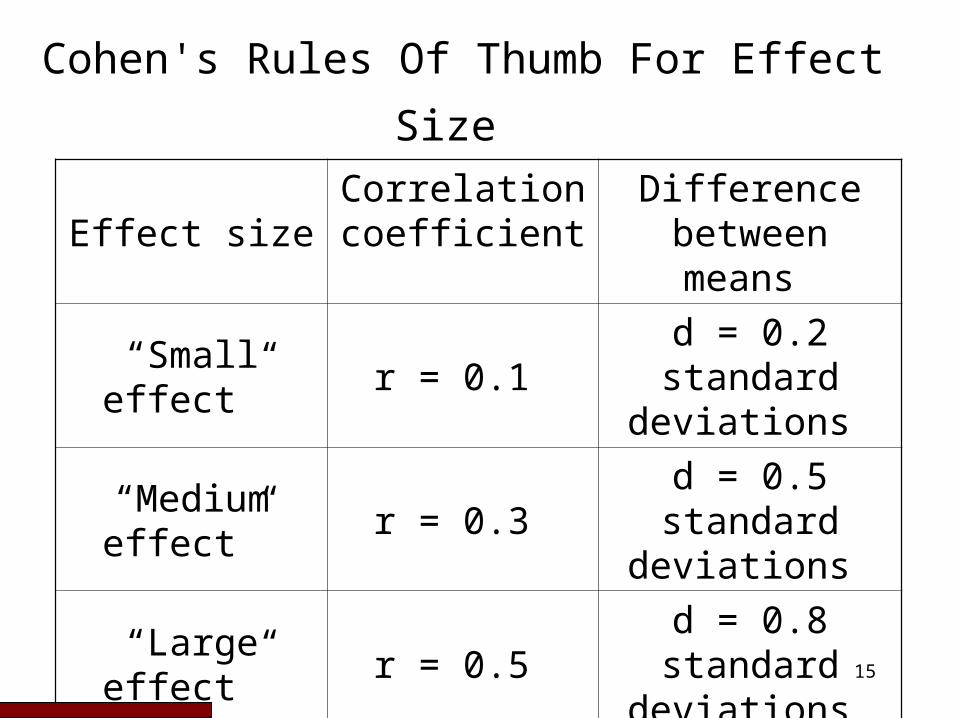
Cohen's Rules Of Thumb For Effect Size
Effect size Correlation coefficient
Difference between means
“Small effect”
r = 0.1 d = 0.2
standard deviations
“Medium effect”
r = 0.3 d = 0.5
standard deviations
“Large effect”
r = 0.5 d = 0.8
standard deviations

16
Calculating Cohen’s d
Notation
d Cohen’s d effect size
x Mean
s Standard deviation Pooleds
xxd 21
Subscript refers to the two conditions being compared
Cohen, J., (1977). Statistical power analysis for the behavioural sciences. San Diego, CA: Academic Press.Cohen, J., (1992). A Power Primer. Psychological Bulletin 112 155-159.

17
Calculating Cohen’s d
18
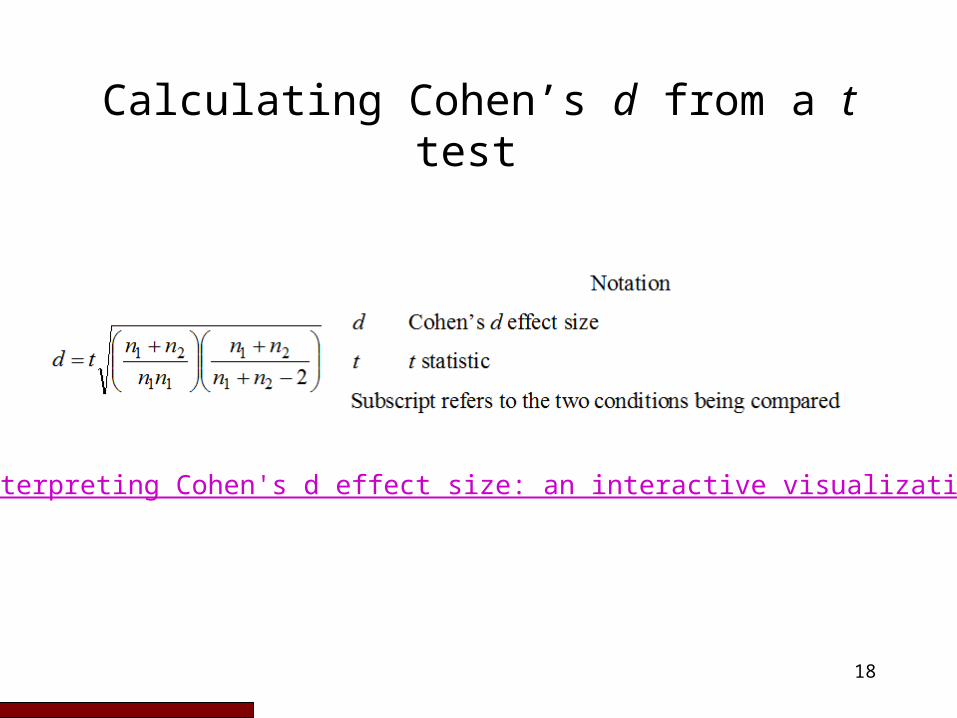
Calculating Cohen’s d from a t test
Interpreting Cohen's d effect size: an interactive visualization
19
Conventions And Decisions About
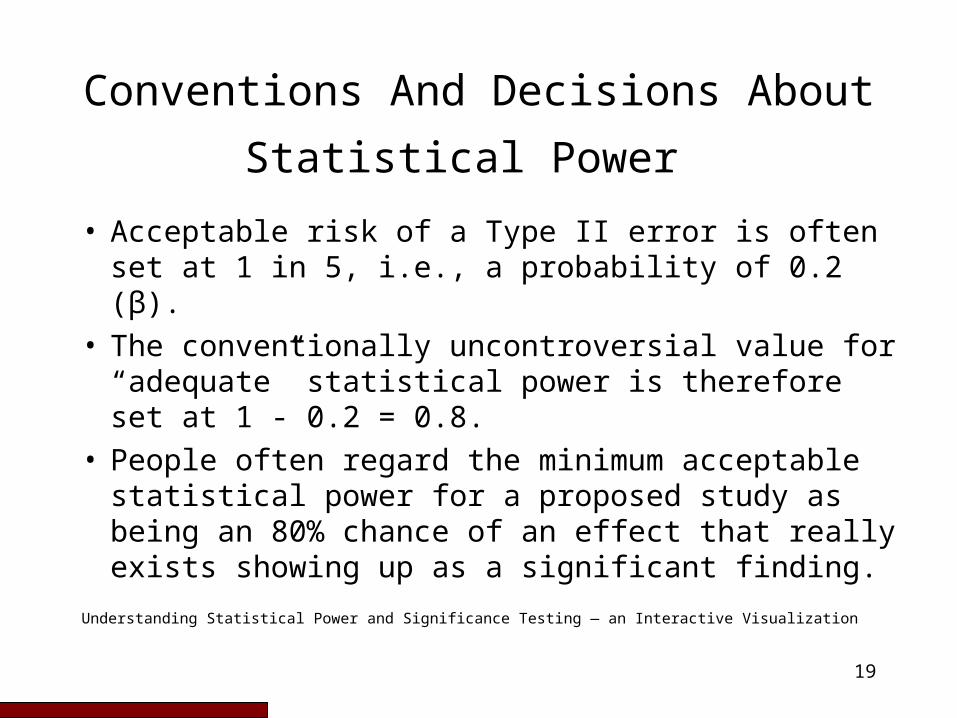
Statistical Power • Acceptable risk of a Type II error is often set at
1 in 5, i.e., a probability of 0.2 (β). • The conventionally uncontroversial value for
“adequate” statistical power is therefore set at 1 - 0.2 = 0.8.
• People often regard the minimum acceptable statistical power for a proposed study as being an 80% chance of an effect that really exists showing up as a significant finding.
Understanding Statistical Power and Significance Testing — an Interactive Visualization

20
6 Steps to determine to determine an appropriate sample size for my study?
1. Formulate the study. Here you detail your study design, choose the outcome summary, and you specify the analysis method.
2. Specify analysis parameters. The analysis parameters, for instance are the test significance level, specifying whether it is a 1 or 2-sided test, and also, what exactly it is you are looking for from your analysis.

21
6 Steps to determine to determine an appropriate sample size for my study?
3. Specify effect size for test. This could be the expected effect size (often a best estimate), or one could use the effect size that is deemed to be clinically meaningful.
4. Compute sample size or power. Once you have completed steps one through three you are now in a position to compute the sample size or the power for your study.
22
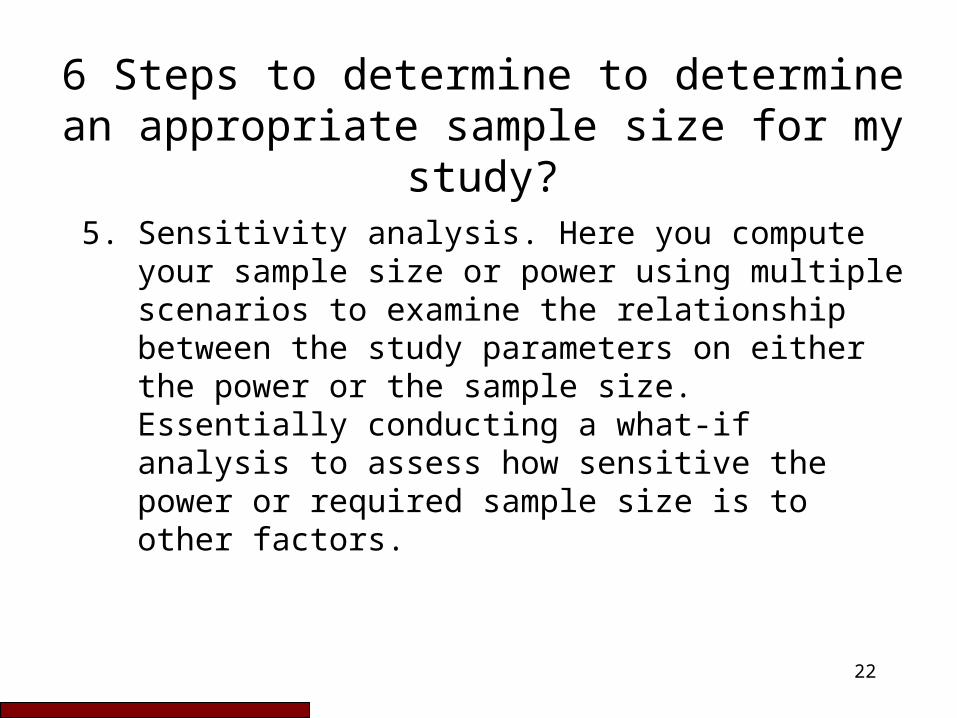
6 Steps to determine to determine an appropriate sample size for my study?
5. Sensitivity analysis. Here you compute your sample size or power using multiple scenarios to examine the relationship between the study parameters on either the power or the sample size. Essentially conducting a what-if analysis to assess how sensitive the power or required sample size is to other factors.
23
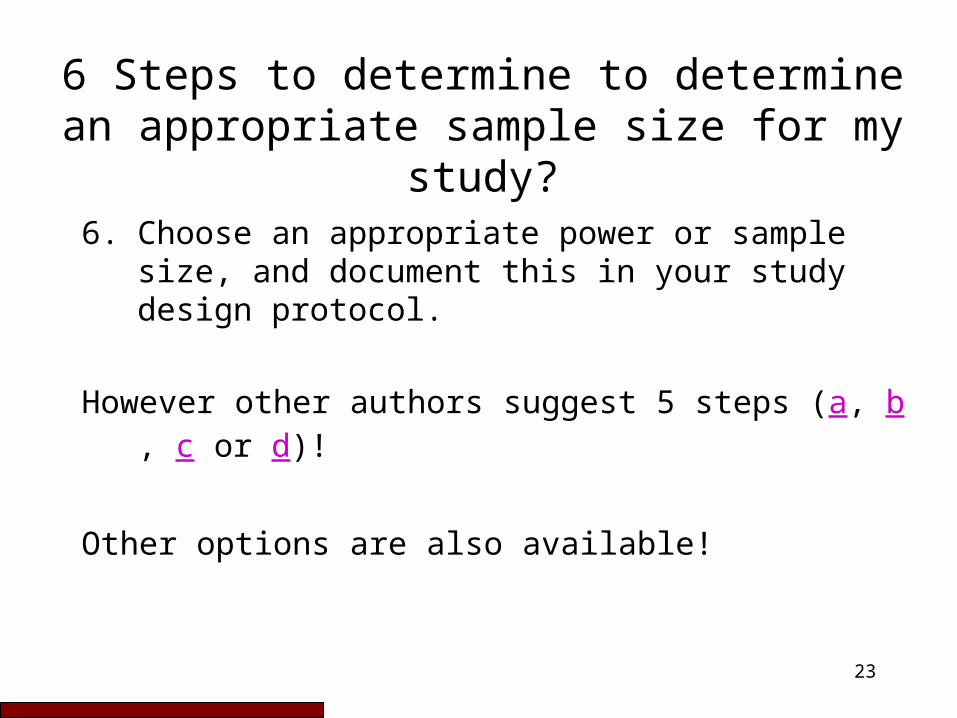
6 Steps to determine to determine an appropriate sample size for my study?
6. Choose an appropriate power or sample size, and document this in your study design protocol.
However other authors suggest 5 steps (a, b, c or d)!
Other options are also available!
24
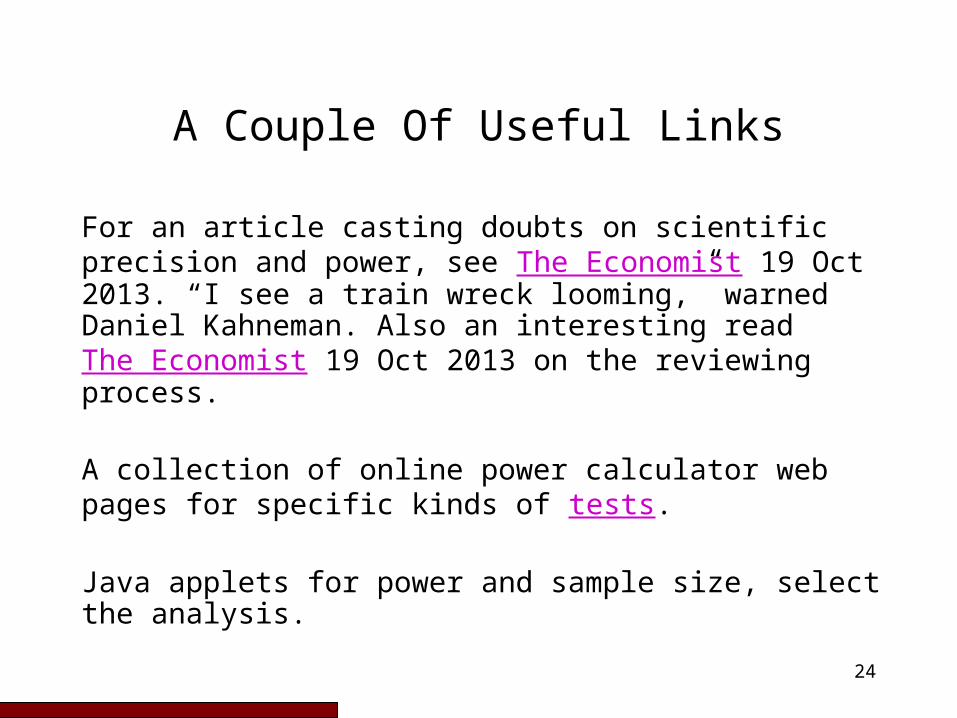
A Couple Of Useful Links
For an article casting doubts on scientific precision and power, see The Economist 19 Oct 2013. “I see a train wreck looming,” warned Daniel Kahneman. Also an interesting read The Economist 19 Oct 2013 on the reviewing process.
A collection of online power calculator web pages for specific kinds of tests.
Java applets for power and sample size, select the analysis.
25
Next Week
Statistical Power Analysis In Minitab
26
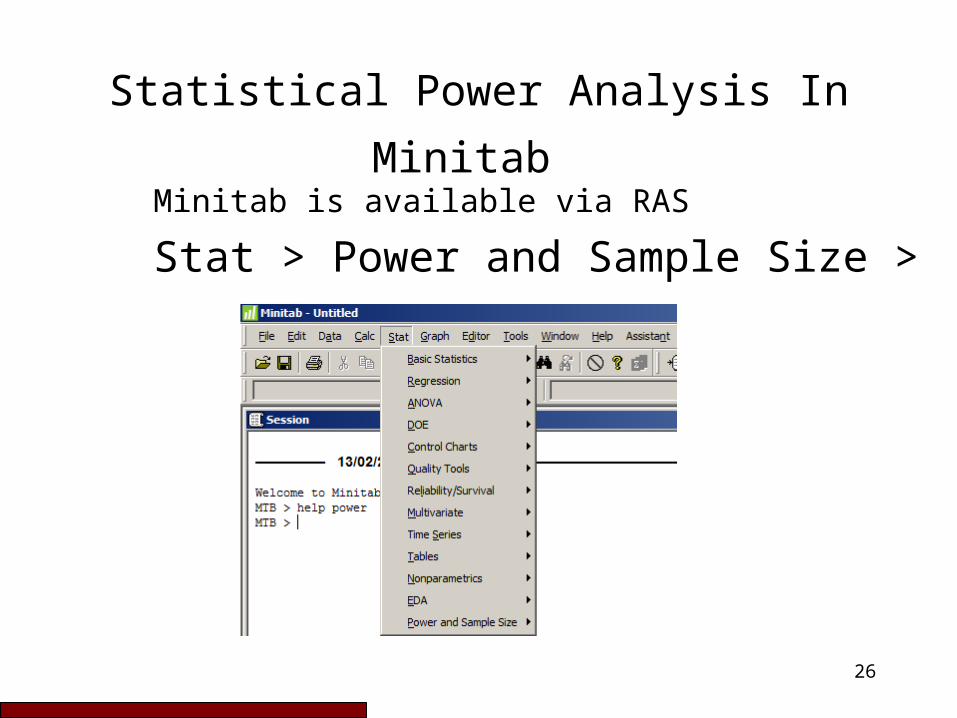
Statistical Power Analysis In Minitab Minitab is available via RAS
Stat > Power and Sample Size >
27
Statistical Power Analysis In Minitab
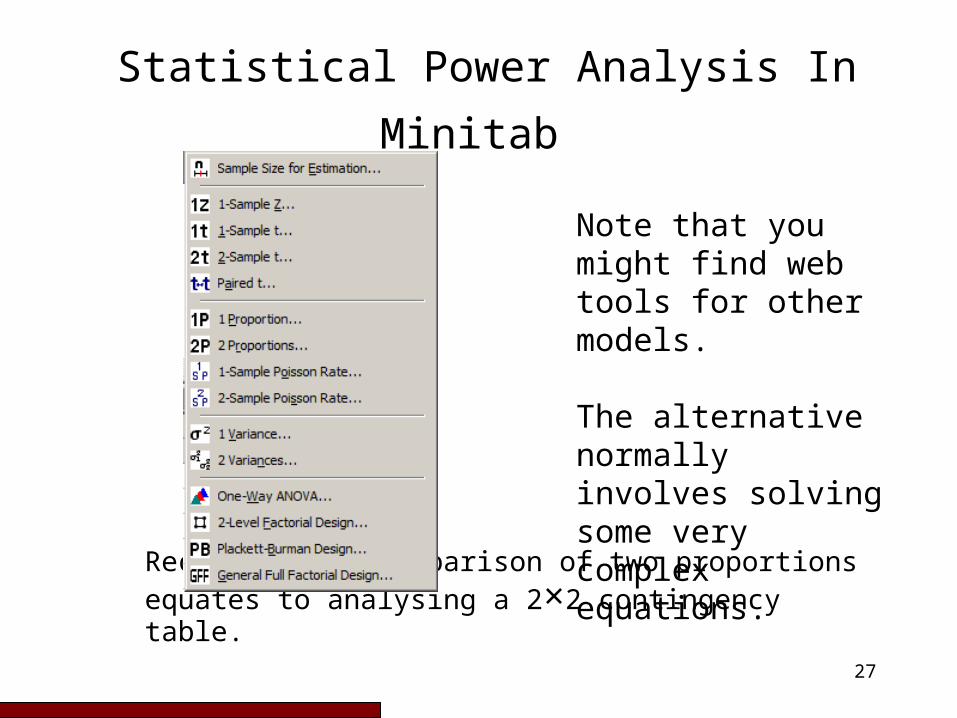
Recall that a comparison of two proportions equates to analysing a 2×2 contingency table.
Note that you might find web tools for other models.
The alternative normally involves solving some very complex equations.
28
Statistical Power Analysis In Minitab
Note that you might find web tools for other models.
The alternative normally involves solving some very complex equations.
Simple statistical correlation analysis online
See Test 28 in the Handbook of Parametric and Nonparametric Statistical Procedures, Third Edition by David J Sheskin
29
Factors That Influence Power
• Sample Size• alpha • the standard deviation
30
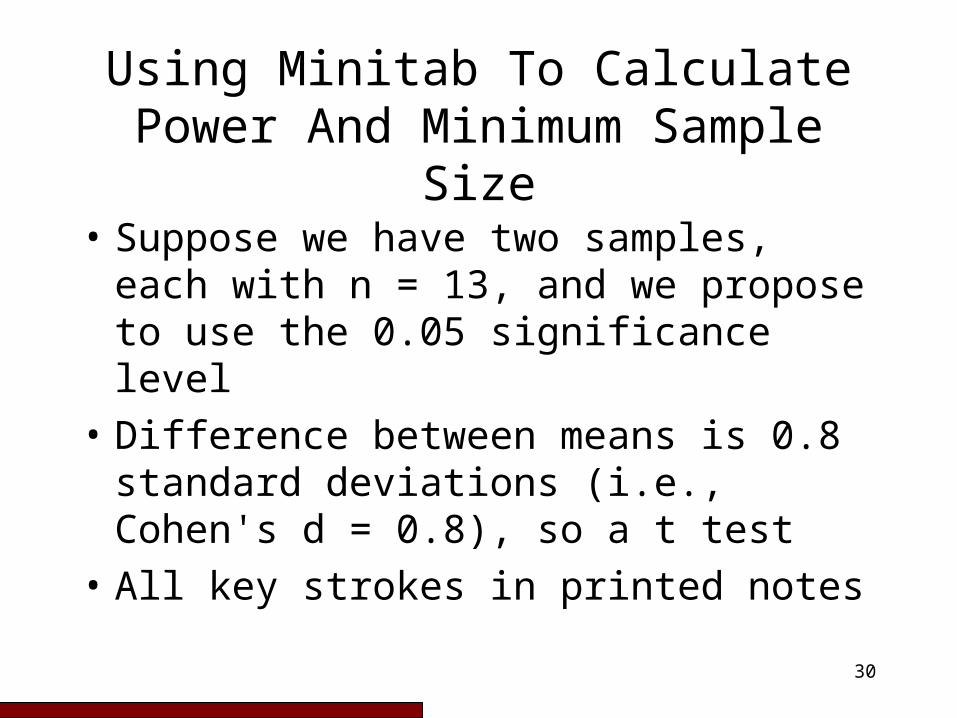
Using Minitab To Calculate Power And Minimum Sample
Size• Suppose we have two samples,
each with n = 13, and we propose to use the 0.05 significance level
• Difference between means is 0.8 standard deviations (i.e., Cohen's d = 0.8), so a t test
• All key strokes in printed notes

31
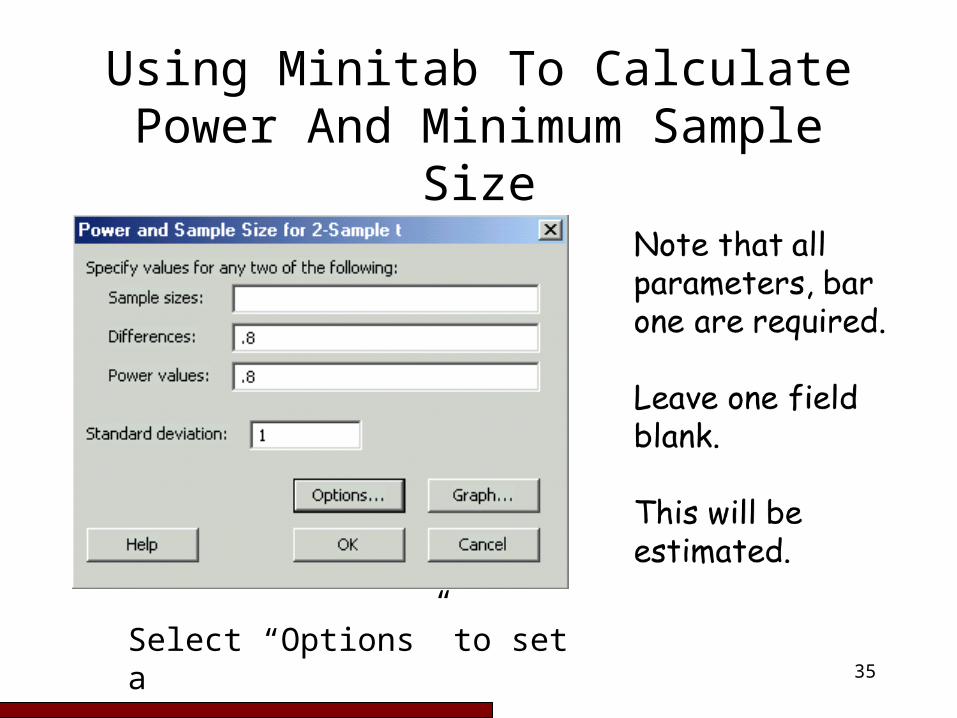
Using Minitab To Calculate Power And Minimum Sample
SizeNote that all parameters, bar one are required.
Leave one field blank.
This will be estimated.
32
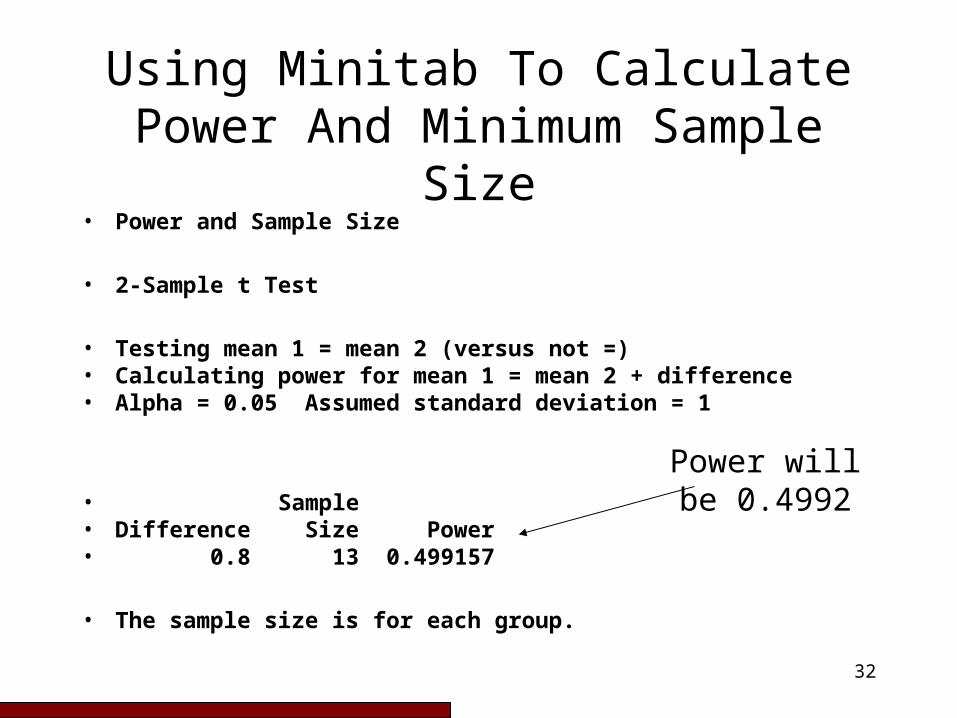
Using Minitab To Calculate Power And Minimum Sample
Size• Power and Sample Size
• 2-Sample t Test
• Testing mean 1 = mean 2 (versus not =)• Calculating power for mean 1 = mean 2 + difference• Alpha = 0.05 Assumed standard deviation = 1
• Sample• Difference Size Power• 0.8 13 0.499157
• The sample size is for each group.
Power will be 0.4992
33
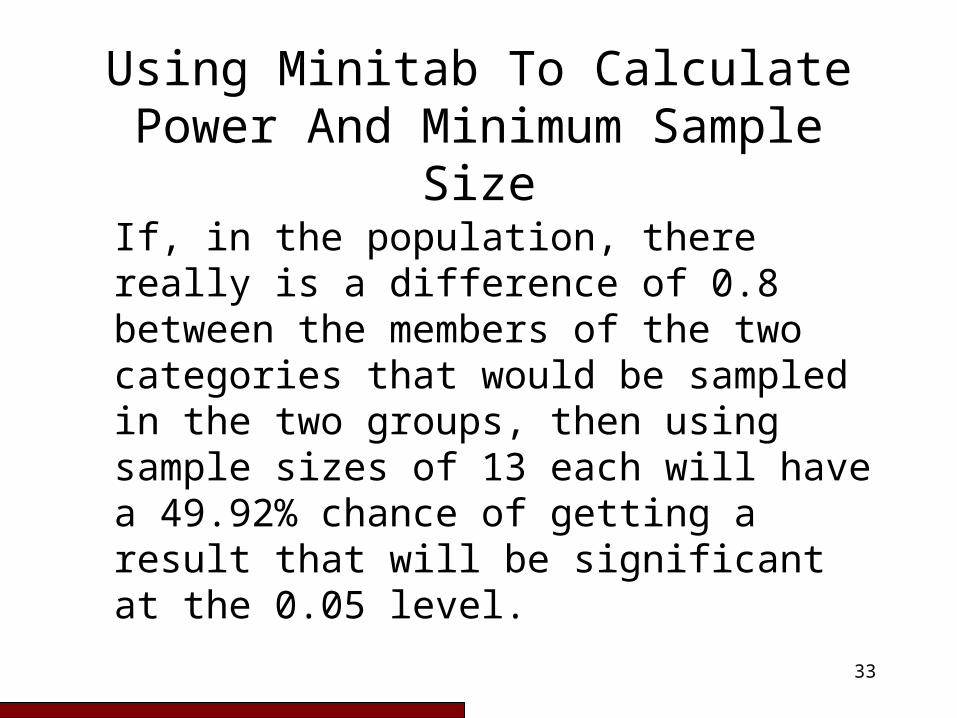
Using Minitab To Calculate Power And Minimum Sample
SizeIf, in the population, there really is a difference of 0.8 between the members of the two categories that would be sampled in the two groups, then using sample sizes of 13 each will have a 49.92% chance of getting a result that will be significant at the 0.05 level.

34
Using Minitab To Calculate Power And Minimum Sample
Size• Suppose the difference between the
means is 0.8 standard deviations (i.e., Cohen's d = 0.8)
• Suppose that we require a power of 0.8 (the conventional value)
• Suppose we intend doing a one-tailed t test, with significance level 0.05.
• All key strokes in printed notes
35
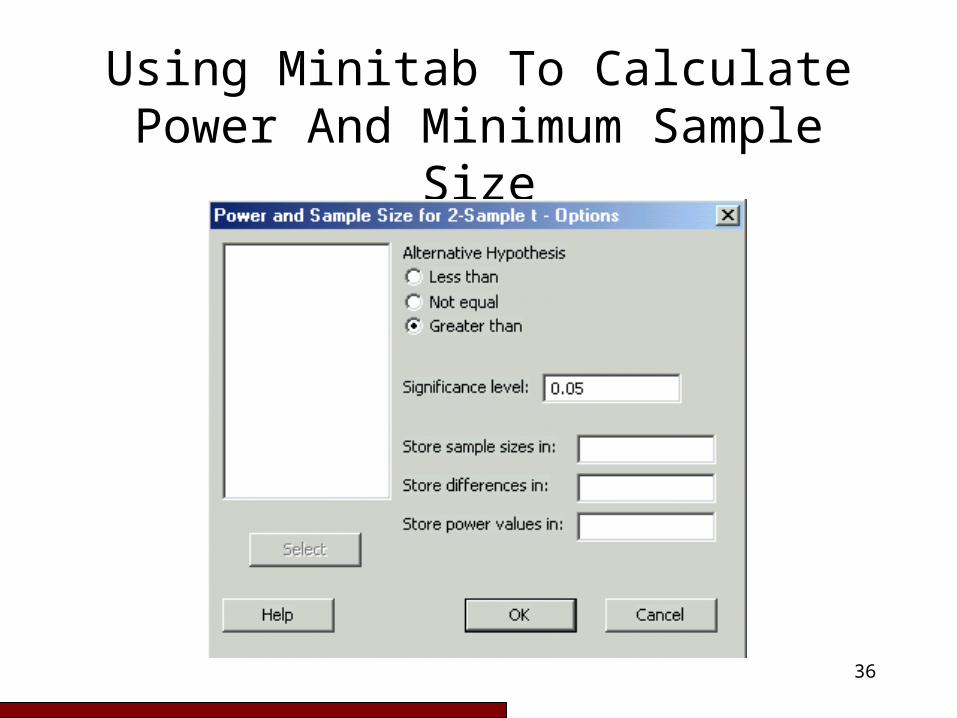
Using Minitab To Calculate Power And Minimum Sample
Size
Select “Options” to set a one-tailed test
36
Using Minitab To Calculate Power And Minimum Sample
Size
37
Using Minitab To Calculate Power And Minimum Sample
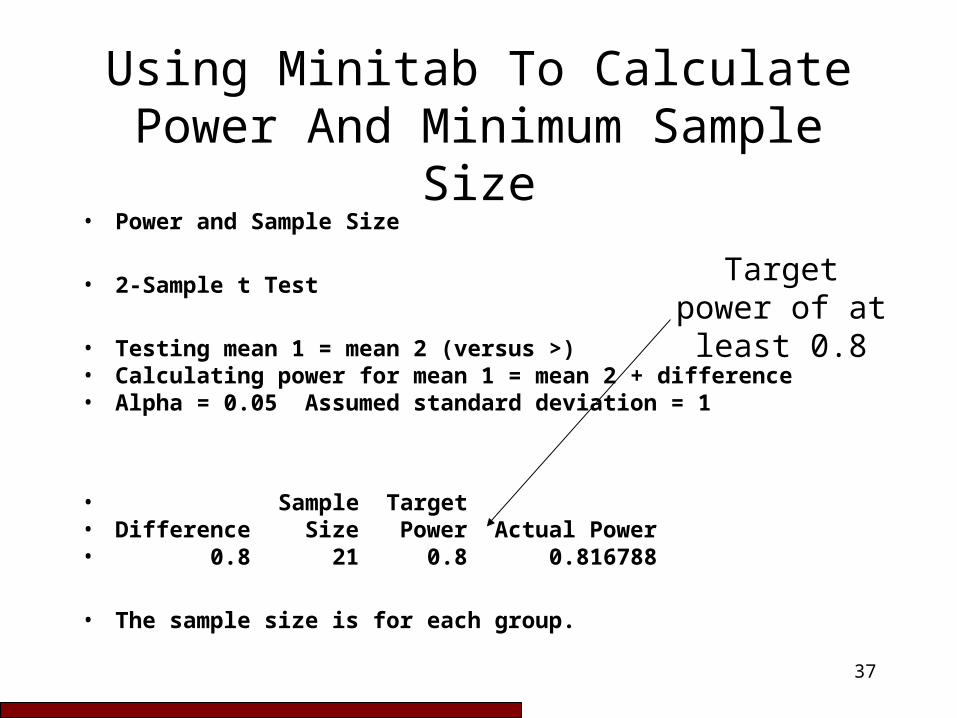
Size• Power and Sample Size
• 2-Sample t Test
• Testing mean 1 = mean 2 (versus >)• Calculating power for mean 1 = mean 2 + difference• Alpha = 0.05 Assumed standard deviation = 1
• Sample Target• Difference Size Power Actual Power• 0.8 21 0.8 0.816788
• The sample size is for each group.
Target power of at least 0.8
38
Using Minitab To Calculate Power And Minimum Sample
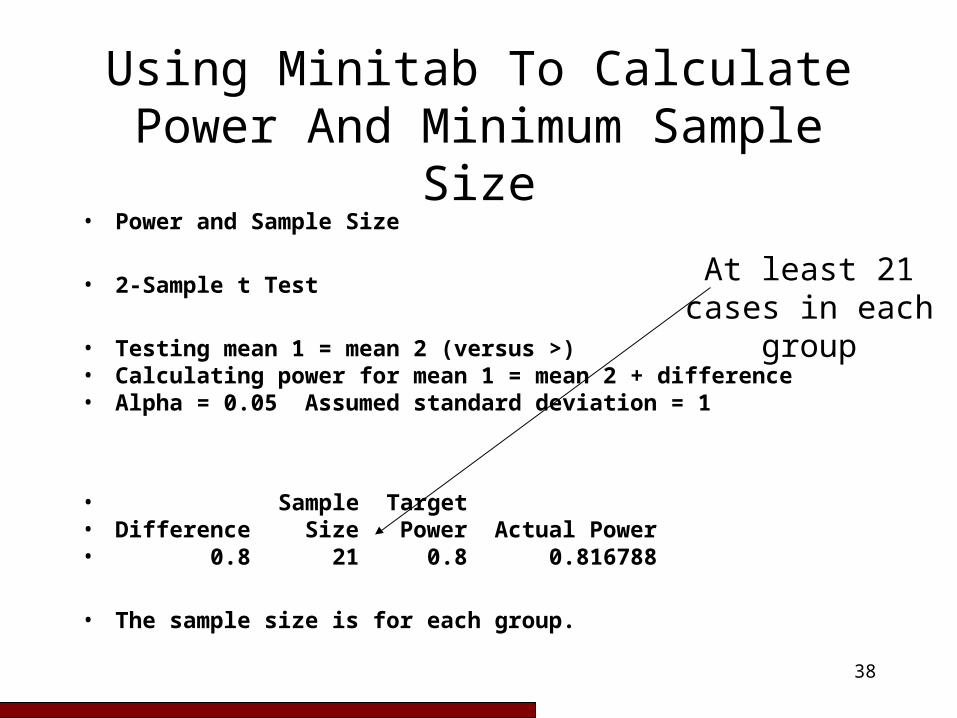
Size• Power and Sample Size
• 2-Sample t Test
• Testing mean 1 = mean 2 (versus >)• Calculating power for mean 1 = mean 2 + difference• Alpha = 0.05 Assumed standard deviation = 1
• Sample Target• Difference Size Power Actual Power• 0.8 21 0.8 0.816788
• The sample size is for each group.
At least 21 cases in each group
39
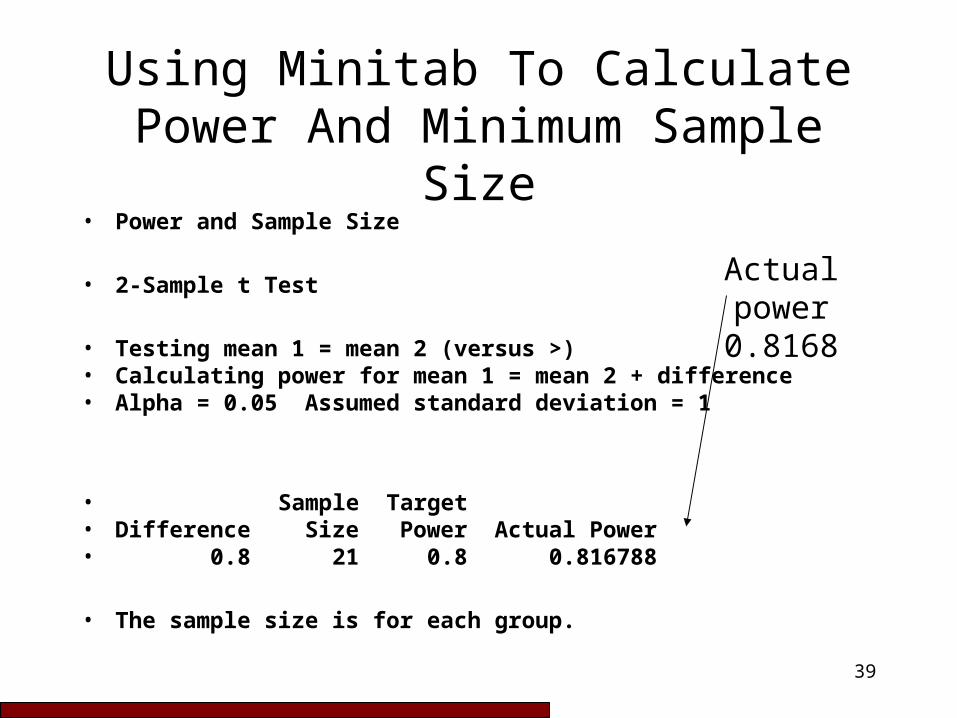
Using Minitab To Calculate Power And Minimum Sample
Size• Power and Sample Size
• 2-Sample t Test
• Testing mean 1 = mean 2 (versus >)• Calculating power for mean 1 = mean 2 + difference• Alpha = 0.05 Assumed standard deviation = 1
• Sample Target• Difference Size Power Actual Power• 0.8 21 0.8 0.816788
• The sample size is for each group.
Actual power 0.8168
40
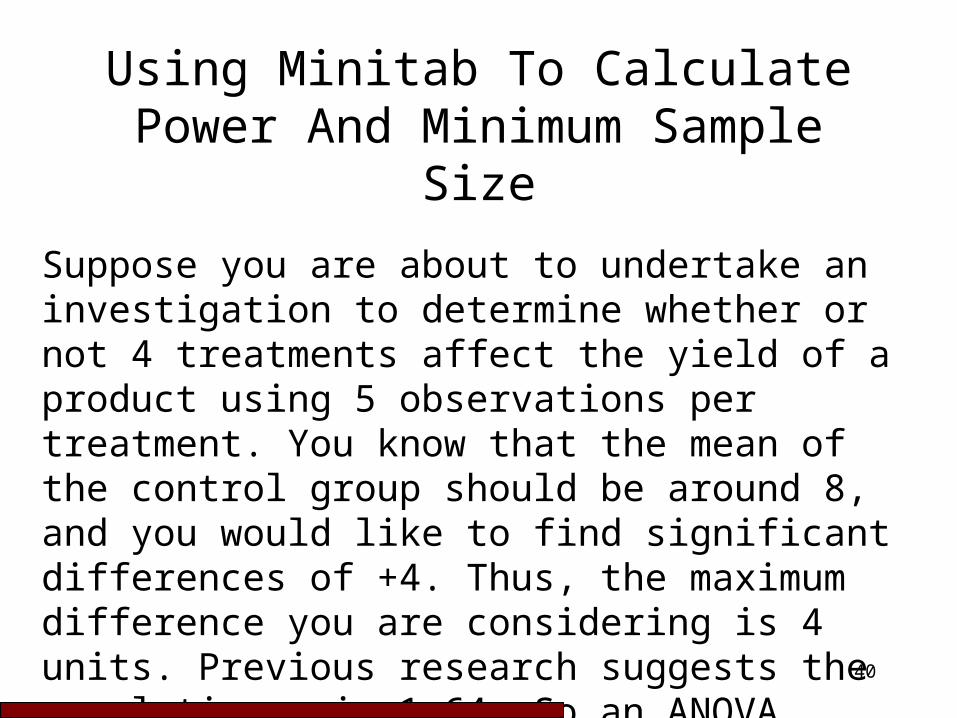
Using Minitab To Calculate Power And Minimum Sample
Size
Suppose you are about to undertake an investigation to determine whether or not 4 treatments affect the yield of a product using 5 observations per treatment. You know that the mean of the control group should be around 8, and you would like to find significant differences of +4. Thus, the maximum difference you are considering is 4 units. Previous research suggests the population σ is 1.64. So an ANOVA.

41
Using Minitab To Calculate Power And Minimum Sample
Size
42
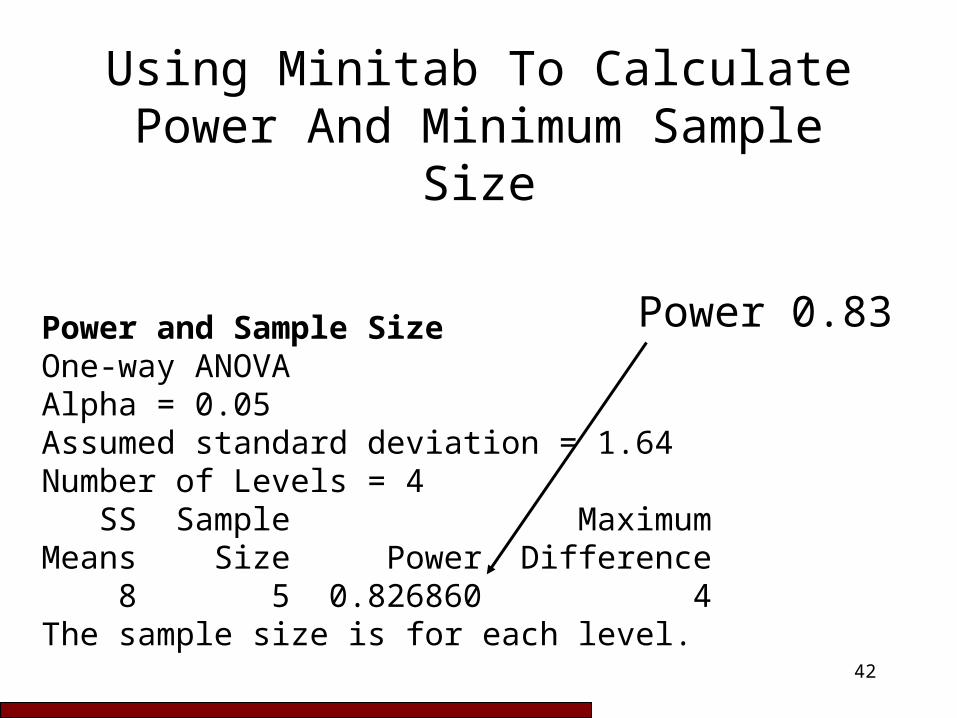
Using Minitab To Calculate Power And Minimum Sample
Size
Power and Sample Size One-way ANOVAAlpha = 0.05 Assumed standard deviation = 1.64 Number of Levels = 4 SS Sample MaximumMeans Size Power Difference 8 5 0.826860 4The sample size is for each level.
Power 0.83

43
Using Minitab To Calculate Power And Minimum Sample
Size
To interpret the results, if you assign five observations to each treatment level, you have a power of 0.83 to detect a difference of 4 units or more between the treatment means.
Minitab can also display the power curve of all possible combinations of maximum difference in mean detected and the power values for one-way ANOVA with the 5 samples per treatment.
44
Next Week
Manual Calculations of Power

45
Sample Size Equations
Five different sample size equations are presented in the printed notes.
For obvious reasons, only one is explored in detail here.

46
Determining The Necessary Sample Size For Estimating A Single Population Mean Or A Single Population Total With A
Specified Level Of Precision.
Calculate an initial sample size using the following equation:
2
22
B
sZn
n The uncorrected sample size estimate.
Zα The standard normal coefficient from the table on a later slide
s The standard deviation.
recall
n
xz
2
22
x
zn
2
22
B
zn
47
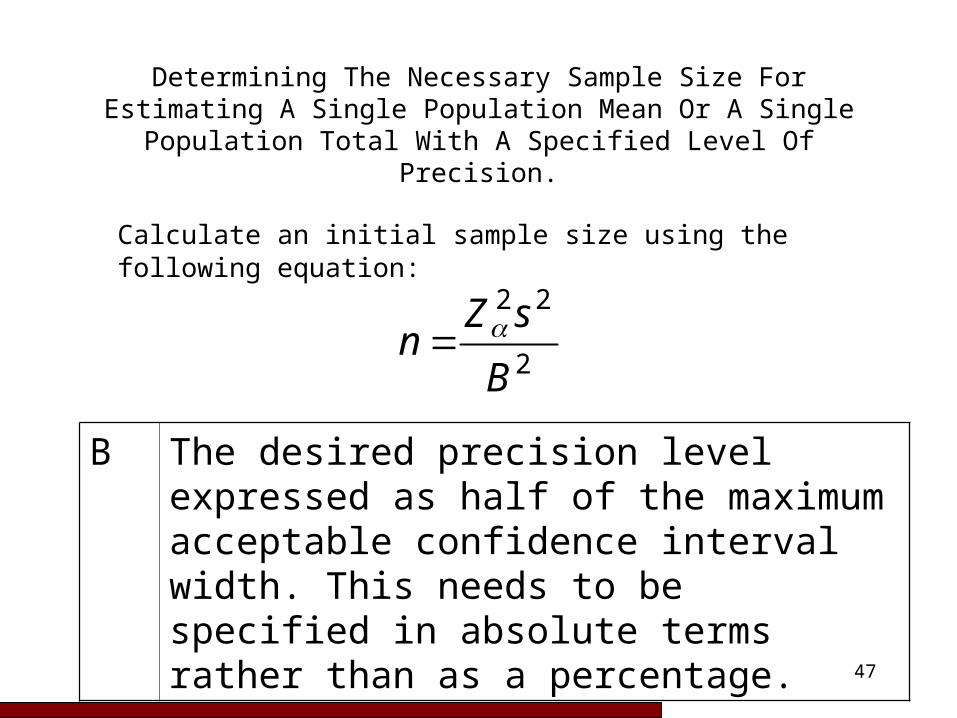
Determining The Necessary Sample Size For Estimating A Single Population Mean Or A Single Population Total With A
Specified Level Of Precision.
Calculate an initial sample size using the following equation:
2
22
B
sZn
B The desired precision level expressed as half of the maximum acceptable confidence interval width. This needs to be specified in absolute terms rather than as a percentage.
48
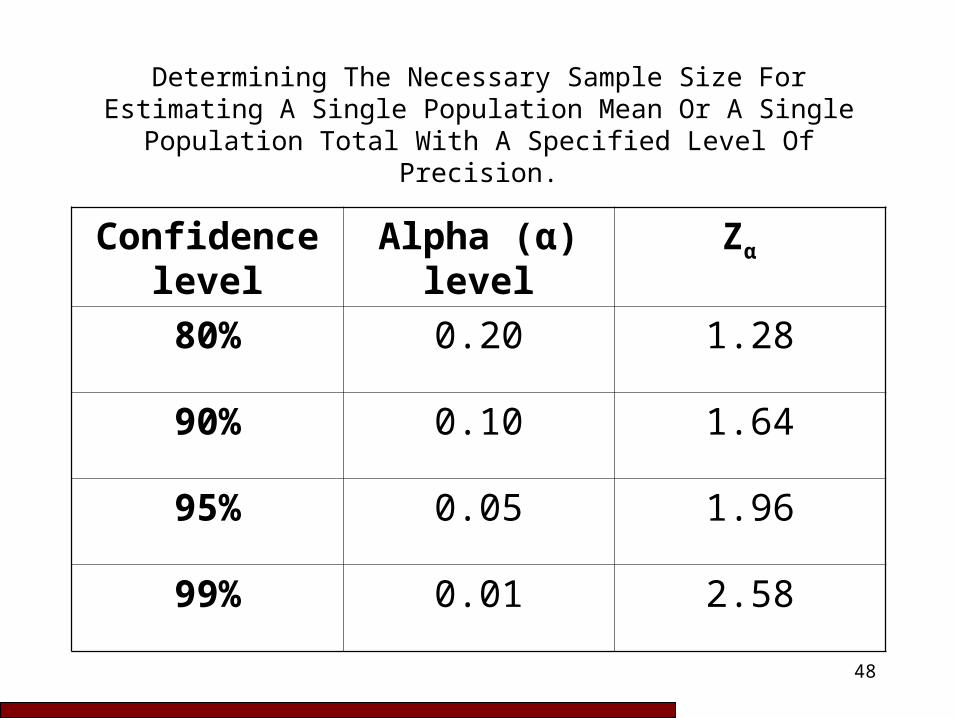
Determining The Necessary Sample Size For Estimating A Single Population Mean Or A Single Population Total With A
Specified Level Of Precision.
Confidence level
Alpha (α) level
Zα
80% 0.20 1.28
90% 0.10 1.64
95% 0.05 1.96
99% 0.01 2.58
49
Determining The Necessary Sample Size For Estimating A Single Population Mean Or A Single Population Total With A
Specified Level Of Precision.
To obtain the adjusted sample size estimate, consult the correction table in the printed notes. n is the uncorrected sample size value from the sample size equation. n* is the corrected sample size value.
See the example below.

50
Determining The Necessary Sample Size For Estimating A Single Population Mean Or A Single Population Total With A
Specified Level Of Precision.
Additional correction for sampling finite populations.
The above formula assumes that the population is very large compared to the proportion of the population that is sampled. If you are sampling more than 5% of the whole population then you should apply a correction to the sample size estimate that incorporates the finite population correction factor (FPC). This will reduce the sample size.
51
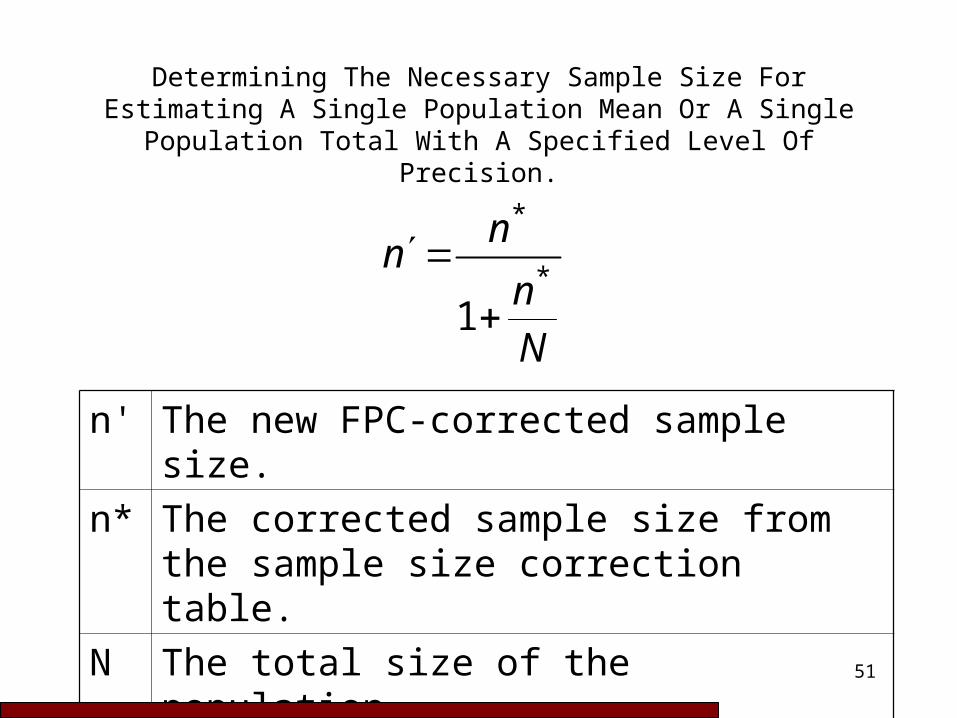
Determining The Necessary Sample Size For Estimating A Single Population Mean Or A Single Population Total With A
Specified Level Of Precision.
N
n
nn
*
*
1
n' The new FPC-corrected sample size.
n* The corrected sample size from the sample size correction table.
N The total size of the population.

52
Example
• Objective: Restore the population of species Y in population Z to a density of at least 30
• Sampling objective: Obtain estimates of the mean density and population size of 95% confidence intervals within 20% (±) of the estimated true value.
• Results of pilot sampling: Mean ( ) = 25Standard deviation (s) = 7
x
53
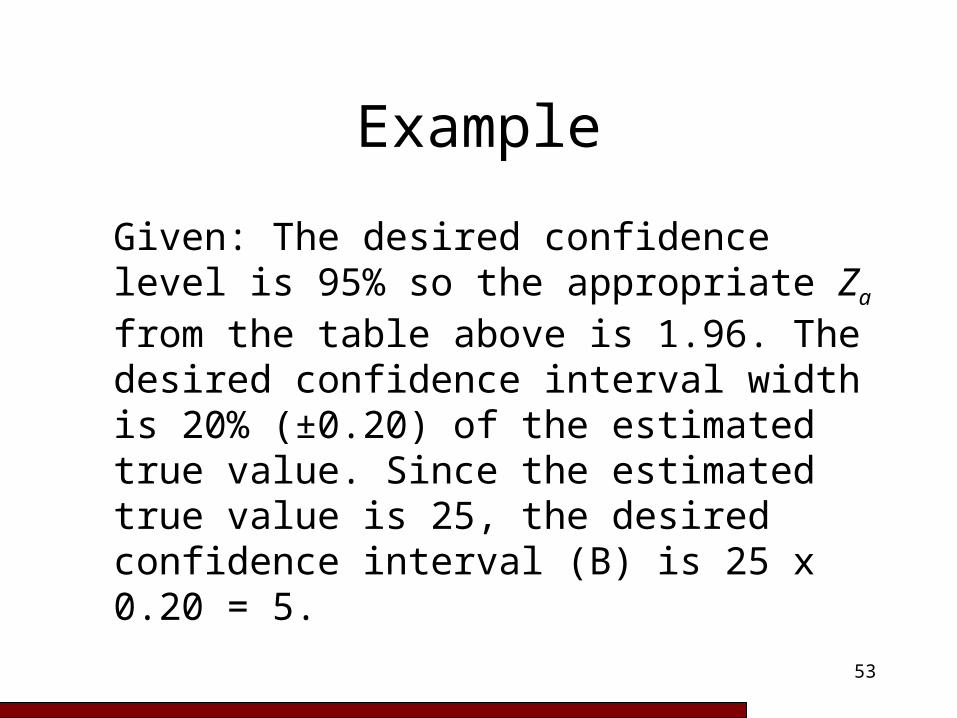
Example
Given: The desired confidence level is 95% so the appropriate Za from the table above is 1.96. The desired confidence interval width is 20% (±0.20) of the estimated true value. Since the estimated true value is 25, the desired confidence interval (B) is 25 x 0.20 = 5.
54
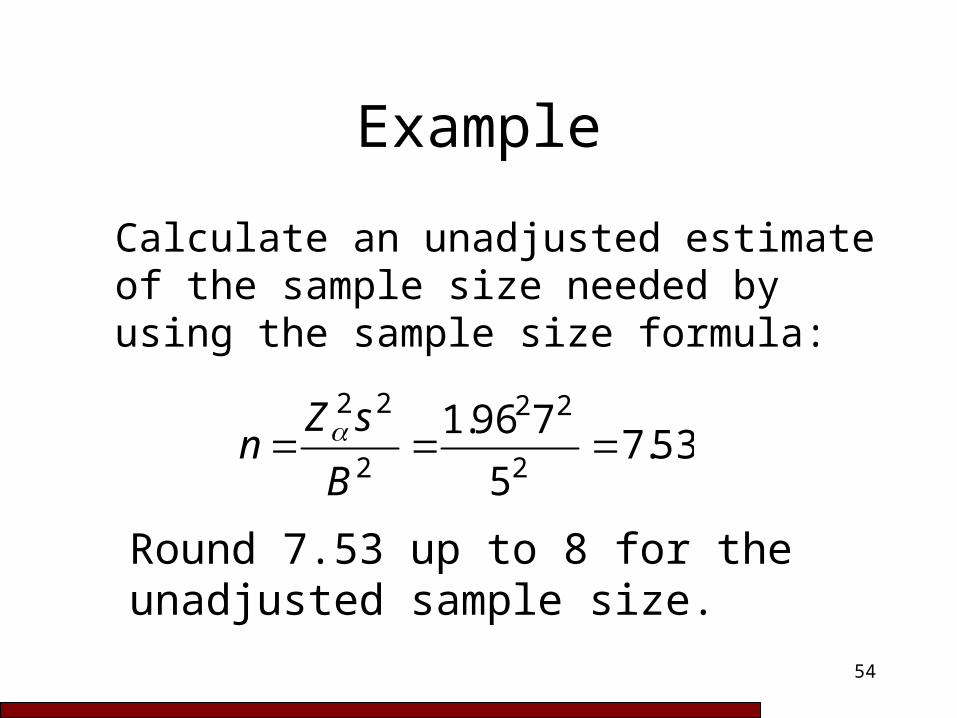
Example
Calculate an unadjusted estimate of the sample size needed by using the sample size formula:
53.75
796.12
22
2
22
B
sZn
Round 7.53 up to 8 for the unadjusted sample size.

55
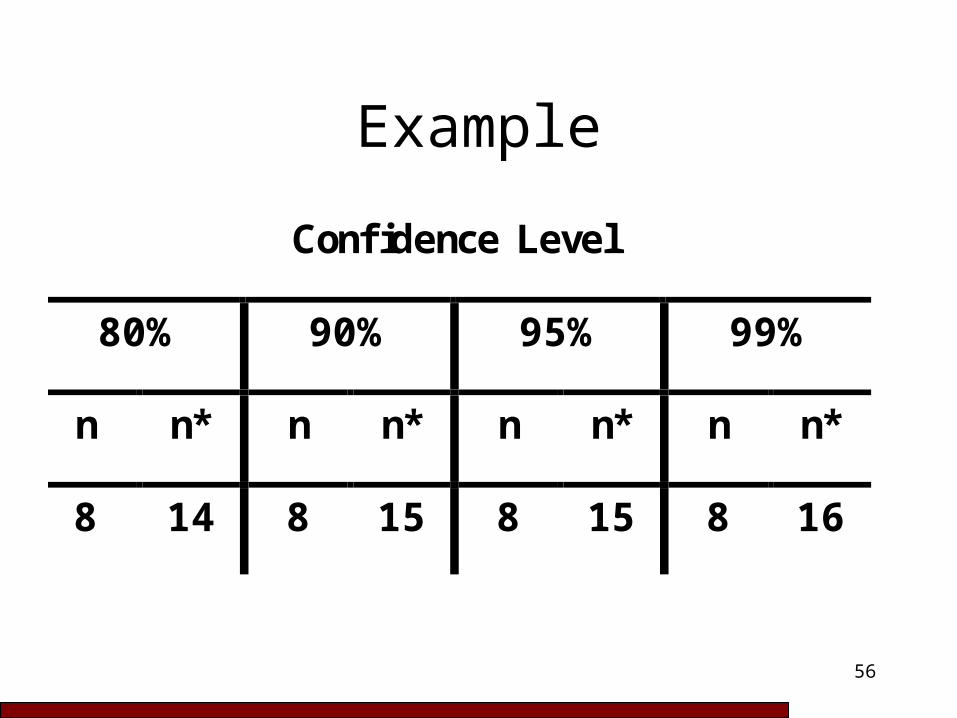
Example
To adjust this preliminary estimate, go to the sample size correction table and find n = 8 and the corresponding n* value in the 95% confidence level portion of the table. For n = 8, the corresponding value is n* = 15.
56
Example
Confidence Level
80% 90% 95% 99%
n n* n n* n n* n n*
8 14 8 15 8 15 8 16
57
Example
The corrected estimated sample size needed to be 95% confident that the estimate of the population mean is within 20% (±5) of the true mean is 15.

58
Example
Additional correction for sampling finite populations.
If the pilot data described above was gathered using a 1m x 10m (10 m2) quadrat and the total population being sampled was located within a 20m x 50m macroplot (1000 m2) then N = 1000m2/10m2 = 100.
59
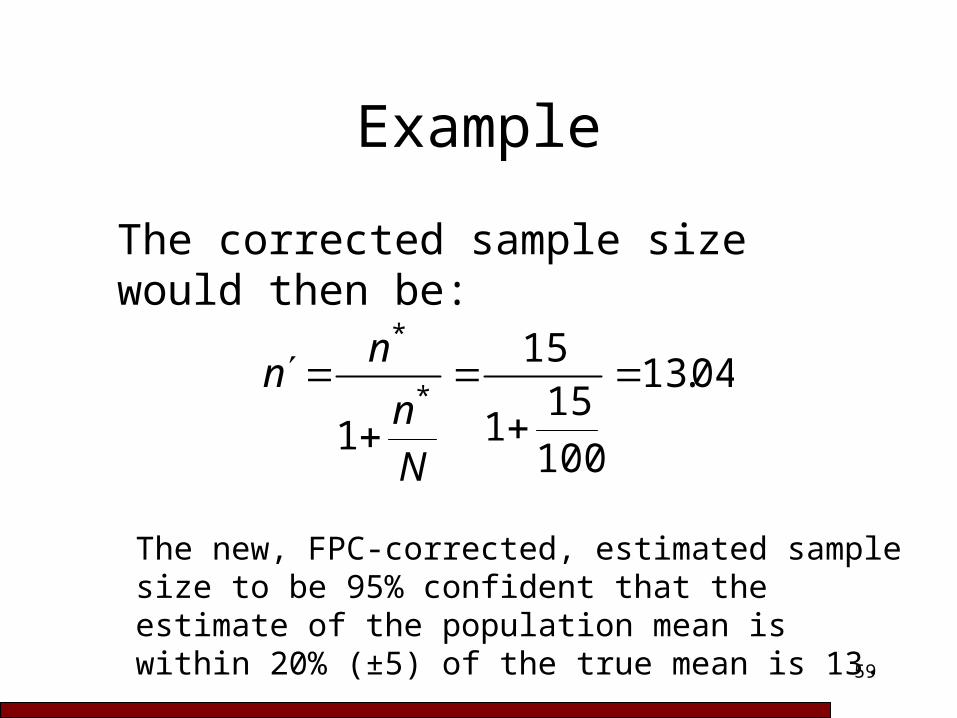
Example
The corrected sample size would then be:
04.13
100
151
15
1*
*
N
n
nn
The new, FPC-corrected, estimated sample size to be 95% confident that the estimate of the population mean is within 20% (±5) of the true mean is 13.

60
TextSample size calculations in clinical research
edited by Shein-Chung Chow, Jun Shao, Hansheng Wang
New York : Marcel Dekker, 2003
Long loan Robinson Books Level 4 610.72 SAM
see also the conventional notes

61
Bibliography 1 of 4
Also see Tutorial in Quantitative Methods for Psychology Volume 3, no 2 (2007): Special issue on statistical power.
Editors note: The Uncorrupted Statistical Power
Statistical Power: An Historical Introduction
A Short Tutorial of GPower
62
Bibliography 2 of 4
Understanding Power and Rules of Thumb for Determining Sample SizesCarmen R. Wilson VanVoorhis and Betsy L. Morgan Tutorials in Quantitative Methods for Psychology 2007 3(2) 43-50. This article addresses the definition of power and its relationship to Type I and Type II errors. We discuss the relationship of sample size and power. Finally, we offer statistical rules of thumb guiding the selection of sample sizes large enough for sufficient power to detecting differences, associations, chi-square, and factor analyses.
63
Bibliography 3 of 4Computing the Power of a t Test
Also see
Non-central t Distribution and the Power of the t Test: A Rejoinder
Understanding Statistical Power Using Non-central Probability Distributions: Chi-squared, G-squared, and ANOVA
Power Estimation in Multivariate Analysis of Variance
A Power Primer

64
Bibliography 4 of 4A Power Primer Cohen J. Tutorials in Quantitative Methods for Psychology 2007 3(2) 79.
One possible reason for the continued neglect of statistical power analysis in research in the behavioral sciences is the inaccessibility of or difficulty with the standard material. A convenient, although not comprehensive, presentation of required sample sizes is provided here. Effect-size indexes and conventional values for these are given for operationally defined small, medium, and large effects. The sample sizes necessary for .80 power to detect effects at these levels are tabled for eight standard statistical tests: (a) the difference between independent means, (b) the significance of a product–moment correlation, (c) the difference between independent rs, (d) the sign test, (e) the difference between independent proportions, (f) chi-square tests for goodness of fit and contingency tables, (g) one-way analysis of variance, and (h) the significance of a multiple or multiple partial correlation. A Power Primer Cohen J. Psychological Bulletin 1992 112(1) 155-159 DOI: 10.1037/0033-2909.112.1.155

65
Caveat
It is well known that statistical power calculations can be valuable in planning an experiment. There is also a large literature advocating that power calculations be made whenever one performs a statistical test of a hypothesis and one obtains a statistically non-significant result.

66
Caveat
Advocates of such post-experiment power calculations claim the calculations should be used to aid in the interpretation of the experimental results. This approach, which appears in various forms, is fundamentally flawed.
67
CaveatThe paper documents that the problem is extensive and presents arguments to demonstrate the flaw in the logic.
The abuse of power: The pervasive fallacy of power calculations for data analysis, Hoenig J.M. and Heisey D.M. American Statistician, 55(1), 19-24, 2001.

68
Have You Done Enough?“This technical note provides guidance on how to critique the statistical analysis of … studies to maximise the chance that the paper will be declined.”
Ten ironic rules for non-statistical reviewersKarl FristonNeuroImage 2012 61 1300–1310.