1 State of Palestine Palestinian Central Bureau of Statistics · 62 the Palestinian Central Bureau...
86
State of Palestine Palestinian Central Bureau of Statistics Palestine in Figures 2016 March, 2017
Transcript of 1 State of Palestine Palestinian Central Bureau of Statistics · 62 the Palestinian Central Bureau...
1
1 State of Palestine 2
Palestinian Central Bureau of Statistics 3 4
5
6
7
8
9
Palestine in Figures 10
2016 11
12
13 14
15 March, 2017 16
17

2
This document is prepared in accordance with the standard
procedures stated in the Code of Practice for Palestine Official
Statistics 2006.
18 19 20 21
22 23 © March, 2017 24
All rights reserved 25 26 Citation: 27 28 Palestinian Central Bureau of Statistics, 2017. Palestine in Figures 29 2016. Ramallah – Palestine. 30 31 All correspondence should be directed to: 32 Palestinian Central Bureau of Statistics 33 P. O Box 1647. Ramallah - Palestine 34 35
Tel: (972/970) 2 2982700
Fax: (972/970) 2 2982710
Toll Free: 1800300300
E-Mail: [email protected]
Reference ID: 2261 Website: http://www.pcbs.gov.ps
36
3
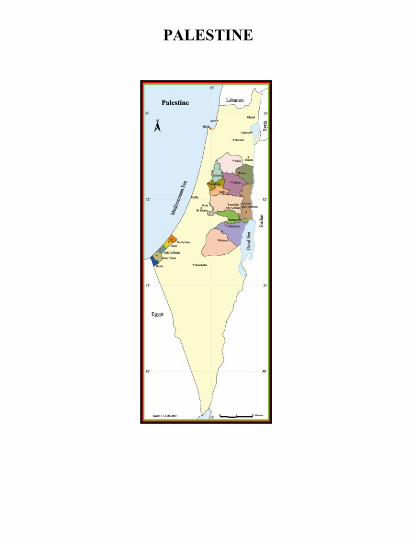
PALESTINE 37
38

4
National Statististical System Mission 39 40
"To produce and disseminate coherent, objective, high quality and 41 timely official statistics to meet user needs nationally and 42
internationally". 43 44 45 46 47 48 49 50

5
Explanation of Symbols in Tables: 51 52 (-) = Nil 53 (0) = Less than half of the unit 54 (..) = Not available 55 56 Note: 57 1. Data referred to in this document represent Palestine (West Bank 58 including Jerusalem and Gaza Strip) unless otherwise stated. 59 60 2. Data referred to in this document are based on two main sources: first, 61 the Palestinian Central Bureau of Statistics, where data is derived from 62 different surveys and censuses and secondly, data obtained from the 63 administrative records of public and private institutions. For those who 64 require more details on sources, please contact the Division for User 65 Services at PCBS. 66 67 3. Scholastic Year: starts in August of every year and ends in June of the 68 following year. 69 70 4. Agricultural Year: starts in October of every year and ends in September 71 of the following year. 72
73 74

6
Table of Contents 75 76
Subject Page
Selected Indicators by Region 7 Population 8 Labour 61
Living Standards 16
Education 12
Culture 16 Information Society 12
Health 04
Security and Justice 01
International Investment Position 02
Establishments 21
National Accounts 22
Consumer Price Index 25
Registered Foreign Trade 16
Building Licenses 12
Transportation & Communications 17
Finance & Insurance 15
Other Economic Sectors 76
Tourism 71
Agriculture 72
Environment 78
Housing Conditions 82
7
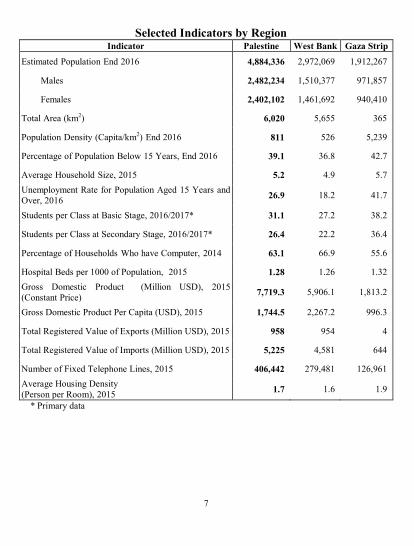
Selected Indicators by Region 77 Indicator Palestine West Bank Gaza Strip
Estimated Population End 2016 48,,48,,4 175717415 675617117
Males 484,484,4 672647177 5767827
Females 484,484,4 670167151 5047064
Total Area (km2) 48,4, 27122 112 Population Density (Capita/km2) End 2016 ,44 211 27115
Percentage of Population Below 15 Years, End 2016 ,.94 11.8 01.7
Average Household Size, 2015 294 0.5 2.7 Unemployment Rate for Population Aged 15 Years and
Over, 2016 26.9 18.2 41.7
Students per Class at Basic Stage, 2016/2017* 31.1 27.2 38.2
Students per Class at Secondary Stage, 2016/2017* 26.4 22.2 36.4
Percentage of Households Who have Computer, 2014 63.1 66.9 55.6 Hospital Beds per 1000 of Population, 2015 1.28 1.26 1.32 Gross Domestic Product (Million USD), 2015
(Constant Price) 9894.9, 27541.6 67861.1
Gross Domestic Product Per Capita (USD), 2015 4894492 17117.1 551.1
Total Registered Value of Exports (Million USD), 2015 958 954 4
Total Registered Value of Imports (Million USD), 2015 5,225 4,581 644 Number of Fixed Telephone Lines, 2015 4,48444 279,481 126,961 Average Housing Density
(Person per Room), 2015 1.7 1.6 1.9
* Primary data 78
79

8
Population80
9
81 82
10
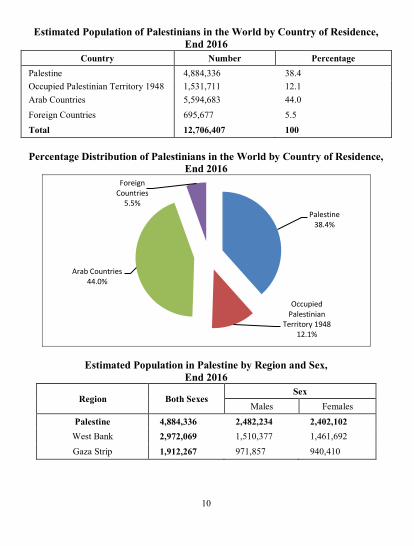
Estimated Population of Palestinians in the World by Country of Residence, 83 End 2016 84
Country Number Percentage
Palestine 4,884,336 38.4
Occupied Palestinian Territory 1948 1,531,711 12.1
Arab Countries 272507181 44.0
Foreign Countries 695,677 5.5
Total 4489,484,9 4,,
85 Percentage Distribution of Palestinians in the World by Country of Residence, 86
End 2014 87
88 89
Estimated Population in Palestine by Region and Sex, 90 End 2014 91
Region Both Sexes Sex
Males Females Palestine 48,,48,,4 484,484,4 484,484,4
West Bank 48.948,4. 672647177 670167151
Gaza Strip 48.448449 5767827 5047064
92 93
94
Palestine 38.4%
Occupied Palestinian
Territory 1948 12.1%
Arab Countries 44.0%
Foreign Countries
5.5%
11
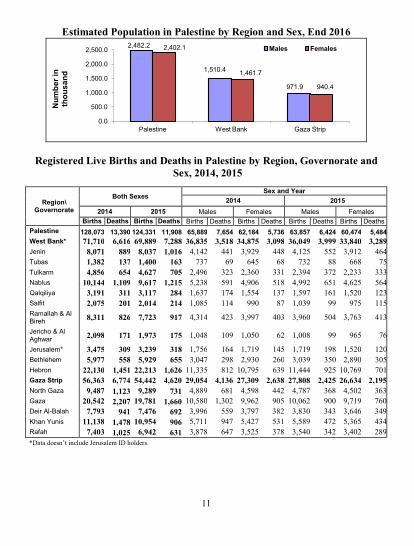
Estimated Population in Palestine by Region and Sex, End 2014 95
96 97
Registered Live Births and Deaths in Palestine by Region, Governorate and 98 Sex, 2014, 2015 99
100 Sex and Year
Both Sexes Region\
Governorate
1025 1024
Females Males Females Males 1025 1024
Deaths Births Deaths Births Deaths Births Deaths Births Deaths Births Deaths Births
5,484 60,474 6,424 63,857 5,736 62,184 7,654 65,889 11,908 124,331 13,390 128,073 Palestine
3,289 33,840 3,999 36,049 3,098 34,875 3,518 36,835 7,288 69,889 6,616 71,710 West Bank*
464 3,912 552 4,125 448 3,929 441 4,142 1,016 8,037 889 8,071 Jenin
75 668 88 732 68 645 69 737 163 1,400 137 1,382 Tubas
333 2,233 372 2,394 331 2,360 323 2,496 705 4,627 654 4,856 Tulkarm
564 4,625 651 4,992 518 4,906 591 5,238 1,215 9,617 1,109 10,144 Nablus
123 1,520 161 1,597 137 1,554 174 1,637 284 3,117 311 3,191 Qalqiliya
115 975 99 1,039 87 990 114 1,085 214 2,014 201 2,075 Salfit
413 3,763 504 3,960 403 3,997 423 4,314 917 7,723 826 8,311 Ramallah & Al Bireh
76 965 99 1,008 62 1,050 109 1,048 175 1,973 171 2,098 Jericho & Al Aghwar
120 1,520 198 1,719 145 1,719 164 1,756 318 3,239 309 3,475 Jerusalem*
305 2,890 350 3,039 260 2,930 298 3,047 655 5,929 558 5,977 Bethlehem
701 10,769 925 11,444 639 10,795 812 11,335 1,626 22,213 1,451 22,130 Hebron
2,195 4484,4 2,425 498,,, 2,638 498,,. 4,136 4.8,24 4,620 54,442 6,774 56,363 Gaza Strip
111 07241 118 07787 001 07258 186 07885 731 .84,. 1,123 .84,9 North Gaza
714 57765 544 647411 542 57511 67141 647284 1,660 4.89,4 2,207 4,8244 Gaza
105 17101 101 17814 382 3,797 225 17551 692 98494 941 989., Deir Al-Balah
010 27112 071 27285 216 27017 507 27766 906 4,8.24 1,478 4484,, Khan Yunis
185 17041 101 17204 178 17212 107 17878 631 48.44 1,025 984,, Rafah
*Data doesn’t include Jerusalem ID holders.
101 102
2,482.2
1,510.4
971.9
2,402.1
1,461.7
940.4
0.0
500.0
1,000.0
1,500.0
2,000.0
2,500.0
Palestine West Bank Gaza Strip
Nu
mb
er
in
tho
us
an
d
Males Females

12
Registered Live Births and Deaths in the West Bank by Month of Birth, Month 103 of Death and Sex, 2014, 2015 104
105 Sex and Year
Both Sexes Month
1025 1024
Females Males Females Males 1025 1024
Deaths Births Deaths Births Deaths Births Deaths Births Deaths Births Deaths Births
3,289 33,840 3,999 36,049 3,098 34,875 3,518 36,835 7,288 69,889 6,616 71,710 West Bank*
356 3,032 428 3,201 362 2,930 351 3,132 784 6,233 713 6,062 January
351 2,563 344 2,758 232 2,665 310 2,723 695 5,321 542 5,388 February
315 2,875 346 3,078 270 2,922 319 3,049 661 5,953 589 5,971 March
230 2,574 321 2,833 249 2,708 274 2,811 551 5,407 523 5,519 April
262 2,809 336 2,889 263 2,820 282 2,890 598 5,698 545 5,710 May
229 2,808 256 3,050 214 2,927 273 3,145 485 5,858 487 6,072 June
269 3,180 338 3,371 224 3,146 288 3,473 607 6,551 512 6,619 July
288 3,182 291 3,404 245 3,251 281 3,520 579 6,586 526 6,771 August
207 2,807 319 3,044 247 3,097 262 3,158 526 5,851 509 6,255 September
257 2,780 290 2,882 225 2,913 276 3,118 547 5,662 501 6,031 October
240 2,561 340 2,803 276 2,771 298 2,867 580 5,364 574 5,638 November
285 2,669 390 2,736 291 2,725 304 2,949 675 5,405 595 5,674 December
*Data doesn’t include Jerusalem ID holders. 106
Registered Live Births in the West Bank by Month of Birth, 4,42 107
108 109
6,233
5,321
5,953
5,407
5,698
5,858
6,551 6,586
5,851 5,662
5,364
5,405
4,000
5,000
6,000
7,000
Month of Birth
Nu
mb
er
13
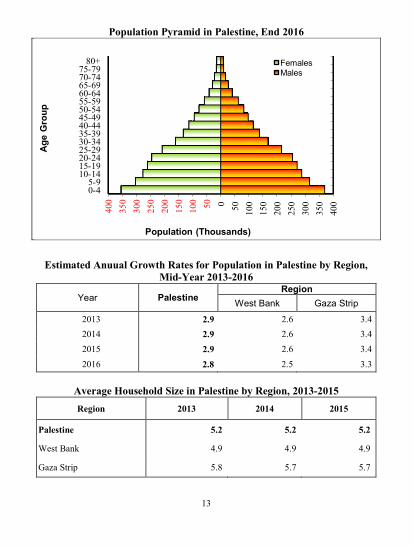
Population Pyramid in Palestine, End 2016 110
111 112 113
Estimated Anuual Growth Rates for Population in Palestine by Region, 114 Mid-Year 2013-2016 115
Year Palestine Region
West Bank Gaza Strip 1461 49. 1.1 1.0
2014 2.9 2.6 3.4
2015 49. 1.1 1.0
2016 49, 1.2 1.1
116 Average Household Size in Palestine by Region, 4,4,-2012 117 Region 2013 2014 2012
Palestine 294 294 294
West Bank 0.5 0.5 0.5 Gaza Strip 2.8 2.7 2.7
118
400
350
300
250
200
150
100
50
0
50
100
150
200
250
300
350
400
+84 75-72 70-74 15-12 10-14 25-22 20-24 05-02 00-04 15-12 10-14 15-12 10-14 65-62 60-64
5-2 0-4
Population (Thousands)
Ag
e G
rou
p
Females
Males
14
119

15
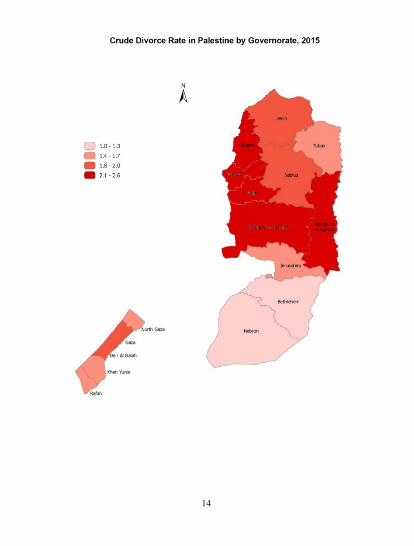
Crude Marriage and Divorce Rate (Per 1000) of Population for Registered 120 Cases at Shari’a Courts and Churches in Palestine by Governorate, 2012 121
122 Governorate
Registered Marriages Registered Divorces
Number Crude Rate Number Crude Rate
Palestine 50,438 10.8 ,849. 1.7
West Bank 29,701 10.4 48.44 1.7
Jenin 3,590 11.5 250 1.9
Tubas 766 11.8 51 1.5
Tulkarm 2,296 12.6 025 2.5
Nablus 3,971 10.4 761 1.9
Qalqilya 1,220 11.0 108 2.2
Salfit 958 13.5 674 2.4
Ramallah & Al-Bireh 3,020 8.7 712 2.1
Jericho & Al Aghwar 457 8.8 614 2.3
Jerusalem 3,263 7.8 160 1.5
Bethlehem 1,943 9.0 112 1.0
Hebron 8,217 11.6 504 1.3
Gaza Strip 20,737 11.4 ,8442 1.8
North Gaza 4,094 11.3 148 1.7
Gaza 7,315 11.7 67651 1.9
Deir Al-Balah 2,820 10.7 246 1.9
Khan Yunis 4,096 12.0 270 1.7
Rafah 2,412 10.7 154 1.7
123 124

16
Labour125
17
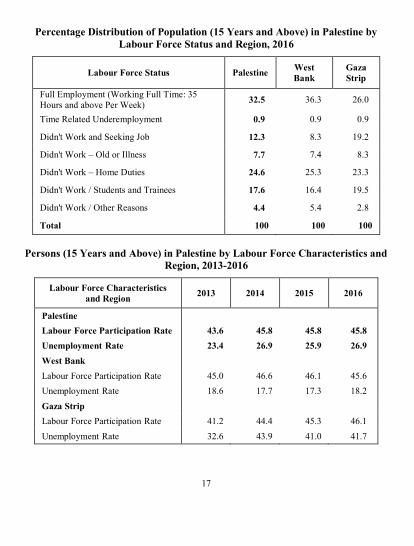
Percentage Distribution of Population (15 Years and Above) in Palestine by 126 Labour Force Status and Region, 2014 127
128
Labour Force Status Palestine West
Bank
Gaza
Strip
Full Employment (Working Full Time: 35
Hours and above Per Week) 32.5 36.3 26.0
Time Related Underemployment 0.9 0.9 0.9
Didn't Work and Seeking Job 12.3 8.3 19.2
Didn't Work – Old or Illness 7.7 7.4 8.3
Didn't Work – Home Duties 24.6 25.3 23.3
Didn't Work / Students and Trainees 17.6 16.4 19.5
Didn't Work / Other Reasons 4.4 5.0 2.8
Total 4,, 4,, 4,,
129 Persons (15 Years and Above) in Palestine by Labour Force Characteristics and 130
Region, 201,-2014 131 132
Labour Force Characteristics
and Region 2013 2014 2015 2014
Palestine
Labour Force Participation Rate 43.6 45.8 45.8 45.8
Unemployment Rate 23.4 26.9 25.9 26.9
West Bank Labour Force Participation Rate 45.0 46.6 46.1 45.6
Unemployment Rate 18.6 17.7 17.3 18.2 Gaza Strip
Labour Force Participation Rate 41.2 44.4 45.3 46.1
Unemployment Rate 32.6 43.9 41.0 41.7
133 134
18
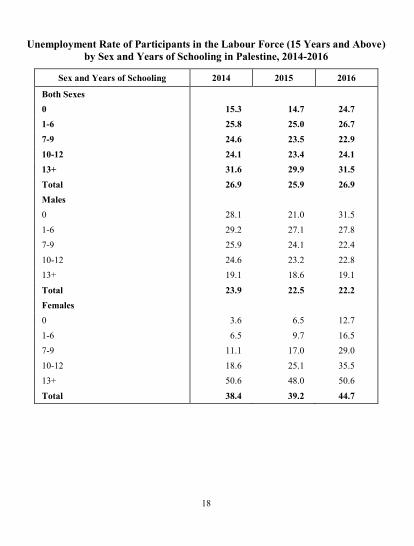
135 Unemployment Rate of Participants in the Labour Force (15 Years and Above) 136
by Sex and Years of Schooling in Palestine, 2014-2016 137 138
Sex and Years of Schooling 2014 2015 2016
Both Sexes
0 15.3 14.7 24.7
1-6 25.8 25.0 26.7
7-9 24.6 23.5 22.9
10-12 24.1 23.4 24.1
13+ 31.6 29.9 31.5
Total 26.9 25.9 26.9
Males
0 28.1 21.0 31.5
1-6 29.2 27.1 27.8
7-9 25.9 24.1 22.4
10-12 24.6 23.2 22.8
13+ 19.1 18.6 19.1
Total 23.9 22.5 22.2
Females
0 3.6 6.5 12.7
1-6 6.5 9.7 16.5
7-9 11.1 17.0 29.0
10-12 18.6 25.1 35.5
13+ 50.6 48.0 50.6
Total 38.4 39.2 44.7
139 140 141 142
143
19
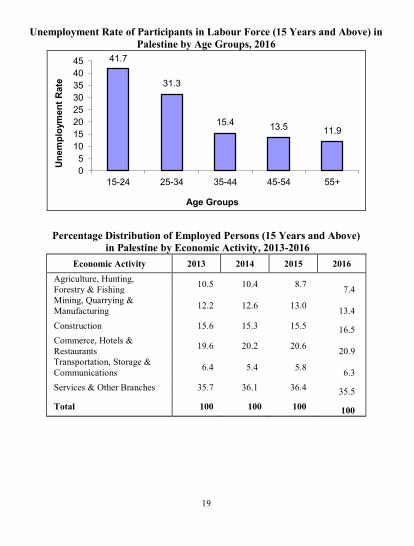
Unemployment Rate of Participants in Labour Force (15 Years and Above) in 144 Palestine by Age Groups, 2016 145
146 147
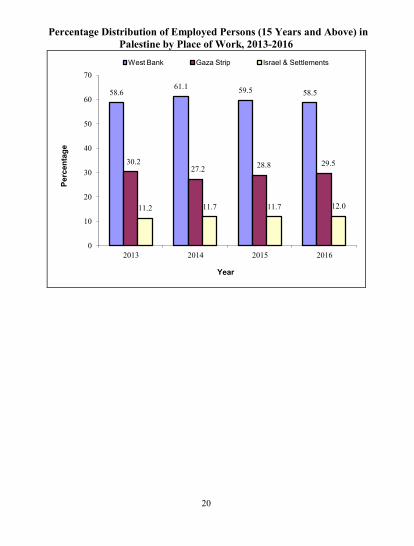
148 Percentage Distribution of Employed Persons (15 Years and Above) 149
in Palestine by Economic Activity, 2013-2016 150 Economic Activity 4,4, 4,44 4,42 4,44
Agriculture, Hunting,
Forestry & Fishing 64.2 10.4 8.7
7.4
Mining, Quarrying &
Manufacturing 61.1 12.6 61.4
13.4
Construction 62.1 15.3 62.2 16.5
Commerce, Hotels &
Restaurants 65.1 20.2 14.1
20.9
Transportation, Storage &
Communications 1.0 5.4 2.8
6.3
Services & Other Branches 12.7 36.1 11.0 35.5
Total 4,, 4,, 4,, 100
151 152
41.7
31.3
15.4 13.5 11.9
0
5
10
15
20
25
30
35
40
45
15-24 25-34 35-44 45-54 55+
Un
em
plo
ym
en
t R
ate
Age Groups
20
Percentage Distribution of Employed Persons (15 Years and Above) in 153 Palestine by Place of Work, 201,-2014 154
155 156
157 158
58.6 61.1
59.5 58.5
30.2 27.2
28.8 29.5
11.2 11.7 11.7 12.0
0
10
20
30
40
50
60
70
1461 1460 1462 1461
Perc
en
tag
e
Year
West Bank Gaza Strip Israel & Settlements
21
Living Standards 159
22
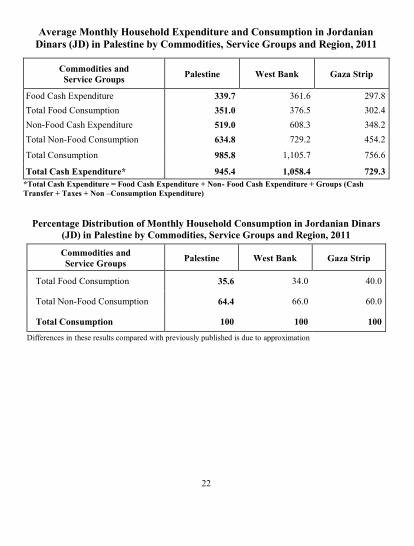
Average Monthly Household Expenditure and Consumption in Jordanian 160 Dinars (JD) in Palestine by Commodities, Service Groups and Region, 2011 161
162
Gaza Strip West Bank Palestine Commodities and
Service Groups
297.8 361.6 339.7 Food Cash Expenditure
302.4 376.5 351.0 Total Food Consumption
348.2 608.3 519.0 Non-Food Cash Expenditure
454.2 729.2 634.8 Total Non-Food Consumption
756.6 1,105.7 985.8 Total Consumption
729.3 1,058.4 945.4 Total Cash Expenditure*
*Total Cash Expenditure = Food Cash Expenditure + Non- Food Cash Expenditure + Groups (Cash 163 Transfer + Taxes + Non –Consumption Expenditure) 164 165
Percentage Distribution of Monthly Household Consumption in Jordanian Dinars 166 (JD) in Palestine by Commodities, Service Groups and Region, 2011 167
168 Gaza Strip West Bank Palestine
Commodities and Service Groups
04.4 10.4 ,294 Total Food Consumption
14.4 11.4 4494 Total Non-Food Consumption
4,, 4,, 4,, Total Consumption
Differences in these results compared with previously published is due to approximation 169 170
171

23
Individual Poverty Rates According to Household Consumption in 172 Palestine by Region, 2011 173
Deep Poverty Poverty Severity Poverty Gap Poverty Region
449. 494 49, 429, Palestine
7.8 6.0 1.5 67.8 West Bank
16.6 1.1 5.1 18.8 Gaza Strip
174 Individual Poverty Rates According to Household Consumption in 175
Palestine by Region, 2011 176
177 178
179 Individual Poverty Rates According to Household Consumption in Palestine 180
by Locality Type, 2011 181 Deep Poverty Poverty Severity Poverty Gap Poverty
Type of
Locality
449. 494 49, 429, Palestine
61.7 1.1 1.1 11.6 Urban
7.0 6.1 1.8 65.0 Rural
61.1 1.2 7.0 12.0 Refugee Camp
182 183 184 185
25.8
17.8
38.8
0 5
10 15 20 25 30 35 40
Palestine West Bank Gaza Strip
Region
Pe
rce
nta
ge
24
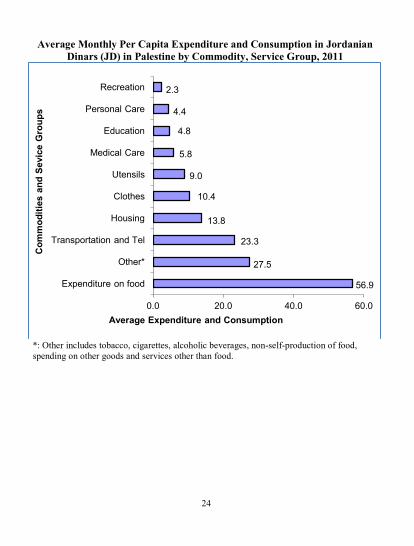
186 Average Monthly Per Capita Expenditure and Consumption in Jordanian 187
Dinars (JD) in Palestine by Commodity, Service Group, 2011 188
189 *: Other includes tobacco, cigarettes, alcoholic beverages, non-self-production of food, 190 spending on other goods and services other than food. 191
192 193 194
56.9
27.5
23.3
13.8
10.4
9.0
5.8
4.8
4.4
2.3
0.0 20.0 40.0 60.0
Expenditure on food
Other*
Transportation and Tel
Housing
Clothes
Utensils
Medical Care
Education
Personal Care
Recreation
Average Expenditure and Consumption
Co
mm
od
itie
s a
nd
Sevic
e G
rou
ps

25
Education 195
26
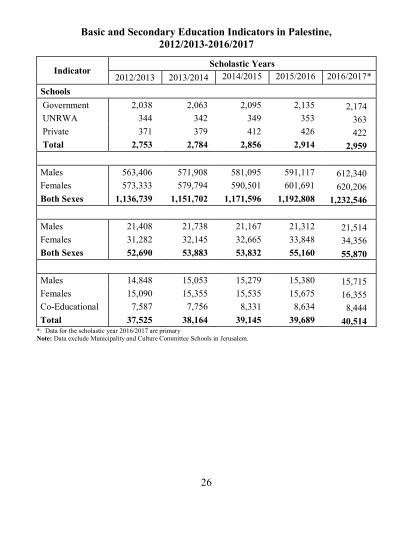
Basic and Secondary Education Indicators in Palestine, 196 2012/4,4,-4,44/4,49 197
198 Indicator
Scholastic Years
2012/2013 2013/2014 2014/2015 2015/2016 2016/2017*
Schools
Government 2,038 2,063 2,095 2,135 2,174
UNRWA 344 342 349 353 363
Private 371 379 412 426 422
Total 2,753 2,784 2,856 2,914 2,959
Males 563,406 571,908 581,095 591,117 612,340
Females 573,333 579,794 590,501 601,691 620,206
Both Sexes 1,136,739 1,151,702 1,171,596 1,192,808 1,232,546
Males 21,408 21,738 21,167 21,312 21,514
Females 31,282 32,145 32,665 33,848 34,356
Both Sexes 52,690 53,883 53,832 55,160 55,870
Males 14,848 15,053 15,279 15,380 15,715
Females 15,090 15,355 15,535 15,675 16,355
Co-Educational 7,587 7,756 8,331 8,634 8,444
Total 37,525 38,164 39,145 39,689 40,514 *: Data for the scholastic year 2016/2017 are primary 199 Note: Data exclude Municipality and Culture Committee Schools in Jerusalem. 200
201 202

27
Higher Education Indicators in Palestine, 203 2012/2013-2015/2016 204
205 Indicator
Scholastic Year
2012/2013 2013/2014 2014/2015 2015/2016
University Students*
Males 81,052 80,423 81,620 79,809
Females 120,256 123,005 127,505 124,936
Both Sexes 201,308 203,428 209,125 204,745
University Graduates*
Males 13,536 14,497 15,369 ..
Females 20,979 22,333 24,303 ..
Both Sexes 34,515 36,830 39,672 ..
Teaching Staff at Universities**
Males 5,309 4,879 5,269 5,066
Females 1,332 1,222 1,414 1,459
Both Sexes 6,641 6,101 6,683 6,525
Community College Students
Males 6,391 5,691 6,413 5,376
Females 5,882 5,432 5,857 5,907
Both Sexes 12,273 11,123 12,270 11,283
Community College Graduates
Males 1,555 1,435 1,579 .. Females 1,775 1,778 2,293 .. Both Sexes 3,330 3,213 3,872 ..
Teaching Staff at Community Colleges**
Males 111 310 338 371 Females 642 106 109 115 Both Sexes 449 416 447 486 *: University data include students and graduates of intermediate diplomas, bachelor and graduate studies in universities and
university colleges, number of university students of any scholastic year only includes regular students in the study in the first
semester of the same year and doesn't include the withdrawal and postpone students.
**: Full time and part time.
206 207
28
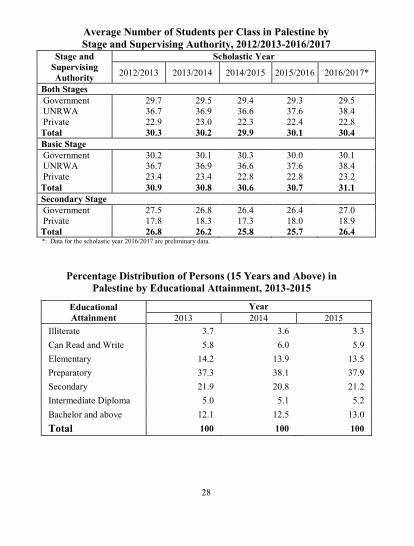
Average Number of Students per Class in Palestine by 208 Stage and Supervising Authority, 2012/2013-2016/2017 209
Stage and
Supervising
Authority
Scholastic Year
2012/2013 2013/2014 2014/2015 2015/2016 2016/2017*
Both Stages
Government 29.7 29.5 29.0 29.3 29.5
UNRWA 36.7 36.9 36.1 37.6 38.4
Private 22.9 23.0 22.1 22.4 22.8
Total 30.3 30.2 4... 30.1 30.4
Basic Stage
Government 30.2 30.1 30.3 30.0 30.1
UNRWA 36.7 36.9 36.1 37.6 38.4
Private 23.4 23.4 21.8 22.8 23.2
Total ,,9. 30.8 30.4 30.7 31.1
Secondary Stage
Government 27.5 26.8 26.0 26.4 27.0
Private 17.8 18.3 17.1 18.0 18.9
Total 26.8 26.2 22., 25.7 26.4 *: Data for the scholastic year 2016/2017 are preliminary data. 210
211 212
Percentage Distribution of Persons (15 Years and Above) in 213 Palestine by Educational Attainment, 2013-2015 214
215 Educational
Attainment Year
2013 2014 2015
Illiterate 3.7 3.6 3.3
Can Read and Write 5.8 6.0 5.9
Elementary 14.2 13.9 13.5
Preparatory 37.3 38.1 37.9
Secondary 21.9 20.8 21.2
Intermediate Diploma 5.0 5.1 5.2
Bachelor and above 12.1 12.5 13.0
Total 4,, 4,, 100 216 217 218 219
29
220 221
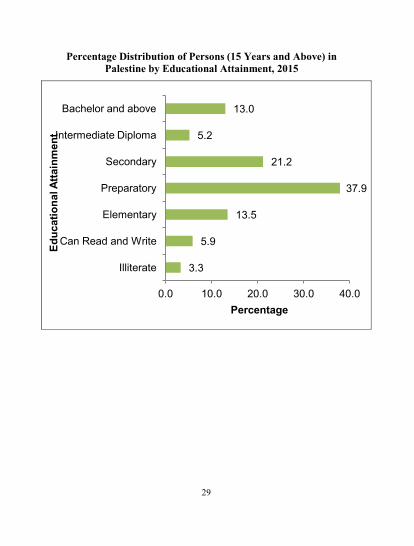
Percentage Distribution of Persons (15 Years and Above) in 222 Palestine by Educational Attainment, 2015 223
224
225 226
3.3
5.9
13.5
37.9
21.2
5.2
13.0
0.0 10.0 20.0 30.0 40.0
Illiterate
Can Read and Write
Elementary
Preparatory
Secondary
Intermediate Diploma
Bachelor and above
Percentage
Ed
uc
ati
on
al A
ttain
men
t
30
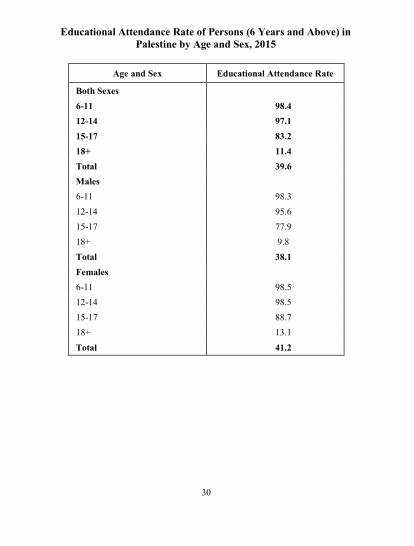
Educational Attendance Rate of Persons (6 Years and Above) in 227 Palestine by Age and Sex, 2012 228
229 Age and Sex Educational Attendance Rate
Both Sexes
6-11 98.4
12-14 97.1
15-17 83.2
18+ 11.4
Total 39.6
Males
6-11 98.3
12-14 95.6
15-17 77.9
18+ 9.8
Total 38.1
Females
6-11 98.5
12-14 98.5
15-17 88.7
18+ 13.1
Total 41.2

31
Culture230
32
231

33
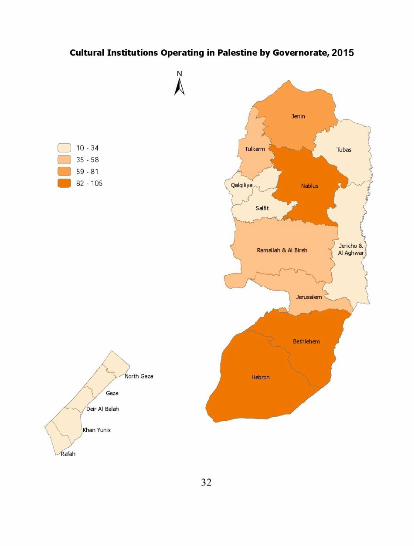
Cultural Institutions Operating in Palestine by Type and Governorate, 4,42 232 233
Total
Type of Institution
Governorate Cinema Theaters Museums
Cultural
Centers
642 3 12 31 596 Palestine
553 3 9 26 515 West Bank
72 - 2 1 69 Jenin
12 - - - 12 Tubas
47 - - 2 45 Tulkarm
94 1 3 1 89 Nablus
30 - - 1 29 Qalqiliya
13 - - - 13 Salfit
41 2 2 5 32 Ramallah
& Al-Bireh
14 - - 2 12 Jericho & Al Aghwar
56 - 2 4 50 Jerusalem
88 - - 7 81 Bethlehem
86 - - 3 83 Hebron
89 - 3 5 81 Gaza Strip
17 - - 1 16 North Gaza
33 - 2 1 30 Gaza
19 - - 2 17 Deir Al-Balah
11 - 1 1 9 Khan Yunis
9 - - - 9 Rafah
234 235 236
237

34
Main Indicators about Culture of Palestinian Households by Region, 2014 238 Indicator Palestine
West
Bank
Gaza
Strip
Percentage of Households who Have Home Library 27.0 26.6 27.7
Percentage of Households who Get Daily Newspapers 20.4 23.7 14.1
Percentage of Households who Listen to Radio Stations 60.8 57.3 67.6
Percentage of Households who Have TV Set and View
Local TV Stations 17.2 16.2 19.2
Percentage of Households who Have TV Set and View
Palestine Television 82.4 86.3 74.8
Percentage of Households who Control Programs
Viewed by Children (5-17 Years) 94.8 95.9 93.0
Percentage of Households who Have Satellite Dish
From Whom Own TV Set 99.8 99.8 99.9
Percentage of Households who Know Children’s
Friends (5-17 Years) 94.6 95.6 92.9
239 Number of Mosques in Palestine by Governorate, 2015 240
241
616
249 246 240 233 204 193
165 158 152 110 105 92 73 48 40
0
100
200
300
400
500
600
700

35
Information Society 242
36
243
37
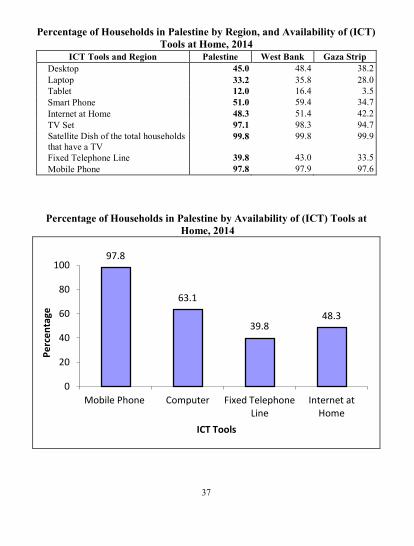
Percentage of Households in Palestine by Region, and Availability of (ICT) 244 Tools at Home, 4,44 245
ICT Tools and Region Palestine West Bank Gaza Strip
Desktop 45.0 48.4 38.2
Laptop 33.2 35.8 28.0
Tablet 12.0 16.4 3.5
Smart Phone 51.0 59.4 34.7
Internet at Home 48.3 51.4 42.2
TV Set 97.1 98.3 94.7
Satellite Dish of the total households
that have a TV
99.8 99.8 99.9
Fixed Telephone Line 39.8 43.0 33.5
Mobile Phone 97.8 97.9 97.6
246 247 248
Percentage of Households in Palestine by Availability of (ICT) Tools at 249 Home, 4,44 250
251 252
253
97.8
63.1
39.8 48.3
0
20
40
60
80
100
Mobile Phone Computer Fixed Telephone Line
Internet at Home
Pe
rce
nta
ge
ICT Tools
38
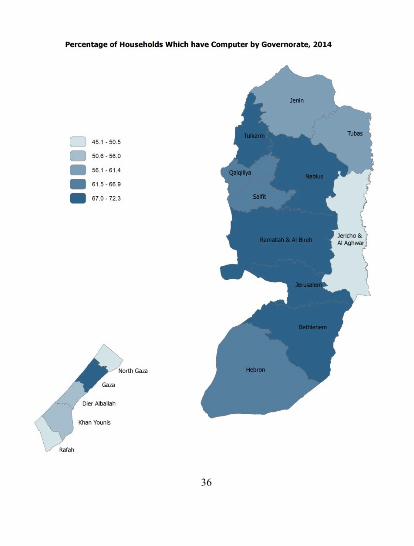
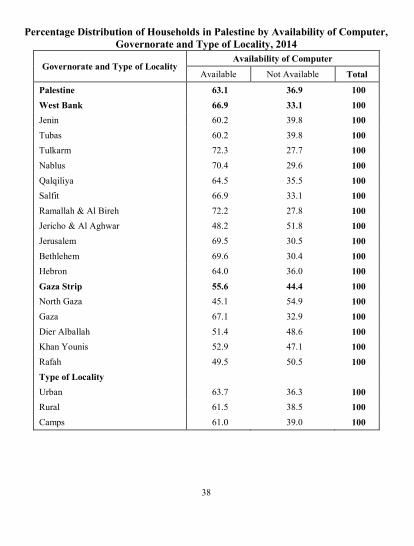
Percentage Distribution of Households in Palestine by Availability of Computer, 254 Governorate and Type of Locality, 2014 255
Governorate and Type of Locality Availability of Computer
Available Not Available Total
Palestine 63.1 36.9 100
West Bank 66.9 33.1 100
Jenin 60.2 39.8 100
Tubas 60.2 39.8 100
Tulkarm 72.3 27.7 100
Nablus 70.4 29.6 100
Qalqiliya 64.5 35.5 100
Salfit 66.9 33.1 100
Ramallah & Al Bireh 72.2 27.8 100
Jericho & Al Aghwar 48.2 51.8 100
Jerusalem 69.5 30.5 100
Bethlehem 69.6 30.4 100
Hebron 64.0 36.0 100
Gaza Strip 55.6 44.4 100
North Gaza 45.1 54.9 100
Gaza 67.1 32.9 100
Dier Alballah 51.4 48.6 100
Khan Younis 52.9 47.1 100
Rafah 49.5 50.5 100
Type of Locality
Urban 63.7 36.3 100
Rural 61.5 38.5 100
Camps 61.0 39.0 100
256 257
39
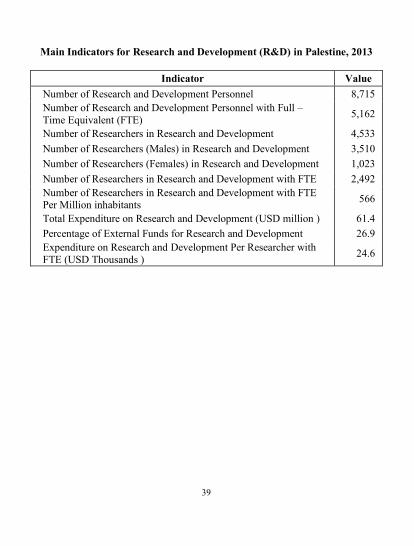
258 Main Indicators for Research and Development (R&D) in Palestine, 2013 259
260 Value Indicator
8,715 Number of Research and Development Personnel
5,162 Number of Research and Development Personnel with Full –
Time Equivalent (FTE)
4,533 Number of Researchers in Research and Development
3,510 Number of Researchers (Males) in Research and Development
1,023 Number of Researchers (Females) in Research and Development
2,492 Number of Researchers in Research and Development with FTE
566 Number of Researchers in Research and Development with FTE Per Million inhabitants
61.4 Total Expenditure on Research and Development (USD million )
26.9 Percentage of External Funds for Research and Development
24.6 Expenditure on Research and Development Per Researcher with
FTE (USD Thousands )
261
262

40
Health 263
41
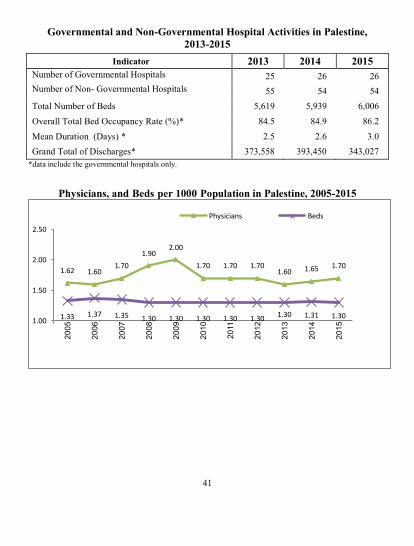
Governmental and Non-Governmental Hospital Activities in Palestine,
2013-2015
Indicator 2013 2014 2015 Number of Governmental Hospitals 25 26 26
Number of Non- Governmental Hospitals 55 54 54
Total Number of Beds 5,619 5,939 6,006
Overall Total Bed Occupancy Rate (%)* 84.5 80.5 86.2
Mean Duration (Days) * 2.5 1.1 3.0
Grand Total of Discharges* 1717228 1517024 343,027
*data include the governmental hospitals only.
Physicians, and Beds per 1000 Population in Palestine, 2005-2015
1.62 1.60 1.70
1.90 2.00
1.70 1.70 1.70 1.60 1.65 1.70
1.33 1.37 1.35 1.30 1.30 1.30 1.30 1.30 1.30 1.31 1.30 1.00
1.50
2.00
2.50
20
05
20
06
20
07
20
08
20
09
20
10
20
11
20
12
20
13
20
14
20
15
Physicians Beds

42
Security and Justice
43
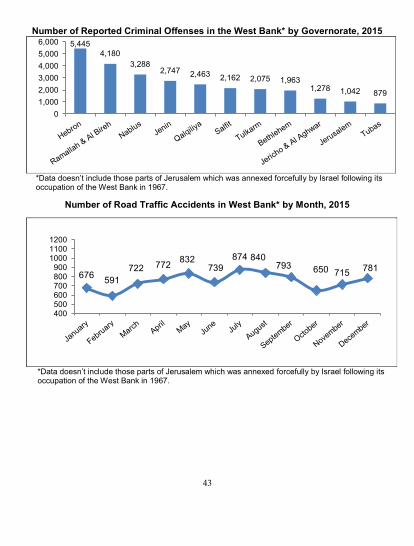
Number of Reported Criminal Offenses in the West Bank* by Governorate, 2015
*Data doesn’t include those parts of Jerusalem which was annexed forcefully by Israel following its occupation of the West Bank in 1967.
Number of Road Traffic Accidents in West Bank* by Month, 2015
*Data doesn’t include those parts of Jerusalem which was annexed forcefully by Israel following its occupation of the West Bank in 1967.
5,445
4,180
3,288 2,747 2,463 2,162 2,075 1,963
1,278 1,042 879
0
1,000
2,000
3,000
4,000
5,000
6,000
676 591
722 772 832
739
874 840 793 650 715
781
400 500 600 700 800 900
1000 1100 1200
44
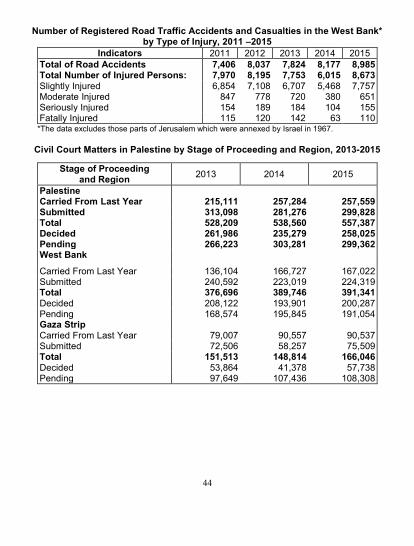
Number of Registered Road Traffic Accidents and Casualties in the West Bank* by Type of Injury, 2011 –2015
Indicators 2011 2012 2013 2014 2015
Total of Road Accidents 60407 700,6 60714 70266 8,985 Total Number of Injured Persons: 60960 70298 6068, 6,015 8,673 Slightly Injured 65854 75108 65707 5,468 7,757 Moderate Injured 847 778 720 380 651 Seriously Injured 154 189 184 104 155 Fatally Injured 115 120 142 63 110
*The data excludes those parts of Jerusalem which were annexed by Israel in 1967.
Civil Court Matters in Palestine by Stage of Proceeding and Region, 2013-2015
2015 2014 2013 Stage of Proceeding
and Region Palestine
257,559 186,174 215,111 Carried From Last Year 299,828 172,167 313,098 Submitted 557,387 8,7,870 528,209 Total 258,025 1,8,169 261,986 Decided 299,362 ,0,,172 266,223 Pending
West Bank
167,022 166,727 136,104 Carried From Last Year 224,319 223,019 240,592 Submitted 391,341 ,79,647 376,696 Total
200,287 193,901 208,122 Decided 191,054 195,845 168,574 Pending
Gaza Strip 90,537 90,557 79,007 Carried From Last Year 75,509 58,257 72,506 Submitted
166,046 247,724 151,513 Total 57,738 41,378 53,864 Decided
108,308 107,436 97,649 Pending
45
International Investment
Position
46
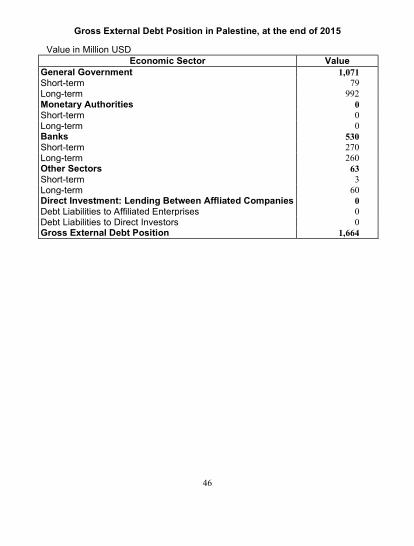
Gross External Debt Position in Palestine, at the end of 2015
Value in Million USD Value Economic Sector
48,94 General Government 79 Short-term
992 Long-term 0 Monetary Authorities 0 Short-term 0 Long-term
530 Banks 270 Short-term 260 Long-term
63 Other Sectors 3 Short-term
60 Long-term 0 Direct Investment: Lending Between Affliated Companies 0 Debt Liabilities to Affiliated Enterprises 0 Debt Liabilities to Direct Investors
48444 Gross External Debt Position
47
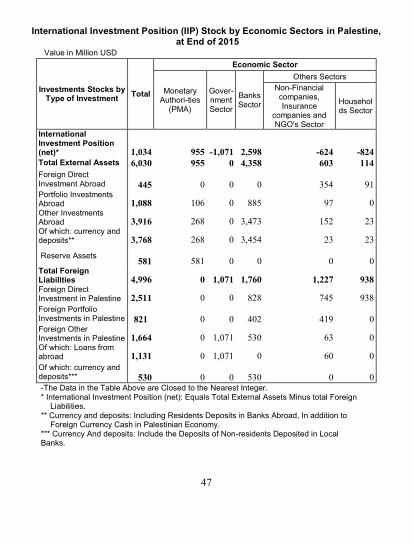
International Investment Position (IIP) Stock by Economic Sectors in Palestine, 1 at End of 2015 2
Value in Million USD
Investments Stocks by Type of Investment
Total
Economic Sector
Monetary Authori-ties
(PMA)
Gover-nment Sector
Banks Sector
Others Sectors
Non-Financial companies, Insurance
companies and NGO's Sector
Households Sector
International Investment Position (net)*
48,,4 955 48,94- 482., -624 -824 Total External Assets 48,,, 955 0 48,2, 603 114
Foreign Direct Investment Abroad
445 0 0 0 354 91 Portfolio Investments Abroad 48,,, 106 0 885 97 0 Other Investments Abroad ,8.44 268 0 17071 152 23 Of which: currency and deposits** ,894, 268 0 17020 23 23
Reserve Assets
581 581 0 0 0 0 Total Foreign Liabilities 48..4 0 48,94 4894, 48449 938 Foreign Direct Investment in Palestine 48244 0 0 828 745 938
Foreign Portfolio Investments in Palestine
821 0 0 402 419 0 Foreign Other Investments in Palestine 48444 0 67476 530 63 0 Of which: Loans from abroad 484,4 0 67476 0 60 0
Of which: currency and deposits***
530 0 0 530 0 0 -The Data in the Table Above are Closed to the Nearest Integer. * International Investment Position (net): Equals Total External Assets Minus total Foreign
Liabilities. ** Currency and deposits: Including Residents Deposits in Banks Abroad, In addition to
Foreign Currency Cash in Palestinian Economy. *** Currency And deposits: Include the Deposits of Non-residents Deposited in Local Banks.
3
4

48
Main Indicators of Foreign Investment Survey of Resident Enterprises in Palestine 5 (stocks) at end 2015 6
(Value in million USD)
Indicator Stock 2015 Percentage
%
Total Assets* 5,916 100
Stocks of Foreign Direct Investment 354 6.0
Stocks of Portfolio Investments 1,088 18.4
of which: Equity securities 113
of which: Debt securities 975
Stocks of Other Investments: 3,893 65.8
of which: Trade credits 1
of which: Loans 147
of which: Currency and deposits 3,745
of which: Other Assets 0
Stocks of Reserves Assets 581 9.8
Total Liabilities** 2,987 100
Stocks of Foreign Direct Investment 1,573 52.7
Stocks of Portfolio Investments 821 27.5
of which: Equity securities 821
of which: Debt securities 0
Stocks of Other Investments: 593 19.8
of which: Trade credits 3
of which: Loans 60
of which: Currency and deposits 530
of which: Other Liabilities 0
* Assets are the investments abroad of Resident enterprises in Palestine
** Liabilities are the foreign investments in Resident enterprises in Palestine
7
8
9
10
11 12
13
49
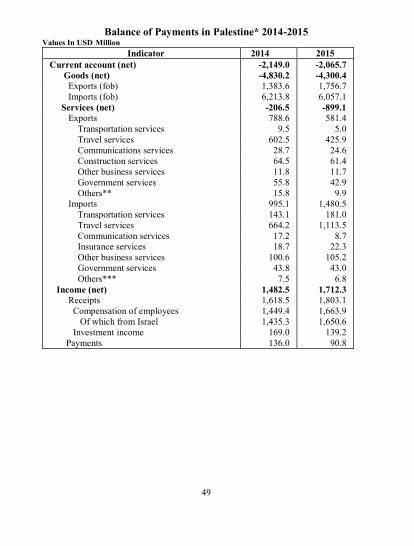
Balance of Payments in Palestine* 2014-2015 14 Values In USD Million 15
Indicator 2014 2015
Current account (net) -2,149.0 -2,065.7
Goods (net) -4,830.2 -4,300.4
Exports (fob) 1,383.6 1,756.7
Imports (fob) 6,213.8 6,057.1
Services (net) -206.5 -899.1
Exports 788.6 581.4
Transportation services 9.5 5.0
Travel services 602.5 425.9
Communications services 28.7 24.6
Construction services 64.5 61.4
Other business services 11.8 11.7
Government services 55.8 42.9
Others** 15.8 9.9
Imports 995.1 1,480.5
Transportation services 143.1 181.0
Travel services 664.2 1,113.5
Communication services 17.2 8.7
Insurance services 18.7 22.3
Other business services 100.6 105.2
Government services 43.8 43.0
Others*** 7.5 6.8
Income (net) 1,482.5 1,712.3
Receipts 1,618.5 1,803.1
Compensation of employees 1,449.4 1,663.9
Of which from Israel 1,435.3 1,650.6
Investment income 169.0 139.2
Payments 136.0 90.8
16
17
50
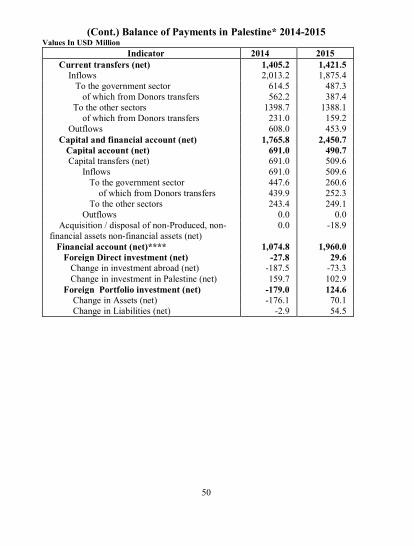
(Cont.) Balance of Payments in Palestine* 2014-2015 18 Values In USD Million 19
Indicator 2014 2015
Current transfers (net) 1,405.2 1,421.5
Inflows 2,013.2 1,875.4
To the government sector 614.5 487.3
of which from Donors transfers 562.2 387.4
To the other sectors 1398.7 1388.1
of which from Donors transfers 231.0 159.2
Outflows 608.0 453.9
Capital and financial account (net) 1,765.8 2,450.7
Capital account (net) 691.0 490.7
Capital transfers (net) 691.0 509.6
Inflows 691.0 509.6
To the government sector 447.6 260.6
of which from Donors transfers 439.9 252.3
To the other sectors 243.4 249.1
Outflows 0.0 0.0
Acquisition / disposal of non-Produced, non-
financial assets non-financial assets (net)
0.0 -18.9
Financial account (net)**** 1,074.8 1,960.0
Foreign Direct investment (net) -27.8 29.6
Change in investment abroad (net) -187.5 -73.3
Change in investment in Palestine (net) 159.7 102.9
Foreign Portfolio investment (net) -179.0 124.6
Change in Assets (net) -176.1 70.1
Change in Liabilities (net) -2.9 54.5
20
21
51
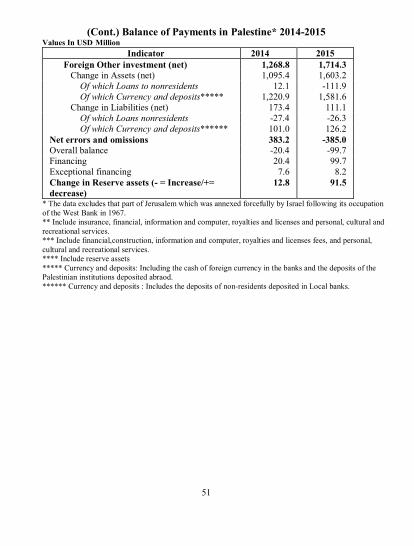
(Cont.) Balance of Payments in Palestine* 2014-2015 22 Values In USD Million 23
Indicator 2014 2015
Foreign Other investment (net) 1,268.8 1,714.3
Change in Assets (net) 1,095.4 1,603.2
Of which Loans to nonresidents 12.1 -111.9
Of which Currency and deposits***** 1,220.9 1,581.6
Change in Liabilities (net) 173.4 111.1
Of which Loans nonresidents -27.4 -26.3
Of which Currency and deposits****** 101.0 126.2
Net errors and omissions 383.2 -385.0
Overall balance -20.4 -99.7
Financing 20.4 99.7
Exceptional financing 7.6 8.2
Change in Reserve assets (- = Increase/+=
decrease)
12.8 91.5
* The data excludes that part of Jerusalem which was annexed forcefully by Israel following its occupation 24 of the West Bank in 1967. 25 ** Include insurance, financial, information and computer, royalties and licenses and personal, cultural and 26 recreational services. 27 *** Include financial,construction, information and computer, royalties and licenses fees, and personal, 28 cultural and recreational services. 29 **** Include reserve assets 30 ***** Currency and deposits: Including the cash of foreign currency in the banks and the deposits of the 31 Palestinian institutions deposited abraod. 32 ****** Currency and deposits : Includes the deposits of non-residents deposited in Local banks. 33

52
Establishments 34
53
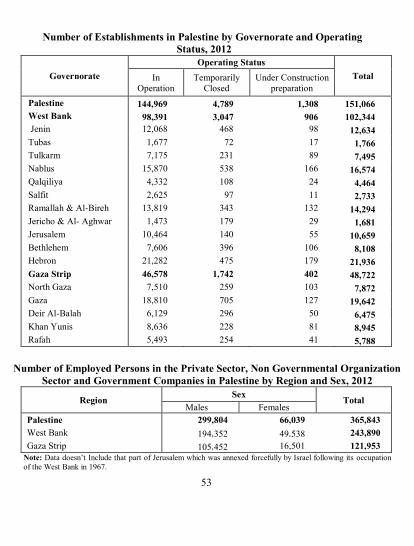
Number of Establishments in Palestine by Governorate and Operating 35 Status, 2012 36
Governorate
Operating Status
Total In
Operation
Temporarily
Closed
Under Construction
preparation
Palestine 144,969 4,789 1,308 151,066
West Bank 98,391 3,047 906 102,344
Jenin 12,068 468 98 12,634
Tubas 1,677 72 17 1,766
Tulkarm 7,175 231 89 7,495
Nablus 15,870 538 166 16,574
Qalqiliya 4,332 108 24 4,464
Salfit 2,625 97 11 2,733
Ramallah & Al-Bireh 13,819 343 132 14,294
Jericho & Al- Aghwar 1,473 179 29 1,681
Jerusalem 10,464 140 55 10,659
Bethlehem 7,606 396 106 8,108
Hebron 21,282 475 179 21,936
Gaza Strip 46,578 1,742 402 48,722
North Gaza 7,510 259 103 7,872
Gaza 18,810 705 127 19,642
Deir Al-Balah 6,129 296 50 6,475
Khan Yunis 8,636 228 81 8,945
Rafah 5,493 254 41 5,788 37 38
Number of Employed Persons in the Private Sector, Non Governmental Organization 39 Sector and Government Companies in Palestine by Region and Sex, 2012 40
Region Sex
Total Males Females
Palestine 299,804 66,039 365,843
West Bank 650,121 05,218 243,890
Gaza Strip 642,021 617246 121,953
Note: Data doesn’t Include that part of Jerusalem which was annexed forcefully by Israel following its occupation 41 of the West Bank in 1967. 42
43
54
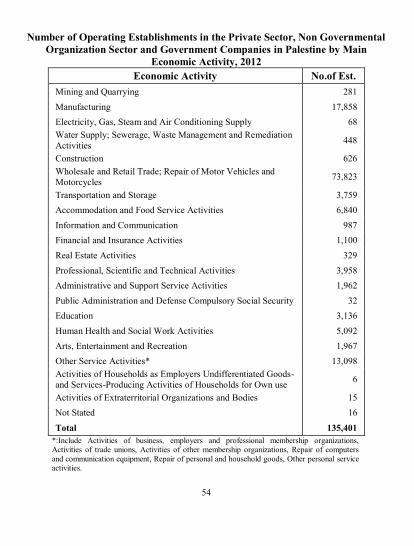
Number of Operating Establishments in the Private Sector, Non Governmental 44 Organization Sector and Government Companies in Palestine by Main 45
Economic Activity, 2012 46 No.of Est. Economic Activity
281 Mining and Quarrying
17,858 Manufacturing
68 Electricity, Gas, Steam and Air Conditioning Supply
448 Water Supply; Sewerage, Waste Management and Remediation
Activities
626 Construction
73,823 Wholesale and Retail Trade; Repair of Motor Vehicles and
Motorcycles
3,759 Transportation and Storage
6,840 Accommodation and Food Service Activities
987 Information and Communication
1,100 Financial and Insurance Activities
329 Real Estate Activities
3,958 Professional, Scientific and Technical Activities
1,962 Administrative and Support Service Activities
32 Public Administration and Defense Compulsory Social Security
3,136 Education
5,092 Human Health and Social Work Activities
1,967 Arts, Entertainment and Recreation
13,098 Other Service Activities*
6 Activities of Households as Employers Undifferentiated Goods-
and Services-Producing Activities of Households for Own use
15 Activities of Extraterritorial Organizations and Bodies
16 Not Stated
135,401 Total
*:Include Activities of business, employers and professional membership organizations, 47 Activities of trade unions, Activities of other membership organizations, Repair of computers 48 and communication equipment, Repair of personal and household goods, Other personal service 49 activities. 50 51
55
National Accounts 52

56
GDP by Economic Activity in Palestine* at Constant Prices for 53 the years 4,44, 2012 54
55 Values In USD Million 56
Economic Sector Year
2014 2015
Agriculture and Fishing 286.4 265.7
Mining, Manufacturing, Electricity and Water Supply 1,105.4 1,041.9
Construction 547.3 567.7
Wholesale and Retail Trade, Repair of Motor Vehicles
and Motorcycles 1,319.9 1,410.2
Transportation and Storage 129.7 157.1
Financial and Insurance Activities 270.3 284.7
Information and Communications 436.9 441.8
Services 1,549.6 1,566.5
Public Administration and Defense 971.4 987.9
Households with Employed Persons 4.0 4.2
Other** 842.5 556.1
Gross Domestic Product 7,463.4 7,719.3
57 *:Data doesn’t Include that part of Jerusalem which was annexed forcefully by Israel 58 following its occupation of the West Bank in 1967. 59 **:Other includes custom duties and net VAT on imports minus financial 60 intermediation services indirectly measured. 61 Note: 2004 is the base year. 62 63

57
Major National Account Indicators in Palestine* at Constant 64 Prices, 2012 65
66 Indicator Palestine West Bank Gaza Strip
Gross Domestic Product (GDP) (USD Million) 77765.1 27541.6 67861.1
GDP Per Capita (USD) 67700.2 17117.1 551.1
Gross National Income (GNI) (USD Million) 87200.1 17711.7 67814.2
GNI Per Capita (USD) 67514.5 17286.4 67444.1
Gross Disposable Income (GDI) (USD Million) 57060.1 77111.0 17688.1
GDI Per Capita (USD) 17617.1 17770.4 67141.1
Final Consumption Expenditures (USD Million) 57125.4 17785.4 17274.4
Gross Capital Formation (USD Million) 67205.6 67174.8 616.7-
Net Export of Goods and Services (USD
Million) 17611.7- 17211.2- 140.1 -
Saving (Million USD) 22.1 017.0 186.8- *: Data doesn’t Include that part of Jerusalem which was annexed forcefully by Israel following its 67 occupation of the West Bank in 1967. 68 **: The difference between GDP and sum of final consumption expenditures, gross capital formation 69 and net export of goods and services refers to net errors and omissions. 70 Note: 2004 is the base year. 71 72
58
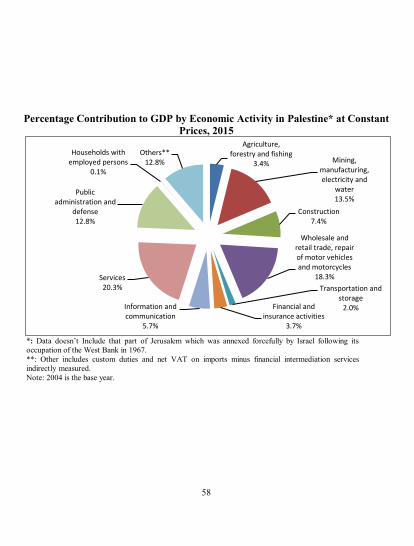
Percentage Contribution to GDP by Economic Activity in Palestine* at Constant 73 Prices, 2015 74
75 *: Data doesn’t Include that part of Jerusalem which was annexed forcefully by Israel following its 76 occupation of the West Bank in 1967. 77 **: Other includes custom duties and net VAT on imports minus financial intermediation services 78 indirectly measured. 79 Note: 2004 is the base year. 80 81
82
Agriculture, forestry and fishing
3.4% Mining, manufacturing, electricity and
water 13.5%
Construction 7.4%
Wholesale and retail trade, repair of motor vehicles and motorcycles
18.3%
Transportation and storage
2.0% Financial and insurance activities
3.7%
Information and communication
5.7%
Services 20.3%
Public administration and
defense 12.8%
Households with employed persons
0.1%
Others** 12.8%
59
Consumer Price Index 83
60
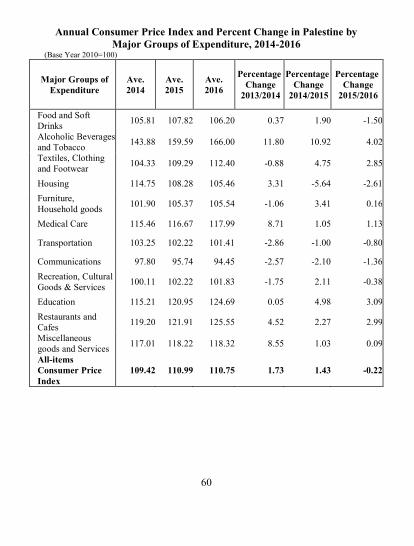
Annual Consumer Price Index and Percent Change in Palestine by 84 Major Groups of Expenditure, 2014-2016 85
(Base Year 2010=100) 86
Major Groups of
Expenditure
Ave.
2014
Ave.
2015
Ave.
2016
Percentage
Change
2013/2014
Percentage
Change
2014/2015
Percentage
Change
2015/2016
Food and Soft
Drinks 105.81 107.82 106.20 0.37 1.90 -1.50
Alcoholic Beverages
and Tobacco 143.88 159.59 166.00 11.80 10.92 4.02
Textiles, Clothing
and Footwear 104.33 109.29 112.40 -0.88 4.75 2.85
Housing 114.75 108.28 105.46 3.31 -5.64 -2.61
Furniture,
Household goods 101.90 105.37 105.54 -1.06 3.41 0.16
Medical Care 115.46 116.67 117.99 8.71 1.05 1.13
Transportation 103.25 102.22 101.41 -2.86 -1.00 -0.80
Communications 97.80 95.74 94.45 -2.57 -2.10 -1.36
Recreation, Cultural
Goods & Services 100.11 102.22 101.83 -1.75 2.11 -0.38
Education 115.21 120.95 124.69 0.05 4.98 3.09
Restaurants and
Cafes 119.20 121.91 125.55 4.52 2.27 2.99
Miscellaneous
goods and Services 117.01 118.22 118.32 8.55 1.03 0.09
All-items
Consumer Price
Index
109.42 110.99 110.75 1.73 1.43 -0.22
87 88 89
90

61
Registered Foreign Trade 91
62
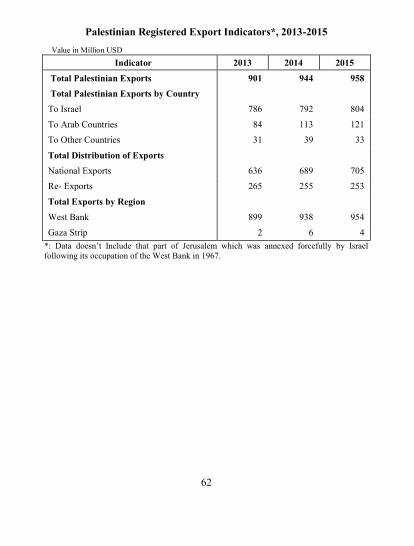
Palestinian Registered Export Indicators*, 2013-2015 92 93 Value in Million USD 94
Indicator 2013 2014 2015
Total Palestinian Exports .,4 944 958 Total Palestinian Exports by Country
To Israel 781 792 804 To Arab Countries 84 113 121 To Other Countries 31 39 33 Total Distribution of Exports National Exports 636 689 705 Re- Exports 265 255 253 Total Exports by Region West Bank 899 938 954 Gaza Strip 2 6 4
*: Data doesn’t Include that part of Jerusalem which was annexed forcefully by Israel
following its occupation of the West Bank in 1967.
63
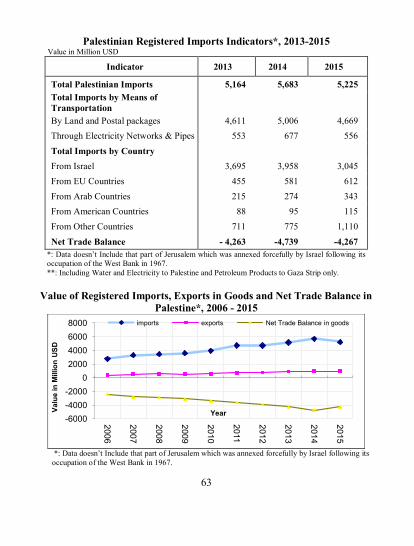
Palestinian Registered Imports Indicators*, 2013-2015 95 Value in Million USD 96
Indicator 2013 2014 2015
Total Palestinian Imports 5,164 5,683 5,225
Total Imports by Means of
Transportation
By Land and Postal packages 4,611 5,006 4,669
Through Electricity Networks & Pipes 221 677 556
Total Imports by Country
From Israel 3,695 3,958 3,045
From EU Countries 455 581 612
From Arab Countries 215 274 343
From American Countries 88 95 115
From Other Countries 711 775 1,110
Net Trade Balance - 4,263 -4,739 -4,267
*: Data doesn’t Include that part of Jerusalem which was annexed forcefully by Israel following its
occupation of the West Bank in 1967.
**: Including Water and Electricity to Palestine and Petroleum Products to Gaza Strip only.
97 Value of Registered Imports, Exports in Goods and Net Trade Balance in 98
Palestine*, 2006 - 2015 99
100 *: Data doesn’t Include that part of Jerusalem which was annexed forcefully by Israel following its 101 occupation of the West Bank in 1967. 102
103
-6000
-4000
-2000
0
2000
4000
6000
8000
2006
2007
2008
2009
2010
2011
2012
2013
2014
2015
Va
lue
in
Millio
n U
SD
Year
imports exports Net Trade Balance in goods
64
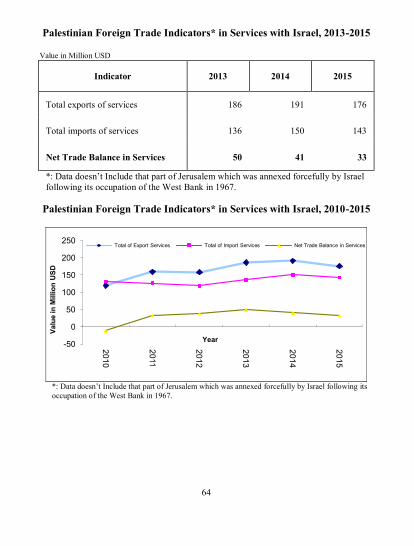
Palestinian Foreign Trade Indicators* in Services with Israel, 2013-2015 104 105
Value in Million USD 106
Indicator 2013 2014 2015
Total exports of services 186 191 176
Total imports of services 136 150 143
Net Trade Balance in Services 50 41 33
*: Data doesn’t Include that part of Jerusalem which was annexed forcefully by Israel
following its occupation of the West Bank in 1967.
107 Palestinian Foreign Trade Indicators* in Services with Israel, 2010-2015 108
109
110 *: Data doesn’t Include that part of Jerusalem which was annexed forcefully by Israel following its 111 occupation of the West Bank in 1967. 112
113 114 115 116 117 118
-50
0
50
100
150
200
250
20
10
20
11
20
12
20
13
20
14
20
15
Va
lue
in
Millio
n U
SD
Year
Total of Export Services Total of Import Services Net Trade Balance in Services
65
119
Building Licenses 120
66
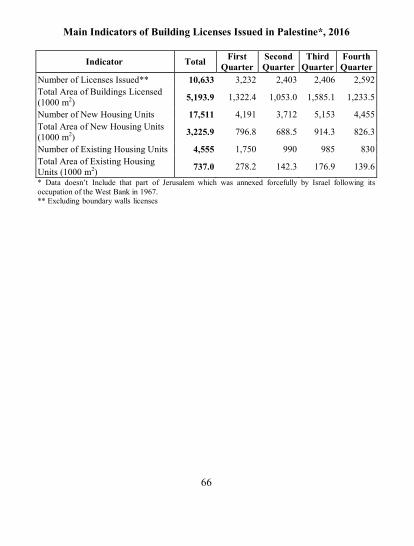
Main Indicators of Building Licenses Issued in Palestine*, 2016 121 122
Indicator Total First
Quarter Second
Quarter Third
Quarter Fourth
Quarter
Number of Licenses Issued** 10,633 3,232 2,403 2,406 2,592
Total Area of Buildings Licensed
(1000 m2) 5,193.9 1,322.4 1,053.0 1,585.1 1,233.5
Number of New Housing Units 17,511 4,191 3,712 5,153 4,455
Total Area of New Housing Units
(1000 m2) 3,225.9 796.8 688.5 914.3 826.3
Number of Existing Housing Units 4,555 1,750 990 985 830
Total Area of Existing Housing
Units (1000 m2) 737.0 278.2 142.3 176.9 139.6
* Data doesn’t Include that part of Jerusalem which was annexed forcefully by Israel following its 123 occupation of the West Bank in 1967. 124 ** Excluding boundary walls licenses 125
126 127
67
Transportation 128
& 129
Communications 130

68
Main Indicators of Transportation and Communications in 131 Palestine*, 2013-2015 132
133
Indicator 2013 2014 2015
Number of Licensed Road Vehicles **144,244
**
**162,512 6727668**
Number of Items Received by Mail **445,926
**
**439,535
**
0057114**
Number of Items Dispatched by Mail **127,953
**
**137,599
**
6667720**
Number of Cellular Phone Subscribers 3,267,819 3,290,774 172267160 Number of Landline Telephones 403,025 403,118 0417001
Average Number of Calls Per Month (in million)*** 641.1 - 54.2
*: Data doesn’t Include that part of Jerusalem which was annexed forcefully by Israel following 134 its occupation of the West Bank in 1967. 135
**: Data doesn’t include Gaza strip. 136 ***: Average monthly number of calls doesn’t include international calls. 137
138
139
140
141
142
143
144
145

69
Finance & Insurance 146
70
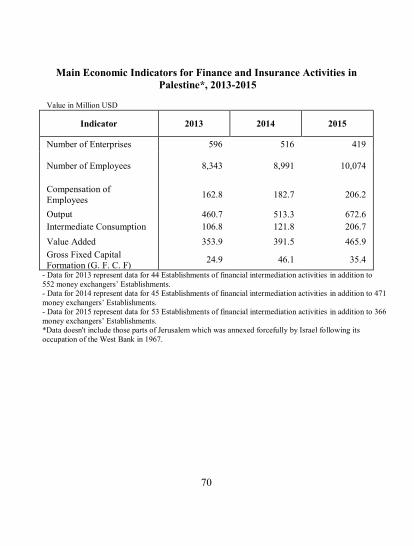
Main Economic Indicators for Finance and Insurance Activities in 147 Palestine*, 2013-2015 148
149
Value in Million USD
2015 2014 2013 Indicator
065 261 596 Number of Enterprises
10,074 8,991 8,101 Number of Employees
206.2 182.7 611.8 Compensation of
Employees
171.1 513.3 014.7 Output
141.7 121.8 641.8 Intermediate Consumption
012.5 391.5 121.5 Value Added
12.0 46.1 10.5 Gross Fixed Capital
Formation (G. F. C. F) - Data for 2013 represent data for 44 Establishments of financial intermediation activities in addition to 150 552 money exchangers’ Establishments. 151 - Data for 2014 represent data for 45 Establishments of financial intermediation activities in addition to 471 152 money exchangers’ Establishments. 153 - Data for 2015 represent data for 53 Establishments of financial intermediation activities in addition to 366 154 money exchangers’ Establishments. 155 *Data doesn't include those parts of Jerusalem which was annexed forcefully by Israel following its 156 occupation of the West Bank in 1967. 157
158
159
160

71
161
162
Other Economic Sectors 163
164
165 166 167
168
72
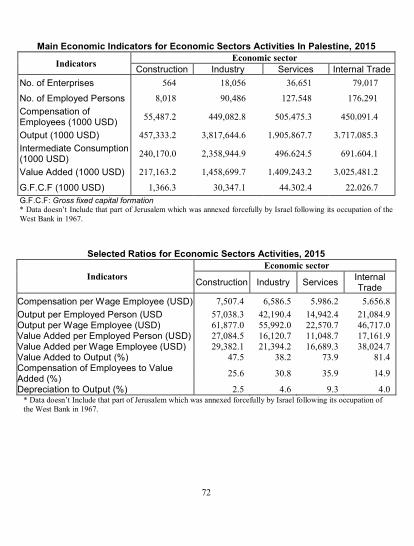
Main Economic Indicators for Economic Sectors Activities In Palestine, 1025 169 Economic sector
Indicators Internal Trade Services Industry Construction
75,467 11,126 18,056 564 No. of Enterprises
671,156 617,208 90,486 8,018 No. of Employed Persons
024,456.0 242,072.1 449,082.8 55,487.2 Compensation of Employees (1000 USD)
1,767,482.1 6,542,817.7 3,817,644.6 457,333.2 Output (1000 USD)
156,140.6 051,110.2 2,358,944.9 240,170.0 Intermediate Consumption (1000 USD)
1,412,086.1 6,045,101.1 1,458,699.7 217,163.2 Value Added (1000 USD)
11,411.7 00,141.0 30,347.1 1,366.3 G.F.C.F (1000 USD)
G.F.C.F: Gross fixed capital formation * Data doesn’t Include that part of Jerusalem which was annexed forcefully by Israel following its occupation of the
West Bank in 1967.
Selected Ratios for Economic Sectors Activities, 2015 170
Indicators
Economic sector
Construction Industry Services Internal Trade
Compensation per Wage Employee (USD( 7,507.4 6,586.5 2,581.1 2,121.8
Output per Employed Person (USD 57,038.3 42,190.4 607501.0 167480.5
Output per Wage Employee (USD) 61,877.0 55,992.0 117274.7 017767.4
Value Added per Employed Person (USD) 27,084.5 16,120.7 667408.7 677616.5
Value Added per Wage Employee (USD) 29,382.1 21,394.2 617185.1 187410.7
Value Added to Output (%) 47.5 38.2 71.5 86.0
Compensation of Employees to Value Added (%)
25.6 30.8 12.5 60.5
Depreciation to Output (%) 2.5 4.6 5.1 0.4 * Data doesn’t Include that part of Jerusalem which was annexed forcefully by Israel following its occupation of 171 the West Bank in 1967. 172 173 174
175

73
Tourism 176
177
178
179
74
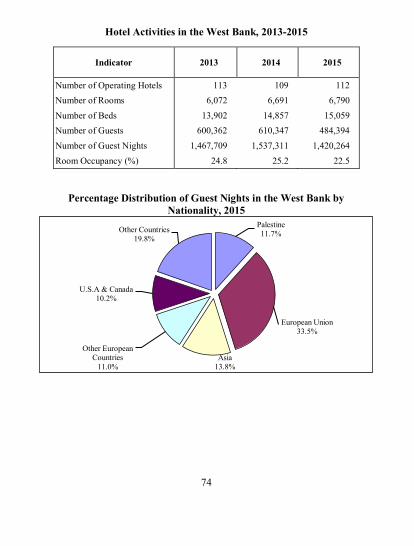
Hotel Activities in the West Bank, 2013-2015 180 181
Indicator 2013 2014 2015
Number of Operating Hotels 661 109 112
Number of Rooms 6,072 17156 6,790
Number of Beds 13,902 607827 15,059
Number of Guests 600,362 1647107 484,394
Number of Guest Nights 1,467,709 672177166 1,420,264
Room Occupancy (%) 20.8 25.2 22.5 182 183 184
Percentage Distribution of Guest Nights in the West Bank by 185 Nationality, 2015 186
187
Palestine
11.7%
European Union
33.5%
Asia
13.8%
Other European
Countries
11.0%
U.S.A & Canada
10.2%
Other Countries
19.8%

75
Agriculture 188
76
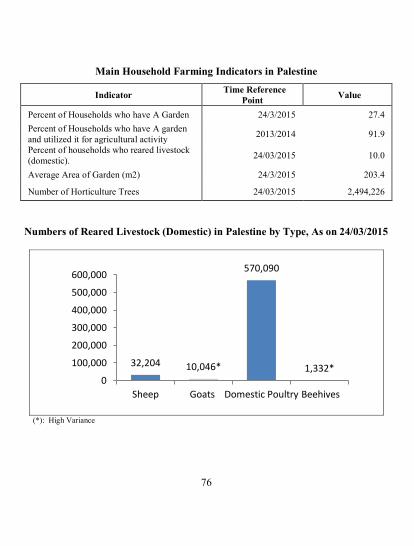
Main Household Farming Indicators in Palestine 189 190
Value Time Reference
Point Indicator
27.4 24/3/2015 Percent of Households who have A Garden
91.9 2013/2014 Percent of Households who have A garden
and utilized it for agricultural activity
10.0 24/03/2015 Percent of households who reared livestock
(domestic).
203.4 24/3/2015 Average Area of Garden (m2)
170507111 24/03/2015 Number of Horticulture Trees
191 192
Numbers of Reared Livestock (Domestic) in Palestine by Type, As on 24/03/2015 193 194
195 (*): High Variance 196
197
32,204 10,046*
570,090
1,332* 0
100,000
200,000
300,000
400,000
500,000
600,000
Sheep Goats Domestic Poultry Beehives
77
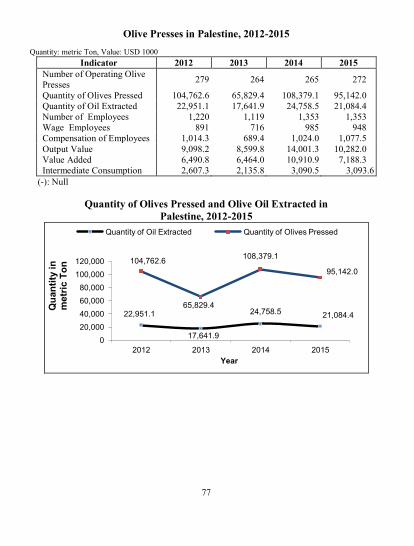
Olive Presses in Palestine, 2012-2015 198 199 Quantity: metric Ton, Value: USD 1000 200
Indicator 2012 2013 2014 2015 Number of Operating Olive
Presses 279 264 265 171
Quantity of Olives Pressed 104,762.6 65,829.4 108,379.1 527601.4
Quantity of Oil Extracted 22,951.1 17,641.9 24,758.5 167480.0
Number of Employees 1,220 1,119 1,353 67121
Wage Employees 891 716 985 508
Compensation of Employees 1,014.3 689.4 1,024.0 67477.2
Output Value 9,098.2 8,599.8 14,001.3 647181.4
Value Added 6,490.8 6,464.0 10,910.9 77688.1
Intermediate Consumption 2,607.3 2,135.8 3,090.5 3,093.6
(-): Null 201 202
Quantity of Olives Pressed and Olive Oil Extracted in 203 Palestine, 2012-2015 204
205 206
207
208
209
22,951.1
17,641.9
24,758.5 21,084.4
104,762.6
65,829.4
108,379.1
95,142.0
0
20,000
40,000
60,000
80,000
100,000
120,000
2012 2013 2014 2015
Year
Qu
an
tity
in
m
etr
ic T
on
Quantity of Oil Extracted Quantity of Olives Pressed

78
Environment 210
79
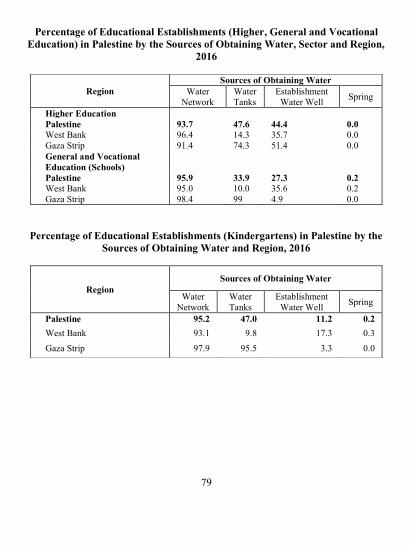
Percentage of Educational Establishments (Higher, General and Vocational 211 Education) in Palestine by the Sources of Obtaining Water, Sector and Region, 212
2016 213
214 215
Percentage of Educational Establishments (Kindergartens) in Palestine by the 216 Sources of Obtaining Water and Region, 2016 217
218 219 220 221 222 223 224 225
Region
Sources of Obtaining Water
Water
Network
Water
Tanks
Establishment
Water Well Spring
Higher Education Palestine 93.7 47.6 44.4 0.0
West Bank 96.4 14.3 35.7 0.0
Gaza Strip 91.4 74.3 51.4 0.0
General and Vocational
Education (Schools)
Palestine 95.9 33.9 27.3 0.2
West Bank 95.0 10.0 35.6 0.2
Gaza Strip 98.4 99 4.9 0.0
Region
Sources of Obtaining Water
Water
Network
Water
Tanks
Establishment
Water Well Spring
Palestine 95.2 47.0 11.2 0.2
West Bank 93.1 9.8 17.3 0.3
Gaza Strip 97.9 95.5 3.3 0.0

80
Percentage Distribution of Educational Establishments (Higher, General and 226 Vocational Education) in Palestine by Wastewater Disposal Method, Sector and 227
Region, 2016 228
229 230 231
Percentage Distribution of Educational Establishments (Kindergartens) in 232 Palestine by Wastewater Disposal Method and Region, 2016 233
234 235
Region The Main Wastewater Disposal Method
Wastewater Network
Porous Cesspit
Tight Cesspit
Others Total
Higher Education
Palestine 90.5 7.9 1.6 0.0 100
West Bank 92.9 7.1 0.0 0.0 100
Gaza Strip 88.6 8.6 2.8 0.0 100
General and Vocational
Education (Schools)
Palestine 48.1 39.4 12.3 0.2 100
West Bank 34.7 48.9 16.1 0.3 100
Gaza Strip 84.6 13.4 2.0 0.0 100
Region
Wastewater Disposal Method
Wastewater Network
Porous Cesspit
Tight Cesspit
Others Total
Palestine 58.6 37.5 3.7 0.2 100
West Bank 38.2 56.6 5.2 0.0 100
Gaza Strip 85.4 12.5 1.8 0.3 100
81
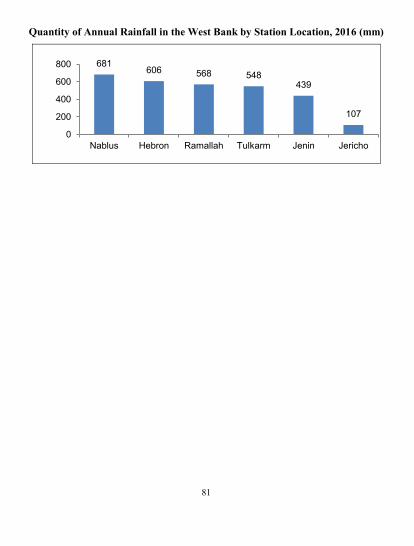
Quantity of Annual Rainfall in the West Bank by Station Location, 2016 (mm) 236 237
238 239 240 241 242
681 606 568 548
439
107
0
200
400
600
800
Nablus Hebron Ramallah Tulkarm Jenin Jericho
82
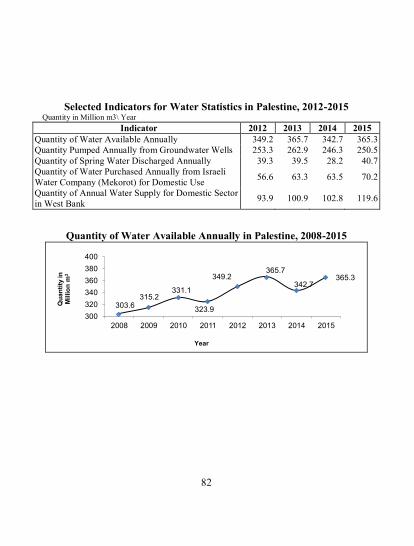
Selected Indicators for Water Statistics in Palestine, 2012-2015 243 Quantity in Million m3\ Year 244
Indicator 2012 2013 2014 2015
Quantity of Water Available Annually 349.2 365.7 342.7 365.3
Quantity Pumped Annually from Groundwater Wells 253.3 262.9 101.1 250.5
Quantity of Spring Water Discharged Annually 39.3 39.5 28.2 40.7
Quantity of Water Purchased Annually from Israeli
Water Company (Mekorot) for Domestic Use 56.6 63.3 63.5 70.2
Quantity of Annual Water Supply for Domestic Sector
in West Bank 93.9 100.9 102.8 119.6
245 Quantity of Water Available Annually in Palestine, 2008-2015 246
247 248 249
250 251
303.6 315.2
331.1
323.9
349.2 365.7
342.7 365.3
300
320
340
360
380
400
2008 2009 2010 2011 2012 2013 2014 2015
Year
Qu
an
tity
in
M
illio
n m
3
83
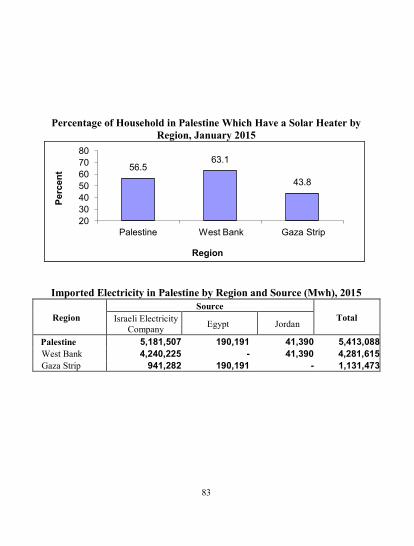
Percentage of Household in Palestine Which Have a Solar Heater by 252 Region, January 2015 253
254 255 256
Imported Electricity in Palestine by Region and Source (Mwh), 2012 257
Total
Source
Region Jordan Egypt
Israeli Electricity
Company
5,413,088 41,390 190,191 5,181,507 Palestine
4,281,615 41,390 - 4,240,225 West Bank
1,131,473 - 190,191 941,282 Gaza Strip
258 259
56.5 63.1
43.8
20
30
40
50
60
70
80
Palestine West Bank Gaza Strip
Region
Perc
en
t
84
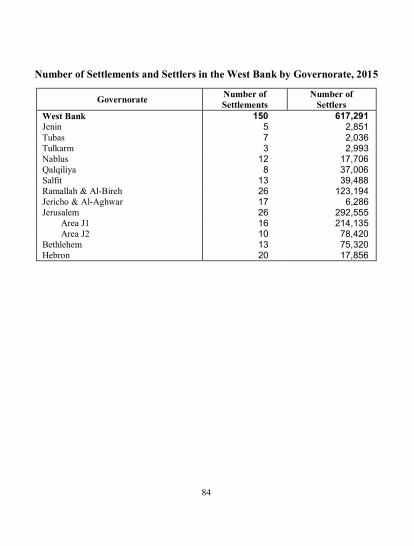
Number of Settlements and Settlers in the West Bank by Governorate, 2012 260 261
Number of
Settlers
Number of
Settlements Governorate
617,291 150 West Bank
2,851 5 Jenin
2,036 7 Tubas
2,993 3 Tulkarm
17,706 12 Nablus
37,006 8 Qalqiliya
39,488 13 Salfit
123,194 26 Ramallah & Al-Bireh
6,286 17 Jericho & Al-Aghwar
292,555 26 Jerusalem
214,135 16 Area J1
78,420 10 Area J2
75,320 13 Bethlehem
17,856 20 Hebron
262 263 264 265 266 267 268 269 270 271 272 273 274
275 276
85
Housing Conditions277

86
Percentage Distribution of Households in Palestine 278 by Housing Density (Person per Room), 2012,2013, 4,42 279
280 Housing Density (Person per Room) 2012 2013 2015
Less than 1 17.0 60.2 12.5
1.00- 1.99 51.1 46.9 46.0
2.00- 2.99 24.3 27.6 28.3
3.00+ 7.6 11.0 13.2
Total 100 100 100
Average Housing Density 1.5 1.6 1.7
281 282
Percentage Distribution of Households In Palestine by Type of Housing 283 Unit, 2015 284
285 *Other include (Independent Room, Tent and Marginal(. 286
53.7
44.6
1.1 0.6
0.0
10.0
20.0
30.0
40.0
50.0
60.0
Apartment House Villa Other*