1 Somchai Jitsuchon Thailand Development Research Institute Sustainable Growth, Regional Balance, &...
23
1 Somchai Jitsuchon Thailand Development Research Insti tute Sustainable Growth, Regional Balance, & Social Development for Poverty Reduction in Thailand NESDB-WB Bangkok, 26 October 2006 Poverty in Thailand & Improving Diagnostics
-
Upload
duane-kelley -
Category
Documents
-
view
219 -
download
2
Transcript of 1 Somchai Jitsuchon Thailand Development Research Institute Sustainable Growth, Regional Balance, &...
1
Somchai Jitsuchon Thailand Development Research Institute
Sustainable Growth, Regional Balance, & Social Development for
Poverty Reduction in ThailandNESDB-WB
Bangkok, 26 October 2006
Poverty in Thailand & Improving Diagnostic
s

Outline
1. Overview of Thailand’s Poverty
2. Poverty Policy Formulation Fundamental Changes of Policy Architects National vs. Area-based Policy
3. Poverty Diagnostics Tools Poverty Data Small Area Estimation Poverty Map

3
Thailand’s Poverty Overview

Poverty TrendThailand’s Poverty Declined Rapidly over the Past 40-50 Years
If using old definition (before 2004), head-count ratio would be only around 5%
4542
34
28
1915
1820 21
1915
11
51
45
38
33
25
1719
21 2119
16
11
0
10
20
30
40
50
60
1986 1988 1990 1992 1994 1996 1998 1999 2000 2001 2002 2004
Consumption Poverty Income Poverty

0
0.1
0.2
0.3
0.4
0.5
0.6
Gini C
oeffic
ient
But Income Inequality Remains High..One of the World’ Highest

Consequences on Tar get Groups
Destitute poor (absolute poverty) has been dwindling in nu
mber, but some pockets of chronic poverty might exist.
Relative poverty increasingly important stubborn to economic growth, if inequality persists.
began to dominate public debates/policies. More ‘poverty measur
es’ are devised for the relative poor, not the poorest.
Problems of vulnerability also increasingly important, but
still largely neglected.
Rural and urban poverty more linked than in the past, due t
o convergence of economic activities.
7
Poverty Po licy Formulation

Changes in Poverty Policy Architects
In the past national poverty policy either did not ex
ist, or was an unsubstantial part of ‘Nati onal Plan’. Poverty declined mainly thr ough growth process.
Technocrats were thus key (and sole) ar chitects of poverty policy at national lev
el. Politicians mostly influenced sectoral po
- licies, or minor area specific policies.

Changes in Poverty Policy Architects
Present Poverty policy was nationalized by the TR
- T party around the year 2 0 0 0 1 , alo ngwi t h gl obal i nt er est i n pover t y r edu ction. Pol i t i cal success of TRT par t y was p
ar t l y due to thisshi f t . ‘ National Plan’ now plays very little role,
along with its technocrat architects. Pov erty policy was basically transferred to p
oliticians’ hands. Consequently, mostpovertypoliciesar e nowmor e t ar get i ng, mor e sect or
al. Oneexcept i on i s t he uni ver sal heal t h c arescheme.

-National vs. Area based
Mostofthetime(pastor pr esent ), al l maj or pover t y pol i c iesarecent r al l y concept ual i zed and i mpl em entedbycent r al gover nment ’s bur eaucr at i c arms.
However, therehasbeenat t empt t o decent r al i zed i mpl ement ations to ‘local governments’.
Forexample, provincesaregrantedmorepower (fi nanci al and bur eaucr at i c). More room for local initiatives. But most of l ocal eff or t s i s st i l l devot ed t o car rynat i onal pover t y pol i ci es desi gned b ynat i onal pol i t i ci ans.

Consequences The current policy quickly favors the r
elative poor, rather than the absolute poor (except the universal health care
).
There is urgent need for reliable pove rty data at disaggregated areas level (
at least at provincial level).
Also urgent need for high frequency p overty data (at least annually), to sup
port the ‘Poverty Eradication within 3 years’ agenda by TRT party leader.
12
Poverty Diagnostic Tools
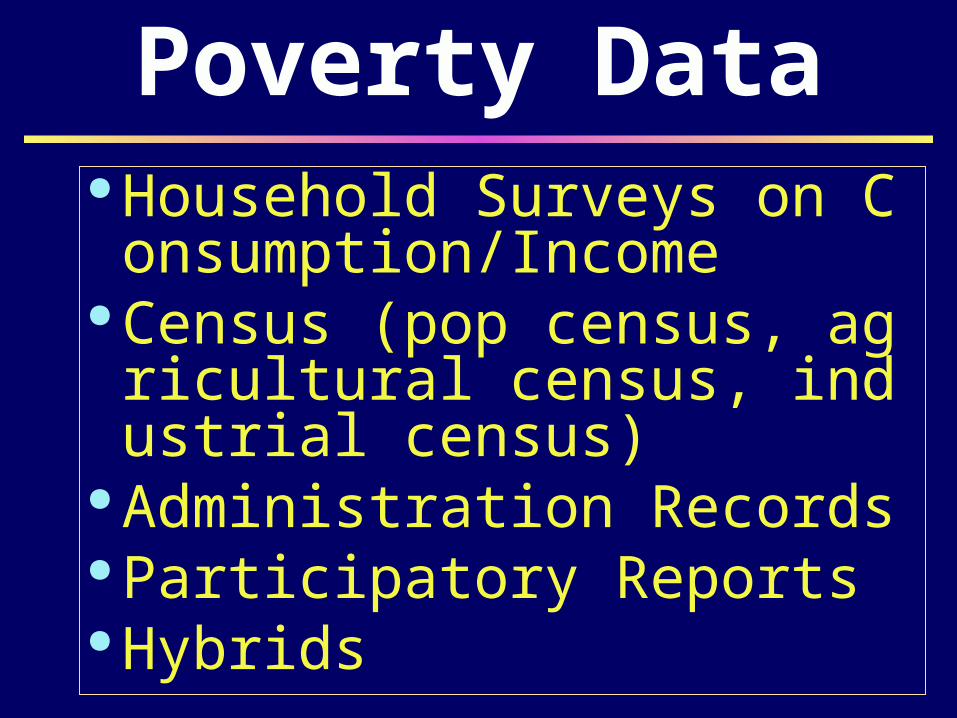
Poverty Data Household Surveys on Consumption/Income
Census (pop census, agri cultural census, industrial
census) Administration Records Participatory Reports Hybrids
Thailand’s Pov erty Data
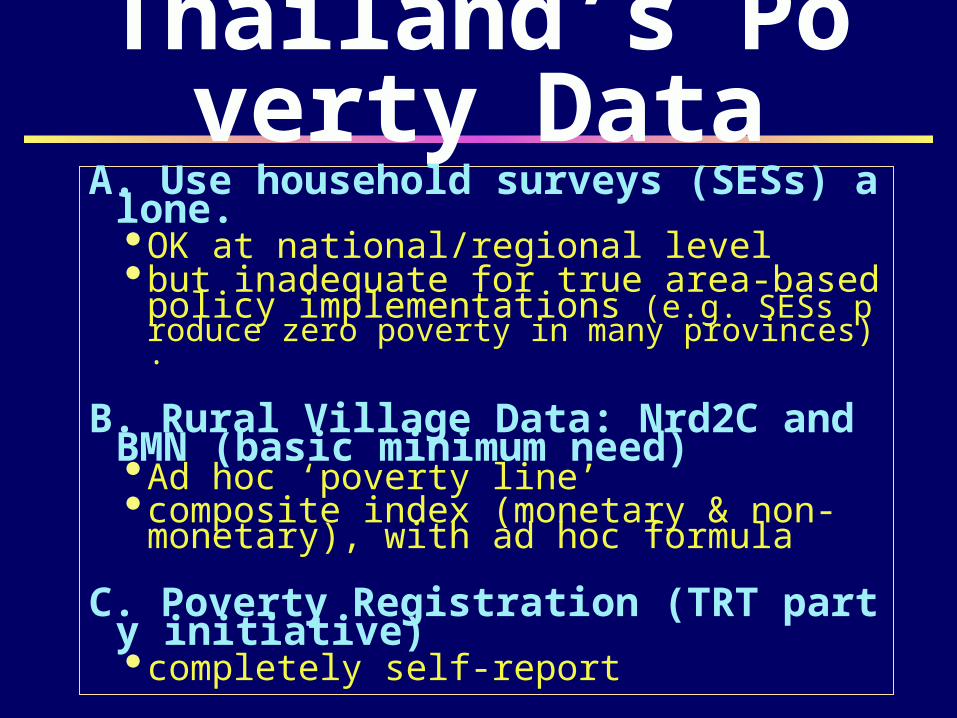
A. Use household surveys (SESs) alone. OK at national/regional level - but inadequate for true area based po licy implementations (e.g. SESs produc
e zero poverty in many provinces).
B. Rural Village Data: Nrd2C and BMN(basic minimum need)Ad hoc ‘poverty line’ composite index (monetary & non-monetary), with ad hoc formula
C. Poverty Registration (TRT part y initiative)completely self-report

- Mis targeting Proble m of
Poverty RegistrationNon-Poor Poor Total
Non-registered 82.0% 71.6% Registered 18.0% 28.4%Total 100.0% 100.0%Within Registered 89.9% 10.1% 100.0%
If not complimented by other datasources,
7 1 .6 % of poor people will be neeeeeeeee

2000Comparing SAE Ma 1 9 9 9 2 ‘
p’Nrd2C Classification
SAE Poverty Map Non-Target ornon-matched
Target Total
Non-Poor 39,781 9,511 49,292
Poor (30% up) 12,296 4,707 17,003
Total 52,077 14,218 66,295
The two maps are significantly differen t. Either (or both) may have the proble m of including the wrong villages as we
ll as excluding the right villages. Whic h one?.
SAE Poverty Map
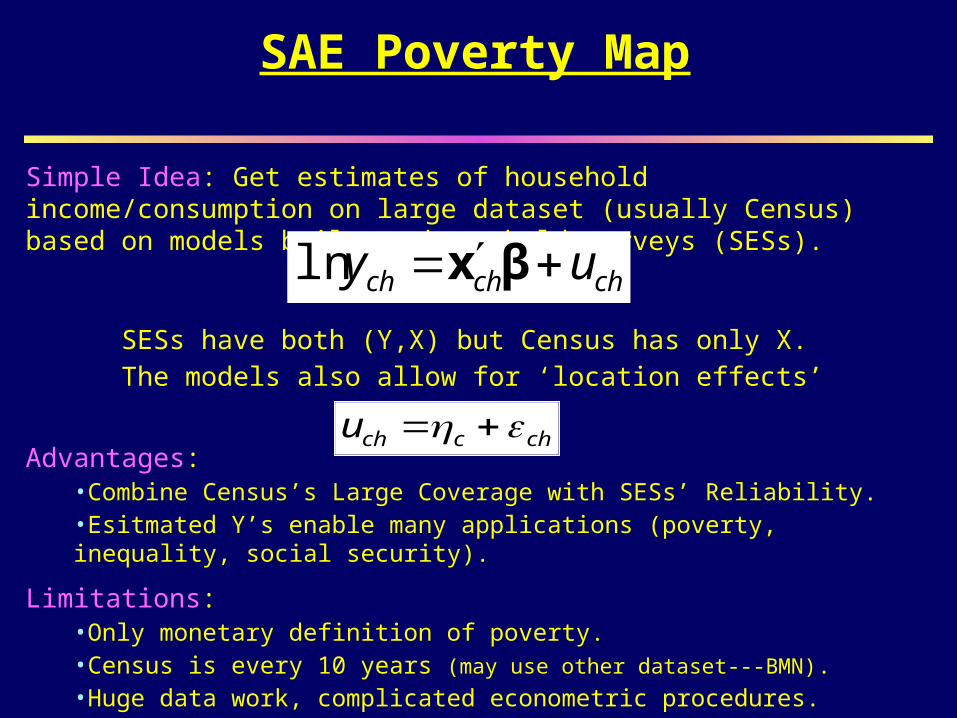
Simple Idea: Get estimates of household income/consumption on large dataset (usually Census) based on models built on household surveys (SESs).
SESs have both (Y,X) but Census has only X.The models also allow for ‘location effects’
Advantages: •Combine Census’s Large Coverage with SESs’ Reliability.•Esitmated Y’s enable many applications (poverty, inequality, social security).
Limitations: •Only monetary definition of poverty.•Census is every 10 years (may use other dataset---BMN). •Huge data work, complicated econometric procedures.
chchch uy βxln
chcchu

First Map in 2000 (Joint projectNESDB/NSO/WB/TDRI) Use household survey 2000, Census 2000, and
village survey 1999 (provides location variables for rural map)
Second Map in 2002 (Join projectNSO/NESDB/WB/TDRI) household survey 2002, Census 2000, and village
survey 2002
- 2004Third Map in (on going effort)
SAE Poverty Maps in Thailand
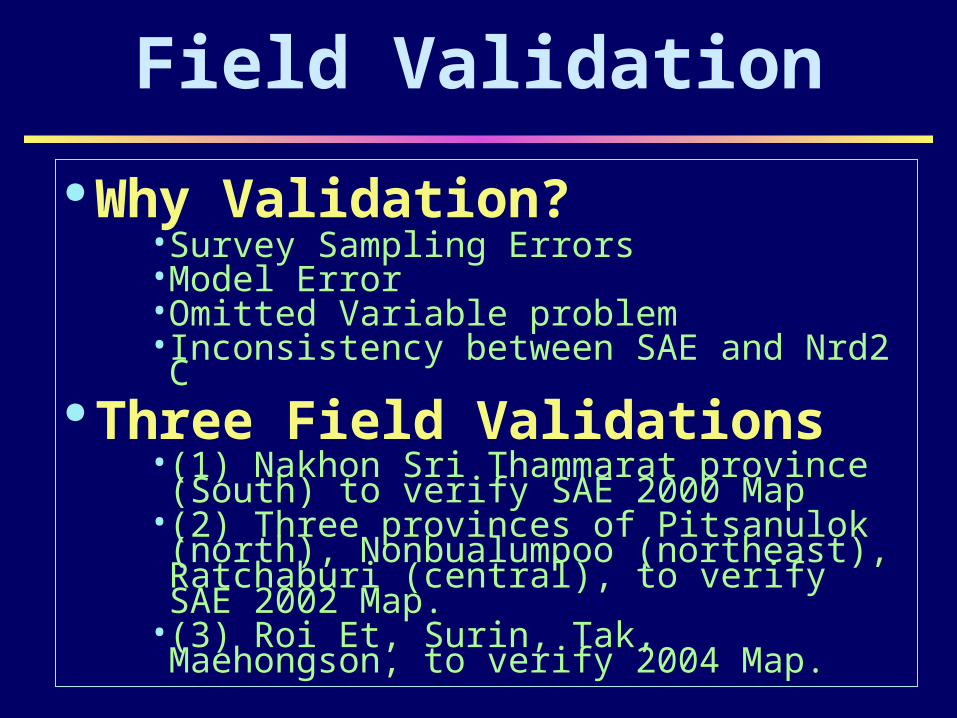
Why Validation?•Survey Sampling Errors • Model Error• Omitted Variable problem• Inconsistency between SAE and Nrd2C
Three Field Validations•(1) Nakhon Sri Thammarat province (South) to verify SAE 2000 Map
•(2) Three provinces of Pitsanulok (nor th), Nonbualumpoo (northeast), Ratch aburi (central), to verify SAE 2002 Map.
•(3) Roi Et, Surin, Tak, Maehongson, to verify 2004 Map.
Field Validation

Poverty rates var ied considerably
-Some sub distric ts were clearly b
- etter off (Pai Kho don, Baan Grang)
.
-Central District Pitsanulok (head - count at sub district level)

Baan Grang: Group Inter view (farmers)
Baan Grang - was clearly a better off- sub district, supporting SAE results
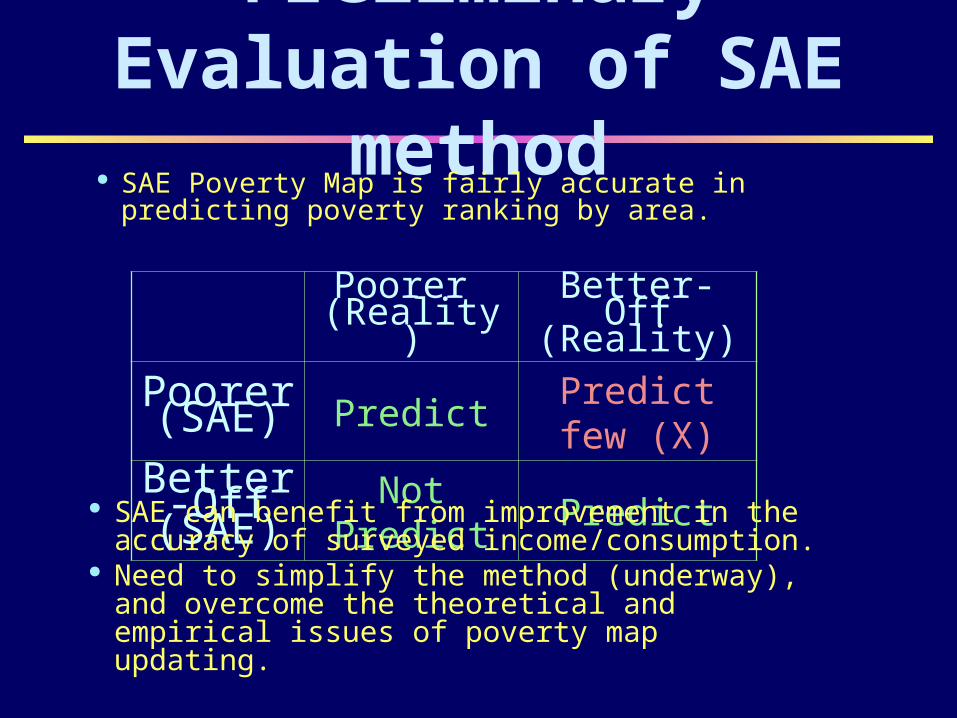
Preliminary Evaluation of SAE
method SAE Poverty Map is fairly accurate in
predicting poverty ranking by area.
Poorer (Reality)
Better-Off (Reality)
Poorer (SAE) Predict
Predict few (X)
Better-Off
(SAE)Not
PredictPredict
SAE can benefit from improvement in the accuracy of surveyed income/consumption.
Need to simplify the method (underway), and overcome the theoretical and empirical issues of poverty map updating.

Applications so far•Limited applications at national level.
•More potential at provincial level, mostly through NSO’ provincial offices.
•Some CEO governors showed interest in using SAE maps.
Future Plan•More Promotion to Line Ministries.•Collaborate Ministry of Interior in linking to Nrd2C, BMN.
•Nrd2C/BMN can be used as data sources for ‘location variables’ in producing future SAE map.
SAE Applications