Solvency and Financial Condition Report Everest Insurance ...

Solvency and Financial Condition Report
Bupa Insurance Limited31 December 2016

Bupa Insurance Limited Solvency and Financial Condition Report 2016
Contents
Summary ................................................................................................................................................. 3
A. Business and Performance................................................................................................................. 7
A.1 Business ........................................................................................................................................ 7
A.2 Underwriting performance ............................................................................................................. 9
A.3 Investment performance .............................................................................................................. 10
A.4 Performance from other activities ................................................................................................ 11
A.5 Any other information .................................................................................................................. 11
B. System of Governance ..................................................................................................................... 12
B.1 General information on the system of governance ...................................................................... 12
B.2 Fit and proper requirements ........................................................................................................ 14
B.3 Risk management system including Own Risk and Solvency Assessment ................................ 15
B.4 Internal control system ................................................................................................................ 18
B.5 Internal audit function .................................................................................................................. 18
B.6 Actuarial function ......................................................................................................................... 19
B.7 Outsourcing ................................................................................................................................. 19
B.8 Any other information .................................................................................................................. 20
C. Risk Profile ....................................................................................................................................... 21
C.1 Underwriting risk .......................................................................................................................... 21
C.2 Market risk ................................................................................................................................... 22
C.3 Credit risk .................................................................................................................................... 24
C.4 Liquidity risk ................................................................................................................................. 24
C.5 Operational risk ........................................................................................................................... 24
C.6 Other material risks ..................................................................................................................... 25
C.7 Any other information .................................................................................................................. 25
D. Valuation for Solvency Purposes ..................................................................................................... 27
D.1 Assets .......................................................................................................................................... 28
D.2 Technical provisions .................................................................................................................... 30
D.3 Other liabilities ............................................................................................................................. 33
D.4 Alternative methods for valuation ................................................................................................ 35
D.5 Any other information .................................................................................................................. 35
E. Capital Management ......................................................................................................................... 36
E.1 Own Funds .................................................................................................................................. 36
E.2 Solvency Capital Requirement and Minimum Capital Requirement ........................................... 38
E.3 Use of the duration-based equity risk sub-module in the calculation of the SCR ....................... 39
E.4 Differences between the standard formula and any internal model used ................................... 39
E.5 Non-compliance with the Minimum Capital Requirement and Solvency Capital Requirement ... 39
E.6 Any other information .................................................................................................................. 39
Directors’ responsibility statement ........................................................................................................ 40
Independent auditor’s opinion ............................................................................................................... 41
Glossary ................................................................................................................................................ 44
Annex - Reporting templates ................................................................................................................ 45

3
Bupa Insurance Limited Solvency and Financial Condition Report 2016
Summary (Unaudited)
BUSINESS AND PERFORMANCE SUMMARY
Bupa Insurance Limited (BINS or “the Company”) is part of the Bupa Group (“the Group”). The ultimate parent
undertaking of the Company is The British United Provident Association Limited (“Bupa”).
Bupa’s status, as a company limited by guarantee with no shareholders, enables the Group to make customers its
absolute focus. This means the Group can reinvest its profits to provide more and better healthcare for current
and future customers.
As a service organisation, everything Bupa does for its customers relies on its people and partners, so being a
place where people love to work is critical to its success. Bupa employs 86,000 people principally in the UK,
Australia, Spain, Hong Kong, Poland, New Zealand, Chile, Brazil, Thailand, China, Saudi Arabia, India and the
U.S.
Around 70% of Bupa’s revenue is from health insurance, with the rest from health and care provision. Bupa funds
healthcare around the world and runs clinics, dental centres, hospitals, care homes and retirement villages in a
number of countries.
Bupa’s refreshed strategic framework is driving the next phase of the Group’s development in today’s digital age.
It has three core elements – Customers, People and Performance – underpinned by three operating principles,
with Bupa’s purpose and values guiding everything it does.
Bupa’s refreshed strategic framework:
BINS is Bupa’s UK short-term health, dental and travel insurance underwriter and reinsurer through which the
domestic UK Private Medical Insurance (UK PMI) and International Private Medical Insurance (IPMI) businesses
write insurance contracts.

4
Bupa Insurance Limited Solvency and Financial Condition Report 2016
BINS strategic focus is to deliver great customer outcomes and long-term profitable growth. Our priorities include:
Customer experience, delivering great value and care.
Strengthened risk and compliance management.
Health risk management, assuring quality and supporting customer affordability.
Customer growth and retention, meeting the needs of different customer segments across our domestic UK
PMI and global IPMI markets.
Continued focus on operational efficiency ensuring value for money for all of our customers.
BINS is authorised by the Prudential Regulation Authority (PRA) and regulated by both the Financial Conduct
Authority (FCA) and the PRA.
SYSTEM OF GOVERNANCE SUMMARY
The Company recognises the importance of strong corporate governance and has established a well-defined
governance framework, system of control and committee structure.
BINS and Bupa Insurance Services Limited (BISL) are collectively known as the Regulated Entities. BISL is a
fellow Group company which provides operational services to BINS, including the provision of insurance
mediation and administrative services. The BINS and BISL Boards, collectively known as the Regulated Entities
Board (“the Board”), operate within the agreed strategy, risk appetite and policies of the Bupa Board.
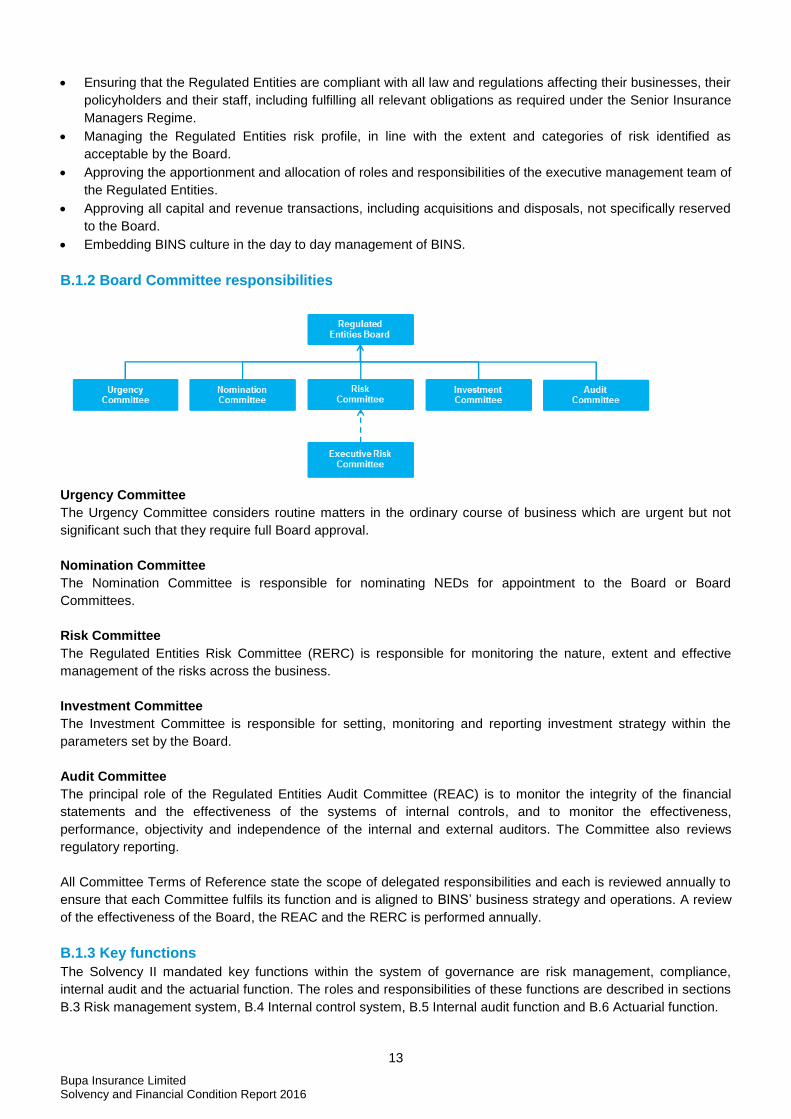
The Regulated Entities Board Committee structure is as follows:
The Company employs a ‘three lines of defence’ governance model to ensure that risk management is effective,
appropriate decisions are made and best practice is implemented and maintained. Broadly the responsibility of
the three lines is as follows:
First line: business management is responsible for the identification and assessment of risks and controls, as
well as for developing and implementing mitigation plans where necessary.
Second line: risk functions provide support and challenge the completeness and accuracy of risk
assessments and the adequacy of mitigation plans.
Third line: internal audit provides independent and objective assurance on the robustness of the risk
management framework, and the appropriateness and effectiveness of internal controls.
RISK PROFILE SUMMARY
The Company’s principal activity is the provision and administration of domestic and international health insurance
providing cover to 2.9 million customers worldwide.
The Company’s product range covers a range of benefit choices and is available in the consumer, small and
medium enterprise (SME) and corporate markets.
Economic ‘Solvency capital’ is held to ensure that the Company can meet its obligations to policyholders as they
fall due in all but the most extreme circumstances, with the likelihood that it will be insufficient no more than once
every 200 years. The Solvency Capital Requirement (SCR) is calculated in accordance with the standard formula
specified in the Solvency II legislation. The Company has obtained approval from the PRA to substitute the
insurance premium risk parameter used in the standard formula with an undertaking specific parameter (USP)

5
Bupa Insurance Limited Solvency and Financial Condition Report 2016
which reflects the Company’s own loss experience. The following charts show the composition of the Company’s
diversified SCR at 31 December 2016 and 31 December 2015:
The SCR profile of the Company has not changed materially over the past 12 months. Underwriting risk
represents the biggest risk to the Company, followed by operational risk.
Underwriting risk refers to the risk that premiums earned are not adequate to cover claims, expenses and profit
margin. It includes the risk that technical provisions for claims incurred prove to be insufficient in the light of later
events and claims experience. This risk is managed by a number of approaches including the regular review of
premium tariffs, effective claims risk management and the ongoing review of claims patterns.
Operational risk is the risk of loss arising from inadequate or failed internal processes, or from personnel, systems
or external events. Maintenance of robust internal control processes and governance frameworks, the approval of
risk policies, and the regular assessment of compliance help mitigate operational risk.
Market risk is the risk of adverse movements in the fair values of financial instruments, arising from fluctuations in
interest rates, foreign exchange rates, commodity prices, credit spreads and equity prices. The focus of the
Company’s long-term financial strategy is to facilitate growth without undue balance sheet risk. The majority of its
cash and investments are held with highly rated credit institutions.
VALUATION FOR SOLVENCY PURPOSES SUMMARY
Solvency II requires an economic market consistent approach to the valuation of assets and liabilities. A number
of assets and liabilities require different valuation methods to those used in the financial statements prepared
under UK Generally Accepted Accounting Practice (UK GAAP). The valuation differences are summarised as
follows:
2016 £m
2015 £m
UK GAAP equity attributable to shareholders 210 512
Valuation differences:
Assets 1 2
Technical provisions 121 124
Deferred tax liabilities (21) (23)
Subordinated liabilities (48) (46)
Solvency II excess of assets over liabilities 263 569
Section D includes information on the valuation basis adopted for each class of assets and liabilities and also
provides an explanation of valuation differences arising when moving from the valuation basis used in the
Company’s financial statements to the Solvency II valuation basis.

6
Bupa Insurance Limited Solvency and Financial Condition Report 2016
CAPITAL MANAGEMENT SUMMARY
The Company’s capital management objective is to maintain sufficient capital to safeguard the Company’s ability
to continue as a going concern and to protect the interests of all of its customers, investors, regulators and trading
partners while also efficiently deploying capital and managing risk to sustain ongoing business development.
The Company has issued a £330m callable subordinated perpetual loan. This loan is accounted for as a liability in
the UK GAAP financial statements but, to the extent that it is eligible, is treated as solvency capital for regulatory
and management purposes.
The Company manages its capital resources in line with the Group's Capital Management Policy and the
Company’s risk appetite. As part of its capital management, during June 2016 the Company carried out a share
capital reduction to support a £200m dividend payment to Bupa Finance Plc, which followed the repayment of a
£200m loan to the Company by Bupa Finance Plc.
The SCR coverage ratio at 31 December 2016 was 160%.
Solvency II capital position 2016
£m 2015
£m
Eligible Own Funds 433 761
SCR 271 252
Surplus 162 509
Solvency ratio 160% 302%
The decrease in coverage during the year reflects the Company’s deliberate actions to improve balance sheet
efficiency, including eliminating the loan to Bupa Finance Plc.
The Company has maintained sufficient capital to exceed both the SCR and the Minimum Capital Requirement
(MCR) throughout the reporting period. Information on the SCR and the MCR is provided in section E.2: Solvency
Capital Requirement and Minimum Capital Requirement.
The Company’s capital position is kept under constant review and is reported monthly to the Board.
OTHER INFORMATION
In line with PRA requirements, sections D. Valuation for Solvency Purposes and E. Capital Management of the
SFCR have been subject to audit by the external auditor. Sections A. Business and Performance, B. System of
Governance and C. Risk Profile are unaudited.

7
Bupa Insurance Limited Solvency and Financial Condition Report 2016
A. Business and Performance (Unaudited)
A.1 Business
A.1.1 Company information
The Company is incorporated in England and Wales under the company registration number 3956433. The
Company is a wholly owned subsidiary of Bupa Finance Plc, a company incorporated in England and Wales.
The ultimate parent undertaking of the Company is The British United Provident Association Limited (“Bupa”), a
company incorporated in England and Wales. Bupa is the parent company of the Bupa group of companies. Bupa
does not have shareholders. Governance over Bupa is exercised by approximately one hundred Association
Members who vote at an Annual General Meeting on director reappointments and adoption of the financial
statements. These Association Members are not entitled to any of the assets or income of Bupa. No individual
has 10% or more voting rights or any other mechanism of control of Bupa.
The Group supervisor is the PRA, Bank of England, 20 Moorgate, London, EC2R 6DA.
The Group supervisor is also the supervisor for the Company.
The Company’s external auditor is KPMG LLP, Chartered Accountants, 15 Canada Square, London, E14 5GL.
The Company’s Annual Report and Accounts, Bupa’s Annual Report and Accounts and Bupa’s Solvency and
Financial Condition Report (SFCR) are available on the Bupa website: bupa.com.
A.1.2 Business
The Company is the UK’s largest health insurer and a leading provider of international health insurance providing
medical cover to 2.9 million customers worldwide. It is wholly owned by the Bupa Group, an international
customer-focused health and care group employing 86,000 people, providing health insurance and running
clinics, dental centres, hospitals, care homes and retirement villages in a number of countries.
Bupa’s purpose is to help people live longer, healthier, happier lives. Bupa’s status, as a company limited by
guarantee with no shareholders, enables us to make our customers our absolute focus, reinvesting our profits to
provide more and better healthcare for current and future customers.
The Company is wholly driven by Bupa’s purpose. It provides consumer, SME and corporate health insurance, as
well as inward reinsurance and a small number of ancillary health insurance products, such as cash plans and
travel insurance.
The Company has two main segments:
UK PMI providing domestic health insurance in the UK market.
IPMI providing individual consumers and employees with international cover.
The principal operations take place in the UK, with further operations sited in Denmark, Cyprus, Malta and
Switzerland. Products underwritten by IPMI are sold in several markets including the United Arab Emirates, Hong
Kong, Singapore and Mexico. The Company reinsures part of its IPMI book of business with Bupa Insurance
Company, a fellow Group company. There are no material reinsurance arrangements external to the Bupa Group.
Operational services, including the provision of insurance mediation and administrative services, are provided by
BISL.
8
Bupa Insurance Limited Solvency and Financial Condition Report 2016
A.1.3 Legal structure
The simplified chart below shows the position of BINS and BISL in the Group’s legal structure.
*BINS is the majority shareholder in Bupa Insurance (Bolivia) S.A (“Bupa Bolivia”), with the remaining shares being owned by
fellow Group companies. Bupa Bolivia was established in October 2008 as part of Bupa’s acquisition of IHI Denmark. As at
December 2016 Bupa Bolivia had direct written premiums of US dollar 8m per local statutory accounting rules and 3,814
members.
A.1.4 Bupa organisation structure
Bupa’s organisational structure consists of global functions at the Centre and four Market Units (Australia and
New Zealand, UK, Europe and Latin America and International Markets).
The BINS UK PMI business is distributed through and administered by the Bupa UK Insurance Business Unit
within the UK Market Unit. The BINS IPMI business is distributed through and administered by the Bupa Global
Business Unit within the International Markets Market Unit. BINS is supported by Bupa’s global functions in the
Centre, including Finance & Regulatory Reporting, Treasury and Actuarial.
A.1.5 Significant events in the year
As part of its effective capital management during June 2016 the Company reduced its share capital by £300m
and share premium by £69m transferring them to distributable reserves to support a £200m dividend payment to
Bupa Finance Plc. This followed the repayment of a £200m loan to the Company by Bupa Finance Plc.
Including the £200m described above, total dividends paid by the Company during the year amounted to £410m,
of which £61m was recognised as foreseeable as at 31 December 2015 for the purpose of calculating Own
Funds. A further dividend of £25m was approved by the Board on 28 February 2017 and is recognised as a
foreseeable dividend as at 31 December 2016.
Two branches were closed during 2016, namely Bupa Insurance Limited, French Branch and Bupa Insurance
Limited, Surcusal en España (registered in Spain).
During the year the Company announced its intention to sell a freehold property. As at 31 December 2016, the
property was reported within property, plant and equipment on the Company’s Solvency II balance sheet, valued
at £69m, pending the sale being completed during 2017.
9
Bupa Insurance Limited Solvency and Financial Condition Report 2016
A.2 Underwriting performance
A.2.1 Overview
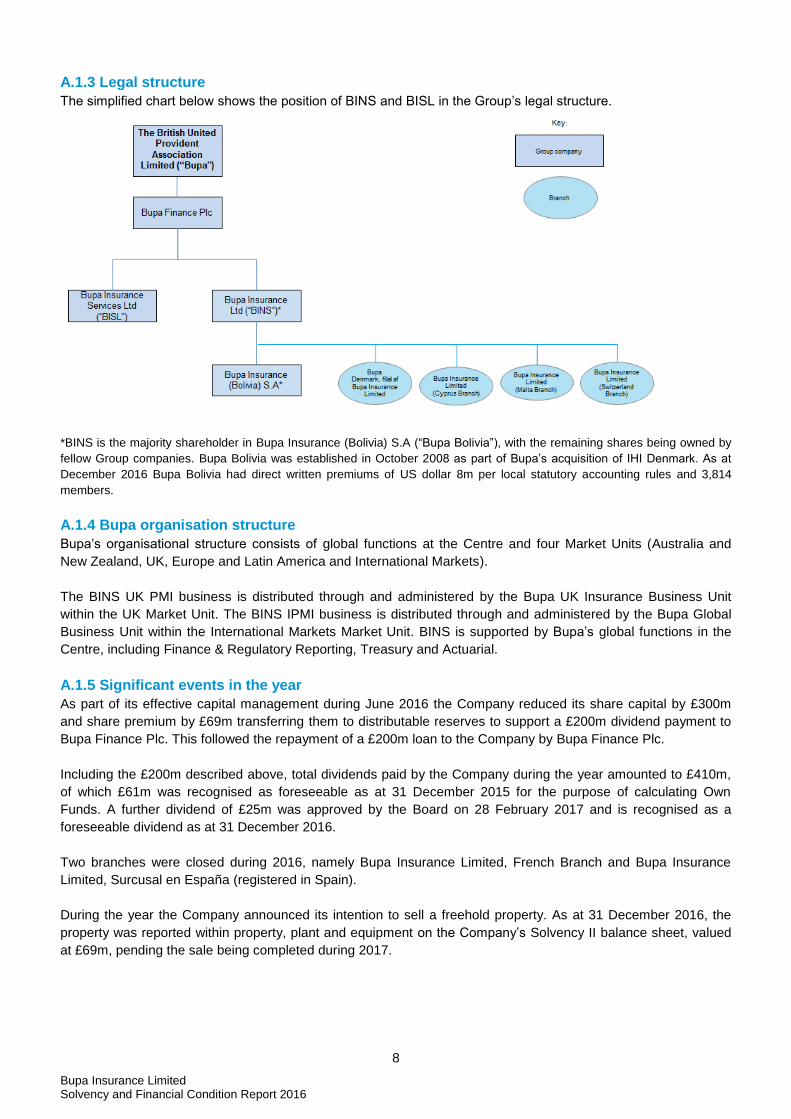
Presented below is the Company’s underwriting performance as reported in its financial statements.
Underwriting performance 2016
£m
Premiums:
Gross premiums written 2,378
Outward reinsurance premiums (106)
Premiums written, net of reinsurance 2,272
Change in the net provision for unearned premiums 5
Net insurance premiums earned 2,277
Other technical income, net of reinsurance 5
Claims:
Gross claims paid 1,728
Reinsurers’ share of claims paid (93)
Change in the net provision for claims 15
Net claims incurred 1,650
Net operating expenses 522
Total claims and expenses 2,172
Profit before investment income and expense and tax 110
The Company’s profit before investment income and tax of £110m represents a 38% decrease when compared to
the 2015 profit of £176m. The decrease is driven by an increase in the insurance agency fee recharge from BISL,
which is due to the impact of movements in foreign exchange rates on operating expenses, impairment to
intangible assets and increased governance and compliance costs as the Company strengthens its conduct
environment.
Total revenues increased by 5% in the year despite a challenging market with affordability of health insurance a
key concern for customers. In UK PMI revenue increased across both corporate and SME segments with new
business growth in the consumer segment. This was against a backdrop of a 0.5% increase in the rate of
insurance premium tax. The Company continues to work across the sector to stimulate reform in the private
health care industry and improve affordability for customers. Focus is on containing healthcare costs, particularly
those charged by private hospitals, which make up the majority of total costs.
In the IPMI segment, underlying revenue has reduced due to a fall in customer numbers following the decisions to
exit non-strategic markets and contractions in the corporate and SME business. However, the Company’s
revenue benefited from the devaluation of sterling against the US dollar leading to a slight increase in overall IPMI
revenue.
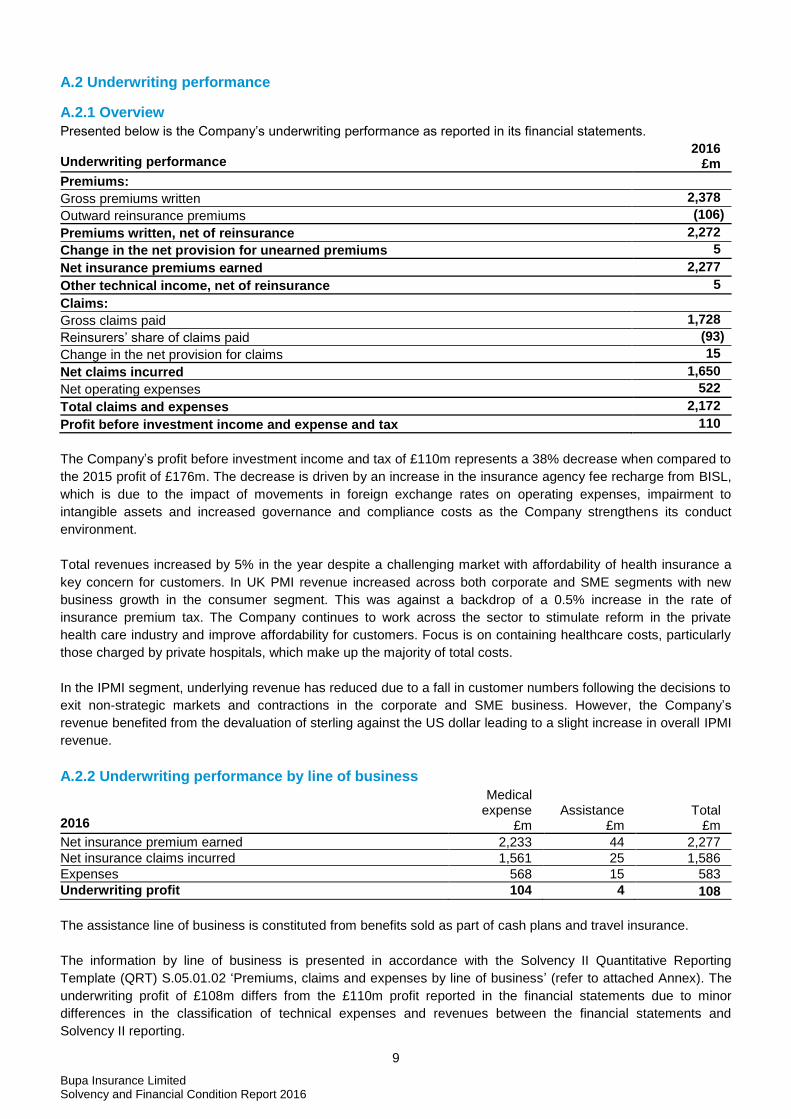
A.2.2 Underwriting performance by line of business
2016
Medical expense
£m
Assistance
£m Total
£m
Net insurance premium earned 2,233 44 2,277
Net insurance claims incurred 1,561 25 1,586
Expenses 568 15 583
Underwriting profit 104 4 108
The assistance line of business is constituted from benefits sold as part of cash plans and travel insurance.
The information by line of business is presented in accordance with the Solvency II Quantitative Reporting
Template (QRT) S.05.01.02 ‘Premiums, claims and expenses by line of business’ (refer to attached Annex). The
underwriting profit of £108m differs from the £110m profit reported in the financial statements due to minor
differences in the classification of technical expenses and revenues between the financial statements and
Solvency II reporting.

10
Bupa Insurance Limited Solvency and Financial Condition Report 2016
Claims handling costs of £64m are included within expenses on the QRT, in compliance with Solvency II reporting
requirements, but are included in claims in the financial statements.
Expenses
A summary of expenses is provided below:
Operating expenses 2016
£m
Commission and other acquisition costs 145
Expenses payable to Bupa Group companies 349
Staff costs 3
Net loss on foreign exchange transactions 22
Reinsurers share of expenses (11)
Changes in deferred acquisition costs (1)
Other operating expenses 15
Net operating expenses per financial statements 522
Claims handling cost 64
Classification differences between Solvency II and the financial statements (3)
Underwriting expenses 583
A.2.3 Underwriting performance by geographical area
2016 UK £m
United Arab
Emirates £m
Hong Kong
£m Singapore
£m Denmark
£m Others
£m Total
£m
Net insurance premium earned1 1,615 154 51 34 28 395 2,277
Net insurance claims incurred 1,194 111 34 25 14 208 1,586
Expenses2 331 63 16 12 11 150 583
Underwriting profit / (loss) 90 (20) 1 (3) 3 37 108
1. Premiums earned are allocated across geographical areas on a sold-in basis.
2. Expenses include impact of foreign exchange revaluation on the statutory results.
The information is presented in accordance with the QRT S.05.02.01 ‘Premiums, claims and expenses by
country’.
A.3 Investment performance
A.3.1 Investment income
Investment income for the year was as follows:
Investment income 2016
£m
Income from Bupa Group undertakings:
Interest receivable 2
Rental income 6
Income from deposits with credit institutions 7
Realised capital gains on investments 5
Realised foreign exchange gains 8
Investment income as reported in the Company’s profit and loss account 28
Unrealised gains on investments 46
Realised foreign exchange losses as reported in investment expenses (26)
Total investment income 48
A large proportion of the Company’s investments are in cash or cash-like instruments. The Company has also
invested in a limited portfolio of non-cash assets (return seeking asset portfolio), principally bonds, properties,
loans, collective investment undertakings and segregated funds. Hedging instruments were used to manage the
foreign exchange risks from non-sterling investments.

11
Bupa Insurance Limited Solvency and Financial Condition Report 2016
Investment income by Solvency II asset class is presented in the table below.
Investment income by asset class 2016
£m
Government bonds 10
Corporate bonds 18
Collective investment undertakings 3
Cash and deposits 18
Mortgages and loans 14
Property 5
Hedging instruments (20)
Total investment income 48
A.3.2 Investment expenses
Investment expenses in the year amounted to £1m, covering investment management fees and other costs
relating to investment related activities.
A.3.3 Gains/losses recognised directly in equity
For the year ended 31 December 2016, there were no material gains or losses reported directly in equity.
A.4 Performance from other activities
Financial expense
Interest on borrowings in the year amounted to £23m, comprising £21m payable to Bupa Finance Plc in respect of
the subordinated liabilities which are classified as Own Funds for Solvency II purposes and other interest payable
of £2m.
Leasing arrangements
BINS leases part of an owned office building to other entities in the Group. Rental income of £6m was received by
BINS during 2016 and is included in investment income in the Company’s income statement. During the year the
company announced its intention to sell the property which provides the rental income (refer section A.1.5
Significant events in the year). There are no other material operating lease arrangements.
BINS had no finance leases during 2016.
A.5 Any other information
There is no other material information to be disclosed.
12
Bupa Insurance Limited Solvency and Financial Condition Report 2016
B. System of Governance (Unaudited)
B.1 General information on the system of governance
B.1.1 Board responsibilities
The role of the Board
The Board comprises an independent Non-Executive Chairman, three other Non-Executive Directors (NEDs) and
three Executive Directors. It normally meets six times a year and at other times as required. Minutes of all Board
and Committee meetings are recorded and reflect the substance of the discussion, as well as the decisions made.
The Board closely monitors developments in corporate governance and assesses how these can be applied to
BINS. The Company’s governance arrangements continue to be reviewed in line with developments in best
practice. The Board believes the existing structure is appropriate for the size and complexity of BINS.
The Board is responsible for the oversight of the management of BINS, including:
Agreeing BINS long-term directions and objectives.
Developing and maintaining BINS business model and aligning the BINS business model with the Bupa
Group strategy, while ensuring that local regulation, legislation or market practice is also met.
Determining the nature and extent of the significant risks it is willing to take in achieving its strategic objectives
and setting the risk appetite.
Oversight of BINS operations.
Ensuring the appropriate and necessary financial and human resources are in place to meet BINS objectives.
Providing constructive challenge to the executive directors and senior management.
Ensuring the highest standards of governance are followed.
Developing BINS culture.
The role of the Chairman
The Chairman is responsible for the leadership of the Board and is pivotal in the creation of the conditions
necessary for overall Board and individual director effectiveness, both in and outside the boardroom, including:
The leadership of the Board and ensuring its effectiveness on all aspects of its role.
Ensuring effective Board governance.
Setting agendas.
Ensuring that members of the Board receive accurate, timely and clear information.
Managing the Board to ensure sufficient time is allowed for discussion of key risks and issues.
Facilitating contributions from NEDs.
Considering and addressing the development needs (induction, training and professional development) of
individual directors and the Board as a whole.
The role of the Non-Executive Directors
The role of the NEDs includes the following key elements:
Constructively challenging and helping to develop proposals on longer term direction and strategy.
Scrutinising the performance of management in meeting agreed goals and objectives and monitoring the
reporting of performance.
Satisfying themselves on the integrity of financial information, and that financial controls and systems of risk
management are robust and effective.
The role of the Chief Executive Officer
The Chief Executive Officer (CEO) manages the Regulated Entities in accordance with the business plans
approved by the Board and in accordance with the overall Bupa Group strategy and plans. The CEO leads the
setting and execution of the Regulated Entities business strategy and is accountable for:
Ensuring that the Regulated Entities remain legally solvent at all times and that customers are treated fairly.
13
Bupa Insurance Limited Solvency and Financial Condition Report 2016
Ensuring that the Regulated Entities are compliant with all law and regulations affecting their businesses, their
policyholders and their staff, including fulfilling all relevant obligations as required under the Senior Insurance
Managers Regime.
Managing the Regulated Entities risk profile, in line with the extent and categories of risk identified as
acceptable by the Board.
Approving the apportionment and allocation of roles and responsibilities of the executive management team of
the Regulated Entities.
Approving all capital and revenue transactions, including acquisitions and disposals, not specifically reserved
to the Board.
Embedding BINS culture in the day to day management of BINS.
B.1.2 Board Committee responsibilities
Urgency Committee
The Urgency Committee considers routine matters in the ordinary course of business which are urgent but not
significant such that they require full Board approval.
Nomination Committee
The Nomination Committee is responsible for nominating NEDs for appointment to the Board or Board
Committees.
Risk Committee
The Regulated Entities Risk Committee (RERC) is responsible for monitoring the nature, extent and effective
management of the risks across the business.
Investment Committee
The Investment Committee is responsible for setting, monitoring and reporting investment strategy within the
parameters set by the Board.
Audit Committee
The principal role of the Regulated Entities Audit Committee (REAC) is to monitor the integrity of the financial
statements and the effectiveness of the systems of internal controls, and to monitor the effectiveness,
performance, objectivity and independence of the internal and external auditors. The Committee also reviews
regulatory reporting.
All Committee Terms of Reference state the scope of delegated responsibilities and each is reviewed annually to
ensure that each Committee fulfils its function and is aligned to BINS’ business strategy and operations. A review
of the effectiveness of the Board, the REAC and the RERC is performed annually.
B.1.3 Key functions
The Solvency II mandated key functions within the system of governance are risk management, compliance,
internal audit and the actuarial function. The roles and responsibilities of these functions are described in sections
B.3 Risk management system, B.4 Internal control system, B.5 Internal audit function and B.6 Actuarial function.

14
Bupa Insurance Limited Solvency and Financial Condition Report 2016
B.1.4 Remuneration policy and practices
Bupa’s remuneration policy is designed to deliver market competitive reward to help attract, retain and motivate
high calibre employees, and promote a prudent approach to risk.
The Bupa Remuneration Committee has responsibility for setting remuneration policy, approving the design of the
annual bonus scheme, the management bonus scheme and long-term incentive plan, choosing an appropriate
balance of performance measures and setting appropriate targets and maximums for all such incentive schemes.
The Bupa Remuneration Committee has worked closely with its advisers and with management in developing
these plans and the Group’s remuneration policy, reflecting a shared agenda in how Bupa rewards future
performance, with customers and risk management at the heart of what Bupa does. The Bupa Remuneration
Committee reviews annually the ongoing appropriateness and relevance of the remuneration policy. In doing so, it
takes into account all relevant factors including regulatory requirements, the provisions and recommendations of
the UK Corporate Governance Code and associated guidance, the views of Bupa’s Association Members and
other stakeholders, the risk appetite of Bupa and input from the Bupa Risk Committee. It also takes independent
external advice. The Bupa Remuneration Committee itself comprises independent board directors. There is cross
membership between the Bupa Risk Committee and the Bupa Remuneration Committee.
In determining incentive outcomes, the Bupa Remuneration Committee considers if results have been achieved in
a way that aligns with our values, underlying business performance and approach to risk management, which
includes consideration of risk assessments summarised in annual letters from the Group Risk Committee and
from the Chair of the RERC to the Remuneration Committee. For 2017, all incentive payments are additionally
subject to a risk adjustment which allows for downward adjustments in the event of poor risk decision-making or
risk management, including any breaches of Bupa’s risk appetite.
While BINS did not have a separate remuneration committee during 2016, such a committee is currently in the
process of being established. Formal terms of reference, to be approved by the Board, will ensure that the
responsibilities of this committee are clear, including how it interacts with the Bupa Remuneration Committee.
The Company’s only employees are employed by the Danish branch. All other staff, including the Directors, are
remunerated and employed through the Company’s service company, BISL, with costs recharged to the
Company.
The Remuneration Report on pages 42 to 52 of the 2016 Bupa Annual Report includes detailed information on:
the remuneration policy of the Bupa Group, the components of remuneration and performance criteria on which
entitlements are based. BINS’ remuneration policy is consistent with the Bupa Group policy.
Remuneration in the year for the BINS Directors was as follows:
2016 2015 Directors’ remuneration £m £m
Emoluments 2 2
Amounts receivable under long-term incentive schemes 1 1
3 3
No Director had any material interest in any contracts with Group companies at 31 December 2016 (2015: £nil) or
at any time during the year.
B.2 Fit and proper requirements
BINS implements policies and procedures to ensure persons who effectively run the undertaking or have other
key functions are fit and proper to do so. Before appointment, and on an annual basis, directors and senior
managers are assessed with reference to the specific requirements of their particular role. Certain individuals
holding roles of significant influence are required to have received prior approval from the PRA and/or FCA before
they can perform their role. Individuals holding key functions are also separately notified to the PRA.

15
Bupa Insurance Limited Solvency and Financial Condition Report 2016
An individual’s fitness to perform their role refers to their competence and capability including skills, knowledge
and expertise applicable. Assessments of fitness are tailored to the individual’s particular role, including the
individual’s knowledge and understanding of:
The markets in which they operate (i.e. insurance/financial services and/or care provision).
Business strategy and business model.
System of governance.
Financial and, where relevant, actuarial analysis.
Regulatory framework and requirements.
Individuals are required to maintain their fit and proper status which would include arranging for further
professional training as necessary, so that the individual is also able to meet changing or increasing requirements
of their particular responsibilities.
Appointments are subject to background screening checks, which include verification of ID, previous employment
including references and relevant qualifications; directorship searches; screening against publicly available
information such as the global watch list; disclosure and barring service check; credit checks; and adverse media
searches.
Individuals are regularly monitored to ensure that they maintain fit and proper for their role. This includes
performance management and annual screening checks.
B.3 Risk management system including Own Risk and Solvency Assessment
B.3.1 Risk management framework
Our Risks
BINS’ geographic reach exposes it to a wide range of political, legal and economic contexts. The risks to BINS are
managed by understanding the risk drivers for the business and the balance sheet and by assessing how they
interact. By understanding the risks faced, the Company seeks opportunities to benefit from risk diversification, to
identify emerging risks and to understand and manage any risk concentrations.
BINS accepts risks as part of its business operation. Some risks are avoidable (e.g. certain financial risks) and
others are an accepted consequence of BINS’ business model (e.g. operational risks). The Company has an
effective risk management system and appropriate internal controls in place to mitigate these risks.
BINS maintains significant economic capital as a mitigant against certain inherent risks, reflecting the nature of
the Company’s operations and the level of risk associated with them. The most significant are:
Risks relating to BINS insurance businesses, including the risk of inadequate pricing or underwriting of
insurance policies and the risk of claims experience being materially adversely different to expectations.
Operational risks.
There are certain risks where holding capital is one mitigating action, but there are also other more effective
methods of mitigation. These are significant risks to BINS. The RERC regularly review the residual risks arising
and the mitigating actions in place to reduce the levels of residual risk. This provides management with a view of
the areas of priorities to focus resources. These risks include customer and conduct related risks and specific
operational risks including those related to cybersecurity.
There are also other risks where capital is not an appropriate mitigant and even though they are not highlighted
above they are always a priority issue for management. These include: strategic risks, liquidity risk and
reputational risks.
Further information on BINS’ risk profile is provided at section C: Risk Profile.
Risk governance
The Company adopts a three lines of defence approach for the governance of risk management which is set out
in the Risk Management Framework.

16
Bupa Insurance Limited Solvency and Financial Condition Report 2016
The first line of defence encompasses management and staff in Bupa’s individual Business Units and at the
Centre, who are responsible for the identification and management of risks. In each Business Unit an executive
risk committee, chaired by the Business General Manager scrutinises the risk profile and generates mitigating
actions where necessary. This process culminates in the BINS CEO chairing an executive committee, the
Executive Risk Committee (RE ERC), which brings the whole picture together.
The second line of defence comprises compliance and risk management professionals both at the Centre and
within Bupa’s Business Units. The BINS Risk Function is led by the Chief Risk Officer (CRO). Their role is to
advise, challenge and oversee the first line risk management activities and to collate reports for management and
the Board on their independent views on risk issues.
The RERC is composed entirely of independent NEDs to oversee the execution of the risk management
framework. The RERC receives reports from the BINS CRO and other BINS executives as appropriate. The
RERC is accountable for the Board’s oversight and recommends risk appetite to the Board for approval.
The third line of defence is internal audit. Internal audit provides independent and objective assurance on the
robustness of the risk management framework, and the appropriateness and effectiveness of internal controls.
Information on the Company’s internal audit function is provided in section B.5.
Risk appetite
The Board risk appetite expresses the degree of risk the Company is prepared to accept as it works to deliver on
its strategy. The core risk appetite statements are focused on:
management of financial strength
the treatment of customers and employees
the sustainability of the business
operational risk.
The risk appetite statements are a key consideration in the Company’s business planning process and are a
central reference point for key decisions. These statements are not intended to automatically prevent activity
outside of BINS’ risk appetite, but rather to help identify any such instances in a timely manner so that the Board
can consider an appropriate response. There is regular reporting against risk appetite statement limits to the RE
ERC and RERC.
Risk appetite statements are reviewed on an annual basis, with the RERC recommending any changes to the
statements to the Board for approval.
Risk management framework
The Company manages risks according to a Board approved Risk Management Framework. This sets out the
principles underpinning a robust and continuous risk management system for the first line. This ensures:
Current and emerging risks to the business are identified and the potential consequences of them are
understood.
There are clear and established risk appetites within which the Company operates.
Appropriate and effective steps are taken to mitigate and manage identified risks.
Risk management information is utilised to make risk based decisions across the business.
There is clear ownership of, and accountability for, risk.
There is a culture in which:
o appropriate risk behaviours are encouraged and rewarded
o inappropriate behaviours are challenged and sanctioned
o risk events are communicated as quickly as good news without fear of blame.
Well-established regular reporting mechanisms are in place to ensure that all relevant top risks are appropriately
identified and escalated. These processes also ensure that strategies to manage and mitigate the risks to
acceptable levels are identified and executed.

17
Bupa Insurance Limited Solvency and Financial Condition Report 2016
The BINS Enterprise Policies define the way the Company does business. The policies cover all key areas of risk
and are implemented in the Business Units, which monitor compliance against the requirements. These policies
all have designated ownership at both the Company and Business Unit levels with defined roles and
responsibilities. The policies are reviewed on an annual basis.
The processes used to identify, measure, manage, monitor and report risks include a programme of stress and
scenario testing. Specific detailed reviews and deep dives on particular risks are undertaken when considered
necessary.
The effectiveness of the implementation of the Risk Management Framework is tested through the Internal
Control and Risk Management Assessment (ICRMA). This provides a mechanism to assess how well internal
control and risk management practices and policy compliance are embedded across BINS. This is a first line of
defence self assessment, subject to review and challenge by the second and third lines. This assessment is
conducted on an annual basis and the results are presented to the RERC.
Information on the Company’s risk profile is provided at section C. Risk Profile.
Risk management function
The BINS CRO leads the BINS Risk and Compliance function and reports to the Bupa CRO on a day to day
basis. The BINS CRO provides reports directly to the RERC and the Board, and has a direct right of access to the
Chairman of the Board and the Chairman of the RERC. The CRO also attends the REAC by invitation.
The function is split across the Bupa Business Units and a Centre team. Each Business Unit has a Risk and
Compliance Director who is responsible for the operation of the function within the Business Unit. The Risk and
Compliance Directors in the UK Insurance Business Unit and the Bupa Global Business Unit each have a solid
line reporting into the BINS CRO as well as into local Business Unit management.
B.3.2 Own Risk and Solvency Assessment
BINS’ Own Risk and Solvency Assessment (ORSA) comprises the series of activities by which it assesses all the
risks inherent in its business and determines the corresponding capital needs. It therefore includes the following
activities:
The projection of Own Funds and future capital requirements as part of the three-year business plan
presented to the Board for approval annually.
The Economic Capital Assessment (ECA) in which the Company makes its own quantification of how much
capital is required to support its risks. The ECA is used to assess how well the standard formula SCR reflects
BINS’ actual risk profile. The ECA is presented to the RERC for approval on an annual basis.
The annual review of risk appetite which is approved by the RERC.
Regular BINS risk profile and risk appetite reporting as part of the CRO report to the RERC.
Stress and scenario testing and reverse stress testing carried out at least annually and approved by the
RERC.
The outputs of the above activities are set out in papers and reports to the Board or relevant Board Committee
and summarised in the annual ORSA report which is approved by the Board. The conclusions of the ORSA are a
key input into the Board strategy sessions.
The process for carrying out the ORSA is reviewed following the strategy sessions to take account of decisions
made there and also to consider any other enhancements that can be made to the ORSA process. Proposed
changes to the ORSA process are considered by the RERC and then subsequently incorporated into the ORSA
Policy which is approved by the Board.
BINS determines its own solvency needs by reference to the projected Own Funds and future capital
requirements reflecting the risk profile of the Company, its policy of maintaining a substantial buffer over the

18
Bupa Insurance Limited Solvency and Financial Condition Report 2016
capital requirements, potential acquisitions and disposals which might take place over the planning horizon and
the availability of management actions.
B.4 Internal control system
B.4.1 Internal control system
In line with the three lines of defence governance model, internal controls are the responsibility of business
management. Internal controls are implemented as part of the embedding of the suite of Enterprise Policies and
also:
Promote the effectiveness and efficiency of operations.
Ensure the reliability of financial reporting.
Are designed to ensure BINS operates to industry best practice and complies with applicable laws and
regulations.
Enable the Board and RERC to validate that BINS is operating within its risk appetite.
Support the embedding of a strong risk culture throughout the business.
B.4.2 Compliance function
The Compliance function operates within the second line of defence and is concerned with financial services
legislative and regulatory requirements and expectations, including:
Customer outcome standards, e.g. customer fair treatment, training and competence.
High level controls, e.g. governance, skills and competency, systems and controls, conflicts of interest,
regulatory relationships, record keeping, complaints management, strategic risk, market conduct.
Solvency and capital (EU, UK and individual territory prudential requirements).
Regulatory processes, e.g. authorisations and licensing, individual approvals, fines and litigation, breach
management.
B.5 Internal audit function
Bupa has a Global Internal Audit function which is led by the Chief Internal Auditor (CIA). In order to maintain the
function’s independence and objectivity, the primary reporting line for the CIA is to the Chair of the Bupa Group’s
Audit Committee, who is also the Chair of the REAC. Bupa’s internal auditors have no direct operational
responsibility or authority over any of the activities audited.
The CIA has appointed a Bupa UK Market Unit & BINS Audit Director who oversees the execution of the BINS
approved audit plan. The Bupa UK Market Unit & BINS Audit Director reports to the CIA on a day to day basis;
has direct access to the Chair of the REAC as required to maximise independence and objectivity; and attends
the REAC and RERC, by invitation.
The Internal Audit function provides assurance over the effectiveness of governance, risk management and
internal controls. It reviews the effectiveness of controls by undertaking an agreed schedule of internal audits
each year. As the third line of defence, Internal Audit supports BINS in accomplishing its responsibilities by
helping the Board to safeguard the assets, reputation and sustainability of the organisation, and ensure risks to
the customer and the BINS business are appropriately managed. It reports its findings to the REAC and assists
both the Board and management to improve the effectiveness of governance, risk management and internal
controls.
Where specific skills are not available in house, the CIA and the Chair of the Committee have the ability to
procure the services of expert external advisers. During the year, PwC were appointed as Bupa’s first internal
audit co-sourcing provider.
The function acts in accordance with the Global Institute of Internal Auditors’ International standards. In addition to
a regular external assessment of the effectiveness of the function, the internal audit function maintains a quality
assurance and improvement programme that includes an evaluation of the function’s adherence to these
standards.
19
Bupa Insurance Limited Solvency and Financial Condition Report 2016
B.6 Actuarial function
BINS has implemented an Insurance Risk Policy. BINS’ actuarial function activities are conducted by qualified
actuaries in Bupa’s Centre Actuarial function, under the leadership of the Chief Actuary. The Actuarial function
has authority to review all areas of BINS and has full, free and unrestricted access to all activities, records,
property and personnel necessary to complete its work.
Key activities (including all mandatory tasks prescribed under Solvency II) are as follows:
Coordinating and consolidating UK PMI and IPMI technical provisions (for UK GAAP and Solvency II
reporting).
Assessing the appropriateness of technical provision methodology and assumptions used.
Setting methodologies and ensure consistency of use.
Ensuring that data quality and information technology systems meet the required standards.
Reporting to the RERC on the adequacy of technical provisions, the overall underwriting policy and adequacy
of reinsurance arrangements.
Contributing into risk management activities by undertaking the SCR calculation, periodic monitoring and
annual calculation of the USP for premium risk and validation of standard formula appropriateness through
development of the ECA.
Coordinating actuarial community development activity such as leading and sharing actuarial best practices,
and contributing to risk management practices.
An actuarial function report containing the Chief Actuary’s opinions, recommendations and an account of key
activities is prepared and provided to the RERC annually.
The Chief Actuary for BINS and Bupa’s Centre Actuarial team are independent of the Chief Actuaries in the
Business Units and their teams. This independence effectively eliminates any potential conflicts of interest arising
from the commercial responsibilities of Business Unit actuarial functions.
B.7 Outsourcing
BINS has implemented an Enterprise External Suppliers Policy. The purpose of this policy is to ensure that the
Company has effective processes for the selection, contracting and management of all suppliers, allowing the
risks posed by suppliers to be managed throughout the supplier relationship lifecycle. The policy is based on four
main principles; knowing our suppliers, selecting our suppliers, contracting with suppliers and managing our
suppliers. The policy applies to the suppliers of intra-group outsourcing arrangements as well as to suppliers who
are external to the Group.
All key, critical or important outsourced arrangements are required to be identified and managed with additional
rigour. The appointment of these arrangements must follow supplier selection criteria, with appropriate due
diligence and robust contracts in place following legal terms. Contingency measures must be in place and the
relationships managed by a named supplier relationship manager. The arrangements are reported to the local risk
and compliance team to assess the need for regulatory notification.
BINS chooses to outsource services where it is in the best interest of the Company, it conforms to its regulatory
standards and ensures the correct customer outcomes. BINS’ strategy is to form long-term strategic partnerships
with suppliers who share the same values, focus on customer service and have an understanding of the current
regulatory and risk landscape.
BINS continues to assess the need for outsourcing on an ongoing basis. Each outsourced activity is viewed on its
own merits against in-house capability, activity already outsourced and activity being undertaken. This allows
BINS to leverage the relevant external expertise to undertake the activity efficiently and effectively. With robust
oversight (systems & controls) this ensures the correct customer outcomes are achieved with reduced risks and
cost to serve.

20
Bupa Insurance Limited Solvency and Financial Condition Report 2016
Each outsourced supplier has a named supplier relationship manager. This individual is responsible for the
oversight of the arrangement and relationships ensuring appropriate safeguards are in place, such as termination
clauses, continuity plans and agreed service levels. The relationship manager is also responsible for holding
regular meetings to manage the relationship. Comprehensive dashboards have been created to manage the
outsourced suppliers.
Intra-group outsourcing
BINS outsources insurance administration and mediation activities to BISL via an agreement for services. BISL
outsources certain of these services to third parties, including claims processing to a provider located in India.
Where it has outsourced to third parties BISL is responsible for the oversight and management of these
relationships. BISL is required to comply with the Group’s Enterprise External Suppliers Policy, which is also the
basis of the BINS policy.
BISL services all UK PMI and a large proportion of the IPMI contracts that are written by BINS. The Latin America
book of business, and the IPMI business serviced primarily in Denmark are serviced through outsourcing
arrangements with Bupa Worldwide Corporation and USA Medical Services Corporation, and Bupa Denmark
Services A/S respectively.
BINS also outsources elements of its risk management, finance and governance, compliance, internal audit,
information technology, actuarial, treasury and people functions to fellow Group companies: BISL, Bupa Finance
Plc and Bupa.
External outsourcing
BINS has chosen to outsource some of its operational functions and activities to external providers, including
investment management in the UK and customer servicing to an outsource provider in Malta.
B.8 Any other information
There is no other material information to be disclosed.

21
Bupa Insurance Limited Solvency and Financial Condition Report 2016
C. Risk Profile (Unaudited)
General information
BINS’ risk profile is a key driver of the SCR. The distribution of the Company’s quantifiable risks, as reflected in
the SCR, is as follows:
Analysis of the SCR % of diversified SCR
2016
Underwriting risk 57%
Market risk 17%
Credit risk 4%
Operational risk 22%
100%
Information on each of the risk categories is provided in sections C.1 to C.5 below. Information is also provided on
liquidity risk in section C.4. Liquidity risk does not form part of the standard formula SCR and is therefore not
included in the above table.
Information on the calculation of the SCR is provided in section E.2 Solvency Capital Requirement and Minimum
Capital Requirement.
Risk Mitigation
As noted in section B.3.1 risks are managed according to a Board approved Risk Management Framework and
the effectiveness of our implementation of the Risk Management Framework is tested through the ICRMA.
Specific risk mitigations are identified in section C.1 to C.6 where relevant.
C.1 Underwriting risk
Underwriting risk affects future cash flows of the Company. It can be subdivided into pricing risk, claims risk and
reserving risk.
Pricing risk
Pricing risk arises from routine revisions to premium tariffs and from the processes, in certain cases, to set
bespoke premiums for large corporate health insurance customers. The adequacy of pricing rests on thorough
actuarial analysis of past and most recent claims levels, combined with forward projections of the most recent
observed trends. Pricing risk affects only future cash flows since new tariffs impact on levels of premium earned
when health insurance contracts renew.
The Company’s dominant product style is of an annually renewable health insurance contract. The annual
renewability feature permits tariff revisions to be made in response to changes in claim experience. This is a
significant mitigant to pricing risk. The Company underwrites no material business that commits it to cover risks at
premiums fixed beyond a twelve month period from inception or renewal.
Claims risk
Claims risk is the risk of failure to manage BINS exposure to claims inflation and fluctuations in claims leading to
losses. This can be driven by an adverse fluctuation in the amount and incidence of claims incurred, higher than
expected future claims on existing policies, and external factors such as medical inflation.
Claims risk is managed and controlled by means of pre-authorisation of claims, outpatient benefit limits, the use of
consultant networks and agreed networks of hospitals and charges.
Specific claims management processes vary across the Company depending on local conditions and practice.
Generally, the Company’s health insurance contracts contain terms and conditions that provide for the
reimbursement of incurred medical expenses for treatment related to acute medical conditions. The contracts do

22
Bupa Insurance Limited Solvency and Financial Condition Report 2016
not provide for capital sums or indemnified amounts. Therefore claims experience is necessarily underpinned by
prevailing rates of illness. Additionally, claims risk is generally mitigated by the Company running control
processes to ensure that both the treatments and the consequent reimbursements are appropriate.
Reserving risk
Reserving risk is the risk that technical provisions for claims incurred prove to be insufficient in light of later events
and claims experience. There is a relatively low exposure to reserving risk due to the short-term nature of claims
development patterns. The short-tail nature of the Company’s insurance contracts means that movements in
claims development assumptions are generally not significant. The development patterns are kept under constant
review to maintain the validity of the assumptions and hence, the validity of the estimation of recognised technical
provisions.
The amount of claims provision at any given time that relates to potential claims payments that have not been
resolved within one year is not material. Also, of the small provisions that do relate to longer than one year, it is
possible to predict with reasonable confidence the outstanding amounts.
Other risks related to underwriting health insurance business
Claims provisions are not discounted. The premiums provisions are discounted but their short-term nature means
that changes in interest rates have no material impact on reserving risk. In addition, the future premium income
and claims outflows of health insurance premium liabilities are not affected directly by changes in interest rates.
However, changes to inflationary factors such as wage inflation and medical provider cost inflation can affect the
financial soundness of health insurance business.
The Company only uses reinsurance in selected circumstances. Reinsurance contracts give rise to credit risk
which is described further in section C.3.
Concentrations of risk
Although the majority of the Company’s activities are single line health portfolios, the Company does not have
significant concentrations of insurance risk for the following reasons:
Product diversity between domestic PMI and expatriate IPMI, and individual and corporate health insurance.
A variety of claims type exposures across diverse medical providers - consultants, nursing staff, clinics,
individual hospitals and hospital groups.
The Company is exposed to the risk that a single event occurs in a location which would result in a large number
of claims. This is mitigated by writing a diverse portfolio of business, in particular group policies, both within and
across geographies.
Catastrophe risk
Either a natural disaster or a man-made disaster could potentially lead to a large number of claims and thus
higher than expected claims costs. In the majority of jurisdictions BINS is not liable for claims relating to these
risks. Bupa’s Centre Risk function oversees the risk management of this risk exposure, and Bupa’s Centre
Actuarial function oversees and implements strategic improvements to ensure overall adequacy of these
arrangements.
Underwriting risk sensitivity
For the year ended 31 December 2016 a £23m increase in claims would have resulted in a 1% increase in the
loss ratio and a reduction in the solvency coverage ratio from 160% to 151%.
C.2 Market risk
Market risk is the risk of adverse financial impact due to changes in fair values of financial instruments, arising
from fluctuations in interest rates, foreign exchange rates, commodity prices, credit spread and equity prices. The
focus of the Company’s long-term financial strategy is to facilitate growth without undue balance sheet risk.

23
Bupa Insurance Limited Solvency and Financial Condition Report 2016
The Company actively manages price risk by ensuring that the majority of its cash and investments is held with
highly rated credit institutions. For the portion of surplus cash invested in a limited portfolio of return seeking
assets (principally corporate bonds and loans), the Company uses a value at risk analysis to quantify risk, taking
account of asset volatility and correlation between asset classes. At year end 2016 BINS had loan assets of £66m
on its Solvency II balance sheet, primarily reflecting its investments in a loans portfolio as part of its return seeking
assets. The loans portfolio is managed by an external fund manager under an investment management
agreement set by BINS.
The approach to investment decision making is governed by the Board and its Investment Committee. The Board
determines the overall investment risk appetite for BINS which is articulated through the risk parameters
contained in the Treasury Policy and its Statement of Investment Principles. BINS’ Investment Committee is
responsible for setting the investment strategy and asset allocation, within the Board approved investment risk
appetite and the Treasury Policy. The day to day management of BINS’ financial investments is done by the
Group’s Centre Treasury function.
Foreign exchange risk
The Company is exposed to foreign exchange risks arising from commercial transactions and from recognising
assets, liabilities and investments in overseas operations. The majority of the foreign exchange exposures arise in
the IPMI business as a result of trading in non-sterling currencies. The IPMI business receives premiums in US
dollar and euro as well as sterling. Claims are primarily paid in these currencies but also in a range of other
currencies such as UAE dirham, South African rand, Hong Kong dollar and Singapore dollar.
In order to reduce the foreign exchange exposure generated by the IPMI business the Company has a hedging
programme in place to manage a large proportion of its material foreign currency economic balance sheet
exposures. This seeks to reduce the impact of foreign exchange risk on the Company’s economic balance sheet
and its capital position.
Interest rate risk
Interest rate risk is the risk that the fair value of future cash flows of a financial instrument will fluctuate because of
changes in market interest rates.
The Company is exposed to interest rate risk arising from fluctuations in market rates. This affects the return on
floating rate assets and the balance sheet value of its investment in fixed rate bonds. The Company’s interest rate
duration is agreed by the Investment Committee as part of strategic asset allocation, taking into account the short
interest rate duration of the Company’s liabilities and its investment risk appetite.
The Company’s sole interest bearing financial liability is the £330m subordinated loan from Bupa Finance Plc,
which is treated as capital under Solvency II reporting. This is a fixed interest liability which has no repayment
date, but BINS has an option to call it in 2020. If BINS does not exercise the call option, the interest rate will be
reset in 2020.
Market risk sensitivities
The following analysis shows the relative sensitivities of the Company’s estimated solvency coverage ratio as at
31 December 2016 to a variety of market conditions. These sensitivities are all independent stresses to a single
risk and do not take into account management actions or represent the Company’s expectation of future market
conditions.
Sensitivity analysis Coverage ratio post stress
Base case solvency coverage ratio 160%
Interest rate +/-100bps 160%
Credit spreads +100bps (assuming no credit transition) 160%
Equities market -20% 160%
Property values -10% 157%
Sterling appreciates by 10% 162%

24
Bupa Insurance Limited Solvency and Financial Condition Report 2016
Credit spreads are the differences between the risk free rates and the yields achieved on both corporate and
sovereign bonds.
Interest rate and credit spread sensitivities do not impact the solvency coverage ratio materially due to the strong
matching of assets and liabilities and the fact that investments are held with highly rated credit institutions.
C.3 Credit risk
Credit risk is the risk that the Company will suffer a financial loss as a result of a counterparty failing to meet all or
part of their contractual obligations. Bupa’s Centre Treasury function manages the Company’s credit risk under
the guidance of the Investment Committee.
Investment exposure with external counterparties is managed by ensuring there is a sufficient spread of
investments and that all counterparties are rated at least A by two of the three key rating agencies used by the
Company (unless specifically approved by the Investment Committee). Other factors are also considered
including credit default swap levels and counterparty specific information. All rating movements are reported to the
Investment Committee, which reviews the suitability of the counterparty for continued investment.
C.4 Liquidity risk
Liquidity risk is the risk that the Company will not have available funds to meet its liabilities when they fall due.
The Company’s liquidity risk is addressed by holding liquid assets and through controls.
The Company enjoys a strong liquidity position and adheres to strict liquidity management policies as set by its
Investment Committee. The liquidity management policy is reviewed at least annually.
Liquidity is managed by currency and by considering the segregation of accounts required for regulatory
purposes.
Expected profit included in future premiums
Under Solvency II, expected profit included in future premiums is included in Own Funds, recognised in the
calculation of technical provisions. Expected profit included in future premiums does not form part of the liquidity
position as 31 December, but is taken into consideration when assessing the Company’s future liquidity. Expected
profit included in future premiums amounted to £129m at 31 December 2016 (31 December 2015: £112m).
C.5 Operational risk
Operational risk is the risk of loss arising from inadequate or failed internal processes, or from personnel, systems
or external events. This includes conduct risk which is the risk that BINS’ behaviour or actions result in unfair
outcomes or detriment for customers.
The Company is committed to managing operational risk effectively. This includes continued close attention to
management of regulatory risk and proactive engagement with regulators. Maintenance of robust internal control
processes and governance frameworks, the approval of risk policies, and the assessment of compliance help
mitigate this risk.
The services provided by the Company are underpinned by information technology systems and infrastructure
that enable the delivery of core processes and products. Failure of these systems may reduce the ability of the
Company to deliver products and services to its customer base or increase the risk of information security
breaches.
The Company’s information technology services are provided by BISL, which has dedicated information
technology teams responsible for the development, maintenance and monitoring of information technology
services.
25
Bupa Insurance Limited Solvency and Financial Condition Report 2016
The Company has detailed business continuity plans for all businesses with dedicated specialised resource in
place to ensure appropriate operation of key processes and controls. Business continuity issues are reported to
the RE ERC, with significant issues being escalated to the RERC, which is responsible for ensuring appropriate
controls are in place to mitigate potential risks. As a result of the governance structures and controls in place,
there was no significant business disruption event during 2016.
Operational Risk does not lend itself to sensitivity analysis. Operational risk scenario analysis exercises are
conducted to provide an understanding of the specific risks that BINS faces on a daily basis, the likelihood of them
occurring and the severity of the impact if they were to occur. This understanding allows for a more focused
allocation of resources targeted at mitigating or controlling the more material exposures.
C.6 Other material risks
The Company is also exposed to strategic risk, being the risk of an inability to design or implement appropriate
business plans and strategies, make decisions, allocate resources, or adapt to changes in the business
environment. The political and economic backdrop to BINS’ business is uncertain, with powerful global social
trends. Populations are ageing, public health solutions are continuously evolving, governments are facing funding
issues in healthcare and aged care, and competition is intense, both from traditional and non-traditional players.
In order to effectively manage strategic risk, the Company has refreshed its strategy, and remains focused on
delivering great customer outcomes and long-term profitable growth. Through the identification and assessment of
emerging risks the Board is able to react to issues in a timely and appropriate manner.
C.7 Any other information
C.7.1 Prudent person principle
BINS investments operate in accordance with the prudent person principle. BINS approach to investment is as
follows:
The Board is responsible for setting the overall investment risk appetite for BINS which is articulated through
the risk parameters contained in the Treasury Policy and its Statement of Investment Principles. The Board
approves the expected investment return as part of the annual operating plan process and monitors
investment performance against plan on a monthly basis.
The BINS Investment Committee is responsible for setting investment strategy and asset allocation, within the
Board approved risk parameters contained within the Treasury Policy and the Statement of Investment
Principles. The Investment Committee reviews and monitors the key risk indicators for the investments
including the performance against targets, the value at risk, counterparty exposures, overall credit rating
exposures and liquidity levels.
C.7.2 Stress and scenario testing
A key part of BINS’ risk management framework involves identifying the scenarios that could adversely impact the
Company and assessing its ability to withstand them. The stress and scenario testing evaluates the impact of
adverse scenarios on the Company’s business plans, including an assessment of whether the Company will
continue to have sufficient capital resources to cover both its own assessment of risks and regulatory capital
requirements as well as the liquidity implications of the scenarios.
There are two parts to the scenario testing performed by BINS, one exercise which considers impacts of a
scenario specific to BINS and a second Group wide exercise, which applies consistent stress and scenario tests
across the Group, including BINS.
The scenarios are calibrated to reflect a 1-in-20 year probability and are carried out in accordance with standard
stress testing methodology used across the insurance industry. The 2016 scenarios considered the impact of
significant adverse regulatory or governmental changes in our key insurance markets, in the context of depressed
economic conditions. The BINS specific scenario testing included consideration of a short-term restriction to
distribute through intermediaries combined with an accelerated increase in Insurance Premium Tax.

26
Bupa Insurance Limited Solvency and Financial Condition Report 2016
Under each of the scenarios tested, the Company continues to have a surplus in excess of its SCR over the
business planning period without the need for management actions, the first of which would be to reduce dividend
payments.
BINS also conducts reverse stress testing which starts at the point of failure of the BINS business model and aims
to identify a scenario that may result in such a failure.
The results of the stress and scenario testing are reviewed by the RERC as part of the business planning process
and are a key element of the ORSA.

27
Bupa Insurance Limited Solvency and Financial Condition Report 2016
D. Valuation for Solvency Purposes (Audited)
Solvency II requires an economic market consistent approach to the valuation of assets and liabilities. A number
of assets and liabilities require different valuation methods to those used in the financial statements included in
BINS’ Annual Report and Accounts for the year ended 31 December 2016. The financial statements are prepared
under UK GAAP. The Company applies UK Financial Reporting Standard 101, where the measurement
requirements of International Financial Reporting Standards, as adopted by the EU, are applied. The table below
provides a summary of the Solvency II and the UK GAAP valuation of assets, based on the Solvency II balance
sheet headings and the Solvency II approach to classifying assets and liabilities. An explanation of the Solvency II
valuation methods is provided in the following sections.
Solvency II UK GAAP Difference
Assets
Section
2016 £m
20151
£m 2016
£m 2015
1
£m 2016
£m 2015
1
£m
Deferred acquisition costs D.1.1 - - 58 55 (58) (55)
Property, plant and equipment D.1.2 89 70 89 70 - -
Investments D.1.3 894 1,130 687 1,062 207 68
Loans and mortgages D.1.4 66 202 65 201 1 1
Reinsurance recoverables D.1.5 43 48 50 48 (7) -
Insurance and intermediaries receivables D.1.6 122 53 671 608 (549) (555)
Reinsurance receivables D.1.6 3 17 3 17 - -
Receivables (trade, not insurance) D.1.7 82 62 82 62 - -
Cash and cash equivalents D.1.8 120 81 243 79 (123) 2
Any other assets, not elsewhere shown D.1.9 74 37 74 37 - -
Total assets 1,493 1,700 2,022 2,239 (529) (539)
Liabilities
Technical provisions D.2 542 499 1,277 1,224 (735) (725)
Provisions other than technical provisions 5 5 5 5 - -
Deposits from reinsurers 6 3 6 3 - -
Deferred tax liabilities D.3.1 26 29 5 6 21 23
Derivatives (liabilities) D.3.2 84 70 - 2 84 68
Reinsurance payables D.3.3 9 18 9 18 - -
Insurance and intermediaries payables D.3.4 35 - 35 8 - (8)
Payables (trade, not insurance) D.3.5 47 61 47 61 - -
Subordinated liabilities in BOF D.3.6 384 382 336 336 48 46
Any other liabilities, not elsewhere shown D.3.7 92 64 92 64 - -
Total liabilities 1,230 1,131 1,812 1,727 (582) (596)
Excess of assets over liabilities 263 569 210 512 53 57
1. The 2015 comparative data presented in section D. Valuation for Solvency Purposes and section E. Capital Management is unaudited.
The overall difference in the excess of assets over liabilities is due to the following valuation differences:
Valuation differences
2016 £m
2015 £m
Assets
Financial investments 1 2
Liabilities
Technical provisions 121 124
Deferred tax liabilities (21) (23)
Subordinated liabilities (48) (46)
Total valuation differences 53 57
Other differences between the UK GAAP and Solvency II value of individual asset and liability classes relate to
reclassifications, as noted in the respective sections below.

28
Bupa Insurance Limited Solvency and Financial Condition Report 2016
D.1 Assets
D.1.1 Deferred acquisition costs
Acquisition costs represent commissions payable and other expenses related to the acquisition of insurance
contract revenues written during the financial year. These are not permissible under Solvency II, therefore the
deferred acquisition costs and deferred ceding commissions balances are valued at nil.
D.1.2 Property, plant and equipment
Property, plant and equipment held for own use are the physical assets used by the Company to carry out
business activities and generate revenues and profits.
In the UK GAAP financial statements, properties are held using the revaluation method under IAS 16, which is
consistent with Solvency II valuation principles. Hence no adjustment is required from UK GAAP to Solvency II.
D.1.3 Investments
The Company generates cash from its underwriting, trading and financing activities and invests the surplus cash
in financial investments. These include government bonds, corporate bonds, pooled investments funds and
deposits with credit institutions.
2016 2015 Investments – Solvency II values £m £m
Participations 3 2
Government bonds 26 32
Corporate bonds 305 267
Collective investments undertakings 141 233
Derivative assets 86 68
Deposits other than cash equivalents 332 526
Other investments 1 2
Total Investments 894 1,130
Financial investments are recognised in the Solvency II balance sheet at fair value. Fair values are calculated as
follows:
Debt securities, shares and other variable yield securities: quoted price if available (or, if not, quoted prices of
similar assets) or discounted expected future principal and interest cash flows based on observable data in
active market.
Derivatives: fair values are obtained from market observable pricing information including interest rate yield
curves.
The value of foreign exchange forward contracts is established using listed market prices. Fair values have been
calculated for each type of derivative as follows:
The fair value of currency forward contracts, swaps and options is determined using forward exchange rates
derived from market sourced data at the balance sheet date, with the resulting value discounted back to
present value.
The fair value of interest rate swaps is determined as the present value of the estimated future cash flows
based on observable yield curves.
The fair values of quoted investments in active markets are based on current bid prices. A market is considered
active when there are listed prices publicly available at which trades can be made without significant delay and
when transactions take place with sufficient frequency and volume to provide pricing information on an ongoing
basis.
The fair values of unlisted securities, and quoted investments for which there is no active market, are established
using valuation techniques. At 31 December 2016 and 31 December 2015 the Company did not hold financial
investments for which such valuation techniques were required.

29
Bupa Insurance Limited Solvency and Financial Condition Report 2016
In the UK GAAP financial statements, the Company has classified its financial investments into the following
categories: available for sale, at fair value through profit and loss, held to maturity and loans and receivables.
Financial investments classified as available for sale and at fair value through profit and loss are held at fair value.
The UK GAAP fair value measurement principles are considered to be consistent with Solvency II requirements
and therefore no adjustments are made for Solvency II reporting.
Financial investments classified as held to maturity and loans and receivables are measured in the UK GAAP
financial statements at amortised cost calculated using the effective interest method, less impairment losses. In
the Solvency II balance sheet the carrying value of these assets is adjusted to fair value.
Classification differences exist between Solvency II and UK GAAP for certain financial investment balances.
Derivative assets and liabilities held in segregated funds are reported separately as assets and liabilities for
Solvency II purposes, whereas under UK GAAP derivatives are presented net where the right to offset exists.
Cash and cash equivalents are classified differently between UK GAAP and Solvency II. Under UK GAAP an
investment qualifies as a cash and cash equivalent only when it has a short maturity of, say, three months or less
from the date of acquisition whereas under Solvency II assets are classified by means of a Complementary
Identification Code based upon an asset’s characteristic. Money market funds and deposit less than 90 days are
classified as cash and cash equivalents under UK GAAP, however, they are classified as collective investments
undertakings and deposits other than cash equivalents for Solvency II reporting, respectively.
D.1.4 Loans and mortgages
Under UK GAAP, loans are measured at amortised cost calculated using the effective interest method, less
impairment losses, whereas under Solvency II these are measured at fair value. The fair value of loans and
mortgages is established using discounted expected future principal and interest cash flows.
D.1.5 Reinsurance recoverables
Reinsurance recoverables represent the reinsurer’s share of technical provisions. Refer to Section D.2 for further
details on technical provisions.
D.1.6 Insurance and intermediaries receivables, reinsurance receivables
As required in the Solvency II guidance the portion of premiums receivable, recognised as an asset on the UK
GAAP balance sheet, that are not yet due are transferred to technical provisions in the Solvency II balance sheet.
Overdue premium debtors are not reclassified to technical provisions and remain within ‘insurance and
intermediaries receivables’ on the balance sheet.
Under UK GAAP receivables are valued at undiscounted amortised cost less any adjustment for expected default.
Given the short-term maturity of these assets, the UK GAAP valuation policy is considered to be a close
approximation to fair value, and therefore no adjustments are made for Solvency II reporting purposes.
D.1.7 Receivables (trade, not insurance)
Under UK GAAP receivables are valued at undiscounted amortised cost less any adjustment for expected default.
Given the short-term maturity of these assets, the UK GAAP valuation policy is considered to be a close
approximation to fair value, and therefore no adjustments are made for Solvency II reporting purposes.
D.1.8 Cash and cash equivalents
Cash and cash equivalents in the Solvency II balance sheet consist of deposits that can be exchanged for
currency on demand at par value and are valued at their par value. There is therefore no difference between the
value of cash and cash equivalents in the Solvency II balance sheet and the value of cash in hand and at bank in
the UK GAAP balance sheet.
Cash and cash equivalents are classified differently between UK GAAP and Solvency II. Refer to D.1.3 for
additional information.

30
Bupa Insurance Limited Solvency and Financial Condition Report 2016
D.1.9 Any other assets, not elsewhere shown
Any other assets are made up of the following items:
2016 2015
Solvency II balance sheet £m £m
Prepayments 6 6
Amounts owed by Bupa Group undertakings 59 23
Other assets 9 8
Total 74 37
BINS values other assets at undiscounted amortised cost less any adjustment for expected default. Given the
short-term maturity of these assets, this is considered to be a close approximation to fair value. Therefore no
adjustment is required for Solvency II purposes.
D.1.10 Assumptions and judgements
Judgements made by management in applying the Company’s valuation policies that have a significant effect on
the balance sheet, and estimates with a significant risk of material adjustment in subsequent periods, are set out
in the related sections:
Property valuations (D.1.2)
Financial investments (D.1.3).
D.2 Technical provisions
D.2.1 Summary
The technical provisions for solvency purposes are an estimate of the cost at which insurance contracts could be
transferred to another knowledgeable insurer in an arm’s length transaction. The value of technical provisions for
solvency purposes, as at 31 December 2016 and 31 December 2015, were as follows:
2016
Technical provisions
Gross medical
expense £m
Gross assistance
£m
Re- insurance
£m Net £m
Claims provision – health (similar to non-life) 255 7 (15) 247
Premium provision – health (similar to non-life) 254 12 (28) 238
Risk margin 14 - - 14
Technical provisions 523 19 (43) 499
2015
Technical provisions
Gross medical
expense £m
Gross assistance
£m
Re- insurance
£m Net £m
Claims provision – health (similar to non-life) 232 3 (12) 223
Premium provision – health (similar to non-life) 246 5 (36) 215
Risk margin 13 - - 13
Technical provisions 491 8 (48) 451
The technical provisions are not calculated as a whole but are calculated as the sum of the best estimate liability
and a risk margin. The best estimate liability comprises a claims provision (for claims and expenses incurred prior
to the valuation date) and a premium provision (for claims and expenses expected to be incurred between the
valuation date and the contract boundary).
BINS’ gross technical provisions for medical expense insurance business calculated at 31 December 2016 were
£523m (2015: £491m). The main reasons for the increase are a combination of a weakening of sterling against
other major currencies for IPMI business and an increase in reported but not settled UK PMI claims due to the
timing of batch payments to providers in December, partially offset by an increase in the adjustment to remove
expected profits.

31
Bupa Insurance Limited Solvency and Financial Condition Report 2016
BINS also writes a small amount of assistance business, with gross technical provisions of £19m at 31 December
2016 (2015: £8m). The increase is mainly due to a refinement made in the methodology to value cash flows for
assistance business separately.
BINS’ medical expenses business comprises UK PMI and IPMI business. The latter includes both direct insurance
and proportional reinsurance accepted from other Bupa entities and local insurance partners.
BINS actively manages its health insurance claims cost, the impact of which is reflected in the assumptions used
to set the technical provisions. Implicitly, the effectiveness of such management actions is assumed to apply to all
future claims anticipated in the technical provisions.
The technical provisions calculations do not apply the matching adjustment, volatility adjustment or transitional
measures referred to in Articles 77 (b),(d) and 308(c),(d) of Directive 2009/138/EC.
D.2.2 Claims provision
The claims provision represents the estimated cost of claims incurred but not settled as at the balance sheet date.
The provision includes an allowance for claims management and claims handling expenses.
The ultimate cost of outstanding claims is estimated using a range of standard actuarial claims projection
techniques, such as the Chain Ladder and Bornhuetter-Ferguson methods. The key assumption for these
methods is that past claims settlement patterns are an appropriate predictor of expected future claims settlement
patterns. This assumption is adjusted where appropriate, using expert judgement.
The methods and data for the claims provision are the same as those used for the outstanding claims provision
(OCP) reported in the financial statements under UK GAAP, with a small difference arising from the exclusion of a
prudence margin (£6m). Under UK GAAP, a best estimate is determined on an undiscounted basis and then a
margin of prudence is added such that there is confidence that future claims will be met from the provisions. The
Solvency II claims provision is also undiscounted. Almost all outstanding claims are settled within a year, hence
the impact of discounting would be immaterial.
BINS’ OCP processes are subject to annual review against the Group’s claims reserving standards. The year end
2016 review concluded that the OCP was appropriate and that the processes, including documentation, met the
standards in all material respects.
D.2.3 Premium provision
The premium provision represents the estimated cost of future claims and expenses arising from current and
bound insurance contracts, net of future premium receipts. The premium provision is the expected present value
of all future cashflows relating to risk exposure after the valuation date.
Under Solvency II, UK GAAP balances that relate to future claims exposure are adjusted to the best estimate of
future cashflows. The following adjustments are applied:
Deferred acquisition costs are not recognised.
Not overdue insurance receivables are recognised as a future cashflow in technical provisions rather than as
a separate asset in the balance sheet.
The UK GAAP unearned premium provision and any unexpired risk provision are adjusted to remove future
profits in excess of deferred acquisition costs.
The cost of future claims and expenses is estimated using actuarial projections of members covered by current
insurance contracts and assumptions for expected claims and expenses incurred per member. These
assumptions are based on current year experience appropriately adjusted for trends, inflation and discounting.
Where relevant, the projection of future cash flows allows for the expected lapse behaviour of members (mid-term
lapses and non-renewal lapses) in the period until the contract boundary.

32
Bupa Insurance Limited Solvency and Financial Condition Report 2016
A pure risk cost assumption is used to project claims expected to be paid. Expected claims are derived for the
claim cost per member for each homogeneous risk group and appropriately adjusted for claims inflation and any
expected changes in the mix of business.
Future claims are expected to increase in line with claims inflation.
The allowance for expenses in the technical provision is on a going concern basis, indirect overhead expenses
are allocated on the assumption that the entity continues writing new business and volumes continue at the same
level. Expense allowance includes:
claims management and handling expenses for future claims
commission
administrative expenses incurred in the servicing of policies
overheads, including central costs.
New business costs that are incurred before the contract recognition date are excluded, e.g. general marketing,
lead generation and medical underwriting costs.
Claims management expenses are expressed as a percentage of projected paid claims amounts. The percentage
will be consistent with the claims provision calculation.
D.2.4 Reinsurance recoverables
The Company has a portfolio transfer reinsurance contract with Bupa Insurance Company, domiciled in Florida.
Under this arrangement, 100% of the insurance risk relating to a closed book of Latin American business is
transferred to Bupa Insurance Company. The value of reinsurance share of technical provisions ceded to Bupa
Insurance Company reported on the Solvency II basis is taken to be the same as the value on the UK GAAP
basis, as any difference would not be material.
D.2.5 Risk margin
The risk margin of £14m was estimated using the Solvency II ‘cost of capital’ approach, which is intended to
reflect the total consideration (when included with the best estimate liability) that would be required by a third party
insurer to take over the full liability. This was estimated by applying a 6% cost-of-capital charge to the sum of the
present value of projected unhedged SCR in each future year until the liabilities have been discharged. The rate
of 6% is prescribed in the Solvency II regulations.
A risk margin is added to the best estimate provisions to allow for the inherent uncertainty of future cashflow
projections. This uncertainty generally relates to the risk that past claims trends may not apply in the future, for
example, as a result of changes in public healthcare provision, economic conditions or claims management
procedures.
D.2.6 Methodology and assumption changes
There have been no material changes in the methodology to calculate technical provisions during the reporting
period. The actuarial models to calculate the premium provision have been refined further to more accurately
reflect the intended methodology. These model changes resulted in a reduction of the premium provision by
£17m.
The assumptions to project future claims and expense have been updated to reflect the current year experience
together with expected changes in trends and inflation.
D.2.7 Reconciliation to financial statements
The key differences in the valuation of insurance contracts for solvency purposes relate to the use of best
estimate assumptions compared with the use of prudent assumptions under UK GAAP. In addition, UK GAAP
insurance receivables are not recognised as assets in the solvency balance sheet but are instead netted off
against the value of technical provisions for solvency purposes.

33
Bupa Insurance Limited Solvency and Financial Condition Report 2016
2016
Reconciliation to UK GAAP financial statements
Medical Expense
£m
Assistance
£m
Total
£m
Technical provisions for financial statements – net of reinsurance 1,207 20 1,227
Deferred acquisition costs (57) (1) (58)
Technical provisions for financial statements – net of reinsurance and deferred acquisition cost 1,150 19 1,169
Reclassification of future premium:
Insurance and intermediary receivables (not overdue) (547) (2) (549)
Fair value adjustments:
Removal of future profit from premium provision (131) 2 (129)
Removal of UK GAAP prudence margin – claims provision (6) - (6)
Risk margin 14 - 14
Technical provisions for solvency – net of reinsurance 480 19 499
D.2.8 Level of uncertainty
Technical provisions are calculated using actuarial models that include the use of key assumptions based on
historical and current year experience. Future claims payments, related expenses and lapse rates are subject to
random fluctuations and trends, which may lead to actual experience differing from that implied by these
assumptions.
The inherent uncertainty of future cash flows is low, which is reflected in the level of risk margin held. This low
level of uncertainty reflects the short-tailed nature of BINS’ insurance business, and the relatively predictable
claims pattern.
D.3 Other liabilities
D.3.1 Deferred tax liabilities
Deferred tax is calculated on the difference between the values ascribed to certain assets and liabilities
recognised and valued for Solvency II purposes and the values ascribed to assets and liabilities as recognised
and valued for tax purposes. The valuation of deferred tax assets and liabilities is based on the principles
prescribed by IAS 12, whereby a deferred tax asset or liability can be recognised on temporary difference where it
is probable that they will reverse in future periods.
Deferred tax is calculated by applying the UK tax rate to the relevant Solvency II balance sheet adjustments to
arrive at an Own Funds deferred tax position.
2016 2015 Deferred Tax £m £m
UK GAAP deferred tax liability 5 6
Increase in deferred tax liability 21 23
Solvency II deferred tax liability 26 29
D.3.2 Derivatives
Derivatives liabilities are recognised and subsequently measured at fair value (refer to section D.1.3 for details).
No adjustment is made for any changes to the Company’s own credit standing.
The total balance of derivative assets and liabilities at 31 December 2016 is due within 12 months. The level of
uncertainty in the valuation of derivative liabilities is considered low as it is based on quoted market prices or
executable broker quotes.
For Solvency II purposes, derivative assets and liabilities held in segregated funds are reported separately as
assets and liabilities, whereas under UK GAAP derivatives are presented net where the right to offset exists. At 31
December 2016 this resulted in a £84m classification difference between investments and derivative liabilities
when comparing UK GAAP and Solvency II.

34
Bupa Insurance Limited Solvency and Financial Condition Report 2016
D.3.3 Reinsurance payables
Under UK GAAP reinsurance payables are held at amortised cost. Given the short-term maturity of these
liabilities, this is considered to be a close approximation to fair value.
All material reinsurance payables are due within 12 months.
D.3.4 Insurance and intermediaries payables
Insurance and intermediaries payables relate to creditors arising out of direct insurance operations. Under UK
GAAP insurance and intermediary payables are held at amortised cost. Given the short-term maturity of these
liabilities, this is considered to be a close approximation to fair value.
All material reinsurance payables are due within 12 months.
D.3.5 Payables (trade, not insurance)
The UK GAAP trade payables are carried at amortised cost using the effective interest method. Given the short-
term maturity of these liabilities, this is considered to be a close approximation to fair value. Therefore no
adjustment is required from UK GAAP to Solvency II.
All material trade payables are due within 12 months.
D.3.6 Subordinated liabilities in Basic Own Funds (BOF)
BINS’ subordinated liabilities are those which exhibit similar characteristics to equity: perpetual in nature, deferral
of interest payments and their place in the order in which creditors are paid in the case of the Company being
wound up. As these liabilities would only be redeemed after meeting the needs of the customer and settling trade
related payables, the subordinated liabilities were classified as upper tier 2 under the Solvency I regime and by
virtue of the Solvency II transitional provisions qualify as Own Funds for Solvency II purposes.
The Company has a £330m subordinated loan from Bupa Finance Plc which has been classified as tier 1
restricted Own Funds. As at 31 December 2016 the Solvency II fair value of the subordinated loan is £384m
(2015: £382m). Further details on the subordinated loan are provided in section E.1.3 Subordinated perpetual
loan.
Subordinated liabilities are included in the Solvency II balance sheet at fair value. Fair value is calculated on a
discounted projected cash flows basis, using a market yield adjusted to remove the effects of any change in the
Company’s credit standing. In the UK GAAP balance sheet they are valued at amortised cost using the effective
interest method. The valuation requires an assumption to be made with respect to the portion of the yield to
maturity that relates to the Company’s credit risk, derived by comparing the yield to maturity to that of government
bonds of similar duration and currency. The level of valuation uncertainty arising from this method is considered
low on the basis that there is an active market for government bonds against which reference can be made.
D.3.7 Any other liabilities, not elsewhere shown
Any other liabilities are made up of the following items:
2016 2015
Solvency II balance sheet £m £m
Accruals 6 2
Amounts owed to Bupa Group undertakings 44 28
Other payables 17 11
Deferred Income 25 23
Total 92 64
Other liabilities are held at amortised cost under UK GAAP. Given the short-term maturity of these liabilities, this is
considered to be a close approximation to fair value. Therefore no adjustment is required for Solvency II
purposes. All material liabilities included in this balance are due within 12 months.

35
Bupa Insurance Limited Solvency and Financial Condition Report 2016
D.3.8 Contingent liabilities
Contingent liabilities are recognised in the Solvency II balance sheet when they are material. They are measured
at fair value, using probability weighted cash flow calculations, discounted where the impact of discounting would
be material. In the UK GAAP balance sheet contingent liabilities are not recognised. When it is more probable
than not that there will be an out flow of economic benefits a provision is recognised. At 31 December 2016 the
Company did not have any material contingent liabilities.
D.4 Alternative methods for valuation
There are no material assets or liabilities for which alternative valuation methods are used, other than the
valuation of subordinated liabilities as described in section D.3.6.
D.5 Any other information
The Company has no material off balance sheet liabilities.
Information on leasing arrangements is provided in Section A.4.
There is no other material information to be disclosed.
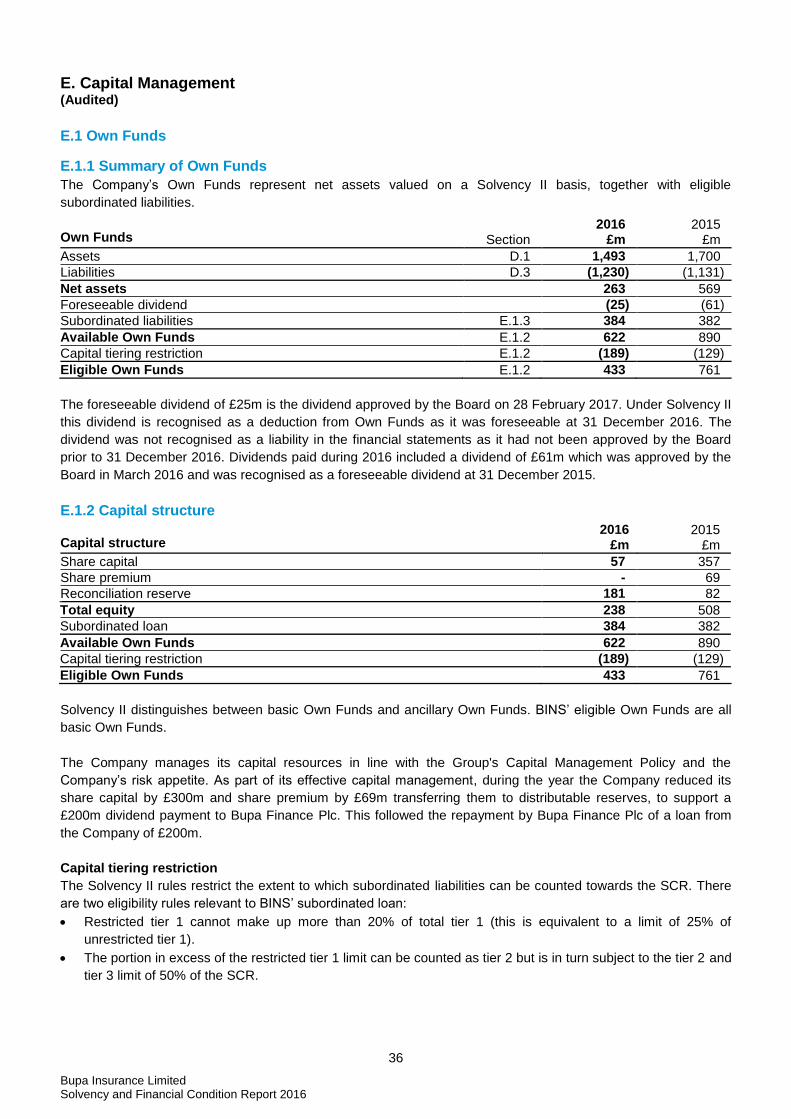
36
Bupa Insurance Limited Solvency and Financial Condition Report 2016
E. Capital Management (Audited)
E.1 Own Funds
E.1.1 Summary of Own Funds
The Company’s Own Funds represent net assets valued on a Solvency II basis, together with eligible
subordinated liabilities.
Own Funds Section 2016
£m 2015
£m
Assets D.1 1,493 1,700
Liabilities D.3 (1,230) (1,131)
Net assets 263 569
Foreseeable dividend (25) (61)
Subordinated liabilities E.1.3 384 382
Available Own Funds E.1.2 622 890
Capital tiering restriction E.1.2 (189) (129)
Eligible Own Funds E.1.2 433 761
The foreseeable dividend of £25m is the dividend approved by the Board on 28 February 2017. Under Solvency II
this dividend is recognised as a deduction from Own Funds as it was foreseeable at 31 December 2016. The
dividend was not recognised as a liability in the financial statements as it had not been approved by the Board
prior to 31 December 2016. Dividends paid during 2016 included a dividend of £61m which was approved by the
Board in March 2016 and was recognised as a foreseeable dividend at 31 December 2015.
E.1.2 Capital structure
Capital structure 2016
£m 2015
£m
Share capital 57 357
Share premium - 69
Reconciliation reserve 181 82
Total equity 238 508
Subordinated loan 384 382
Available Own Funds 622 890
Capital tiering restriction (189) (129)
Eligible Own Funds 433 761
Solvency II distinguishes between basic Own Funds and ancillary Own Funds. BINS’ eligible Own Funds are all
basic Own Funds.
The Company manages its capital resources in line with the Group's Capital Management Policy and the
Company’s risk appetite. As part of its effective capital management, during the year the Company reduced its
share capital by £300m and share premium by £69m transferring them to distributable reserves, to support a
£200m dividend payment to Bupa Finance Plc. This followed the repayment by Bupa Finance Plc of a loan from
the Company of £200m.
Capital tiering restriction
The Solvency II rules restrict the extent to which subordinated liabilities can be counted towards the SCR. There
are two eligibility rules relevant to BINS’ subordinated loan:
Restricted tier 1 cannot make up more than 20% of total tier 1 (this is equivalent to a limit of 25% of
unrestricted tier 1).
The portion in excess of the restricted tier 1 limit can be counted as tier 2 but is in turn subject to the tier 2 and
tier 3 limit of 50% of the SCR.

37
Bupa Insurance Limited Solvency and Financial Condition Report 2016
The effect of the eligibility rules is that £189m (2015: £129m) of the subordinated perpetual loan is ineligible, as
indicated in the following table:
Eligibility limits 2016
£m 2015
£m
Maximum tier 2 and tier 3 (50% of SCR) 136 126
Maximum restricted tier 1 (25% of unrestricted tier 1) 59 127
Maximum eligibility 195 253
Subordinated loan - tier 1 384 382
Excess of subordinated loan over eligibility limits 189 129
Own Funds by tier
Eligible Own Funds to meet the SCR of £433m as at 31 December 2016 comprise £238m unrestricted tier 1,
£59m restricted tier 1 and 136m tier 2. Eligible Own Funds to meet the MCR are subject to a further restriction in
that the eligible amount of tier 2 items shall not exceed 20% of the MCR. Eligible Own Funds to meet the MCR as
at 31 December 2016 are £322m, comprising £238m unrestricted tier 1, £59m restricted tier 1 and £25m tier 2.
E.1.3 Subordinated perpetual loan
BINS’ available Own Funds include a £330m perpetual subordinated loan with a Solvency II fair value of £384m
(2015: £382m). The subordinated loan is payable to Bupa Finance Plc, a fellow Group company. The loan has no
fixed repayment date but BINS has an option to call it on 16 September 2020. Interest is payable at 6.25% per
annum to the first call date of 16 September 2020 and thereafter at a fixed spread over the relevant benchmark
gilt. The movement in the fair value of the loan during the year is due to changes in market interest rates.
The subordinated loan was classified as upper tier 2 under the Solvency I regime and by virtue of the Solvency II
transitional provisions qualifies as restricted tier 1 under Solvency II.
Bupa Finance Plc has issued £330m of callable perpetual guaranteed bonds on the London Stock Exchange.
BINS acts as guarantor on the issue, irrevocably guaranteeing the bonds on a subordinated basis. Were BINS to
repay part or all of the guaranteed bonds, the amount paid would be deducted from balances owed to Bupa
Finance Plc.
E.1.4 Comparison with UK GAAP equity
The following table provides an explanation of the differences between UK GAAP equity and the Solvency II
excess of assets over liabilities:
Section
2016 £m
2015 £m
UK GAAP equity attributable to shareholders 210 512
Valuation differences:
Assets D.1 1 2
Technical provisions D.2 121 124
Other liabilities D.3 (69) (69)
Solvency II excess of assets over liabilities 263 569
The valuation differences at 31 December 2016 are as follows:
Assets: within financial investments, loans and receivables together with held to maturity investments are
carried at amortised cost under UK GAAP but are adjusted to fair value under Solvency II giving rise to a £1m
valuation difference.
Technical provisions: under UK GAAP technical provisions include an outstanding claims provision, an
unearned premium provision and, if required, an unexpired risk provision. Solvency II technical provisions are
made up of future best estimate cash flows (claim payments, expenses and future premiums) in relation to the
insurance and/or reinsurance obligations, discounted to the present term using risk-free rates of interest.
Solvency II technical provisions also consist of a risk margin which is the balance over and above the best
estimate liabilities that another insurer would require to take over the liabilities as at the valuation date. The
net impact of applying the different bases is £121m.
Liabilities: under UK GAAP BINS holds the subordinated loan at amortised cost on an effective interest basis.
This is adjusted to fair value under Solvency II, excluding BINS’ credit risk, giving rise to a £48m increase in

38
Bupa Insurance Limited Solvency and Financial Condition Report 2016
liabilities. Deferred tax is calculated on the temporary differences between tax base values and UK GAAP
balances. Adjustments from UK GAAP to Solvency II give rise to a £21m increase in deferred tax liabilities.
E.1.5 Change in Own Funds
The movement in Own Funds during 2016 is analysed below:
Eligible Own Funds 2016
£m
At beginning of year 761
Profit for the year as reported in the Company’s financial statements 108
Movement in valuation differences (4)
Increase in fair value of subordinated liabilities 2
Dividends paid during the year (410)
Foreseeable dividends - 2015 61
Foreseeable dividends - 2016 (25)
Increase in tiering adjustment (60)
At end of year 433
The £328m decrease in Own Funds is mainly driven by dividends paid of £410m, offset by the profit for the year
of £108m. The dividend payments and the reduction in Own Funds are consistent with the Board risk appetite and
the Company’s approved dividend policy. The 2015 foreseeable dividend of £61m is included in the dividends
paid during the year of £410m.
E1.6 Capital management policy and processes
The Company’s capital management objective is to maintain sufficient capital to safeguard the Company’s ability
to continue as a going concern and to protect the interests of all of its customers, investors, regulators and trading
partners while also efficiently deploying capital and managing risk to sustain ongoing business development. The
Company maintains a prudent buffer over the SCR.
The Company manages its capital resources in line with the Group’s Capital Management Policy, which is
reviewed on an annual basis.
At least annually, the Company carries out an ECA in which it makes its own quantification of how much capital is
required to support its risks and each year the Company produces a medium-term capital management plan for
the following three years. The plan includes projections of Own Funds and SCR, with consideration of the ECA,
over the planning period.
The Company’s capital position is kept under constant review and is reported monthly to the Board.
Other than disclosed above there have been no changes to what is managed as capital or to the Company’s
capital management objectives, policies or procedures during the year.
E.2 Solvency Capital Requirement and Minimum Capital Requirement
The table below shows the breakdown of the BINS SCR by the standard formula risk modules.
SCR by risk module 2016
£m 2015
£m
Market risk 91 91
Underwriting risk 216 211
Credit risk 32 21
Basic SCR before diversification 339 323
Diversification (86) (78)
Basic SCR after diversification 253 245
Operational risk 72 67
Loss absorbency of deferred tax (54) (60)
Total SCR diversified 271 252

39
Bupa Insurance Limited Solvency and Financial Condition Report 2016
The BINS SCR has been calculated using the standard formula specified in the Solvency II legislation, modified
by a USP for determining premium risk SCR. BINS has obtained approval from the PRA to substitute the
insurance premium risk parameter with a USP which reflects BINS’ own loss experience. The PRA allows the
impact of USPs to not be publicly disclosed during a transitional period which includes the year ended 31
December 2016.
The Solvency II SCR is held to protect against an instantaneous 1-in-200 year loss. In the same way that a large
profit typically creates a tax liability, a large loss could potentially create a tax asset. In the context of Solvency II,
this is called a notional deferred tax asset and can be used to reduce the SCR for BINS. The reduction to the SCR
arising from the recognition of this notional deferred tax asset is referred to as loss absorbency of deferred tax. At
present, BINS allows for the deferred tax liabilities and the amount of paid taxes that can be recovered from
carrying back losses. However, no allowance is made for the notional amount of deferred tax assets that can be
carried forward and offset against taxes on anticipated future profits.
BINS does not use simplification calculations as allowed for under the Solvency II Directive in determining the
standard formula SCR.
The BINS SCR has increased by £19m since December 2015, from £252m to £271m. The main driver of the
increase is movement in foreign exchange rates. Over the year sterling has weakened against other major
currencies. This has increased the underlying sterling value of overseas exposures, with a corresponding
increase in the premium and currency risk charges.
The determination of the MCR relies on the following four main calculation steps:
absolute minimum floor of £3.3m
a proportion of the best estimate liabilities and written premiums net of reinsurance
a floor of 25% of SCR
a cap of 45% of SCR.
For BINS the biting constraint of the MCR is 45% of the SCR.
2016 £m
2015 £m
MCR
122 113
The increase in the MCR during the year is driven by the increase in the SCR. The MCR coverage ratio at 31
December 2016 was 264%, with eligible Own Funds to meet the MCR of £322m.
E.3 Use of the duration-based equity risk sub-module in the calculation of the SCR
BINS does not use the duration-based equity risk sub-module.
E.4 Differences between the standard formula and any internal model used
This section is not applicable to BINS. The SCR has been calculated using the standard formula specified in the
Solvency II legislation, modified by a USP for determining premium risk SCR.
E.5 Non-compliance with the Minimum Capital Requirement and Solvency Capital Requirement
The Company has maintained sufficient capital to exceed both the SCR and the MCR throughout the reporting
period.
E.6 Any other information
There is no other material information to be disclosed.
40
Bupa Insurance Limited Solvency and Financial Condition Report 2016
Directors’ responsibility statement
We acknowledge our responsibility for preparing the SFCR in all material respects in accordance with the PRA
Rules and the Solvency II Regulations.
We are satisfied that:
a) throughout the financial year in question, the Company has complied in all material respects with the
requirements of the PRA Rules and the Solvency II Regulations applicable to the Company; and
b) it is reasonable to believe that the Company has continued to so comply subsequently and will continue to so
comply in future.
F.Harris
Director
17 May 2017

41
Bupa Insurance Limited Solvency and Financial Condition Report 2016
Independent auditor’s opinion
Report of the external independent auditor to the Directors of Bupa Insurance Limited (‘the Company’) pursuant to Rule 4.1 (2) of the External Audit Chapter of the PRA Rulebook applicable to Solvency II firms
Except as stated below, we have audited the following documents prepared by Bupa Insurance Limited as at 31
December 2016:
The ‘Valuation for solvency purposes’ and ‘Capital Management’ sections of the Solvency and Financial
Condition Report of Bupa Insurance Limited as at 31 December 2016, (‘the Narrative Disclosures subject to
audit’); and
Company templates S02.01.02, S17.01.02, S23.01.01, S25.01.21, S28.01.01 (‘the Templates subject to
audit’).
The Narrative Disclosures subject to audit and the Templates subject to audit are collectively referred to as the
‘Relevant Elements of the Solvency and Financial Condition Report’.
We are not required to audit, nor have we audited, and as a consequence do not express an opinion on the Other
Information which comprises:
The ‘Business and performance’, ‘System of governance’ and ‘Risk profile’ sections of the Solvency and
Financial Condition Report;
Information relating to 31 December 2015 voluntarily disclosed by the Company in the ‘Valuation for solvency
purposes’ and ‘Capital management’ sections of the Solvency and Financial Condition Report;
Company templates S05.01.02, S05.02.01, S19.01.21;
The written acknowledgement by the Directors of their responsibilities, including for the preparation of the
Solvency and Financial Condition Report (‘the Responsibility Statement’).
Respective responsibilities of directors and auditor
As explained more fully in the Responsibility Statement, the Directors are responsible for the preparation of the
Solvency and Financial Condition Report in accordance with the financial reporting provisions of the PRA rules
and Solvency II regulations which have been modified by the modifications, and supplemented by the approvals
and determinations made by the PRA under section 138A of FSMA, the PRA Rules and Solvency II regulations
on which they are based.
The Directors are also responsible for such internal control as they determine is necessary to enable the
preparation of a Solvency and Financial Condition Report that is free from material misstatement, whether due to
fraud or error.
Our responsibility is to audit, and express an opinion on, the Relevant Elements of the Solvency and Financial
Condition Report in accordance with applicable law and International Standards on Auditing (UK and Ireland)
together with ISA (UK) 800 and ISA (UK) 805. Those standards require us to comply with the Auditing Practices
Board’s Ethical Standards for Auditors.
Scope of the audit of the Relevant Elements of the Solvency and Financial Condition Report
A description of the scope of an audit is provided on the Financial Reporting Council’s website at
www.frc.org.uk/auditscopeukprivate.
Opinion on the Relevant Elements of the Solvency and Financial Condition Report
In our opinion, the information subject to audit in the Relevant Elements of the Solvency and Financial Condition
Report of Bupa Insurance Limited as at 31 December 2016 is prepared, in all material respects, in accordance
with the financial reporting provisions of the PRA Rules and Solvency II regulations on which they are based, as
modified by relevant supervisory modifications, and as supplemented by supervisory approvals and
determinations.

42
Bupa Insurance Limited Solvency and Financial Condition Report 2016
Emphasis of Matter - Basis of Accounting
We draw attention to the ‘Valuation for solvency purposes’ and ‘Capital Management’ sections of the Solvency
and Financial Condition Report, which describe the basis of accounting. The Solvency and Financial Condition
Report is prepared in compliance with the financial reporting provisions of the PRA Rules and Solvency II
regulations, and therefore in accordance with a special purpose financial reporting framework. The Solvency and
Financial Condition Report is required to be published, and intended users include but are not limited to the
Prudential Regulation Authority. As a result, the Solvency and Financial Condition Report may not be suitable for
another purpose. Our opinion is not modified in respect of these matters.
Matters on which we are required to report by exception
In accordance with Rule 4.1 (3) of the External Audit Chapter of the PRA Rulebook for Solvency II firms we are
required to consider whether the Other Information is materially inconsistent with our knowledge obtained in the
audit of Bupa Insurance Limited’s statutory financial statements. If, based on the work we have performed, we
conclude that there is a material misstatement of this other information, we are required to report that fact. We
have nothing to report in this regard.
The purpose of our audit work and to whom we owe our responsibilities
This report of the external auditor is made solely to the Company’s directors, as its governing body, in accordance
with the requirement in Rule 4.1(2) of the External Audit Part of the PRA Rulebook and the terms of our
engagement. We acknowledge that the directors are required to submit the report to the PRA, to enable the PRA
to verify that an auditor’s report has been commissioned by the Company’s directors and issued in accordance
with the requirement set out in Rule 4.1(2) of the External Audit Part of the PRA Rulebook and to facilitate the
discharge by the PRA of its regulatory functions in respect of the Company, conferred on the PRA by or under the
Financial Services and Markets Act 2000.
Our audit has been undertaken so that we might state to the Company’s directors those matters we are required
to state to them in an auditor’s report issued pursuant to Rule 4.1(2) and for no other purpose. To the fullest
extent permitted by law, we do not accept or assume responsibility to anyone other than the Company through its
governing body, for our audit, for this report, or for the opinions we have formed.
KPMG LLP
Chartered Accountants
15 Canada Square
London
E14 5GL
17 May 2017
The maintenance and integrity of Bupa Insurance Limited’s website is the responsibility of the directors; the
work carried out by the auditors does not involve consideration of these matters and, accordingly, the auditors
accept no responsibility for any changes that may have occurred to the Solvency and Financial Condition
Report since it was initially presented on the website.
Legislation in the United Kingdom governing the preparation and dissemination of Solvency and Financial
Condition Reports may differ from legislation in other jurisdictions.

43
Bupa Insurance Limited Solvency and Financial Condition Report 2016
Appendix – relevant elements of the Solvency and Financial Condition Report that are not subject to audit Solo standard formula The Relevant Elements of the Solvency and Financial Condition Report that are not subject to audit comprise:
The following elements of template S.17.01.02
Rows R0290 to R0310 – Amount of transitional measure on technical provisions
Elements of the Narrative Disclosures subject to audit identified as ‘unaudited’.

44
Bupa Insurance Limited Solvency and Financial Condition Report 2016
Glossary
Definitions
BINS or the Company Bupa Insurance Limited
the Board The Regulated Entities Board
Bupa The British United Provident Association Limited
the Bupa Group or the Group
The British United Provident Association Limited and subsidiaries
the Regulated Entities Collectively Bupa Insurance Limited and Bupa Insurance Services Limited
Solvency II Directive Directive 2009/138/EC of the European Parliament and of the Council
Abbreviations
BISL Bupa Insurance Services Limited
CEO Chief Executive Officer
CIA Chief Internal Auditor
CRO Chief Risk Officer
ECA Economic Capital Assessment
FCA Financial Conduct Authority
ICRMA Internal Control and Risk Management Assessment
IPMI International Private Medical Insurance
MCR Minimum Capital Requirement
NED Non-Executive Director
OCP Outstanding Claims Provision
ORSA Own Risk and Solvency Assessment
PRA Prudential Regulation Authority
QRT Quantitative Reporting Template
REAC Regulated Entities Audit Committee
RERC Regulated Entities Risk Committee
RE ERC Regulated Entities Executive Risk Committee
SCR Solvency Capital Requirement
SFCR Solvency and Financial Condition Report
SME Small and Medium Enterprise
UK GAAP UK Generally Accepted Accounting Practice
UK PMI UK Private Medical Insurance
USP Undertaking Specific Parameter
45
Bupa Insurance Limited Solvency and Financial Condition Report 2016
Annex - Reporting templates
The following QRTs are included within this Annex:
S.02.01.02 Balance sheet
S.05.01.02 Premiums, claims and expenses by line of business
S.05.02.01 Premiums, claims and expenses by country
S.17.01.02 Non-life technical provisions
S.19.01.21 Non-life insurance claims
S.23.01.01 Own Funds
S.25.01.21 Solvency Capital Requirement – for undertakings on standard formula
S.28.01.01 Minimum Capital Requirement – only life or only non-life insurance or reinsurance activity
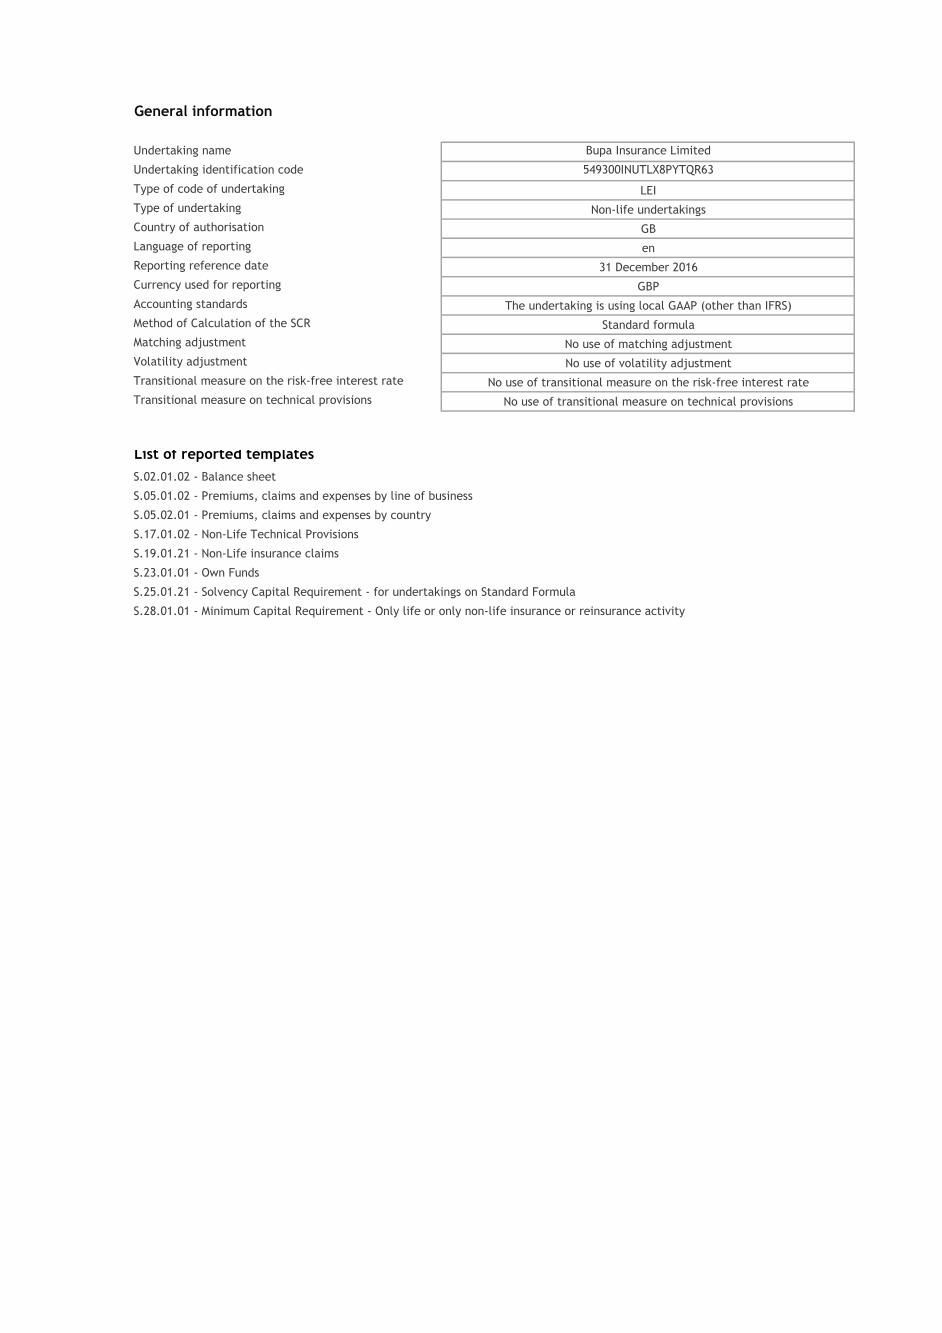
General information
Undertaking name Bupa Insurance Limited
Undertaking identification code 549300INUTLX8PYTQR63
Type of code of undertaking LEI
Type of undertaking Non-life undertakings
Country of authorisation GB
Language of reporting en
Reporting reference date 31 December 2016
Currency used for reporting GBP
Accounting standards The undertaking is using local GAAP (other than IFRS)
Method of Calculation of the SCR Standard formula
Matching adjustment No use of matching adjustment
Volatility adjustment No use of volatility adjustment
Transitional measure on the risk-free interest rate No use of transitional measure on the risk-free interest rate
Transitional measure on technical provisions No use of transitional measure on technical provisions
List of reported templates
S.02.01.02 - Balance sheet
S.05.01.02 - Premiums, claims and expenses by line of business
S.05.02.01 - Premiums, claims and expenses by country
S.17.01.02 - Non-Life Technical Provisions
S.19.01.21 - Non-Life insurance claims
S.23.01.01 - Own Funds
S.25.01.21 - Solvency Capital Requirement - for undertakings on Standard Formula
S.28.01.01 - Minimum Capital Requirement - Only life or only non-life insurance or reinsurance activity

S.02.01.02
Balance sheet
Solvency II
value
Assets C0010
R0030 Intangible assets 0
R0040 Deferred tax assets 0
R0050 Pension benefit surplus 0
R0060 Property, plant & equipment held for own use 20,248
R0070 Investments (other than assets held for index-linked and unit-linked contracts) 962,875
R0080 Property (other than for own use) 68,500
R0090 Holdings in related undertakings, including participations 2,904
R0100 Equities 0
R0110 Equities - listed 0
R0120 Equities - unlisted 0
R0130 Bonds 332,276
R0140 Government Bonds 25,919
R0150 Corporate Bonds 305,337
R0160 Structured notes 196
R0170 Collateralised securities 823
R0180 Collective Investments Undertakings 141,428
R0190 Derivatives 86,390
R0200 Deposits other than cash equivalents 331,377
R0210 Other investments 0
R0220 Assets held for index-linked and unit-linked contracts 0
R0230 Loans and mortgages 66,364
R0240 Loans on policies 0
R0250 Loans and mortgages to individuals 0
R0260 Other loans and mortgages 66,364
R0270 Reinsurance recoverables from: 42,773
R0280 Non-life and health similar to non-life 42,773
R0290 Non-life excluding health 0
R0300 Health similar to non-life 42,773
R0310 Life and health similar to life, excluding index-linked and unit-linked 0
R0320 Health similar to life 0
R0330 Life excluding health and index-linked and unit-linked 0
R0340 Life index-linked and unit-linked 0
R0350 Deposits to cedants 0
R0360 Insurance and intermediaries receivables 121,624
R0370 Reinsurance receivables 3,490
R0380 Receivables (trade, not insurance) 82,378
R0390 Own shares (held directly) 0
R0400 Amounts due in respect of own fund items or initial fund called up but not yet paid in 0
R0410 Cash and cash equivalents 119,630
R0420 Any other assets, not elsewhere shown 73,665
R0500 Total assets 1,493,047

S.02.01.02
Balance sheet
Solvency II
value
Liabilities C0010
R0510 Technical provisions - non-life 541,819
R0520 Technical provisions - non-life (excluding health) 19,113
R0530 TP calculated as a whole 0
R0540 Best Estimate 18,938
R0550 Risk margin 176
R0560 Technical provisions - health (similar to non-life) 522,706
R0570 TP calculated as a whole 0
R0580 Best Estimate 508,838
R0590 Risk margin 13,868
R0600 Technical provisions - life (excluding index-linked and unit-linked) 0
R0610 Technical provisions - health (similar to life) 0
R0620 TP calculated as a whole 0
R0630 Best Estimate 0
R0640 Risk margin 0
R0650 Technical provisions - life (excluding health and index-linked and unit-linked) 0
R0660 TP calculated as a whole 0
R0670 Best Estimate 0
R0680 Risk margin 0
R0690 Technical provisions - index-linked and unit-linked 0
R0700 TP calculated as a whole 0
R0710 Best Estimate 0
R0720 Risk margin 0
R0740 Contingent liabilities 0
R0750 Provisions other than technical provisions 4,537
R0760 Pension benefit obligations 0
R0770 Deposits from reinsurers 5,696
R0780 Deferred tax liabilities 25,846
R0790 Derivatives 84,213
R0800 Debts owed to credit institutions 0
R0810 Financial liabilities other than debts owed to credit institutions 0
R0820 Insurance & intermediaries payables 35,310
R0830 Reinsurance payables 8,700
R0840 Payables (trade, not insurance) 47,398
R0850 Subordinated liabilities 384,308
R0860 Subordinated liabilities not in BOF 0
R0870 Subordinated liabilities in BOF 384,308
R0880 Any other liabilities, not elsewhere shown 92,256
R0900 Total liabilities 1,230,086
R1000 Excess of assets over liabilities 262,961

S.05.01.02
Non-life
Medical expense
insuranceAssistance
C0010 C0110 C0200
Premiums written
R0110 Gross - Direct Business 2,064,301 41,826 2,106,127
R0120 Gross - Proportional reinsurance accepted 270,387 1,831 272,218
R0130 Gross - Non-proportional reinsurance accepted 0
R0140 Reinsurers' share 105,886 702 106,588
R0200 Net 2,228,802 42,955 2,271,757
Premiums earned
R0210 Gross - Direct Business 2,078,452 42,624 2,121,077
R0220 Gross - Proportional reinsurance accepted 266,090 2,028 268,119
R0230 Gross - Non-proportional reinsurance accepted 0
R0240 Reinsurers' share 111,826 702 112,528
R0300 Net 2,232,716 43,950 2,276,667
Claims incurred
R0310 Gross - Direct Business 1,477,555 23,749 1,501,303
R0320 Gross - Proportional reinsurance accepted 175,010 1,037 176,047
R0330 Gross - Non-proportional reinsurance accepted 0
R0340 Reinsurers' share 91,491 138 91,629
R0400 Net 1,561,074 24,647 1,585,721
Changes in other technical provisions
R0410 Gross - Direct Business 0 0 0
R0420 Gross - Proportional reinsurance accepted 0 0 0
R0430 Gross - Non-proportional reinsurance accepted 0
R0440 Reinsurers' share 0 0 0
R0500 Net 0 0 0
R0550 Expenses incurred 567,256 15,240 582,496
R1200 Other expenses 63
R1300 Total expenses 582,558
Premiums, claims and expenses by line of business
Line of Business for: non-life insurance
and reinsurance obligations (direct
business and accepted proportional
reinsurance)
Total

S.05.02.01
Premiums, claims and expenses by country
Non-life
C0010 C0020 C0030 C0040 C0050 C0060 C0070
R0010 AE HK SG MX DK
C0080 C0090 C0100 C0110 C0120 C0130 C0140
Premiums written
R0110 Gross - Direct Business 1,638,855 1,253 8,323 16,051 29,295 28,549 1,722,324
R0120 Gross - Proportional reinsurance accepted 0 158,690 45,278 16,879 0 0 220,847
R0130 Gross - Non-proportional reinsurance accepted 0 0 0 0 0 0 0
R0140 Reinsurers' share 23,622 8,045 1,467 151 23,042 708 57,035
R0200 Net 1,615,232 151,897 52,134 32,778 6,253 27,841 1,886,136
Premiums earned
R0210 Gross - Direct Business 1,637,961 1,267 8,448 16,278 32,854 28,974 1,725,782
R0220 Gross - Proportional reinsurance accepted 0 159,000 43,761 18,097 0 0 220,858
R0230 Gross - Non-proportional reinsurance accepted 0 0 0 0 0 0 0
R0240 Reinsurers' share 23,075 6,727 1,227 126 25,958 707 57,820
R0300 Net 1,614,886 153,540 50,982 34,248 6,896 28,268 1,888,820
Claims incurred
R0310 Gross - Direct Business 1,214,594 2,294 9,716 12,803 17,729 14,248 1,271,384
R0320 Gross - Proportional reinsurance accepted 0 115,765 26,725 12,502 0 0 154,992
R0330 Gross - Non-proportional reinsurance accepted 0 0 0 0 0 0 0
R0340 Reinsurers' share 20,842 7,445 2,307 123 17,729 138 48,584
R0400 Net 1,193,751 110,614 34,134 25,182 0 14,110 1,377,791
Changes in other technical provisions
R0410 Gross - Direct Business 0 0 0 0 0 0 0
R0420 Gross - Proportional reinsurance accepted 0 0 0 0 0 0 0
R0430 Gross - Non-proportional reinsurance accepted 0 0 0 0 0 0 0
R0440 Reinsurers' share 0 0 0 0 0 0 0
R0500 Net 0 0 0 0 0 0 0
R0550 Expenses incurred 330,847 62,616 16,212 12,347 5,145 10,816 437,982
R1200 Other expenses 63
R1300 Total expenses 438,045
Home Country
Top 5 countries (by amount of gross premiums written) -
non-life obligations
Top 5 countries (by amount of gross
premiums written) - non-life
obligations Total Top 5 and
home country

S.17.01.02
Non-Life Technical Provisions
Medical
expense
insurance
Assistance
C0020 C0120 C0180
R0010 Technical provisions calculated as a whole 0 0 0
R0050
Total Recoverables from reinsurance/SPV and Finite Re after
the adjustment for expected losses due to counterparty
default associated to TP calculated as a whole
0 0 0
Technical provisions calculated as a sum of BE and RM
Best estimate
Premium provisions
R0060 Gross 253,778 11,767 265,546
R0140
Total recoverable from reinsurance/SPV and Finite Re
after the adjustment for expected losses due to
counterparty default
27,731 0 27,731
R0150 Net Best Estimate of Premium Provisions 226,048 11,767 237,815
Claims provisions
R0160 Gross 255,059 7,170 262,230
R0240
Total recoverable from reinsurance/SPV and Finite Re
after the adjustment for expected losses due to
counterparty default
15,042 0 15,042
R0250 Net Best Estimate of Claims Provisions 240,017 7,170 247,188
R0260 Total best estimate - gross 508,838 18,938 527,776
R0270 Total best estimate - net 466,065 18,938 485,003
R0280 Risk margin 13,868 176 14,044
Amount of the transitional on Technical Provisions
R0290 Technical Provisions calculated as a whole 0 0 0
R0300 Best estimate 0 0 0
R0310 Risk margin 0 0 0
R0320 Technical provisions - total 522,706 19,113 541,819
R0330
Recoverable from reinsurance contract/SPV and
Finite Re after the adjustment for expected losses due to
counterparty default - total
42,773 0 42,773
R0340Technical provisions minus recoverables from
reinsurance/SPV and Finite Re - total479,934 19,113 499,047
Direct business and accepted
proportional reinsurance
Total Non-Life
obligation

S.19.01.21
Non-Life insurance claims
Total Non-life business
Z0010 Accident year / underwriting year
Gross Claims Paid (non-cumulative)
(absolute amount)
C0010 C0020 C0030 C0040 C0050 C0060 C0070 C0080 C0090 C0100 C0110 C0170 C0180
Year
0 1 2 3 4 5 6 7 8 9 10 & +
R0100 Prior 0 0 0
R0160 N-9 0 0 0 0 0 0 0 0 0 0 0 0
R0170 N-8 0 0 0 0 0 0 0 0 0 0 0
R0180 N-7 0 0 0 0 0 0 0 0 0 0
R0190 N-6 0 0 0 0 0 0 0 0 0
R0200 N-5 0 0 0 0 0 0 0 0
R0210 N-4 0 0 0 0 0 0 0
R0220 N-3 0 0 0 1,427 1,427 1,427
R0230 N-2 0 0 6,746 6,746 6,746
R0240 N-1 0 200,860 200,860 200,860
R0250 N 1,481,076 1,481,076 1,481,076
R0260 Total 1,690,110 1,690,110
Gross Undiscounted Best Estimate Claims Provisions
(absolute amount)
C0360
C0200 C0210 C0220 C0230 C0240 C0250 C0260 C0270 C0280 C0290 C0300
Year
0 1 2 3 4 5 6 7 8 9 10 & +
R0100 Prior 0 0
R0160 N-9 0 0 0 0 0 0 0 0 0 0 0
R0170 N-8 0 0 0 0 0 0 0 0 0 0
R0180 N-7 0 0 0 0 0 0 0 0 0
R0190 N-6 0 0 0 0 0 0 0 0
R0200 N-5 0 0 0 0 0 0 0
R0210 N-4 0 0 0 0 0 0
R0220 N-3 0 0 0 354 354
R0230 N-2 0 0 6,449 6,449
R0240 N-1 0 6,751 6,751
R0250 N 242,018 242,018
R0260 Total 255,571
Accident Year
Development year In Current
year
Sum of years
(cumulative)
Year end
(discounted
data)
Development year

S.23.01.01
Own Funds
Basic own funds before deduction for participations in other financial sector as foreseen in article 68 of Delegated Regulation 2015/35 TotalTier 1
unrestricted
Tier 1
restrictedTier 2 Tier 3
C0010 C0020 C0030 C0040 C0050
R0010 Ordinary share capital (gross of own shares) 57,209 57,209 0
R0030 Share premium account related to ordinary share capital 0 0 0
R0040 Initial funds, members' contributions or the equivalent basic own-fund item for mutual and mutual-type undertakings 0 0 0
R0050 Subordinated mutual member accounts 0 0 0 0
R0070 Surplus funds 0 0
R0090 Preference shares 0 0 0 0
R0110 Share premium account related to preference shares 0 0 0 0
R0130 Reconciliation reserve 180,752 180,752
R0140 Subordinated liabilities 384,308 384,308 0 0
R0160 An amount equal to the value of net deferred tax assets 0 0
R0180 Other own fund items approved by the supervisory authority as basic own funds not specified above 0 0 0 0 0
R0220 Own funds from the financial statements that should not be represented by the reconciliation reserve and do not meet the criteria to be classified as Solvency II own funds 0
R0230 Deductions for participations in financial and credit institutions 0 0 0 0
R0290 Total basic own funds after deductions 622,269 237,961 384,308 0 0
Ancillary own funds
R0300 Unpaid and uncalled ordinary share capital callable on demand 0
R0310 Unpaid and uncalled initial funds, members' contributions or the equivalent basic own fund item for mutual and mutual - type undertakings, callable on demand 0
R0320 Unpaid and uncalled preference shares callable on demand 0
R0330 A legally binding commitment to subscribe and pay for subordinated liabilities on demand 0
R0340 Letters of credit and guarantees under Article 96(2) of the Directive 2009/138/EC 0
R0350 Letters of credit and guarantees other than under Article 96(2) of the Directive 2009/138/EC 0
R0360 Supplementary members calls under first subparagraph of Article 96(3) of the Directive 2009/138/EC 0
R0370 Supplementary members calls - other than under first subparagraph of Article 96(3) of the Directive 2009/138/EC 0
R0390 Other ancillary own funds 0
R0400 Total ancillary own funds 0 0 0
Available and eligible own funds
R0500 Total available own funds to meet the SCR 622,269 237,961 384,308 0 0
R0510 Total available own funds to meet the MCR 622,269 237,961 384,308 0
R0540 Total eligible own funds to meet the SCR 433,172 237,961 59,490 135,722 0
R0550 Total eligible own funds to meet the MCR 321,881 237,961 59,490 24,430
R0580 SCR 271,443
R0600 MCR 122,149
R0620 Ratio of Eligible own funds to SCR 159.58%
R0640 Ratio of Eligible own funds to MCR 263.51%
Reconcilliation reserve C0060
R0700 Excess of assets over liabilities 262,961
R0710 Own shares (held directly and indirectly) 0
R0720 Foreseeable dividends, distributions and charges 25,000
R0730 Other basic own fund items 57,209
R0740 Adjustment for restricted own fund items in respect of matching adjustment portfolios and ring fenced funds 0
R0760 Reconciliation reserve 180,752
Expected profits
R0770 Expected profits included in future premiums (EPIFP) - Life business
R0780 Expected profits included in future premiums (EPIFP) - Non- life business 129,040
R0790 Total Expected profits included in future premiums (EPIFP) 129,040

S.25.01.21
Solvency Capital Requirement - for undertakings on Standard Formula
Gross solvency capital
requirementUSP Simplifications
C0110 C0080 C0090
R0010 Market risk 91,410
R0020 Counterparty default risk 31,638
R0030 Life underwriting risk 0
R0040 Health underwriting risk 198,056Standard deviation for NSLT
health premium risk
R0050 Non-life underwriting risk 17,785 None
R0060 Diversification -86,092
R0070 Intangible asset risk 0
R0100 Basic Solvency Capital Requirement 252,796
Calculation of Solvency Capital Requirement C0100
R0130 Operational risk 71,676
R0140 Loss-absorbing capacity of technical provisions 0
R0150 Loss-absorbing capacity of deferred taxes -53,029
R0160 Capital requirement for business operated in accordance with Art. 4 of Directive 2003/41/EC 0
R0200 Solvency Capital Requirement excluding capital add-on 271,443
R0210 Capital add-ons already set 0
R0220 Solvency capital requirement 271,443
Other information on SCR
R0400 Capital requirement for duration-based equity risk sub-module 0
R0410 Total amount of Notional Solvency Capital Requirements for remaining part 0
R0420 Total amount of Notional Solvency Capital Requirements for ring fenced funds 0
R0430 Total amount of Notional Solvency Capital Requirements for matching adjustment portfolios 0
R0440 Diversification effects due to RFF nSCR aggregation for article 304 0

S.28.01.01
Minimum Capital Requirement - Only life or only non-life insurance or reinsurance activity
Linear formula component for non-life insurance and reinsurance obligations C0010
R0010 MCRNL Result 133,832
Net (of
reinsurance/SPV) best
estimate and TP
calculated as a whole
Net (of reinsurance)
written premiums in
the last 12 months
C0020 C0030
R0020 Medical expense insurance and proportional reinsurance 466,065 2,228,802
R0030 Income protection insurance and proportional reinsurance 0 0
R0040 Workers' compensation insurance and proportional reinsurance 0 0
R0050 Motor vehicle liability insurance and proportional reinsurance 0 0
R0060 Other motor insurance and proportional reinsurance 0 0
R0070 Marine, aviation and transport insurance and proportional reinsurance 0 0
R0080 Fire and other damage to property insurance and proportional reinsurance 0 0
R0090 General liability insurance and proportional reinsurance 0 0
R0100 Credit and suretyship insurance and proportional reinsurance 0 0
R0110 Legal expenses insurance and proportional reinsurance 0 0
R0120 Assistance and proportional reinsurance 18,938 42,955
R0130 Miscellaneous financial loss insurance and proportional reinsurance 0 0
R0140 Non-proportional health reinsurance 0 0
R0150 Non-proportional casualty reinsurance 0 0
R0160 Non-proportional marine, aviation and transport reinsurance 0 0
R0170 Non-proportional property reinsurance 0 0
Linear formula component for life insurance and reinsurance obligations C0040
R0200 MCRL Result 0
Net (of
reinsurance/SPV) best
estimate and TP
calculated as a whole
Net (of
reinsurance/SPV) total
capital at risk
C0050 C0060
R0210 Obligations with profit participation - guaranteed benefits
R0220 Obligations with profit participation - future discretionary benefits
R0230 Index-linked and unit-linked insurance obligations
R0240 Other life (re)insurance and health (re)insurance obligations
R0250 Total capital at risk for all life (re)insurance obligations
Overall MCR calculation C0070
R0300 Linear MCR 133,832
R0310 SCR 271,443
R0320 MCR cap 122,149
R0330 MCR floor 67,861
R0340 Combined MCR 122,149
R0350 Absolute floor of the MCR 3,332
R0400 Minimum Capital Requirement 122,149