1 Socially-Aware Evaluation Framework for Transportation
21
1 Socially-Aware Evaluation Framework for Transportation Anu Kuncheria *†‡ , Joan L. Walker Ph.D. †‡ , Jane Macfarlane Ph.D. *‡ * Smart Cities Research Center, Institute of Transportation Studies, University of California, Berkeley † Department of Civil and Environmental Engineering, University of California, Berkeley ‡ Lawrence Berkeley National Laboratory October 2021 Corresponding email: anu [email protected] Abstract Technological advancements are rapidly changing traffic management in cities. Massive adoption of mobile devices and cloud-based applications have created new mechanisms for urban traffic control and management. Specifically, navigation applications have impacted cities in multiple ways by rerouting traffic on their streets. As different routing strategies distribute traffic differently across the city network, understanding these differences across multiple dimensions is highly relevant for policymakers. In this paper, we develop a holistic framework of indicators, called Socially- Aware Evaluation Framework for Transportation (SAEF), that will assist in understanding how traffic routing and the resultant traffic dynamics impact city metrics, with the intent of avoiding unintended consequences and adhering to city objectives. SAEF is a holistic decision framework formed as an assembled set of city performance indicators grounded in the literature. The selected indicators can be evaluated for cities of various sizes and at the urban scale. The SAEF framework is presented for four Bay Area cities, for which we compare three different routing strategies. Our intent with this work is to provide an evaluation framework that enables reflection on the consequence of policies, traffic management strategies and network changes. With an ability to model out proposed traffic management strategies, the policymaker can consider the trade-offs and potential unintended consequences. Index Terms Smart cities, Holistic framework, Vehicle routing, Dynamic traffic assignment, Transportation equity. Word Count : 6066 I. I NTRODUCTION Massive adoption of mobile devices and cloud-based applications have created new mechanisms for understanding how people move in urban environments. This new mobility data along with data generated by city infrastructure will provide cities with a more detailed view of traffic dynamics and allow them to play a more active role in managing urban performance. In addition, emerging connected and automated technologies have the promise to create more efficient solutions for city management. For example, the promise of autonomous and connected vehicle fleets in smart cities may provide the possibility of optimal traffic management through mass control of vehicle routes. These technologies will augment current mechanisms for traffic management in cities e.g. traffic lights, variable message signs, HOV lanes, and tolls. Traffic flows in urban environments are currently heavily influenced by real-time routing provided by various inde- pendent navigation systems (Google maps, Waze, Apple maps etc) [1], [2], with up to 60% of drivers using them daily [3], [4]. These systems add another level of control that is not in coordination with existing infrastructure control. This has created undesired traffic dynamics, mostly driven by real-time route guidance systems, that often compromise safety and health in the neighborhoods affected [5]. Our goal is to develop a holistic framework of metrics that will assist in understanding how routing strategies and their resultant traffic dynamics impact city metrics, with the intent of avoiding unintended consequences and adhering to city objectives. Our framework, called Socially- Aware Evaluation Framework for Transportation - SAEF, is an evaluation framework with multiple measures related to urban performance, such as safety, equity and neighborhood congestion. The selected metrics can be evaluated for cities of various sizes and at urban scale. The framework is designed to allow decision-makers to assess typical routing strategies and evaluate the potential impact on different aspects of a city. For illustrative purposes, we present the framework for four cities in the Bay Area. The routing strategies we evaluate are (1) user equilibrium in which travel time for each user is optimized, (2) system optimal travel time, and (3) system optimal fuel use. The impact of these optimization strategies on the Bay Area are generated using results from a mesoscopic simulation platform called Mobiliti [6] that implements a Quasi Dynamic Traffic Assignment (QDTA) [7]. The QDTA algorithm partitions the day into 15 minute intervals, performs a static traffic assignment for each interval including trip arXiv:2111.06059v1 [eess.SY] 11 Nov 2021
Transcript of 1 Socially-Aware Evaluation Framework for Transportation

1
Socially-Aware Evaluation Framework forTransportation
Anu Kuncheria∗†‡, Joan L. Walker Ph.D.†‡, Jane Macfarlane Ph.D. ∗‡∗ Smart Cities Research Center, Institute of Transportation Studies, University of California, Berkeley
†Department of Civil and Environmental Engineering, University of California, Berkeley‡Lawrence Berkeley National Laboratory
October 2021Corresponding email: anu [email protected]
Abstract
Technological advancements are rapidly changing traffic management in cities. Massive adoption of mobile devices andcloud-based applications have created new mechanisms for urban traffic control and management. Specifically, navigationapplications have impacted cities in multiple ways by rerouting traffic on their streets. As different routing strategiesdistribute traffic differently across the city network, understanding these differences across multiple dimensions is highlyrelevant for policymakers. In this paper, we develop a holistic framework of indicators, called Socially- Aware EvaluationFramework for Transportation (SAEF), that will assist in understanding how traffic routing and the resultant traffic dynamicsimpact city metrics, with the intent of avoiding unintended consequences and adhering to city objectives. SAEF is a holisticdecision framework formed as an assembled set of city performance indicators grounded in the literature. The selectedindicators can be evaluated for cities of various sizes and at the urban scale. The SAEF framework is presented for four BayArea cities, for which we compare three different routing strategies. Our intent with this work is to provide an evaluationframework that enables reflection on the consequence of policies, traffic management strategies and network changes. Withan ability to model out proposed traffic management strategies, the policymaker can consider the trade-offs and potentialunintended consequences.
Index Terms
Smart cities, Holistic framework, Vehicle routing, Dynamic traffic assignment, Transportation equity.Word Count : 6066
I. INTRODUCTION
Massive adoption of mobile devices and cloud-based applications have created new mechanisms for understandinghow people move in urban environments. This new mobility data along with data generated by city infrastructure willprovide cities with a more detailed view of traffic dynamics and allow them to play a more active role in managingurban performance. In addition, emerging connected and automated technologies have the promise to create more efficientsolutions for city management. For example, the promise of autonomous and connected vehicle fleets in smart citiesmay provide the possibility of optimal traffic management through mass control of vehicle routes. These technologieswill augment current mechanisms for traffic management in cities e.g. traffic lights, variable message signs, HOV lanes,and tolls.
Traffic flows in urban environments are currently heavily influenced by real-time routing provided by various inde-pendent navigation systems (Google maps, Waze, Apple maps etc) [1], [2], with up to 60% of drivers using them daily[3], [4]. These systems add another level of control that is not in coordination with existing infrastructure control. Thishas created undesired traffic dynamics, mostly driven by real-time route guidance systems, that often compromise safetyand health in the neighborhoods affected [5].
Our goal is to develop a holistic framework of metrics that will assist in understanding how routing strategies and theirresultant traffic dynamics impact city metrics, with the intent of avoiding unintended consequences and adhering to cityobjectives. Our framework, called Socially- Aware Evaluation Framework for Transportation - SAEF, is an evaluationframework with multiple measures related to urban performance, such as safety, equity and neighborhood congestion.The selected metrics can be evaluated for cities of various sizes and at urban scale. The framework is designed to allowdecision-makers to assess typical routing strategies and evaluate the potential impact on different aspects of a city. Forillustrative purposes, we present the framework for four cities in the Bay Area. The routing strategies we evaluate are (1)user equilibrium in which travel time for each user is optimized, (2) system optimal travel time, and (3) system optimalfuel use. The impact of these optimization strategies on the Bay Area are generated using results from a mesoscopicsimulation platform called Mobiliti [6] that implements a Quasi Dynamic Traffic Assignment (QDTA) [7]. The QDTAalgorithm partitions the day into 15 minute intervals, performs a static traffic assignment for each interval including trip
arX
iv:2
111.
0605
9v1
[ee
ss.S
Y]
11
Nov
202
1

2
accounting that allows for residual traffic from previous time interval. Although the framework was developed with theprimary objective of evaluating the impact of traffic routing strategies, it may also be used as an evaluation tool for awider array of transportation projects, such as infrastructure changes, connected traffic signals and traffic managementprojects.
The remainder of the paper is organized as follows. In Section 2, a background of the existing transportation frameworksis provided. The design of our framework and indicators are presented in Section 3; the study methods, results andinterpretation is elucidated in Section 4. Finally, the conclusions are discussed in Section 5, along with possible directionsfor future work.
II. LITERATURE REVIEW
A. Traffic Routing in Cities
There has been much previous work in the area of transportation modeling and traffic route choices [8]–[11].Understanding the distribution of traffic on local road network gained popularity in the past decade with route guidancesystems rerouting traffic differently than before [12]–[14]. Most route guidance systems aim to provide an user with theleast travel time route [15], [16]. This might mean taking people off the highway to local streets to save few minutes oftravel time [17]. Some services provide routes to users based on shortest fuel consumption. This could mean travellingat a consistent speed and thus prefer certain kinds of roads that maintains that speed limit [18], [19]. Studies evaluatingthe impacts of navigation systems model app based and non app based users differently to understand the resultingcongestion patterns [20], [21]. Most of them model a corridor or a small network with varying percentages of app usersto show the increase in congestion as app users increase by using metrics like traffic flow, distance, and average marginalregret. Ahmed and Hesham modelled eco-routing as a feedback user equilibrium model for downtown LA and measuredthe outcome in terms of fuel consumption and congestion levels [22]. It could be seen from the previous studies thatdifferent strategies has different impacts across the city network in terms of time and distance. However no previousstudies have explored the impacts of routing holistically on multiple city dimensions.
B. Evaluation Frameworks in Transportation
We conducted an extensive review of transportation literature to identify frameworks or indicators that can be usedto assess the impacts of traffic routing strategies on cities. Due to lack of specific frameworks designed for routing, wereviewed the general frameworks in the transportation domain and assessed its usability for routing evaluation.
European Commission’s CITYkeys framework developed a set of city performance measures at city level and projectlevel [23]. The framework was focused on five major themes of people, planet, prosperity, governance, and propagation.Out of the 116 key performance indicators, the ones concerning transportation were in car waiting time, reduction in trafficaccidents, quality of public transportation, improved access to vehicle sharing solution, extended bike route network,reduced exposure to noise pollution, reduction in annual energy consumption. HASTA framework measures sustainabilityfor a transportation project based on three dimensions of economic, environmental and social and six sustainabilityindicator groups for Swedish cities [24]. They came up with a total of 83 indicators. Additionally, considerable workis ongoing through the International Standards Organization (ISO), European Committee for Standardization, and BSIto establish proper standards in smart urban development project evaluation. ISO 37122:2019 provides a frameworkfor resilient city with 19 themes and multiple indicators for each theme. The transportation theme has 14 indicators,mostly focusing on real-time technology, electric fleet, and integrated payment systems (ISO 37122:2019). In additionto the frameworks, there is a vast literature on transportation indicators used for evaluation of new projects. Specific tosmart cities and transportation, Orlowski and Romanowska developed a set of smart mobility indicators that encompassthe following domains: technical infrastructure, information infrastructure, mobility methods, and vehicles used for thispurpose and legislation with 108 metrics [25]. Benevolo et al. (2016) investigated the role of ICT in supporting smartmobility actions, influencing their impact on the citizens’ quality of life, and on the public value created for the cityas a whole [26]. They provided an action taxonomy considering three aspects of smart mobility actors including themain agents moving the smart initiatives, the use and intensity of ICT and the benefits of smart mobility actions onsmart goals , to investigate the role of ICT in supporting smart mobility actions, influencing their impact on the citizens’quality of life and on the public value created for the city as a whole.
The existing frameworks cannot be directly used for routing evaluation as they are general, considering the entirety oftransportation or entirety of smart cities. Only few works have reasoned on more complex aspects, such as how differentindicators interact reciprocally, what benefits they generate, how they affect citizens’ quality of life, what problems theysolve and what is created. Further, they do not capture factors specific to the impact of routing strategies on cities.While the aspects of safety and neighborhood are discussed in some metrics, it is mostly qualitative and subjectivein nature. Key challenges are centered on selecting suitable evaluation methodologies to evidence urban value and

3
outcomes, addressing city’s objectives. With this focus, our framework grounded on literature develops a set of themesand indicators for cities to evaluate impacts of routing. To the best of our knowledge, this is the first time a holisticevaluation using multiple themes is used to identify the impacts of different routing strategies for a large scale networkwith cross city comparisons.
III. SOCIALLY- AWARE EVALUATION FRAMEWORK FOR TRANSPORTATION
A. Framework DesignTo explore the city level impacts of various routing strategies, we develop a holistic framework called Socially- Aware
Evaluation Framework for Transportation - SAEF. We define the term ’socially-aware’ to include five complementarythemes of neighborhood, safety, mobility, equity and environment (Figure 1).The themes are assembled from a set of cityperformance indicators grounded in literature [24], [27], [28]. Each theme identifies factors that are likely key concernsfor that theme. For example, accidents are a concern when considering safety, similarly emissions are a concern whenconsidering environmental quality. Based on these factors, we defined indicators/metrics (Figure 2) that could be derivedfrom real world or simulated data. These indicators were culled from a thorough review of literature from domestic andinternational, city policies and international organizations related to transportation. A list of over 100 indicators withwide range of scale and use were identified and a manageable set of indicators that we assessed as being importantas well as measurable were created for each theme. This resulted in 23 indicators: 6 were selected as reflections ofneighborhood quality, 4 for safety, 6 for mobility, 4 for equity, and 3 for environment quality. This framework can thenprovide a basis for:
• comparing indicators as a function of specific traffic management strategies,• attaching weights to the metrics that reflect planning objectives,• stressing the relationship between policy goals and intended city level impact, and• monitoring progress towards long term policy goals.
Fig. 1. Themes in the framework
B. Operationalizing the FrameworkOperationalizing the framework is the key to its usability for cities managers. SAEF provides a set of measurable
indicators in context of a broad framework. It provides a mechanism for prioritizing city’s objectives with an under-standing of the trade offs that must be made to achieve certain objectives, for example if a traffic management strategyattempts to reduce fuel consumption it may result in more vehicles travelling through neighborhoods. City planners canthen determine whether the reduced emissions are higher priority than the likely safety costs of higher traffic flows onneighborhoods streets. They can choose specific themes from the framework based on their own objectives and valuesand evaluate them in context of proposed traffic management strategies.
Each indicator is detailed in Appendix A, including a description, the unit of measurement and spatial/temporal levels.The indicators are structured in spatial and temporal dimensions. The spatial dimension is partitioned into individual,community, and city levels (Figure 3). There are 2 temporal dimensions - peak hours or entire day - based on theindicator relevance. The list of indicators is not intended to be exhaustive. It can be revised as new information becomesaccessible.
The next section addresses how to quantify the indicators. Once the indicators are quantified, the decision makers canweight them to generate an aggregate score for decision making. The weighting should reflect the goals of the city andrationalize the values of the indicators. Visualization of the indicators in context of various strategies is an alternativemethod.

4
Fig. 2. Indicators for each theme
Fig. 3. SAEF Indicators and their spatial levels.

5
IV. APPLICATION OF THE FRAMEWORK
A. Traffic Simulation
In order to evaluate impacts of various routing strategies, we use the results from an agent based simulator Mobiliti[6]. Mobiliti is an urban-scale simulation platform for evaluating network traffic dynamics. Mobiliti provides threeoptimization methods based on standard traffic assignment algorithms. Specifically, it implements a Quasi-DynamicTraffic Assignment (QDTA) [7]. The main components of the simulator are detailed in Figure 4. For a given demand, routechoice is generated in the QDTA step based on the principles of user equilibrium or system optimal. The optimizationobjectives are travel time or fuel (refer Appendix B for the specific objective functions). The network loading is generatedusing the Mobiliti network simulation, with trips paths assigned by the optimization step. The transportation network forBay area has over 1 million links and 0.5 million nodes. The trip demand is defined by a travel demand model whichfor the Bay Area is the SFCTA CHAMP 6 model accounting for ∼19 million trips during a 24-hour period [29].
We studied three optimization scenarios: (1) user equilibrium travel time (UET), (2) system optimal travel time (SOT),and (3) system optimal fuel (SOF). The typical optimization for trip level shortest travel time (UET) is compared againstthe system optimal strategies. The embedded complexity of transportation networks naturally requires trade-offs whenoptimizing for different objectives. Our goal with the framework is to provide context for understanding the trade-offs.The results are examined for four cities: San Jose, San Francisco, Oakland and Concord. These cities were selected torepresent different-sized conurbations, relevant to their population and geographical area. Figure 5 shows all Bay areacities with the chosen four case study cities highlighted.
Fig. 4. Mobiliti simulation modelling
TABLE ICASE STUDY CITIES
City Area Population Population density Trips per capita(sq.mile) (person/sq.mile)
San Jose 185 1,021,795 5,524 3.1San Francisco 49 874,961 17,847 2.2Oakland 58 425,097 7,333 2.7Concord 31 129,183 4,105 3.5
B. Network Typologies
Flow distribution on roads will differ based on how the system is optimized. Hence understanding the distributionof traffic flows on road types is relevant for impact elevation. Traditionally, road classification systems are based onmobility and access for vehicular use [30]. This study seeks to incorporate the local context of streets, which includeshow the dynamics of the vehicular traffic impacts localized populations. To this end, we created a road classificationscheme based on the principles of USDOT complete street guidelines [31]. Complete streets provides guidelines for thedesign and operation of streets to enable safe use and support mobility of all citizens. Adoption of these guidelines isunderway by a variety of cities. For example, San Francisco has classified their street based on land use characteristics,transportation roles and special characteristics (eg. alleys, parkways). This resulted in 16 classes that were designedusing extensive community surveys and manual labelling [32]. Similarly, San Jose classified streets into 8 types basedon a street’s primary function and adjacent land use context [33]. Because we wish to compare our indicators across allof Bay Area cities, we created an alternative classification scheme based on parcel level zoning data and street functional

6
Fig. 5. Bay area cities colored by percapita trips.
classes. This classification scheme, of 8 types, allowed us to then partition and develop improved metrics that will behelpful for evaluating the themes of our framework.
Our classification uses the Mobiliti road network, which was derived from a professional map from HERE Technologies[34]. The HERE technologies map includes definitions of five functional class roads defined in Appendix C Table 2. Foridentifying the transport context, links are classified into three types - highways, throughways, and neighborhood streets.These are based on the functional classification and speeds: highways group higher functional class links of 1, 2, and 3with speeds greater than 50 mph, throughways group rest of class 3 and 4 links that carry greater volumes and higherspeeds of vehicle traffic, and neighborhood streets group class 5 links with lower speeds and volumes. For identifyingland use context, parcel level zoning data obtained from Metropolitan Transportation Commission (MTC) is used. Thereare 1,956,207 parcels in the analysis region grouped into either of the five land uses - residential, commercial, industrial,public-semi public and others. For each link, the side use is determined based on the zoning of the adjacent parcels.If the link is associated with more than one parcel, the use of the largest parcel is assigned to the link. Based on thetransport and land use context for each link, 8 street types are established. This classification composition for Bay Areastreets is shown in Figure 6. Appendix C Table 3 details the network lengths associated with the classification. Theclassification, while slightly coarser than a more detailed partitioning, does not involve the complexity of surveys andmanual labeling and can still provide a good understanding of the network typologies. Figure 7 shows the resulting

7
context based link classification for the four cities of interest.
Fig. 6. Network typologies for Bay Area. Neighborhood residential streets constitutes the highest share followed by highways. Individual cities reflectsimilar partitioning.
C. Methods for Quantifying Indicators
Quantifying the indicators described in the framework can be accomplished by using existing models, developing newmodels, and accessing city data, eg. zoning use, numbers of accidents, traffic flow and speeds from highway and citydetectors, locations of schools. For our initial approach, we chose to confine our attention to the development of thebroad framework as discussed in the previous section and examine a subset of indicators. A list of indicators evaluatedfor our case study cities and their corresponding method for evaluation is provided in Table II. The Mobiliti simulationresults for each optimization scenario described in the previous section provided link level flow and speeds for ourevaluations.
TABLE IIMETHODS USED TO EVALUATE INDICATORS
Theme Indicator Method
Neighborhood VMT on neighborhood residential streets, VHD on neigh-borhood residential streets
Neighborhood residential streets are identified asdescribed in section IV-B
Number of schools near high and medium traffic streets,VMT near schools in morning hours
Section IV-C1
Safety Estimated number of highway accidents/year Section IV-C2Mobility VMT, VHD, Congested network miles in morning, Av-
erage trip length, Average trip delaySection IV-C3
Equity Minority schools near high and medium traffic streets,VMT on disadvantaged communities, VHD on disadvan-taged communities
Section IV-C4
Environment Total fuel consumption, Average trip fuel consumption Section IV-C3
1) Neighborhood Indicators Impact near schools is an important indicator in the neighborhood theme. Exposureto traffic-related air pollutants has been associated with a range of adverse long term and short term health effects.Long term traffic related air pollution can cause breathing and mental health problems, and in the short term, increasedtraffic flow near schools pose accident risk and congestion around schools. Previous studies have demonstrated that itis preferable to locate schools in areas with higher percentages of local roads in order to reduce the exposure to airpollutants [35]. However, vehicle route optimizations may have diverted traffic to local roads and inadvertently changethe predicted exposure levels. We examine these impacts by a) identifying high and medium traffic flow links aroundschools, and b) estimating the increased vehicular traffic during morning schools hours. We further examine whetherminority schools absorb more of this exposure than their counterparts.

8
Fig. 7. Network Typologies for Oakland, San Jose, San Francisco and Concord. Oakland has the highest percentage of highways and Concord hasthe highest percentage of neighborhood residential streets.
School data on the location and characteristics of 1849 public schools in the Bay Area, grades pre-kindergarten through12 was obtained from Elementary/Secondary Information System (ElSi), which is a web application of National Centrefor Education Statistics (NCES) using data from the Common Core of Data (CCD) for the year 2018-2019. We evaluatedroads within a 250m radius of each school [36]. Studies suggest that Average Daily Traffic (ADT) greater than 50,000creates high exposure to traffic emissions, and between 25,000 to 50,000 is considered medium exposure [37], [38]. Forall links in the buffer of each school, ADT counts were calculated to determine if these thresholds were exceeded. Inaddition, we identify the effects of increased traffic flow during the morning 7-8 am hours when children are likely tobe present, by calculating the vehicle miles travelled (VMT) for the same links in the 250m buffer. We then stratifiedby socio-economic indicators of the school. A school is defined as a minority school if the majority (75% of higher) ofstudents in the school are minority (Black, Hispanic, Asian/Pacific Islander, or American Indian/Alaska Native).
2) Safety Indicators Estimating the accidents for highways and local roads is based on a number of factors liketraffic flow, road geometry,and road type [39]. For the state of California, Caltrans has developed safety performancefunctions (SPF) to estimate the occurrence of accidents on highways [40]. The safety performance function calculatesthe estimated number of accidents per year on a road segment as a function of average daily traffic (ADT) and lengthof the road. We use the Type 1 SPF which is specified as:
λi = α+ ln(length)i + βln(ADT )i (1)

9
where: λ is the estimated number of accidents per year, ADT is the Average daily traffic. The model parametersestimated using Pems data is described in Appendix D.
3) Mobility and Environment Indicators Mobility indicators used in the framework include key system performancemetrics eg. vehicle miles travelled (VMT), vehicle hours of delay (VHD), congested urban VMT, as well as, trip levelmetrics, eg. average trip distance and time. VMT is typically a system performance measure reported for overall analysis.It is calculated as the vehicle flow on a link multiplied by the link lengths. VHD is the delay per vehicle for a givensegment, multiplied by the total number of vehicles, where delay per vehicle is calculated as actual travel time minusthe free flow travel time. Congested network miles is calculated as the length of network congested, where congestion isdefined as volume over capacity greater than or equal to 1 for a link. For trip level metrics, the average travel distanceand average time is calculated from Mobiliti trip data. For the environment theme, total system fuel consumption andaverage trip fuel consumption are also calculated by Mobiliti.
4) Equity Indicators Transportation equity is an important consideration when evaluating routing strategies. Disadvan-taged communities often bear disproportionate impacts of traffic exposure. To evaluate our equity measures, we identifydisadvantaged communities from MTC’s communities of concern classification. The 2020 update of MTC’s Communitiesof Concern (COC) is based on on 2014 - 2018 American Community Survey (ACS) 5-year tract level data. The MTCCOC definition is based on 8 disadvantage factors and respective thresholds [41]. The factors are minority, low income,limited English proficiency, zero vehicle households, senior citizens, people with disability, single parent family, andseverely rent-burdened households. All census tracts with concern class categorised as high, higher and highest areconsidered as part of our disadvantaged group (Figure 8). We calculate the proportion of VMT and VHD on the linksin COC census tracts and compare with the proportion of population in those census tracts. ACS 5-year estimates for2014 - 2018 is obtained for census tract population [42].
Fig. 8. Theme Equity: Communities of Concern census tracts in the case study cities. Oakland has the highest percentage of population living inthese census tracts and Concord the least.

10
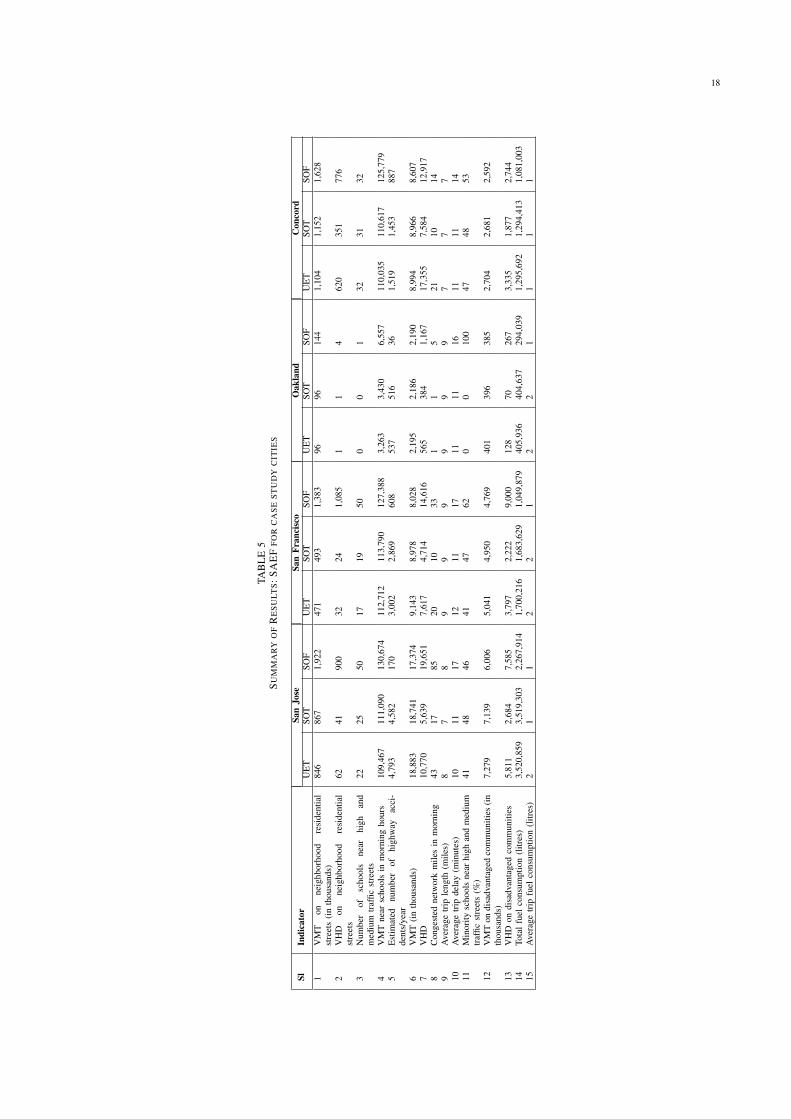
D. Evaluation Results
For each city, fifteen indicators from the SAEF framework are calculated and compiled using a stacked bar chartfor visual comparison across the routing optimization scenarios. Figure 9 presents the results for San Jose. Summarytable and charts for the three other cities are provided in the Appendix E. For added insights, we compare optimizationscenarios for each of the indicators, similarly we also compare across our four focus cities. For the rest of this sectionwe will discuss results for San Jose. For comparison of optimizations, we take UET optimized routes as our baseline.
Fig. 9. SAEF Indicators for San Jose. Blue, orange and green represents the UET, SOT and SOF indicator values.
1) City Level Indicator Comparisons Theme: Neighborhooda. VMT disproportionately increases on neighborhood residential streets with SOT and SOF derived routes. While the
total system VMT reduces with SOT and SOF, the residential VMT increases for both cases. Additionally the shareof VMT carried by these streets (out of the total) also increases with SOT and SOF. Neighborhood residential streetsaccount for 4% of the total VMT in our baseline UET and increases to 5% and 11% with SOT and SOF respectively.
b. Neighborhood residential streets VHD decreases with SOT and increases with SOF. However the share of delaycarried by these streets out of the total system delay increases in both SOT and SOF compared to baseline showingboth optimizations has attained its goal by routing more vehicles through previously less used streets. In baseline,these streets carry 62 hours of delay as opposed to 41 in SOT and 900 in SOF. Looking at the percentage share ofthese delays with respect to total, in baseline it is 0.58% of the total city VHD, which slightly increases with SOT(0.73%) and more than doubles with SOF (4.5%). This increase in system delay with SOF reflects highway delaybeing decreased significantly.
c. The number of schools exposed to high and medium traffic increases significantly with SOF due to traffic shift tolocal roads. Exposure to high and medium traffic occurs for 9% of schools in our baseline UET. This percentageslightly increases with SOT; and doubles with SOF. VMT in the 250m buffer zone of school also increases with SOTand SOF as compared to baseline.
Theme: Safetya. Estimated number of highway accidents significantly reduces with SOF, while it remains similar for SOT and baseline.
The obvious reason for the large reduction is the shift of highway traffic to local roads with the SOF optimization.It will be important to include an estimate of urban accidents, which we aim to add for future analysis.
Theme: Mobilitya. Overall, system VMT decreases with SOT and SOF compared to baseline UET.b. VHD decreases with SOT and increases with SOF. SOF shifts traffic from highways to local roads in an attempt to
save fuel as can be seen in Figure 10. In SOT, the total system delay reduction happens by rearranging flows fromhighways to throughways instead of neighborhood streets.
c. Congested network miles in the morning peak decreases with SOT and increases with SOF consistent with delayincrease.

11
d. Average trip length remains similar for all three cases. However, trip delay increases with SOF.
Fig. 10. Theme Mobility: The figure shows the difference in VMT for SOT (left) and SOF (right) compared to baseline UET for San Jose. The redand green represents increase and decrease in VMT for each link respectively. The thickness of the links represents the magnitude of difference. Onlyhighways and neighborhood residential streets are shown. It can be observed from the map that SOF has shifted traffic from highways to residentialstreets as indicated by red.
Theme: Equitya. Minority schools bear disproportionate impacts of traffic exposure. While impacting all types of schools, it is estimated
to be more prevalent for minority schools. 22% of schools are categorised as minority schools in San Jose. Theproportion of schools affected by this predicted exposure is 41% in baseline. This percentage further increases by atleast 5 percentage points with SOT and SOF.
b. Consistent with VMT reduction trends, VMT in disadvantaged communities reduces with SOT and SOF routing.Delay also shows similar trends. Note that the population in disadvantaged communities constitutes 32% of the total,but account for 40% VMT and 55% VHD with UET.This reflects the tendency of these communities to be locatednear highways with high flow rates. These percentages are reduced with SOT and SOF optimizations.
Theme: Environmenta. As expected, SOF produced the lowest total system fuel consumption. SOT and baseline values are similar. Average
trip fuel also shows similar trends with total system fuel consumption. These indicators are very sensitive to the fuelmodel used in the Mobiliti simulation, which currently considers only an average speed per link. We plan to improvethis model in the future to account for speed variability that will be important for local link modeling.

12
Fig. 11. Theme Neighborhood: The figure illustrates the schools affected by high and medium traffic volume. Red links have an ADT greater than50,000 and yellow links have ADT between 25,000 and 50,000.
2) Comparison Across Cities Size, structure, land use, and density can vary widely across cities. By comparingrouting optimizations across cities, similarities and differences can be seen with respect to our framework indicatorswhich are listed below 12.
Key Similarities:a. For all four cities, percentage VMT carried by neighborhood residential streets increases with SOT and SOF compared
to baseline. The highest increase is for Oakland, followed by San Jose.b. For all cities but Concord, neighborhood residential streets VHD decreases with SOT and increases with SOF. However
the percentage share out of the total system delay increases in both cases for all cities. With SOT the percentageincrease is small and with SOF, the delay significantly increases for all cities with Oakland facing the worst impacts.Neighborhood streets in Oakland are predicted to experience 30 times higher delay as compared to baseline. Oaklandhas higher highway miles within the city limits and with SOF routing traffic to local roads, it does not have as muchcapacity on its local roads to absorb the traffic and thus would experience high neighborhood residential delays. ForSan Francisco and Concord the percentage delay increase is not as high as the other two cities. San Francisco hasthe lowest percentage of neighborhood residential streets in the network and its gridiron structure may account forthe different flow dissipation.
c. San Jose and Oakland are predicted to have a higher number of schools exposed to high and medium traffic withSOF compared to baseline.
d. The total system VMT decreases with SOT and SOF compared to baseline for all cities.e. System level VHD decreases with SOT for all cities. VHD increases with SOF for all except San Francisco.f. For the equity theme indicators - VMT and VHD on disadvantaged communities - in San Jose, San Francisco and
Concord, disadvantaged communities bear a disproportionate share of traffic compared to its population. For SanJose population in disadvantaged census tracts account for 32% of the total population, but their streets carry 40%of total VMT and 55% total VHD with baseline. Similar trends can be observed in San Francisco and Concord. Nosignificant change can be seen in the VMT proportion with SOT and SOF.

13
Fig. 12. Comparison of SAEF metrics across cities for different route optimizations

14
Key Differences:a. For Concord, the amount of neighborhood residential street VHD remains same for SOT and baseline, while it reduces
for all other cities. Congestion was very low in the baseline UET case for Concord as such system level optimizationhad little effect. This is likely due to the spatial spread and low-density character of the city.
b. Concord also differed in the number of schools exposed to high traffic - with no impacted schools in baseline andSOT and 1 school with SOF. For San Francisco, the number of affected schools remains similar for all the routingcases. Note that only 24% schools in San Francisco are minority, but they account for 47% of the schools exposedto high and medium traffic.
c. COCs account for a higher percentage of the Oakland road network than the other three cities. As a consequence,a goodpercentage of the VMT and VHD occurs in these communities, 55% and 50% of total VMT and VHD respectively.
Our intent with this work is to provide an evaluation framework to enable reflection on the consequence of policies,traffic management strategies and network changes. With an ability to model out proposed traffic management strategies,the planner can consider the trade-offs and potential unintended consequences. Realizing that there will always undesirableconsequences of a specific strategy due the complexity and interconnectedness of transportation systems, the plannercan then develop mediation strategies for the predicted results.
V. CONCLUSION AND FUTURE WORK
We have presented a framework to holistically evaluate the impacts of traffic management policies. We specificallyfocus on routing strategies using our key themes of neighborhood, safety, mobility, equity, and environment. A roadnetwork typology classification scheme that allows for the development of improved indicators is presented. Three trafficassignment optimization strategies are evaluated to offer insights into how the resulting routes and consequent trafficdynamics will impact the constituents of a city. Four chosen cities in the Bay Area were assessed for comparisonpurposes. We found that a) neighborhood residential streets are the most impacted with changes in routing strategiesin terms of both increased traffic flow and delay, b) strategies differ in their traffic exposure impacts to schools, withminority schools bearing disproportionate impacts of traffic exposure, and c) the dynamics differ based on the networkcharacteristics of a city e.g. percentage of highways, street layouts, density of roads. The framework creates an assessmentsystem that will enable cities to evaluate the effects of transportation policies and management strategies. It provides atool for cities to assess their decisions in a comprehensive manner, while recognising the trade-offs resulting from thetraffic dynamics. In future work, we plan to extend our analysis to include more cities and classify them based on theirnetwork characteristics to determine if patterns of traffic distribution/dissipation based on network characteristics exist.More importantly, we intend to use the framework to develop aggregate measures of safety and neighborhood that willdrive novel socially-aware routing strategies and road network adjustments.
ACKNOWLEDGMENT
The work described here was sponsored by the U.S. Department of Energy (DOE) Vehicle Technologies Office(VTO) under the Big Data Solutions for Mobility Program, an initiative of the Energy Efficient Mobility Systems(EEMS) Program. This research used resources of the National Energy Research Scientific Computing Center, a DOEOffice of Science User Facility supported by the Office of Science of the U.S. Department of Energy under ContractNo. DE-AC02-05CH11231.

15
APPENDIX
A. SAEF Indicator Description
TABLE 1: SAEF Indicator Description
Theme Indicator Description Unit Spatial level Temporal levelNeighborhood VMT on neighborhood
residential streetsVehicle miles travelled on neighbourhoodresidential street is calculated. City streetsneeds to be classified based on completestreets guidelines to identify neighborhoodresidential streets based on land use andtransport functionalities
miles Community Entire day / Peakhours
Neighborhood VHD on neighborhoodresidential streets
Vehicle hours of delay on neighbourhoodresidential street is evaluated. City streetsneeds to be classified based on completestreets guidelines to identify neighborhoodresidential streets
hours Community Entire day / Peakhours
Neighborhood Number of schools nearhigh and traffic streets
High traffic is considered as streets withaverage daily traffic (ADT) greater than50,000 and medium traffic streets has ADTgreater than 25,000 vehicles per day. Allroads within 250 m of school vicinity isconsidered for this analysis as traffic onthem has the most impact on schools.
number City Entire day
Neighborhood VMT near schools in themorning hours
Vehicle miles travelled in the 250 metervicinity of schools. VMT is calculated for 7-8am in the morning. This indicator helps inunderstanding the difference in traffic flowaround schools for various routing strategies
miles City Peak hours
Neighborhood Average travel speedalong neighborhoodresidential streets
Average travel speed on neighborhood resi-dential streets can be calculated for morningor evening peaks. This gives an estimate ofhow the traffic moves in neighborhoods
miles perhour (mph)
Community Entire day / Peakhours
Neighborhood Percentage vehicles abovespeed limit in neighbor-hood streets
Percentage vehicles travelling above theposted speed limit at different times of daygives an indication of the traffic flow affect-ing the quality of life in neighborhoods.
percentage(%)
Community Peak hours
Safety Estimated number ofhighway accidents/year
Highway accidents estimated based on traf-fic volume and road geometry. Safety per-formance functions for highways can beused.
number City Entire day
Safety Estimated urbanaccidents/year
Urban accidents estimated from traffic vol-ume and road geometry.
number City Entire day
Safety VMT on high pedestrianand ATM streets
Vehicle miles travelled on active transportmode users and pedestrians. This measuresthe multi modal safety of roads. Routingstrategies that increases VMT on these roadshinders others active users of the road.
miles City Entire day / Peakhours
Safety VMT on high risk streets High risk roads involves roads with hotspots, steep slopes etc which can be dan-gerous when unknown drivers are routedthrough them.
miles City Entire day / Peakhours
Mobility VMT Total system vehicle miles travelled miles City Entire dayMobility VHD Total system vehicle hours of delay hours City Entire dayMobility Congested network miles
in morningRoads with volume over capacity greaterthan or equal to 1 during morning hours.This measures the congested network foreach routing strategy. Spatial spread of con-gestion might be good to visualise as well.
miles City Peak hours
Mobility Average trip length Average trip length for a city. It can segre-gated to work and non work trips as well.
miles Individual Entire day
Mobility Average trip delay Average trip delay for a city. It can segre-gated to work and non work trips as well.
minutes Individual / City Entire day
Mobility Bicycle/Pedestrian LTS Bicycle and pedestrian level of traffic stressrating can be given to road segments basedon the type of facility, traffic volume andspeed. Standard methods from literature canbe adopted.
City / Commu-nity
Peak hours
Equity Minority schools nearhigh and medium trafficstreets
Minority schools are identified as majoritychildren in school in minority classification.Then these schools are checked for a bufferof 250 metres to identify exposure to highand medium traffic.
number orpercentage(%)
City Entire day

16
Equity VMT on disadvantagedcommunities
Vehicle miles travelled on disadvantagedcommunities. Disadvantaged communitiescan be identified based on each city’s orcounty’s definition.
miles Community Entire day
Equity VHD on disadvantagedcommunities
Vehicle hours of delay on disadvantagedcommunities. Disadvantaged communitiescan be identified based on each city’s orcounty’s definition.
hours Community Entire day
Equity % people within 45 minof one way work commuteby demography
Percentage population within 45 minutes ofwork commute helps in understanding theaccessibility of a place. Based on whichrouting strategies objective and trade offscan be explored.
percentage(%)
City Entire day
Environment Total fuel consumption Total system fuel consumption by total trips. litres City Entire dayEnvironment Average fuel consump-
tion/tripPer trip average fuel consumption. litres Individual Entire day
Environment Emissions percapita Emissions per person in a city. Methodsto calculate emissions from vehicular trafficcan be adopted from the literature.
City Entire day
B. QDTA Formulations
UET :∑a∈A
∫ fa
0ca(s) ds (2)
SOT :∑a∈A
faca(fa) (3)
SOF :∑a∈A
fama(va) (4)
where:ca(fa) = c0,a(1 + α( fa
Ca)β)
ca(fa) is the travel time on link a; fa is the traffic flow assigned to link a; c0,a and Ca are the free-flow travel time and capacity associated withthe link; α and β selected are BPR parameters 0.15 and 4 respectively.
ma(va) = la(A+ Bva
+ Cv2a)
ma(va) is the fuel consumption on link a; la is the length of link a; va is the link traversal speed calculated from BPR; A,B,C are parametersestimated from Argonne National Laboratory drive cycle data A = −0.00654170, B = 1.902150, C = 0.00001588.
C. Bay Area NetworkBay Area network functional classification is provided in Table 2 and the network typologies are provided in Table 3
TABLE 2FUNCTIONAL ROAD CLASSES
Functional Class Definition
1 Allowing for high volume, maximum speed traffic movement2 Allowing for high volume, high speed traffic movement3 Providing a high volume of traffic movement4 Providing for a high volume of traffic movement at moderate speeds between neighbourhoods5 Roads whose volume and traffic movement are below the level of any other functional class
D. SPF Parameters Used for California HighwaysThe safety performance function parameters estimated from PEMS data for the state of California is provided in Table 4 [40].
E. Summary of ResultsSummary of results is provided in Table 5 for the case study cities. Figure13 shows the SAEF charts for the three cities.

17
TABLE 3NETWORK TYPOLOGIES FOR BAY AREA
Sl No Street Type Length (thousand miles) Remarks
1 Neighborhood Residential Street 26 Neighborhood streets with adjoining resi-dential land use
2 Residential Throughway 2.9 Throughway streets with adjoining residen-tial land use
3 Neighborhood Commercial Street 1.8 Neighborhood streets with adjoining com-mercial land use
4 Commercial Throughway 1.1 Throughway streets with adjoining commer-cial land use
5 Industrial Street 1.7 Neighbourhood or Throughway streets withadjoining industrial land use
6 PSP Street 2.5 Neighbourhood or Throughway streets withadjoining public and semi public land use
7 Highway 3.4 Highways including ramps8 Others 9.9 Includes streets with adjoining land use
as green spaces, undeveloped land,parkinglots, water bodies etc.
TABLE 4SPF PARAMETERS FOR CALIFORNIA HIGHWAYS
Number of lanes alpha beta
1 -7.09 0.982 -7.09 0.983 -7.09 0.984 -5.78 0.825 -6.49 0.896 -6.49 0.897 -6.49 0.898 -10.75 1.24
18
TAB
LE
5S
UM
MA
RY
OF
RE
SU
LTS:S
AE
FF
OR
CA
SE
ST
UD
YC
ITIE
S
SlIn
dica
tor
San
Jose
San
Fran
cisc
oO
akla
ndC
onco
rdU
ET
SOT
SOF
UE
TSO
TSO
FU
ET
SOT
SOF
UE
TSO
TSO
F1
VM
Ton
neig
hbor
hood
resi
dent
ial
stre
ets
(in
thou
sand
s)84
686
71,
922
471
493
1,38
396
9614
41,
104
1,15
21,
628
2V
HD
onne
ighb
orho
odre
side
ntia
lst
reet
s62
4190
032
241,
085
11
462
035
177
6
3N
umbe
rof
scho
ols
near
high
and
med
ium
traf
ficst
reet
s22
2550
1719
500
01
3231
32
4V
MT
near
scho
ols
inm
orni
ngho
urs
109,
467
111,
090
130,
674
112,
712
113,
790
127,
388
3,26
33,
430
6,55
711
0,03
511
0,61
712
5,77
95
Est
imat
ednu
mbe
rof
high
way
acci
-de
nts/
year
4,79
34,
582
170
3,00
22,
869
608
537
516
361,
519
1,45
388
7
6V
MT
(in
thou
sand
s)18
,883
18,7
4117
,374
9,14
38,
978
8,02
82,
195
2,18
62,
190
8,99
48,
966
8,60
77
VH
D10
,770
5,63
919
,651
7,61
74,
714
14,6
1656
538
41,
167
17,3
557,
584
12,9
178
Con
gest
edne
twor
km
iles
inm
orni
ng43
1785
2010
331
15
2110
149
Ave
rage
trip
leng
th(m
iles)
87
89
99
99
97
77
10A
vera
getr
ipde
lay
(min
utes
)10
1117
1211
1711
1116
1111
1411
Min
ority
scho
ols
near
high
and
med
ium
traf
ficst
reet
s(%
)41
4846
4147
620
010
047
4853
12V
MT
ondi
sadv
anta
ged
com
mun
ities
(in
thou
sand
s)7,
279
7,13
96,
006
5,04
14,
950
4,76
940
139
638
52,
704
2,68
12,
592
13V
HD
ondi
sadv
anta
ged
com
mun
ities
5,81
12,
684
7,58
53,
797
2,22
29,
000
128
7026
73,
335
1,87
72,
744
14To
tal
fuel
cons
umpt
ion
(litr
es)
3,52
0,85
93,
519,
303
2,26
7,91
41,
700,
216
1,68
3,62
91,
049,
879
405,
936
404,
637
294,
039
1,29
5,69
21,
294,
413
1,08
1,00
315
Ave
rage
trip
fuel
cons
umpt
ion
(litr
es)
21
12
21
22
11
11

19
Fig. 13. SAEF results for San Francisco, Oakland and Concord

20
REFERENCES
[1] A. M. Hendawi, A. Rustum, A. A. Ahmadain, D. Hazel, A. Teredesai, D. Oliver, M. Ali, and J. A. Stankovic, “Smart Personalized Routing forSmart Cities,” in 2017 IEEE 33rd International Conference on Data Engineering (ICDE), Apr. 2017, pp. 1295–1306, iSSN: 2375-026X.
[2] S. Siuhi and J. Mwakalonge, “Opportunities and challenges of smart mobile applications in transportation,” Journal of Traffic and TransportationEngineering (English Edition), vol. 3, no. 6, pp. 582–592, Dec. 2016. [Online]. Available: https://www.sciencedirect.com/science/article/pii/S2095756416302690
[3] “People who use their cell phone for maps/GPS navigation in the U.S. 2018, by age.” [Online]. Available: https://www.statista.com/statistics/231615/people-who-use-their-cell-phone-for-maps-gps-navigation-usa/
[4] “The Popularity of Navigation Apps and Impact on Traffic Operations.” [Online]. Available: https://www.ite.org/events-meetings/ite-calendar/the-popularity-of-navigation-apps-and-impact-on-traffic-operations/
[5] J. Macfarlane, “Your Navigation App Is Making Traffic Unmanageable - IEEE Spectrum.” [Online]. Available: https://spectrum.ieee.org/computing/hardware/your-navigation-app-is-making-traffic-unmanageable
[6] C. Chan, B. Wang, J. Bachan, and J. Macfarlane, “Mobiliti: Scalable Transportation Simulation Using High-Performance Parallel Computing,”in 2018 21st International Conference on Intelligent Transportation Systems (ITSC), Nov. 2018, pp. 634–641, iSSN: 2153-0017.
[7] C. Chan, A. Kuncheria, B. Zhao, T. Cabannes, A. Keimer, B. Wang, A. Bayen, and J. Macfarlane, “Quasi-Dynamic Traffic Assignment usingHigh Performance Computing,” arXiv:2104.12911 [cs], Apr. 2021, arXiv: 2104.12911. [Online]. Available: http://arxiv.org/abs/2104.12911
[8] O. Chen and M. Ben-Akiva, “Game-theoretic formulations of interaction between dynamic traffic control and dynamic traffic assignment,”Transportation Research Record, vol. 1617, no. 1, pp. 179–188, 1998. [Online]. Available: https://doi.org/10.3141/1617-25
[9] N. Groot, B. De Schutter, and H. Hellendoorn, “Toward System-Optimal Routing in Traffic Networks: A Reverse Stackelberg Game Approach,”Intelligent Transportation Systems, IEEE Transactions on, vol. 16, pp. 29–40, Feb. 2015.
[10] B. Ran, D. E. Boyce, and L. J. LeBlanc, “A New Class of Instantaneous Dynamic User-Optimal Traffic Assignment Models,” Operations Research,vol. 41, no. 1, pp. 192–202, Feb. 1993, publisher: INFORMS. [Online]. Available: https://pubsonline.informs.org/doi/10.1287/opre.41.1.192
[11] F. Zhu and S. V. Ukkusuri, “A linear programming formulation for autonomous intersection control within a dynamic traffic assignment andconnected vehicle environment,” Transportation Research Part C: Emerging Technologies, vol. 55, pp. 363–378, Jun. 2015. [Online]. Available:https://www.sciencedirect.com/science/article/pii/S0968090X1500008X
[12] W. Ackaah, “Exploring the Use of Advanced Traffic Information System to Manage Traffic Congestion in Developing Countries,” ScientificAfrican, vol. 4, p. e00079, May 2019.
[13] S. Alaok, “Smart Traffic Management With Real Time Data Analysis.” [Online]. Available: https://www.academia.edu/28689551/Smart TrafficManagement With Real Time Data Analysis
[14] A. Paricio and M. A. Lopez-Carmona, “Urban Traffic Routing Using Weighted Multi-Map Strategies,” IEEE Access, vol. 7, pp. 153 086–153 101,2019, conference Name: IEEE Access.
[15] “Predicting Future Travel Times with the Google Maps APIs.” [Online]. Available: https://cloud.googleblog.com/2015/11/predicting-future-travel-times-with-the-Google-Maps-APIs.html
[16] H. Mahmassani and S. Peeta, “Network performance under system optimal and user equilibrium dynamic assignments: Implications for ATIS,”Transportation Research Record Journal of the Transportation Research Board, vol. 1408, pp. 83–93, Jan. 1993.
[17] R.-C. Jou, S.-H. Lam, Y.-H. Liu, and K.-H. Chen, “Route switching behavior on freeways with the provision of different types of real-timetraffic information,” Transportation Research Part A: Policy and Practice, vol. 39, no. 5, pp. 445–461, Jun. 2005. [Online]. Available:https://www.sciencedirect.com/science/article/pii/S0965856405000297
[18] L. Alfaseeh and B. Farooq, “Multi-Factor Taxonomy of Eco-Routing Models and Future Outlook,” Journal of Sensors, vol. 2020, p. e4362493,Jan. 2020, publisher: Hindawi. [Online]. Available: https://www.hindawi.com/journals/js/2020/4362493/
[19] K. Ahn and H. A. Rakha, “Network-wide impacts of eco-routing strategies: A large-scale case study,” Transportation Research Part D: Transportand Environment, vol. 25, pp. 119–130, Dec. 2013. [Online]. Available: https://www.sciencedirect.com/science/article/pii/S1361920913001259
[20] J. Lazarus, J. Ugirumurera, S. Hinardi, M. Zhao, F. Shyu, Y. Wang, S. Yao, and A. M. Bayen, “A Decision Support System for Evaluating theImpacts of Routing Applications on Urban Mobility,” in 2018 21st International Conference on Intelligent Transportation Systems (ITSC), Nov.2018, pp. 513–518, iSSN: 2153-0017.
[21] T. Cabannes, F. Shyu, E. Porter, S. Yao, Y. Wang, M. A. Sangiovanni Vincentelli, S. Hinardi, M. Zhao, and A. M. Bayen, “Measuring Regret inRouting: Assessing the Impact of Increased App Usage,” in 2018 21st International Conference on Intelligent Transportation Systems (ITSC),Nov. 2018, pp. 2589–2594, iSSN: 2153-0017.
[22] A. Elbery and H. Rakha, “City-Wide Eco-Routing Navigation Considering Vehicular Communication Impacts,” Sensors (Basel, Switzerland),vol. 19, no. 2, Jan. 2019. [Online]. Available: https://www.ncbi.nlm.nih.gov/pmc/articles/PMC6359317/
[23] H. Ahvenniemi, A. Huovila, I. Pinto-Seppa, and M. Airaksinen, “What are the differences between sustainable and smart cities?” Cities,vol. 60, pp. 234–245, Feb. 2017. [Online]. Available: http://www.scopus.com/inward/record.url?scp=84988735775&partnerID=8YFLogxK
[24] T. Koglin, Toth-Szabo, A. Varhelyi, and Angjelevska, Measuring sustainability of transport in the city – development of an indicator-set, Jan.2011.
[25] A. Orlowski and P. Romanowska, “Smart Cities Concept: Smart Mobility Indicator,” Cybernetics and Systems, Feb. 2019.[26] C. Benevolo, R. Dameri, and B. D’Auria, “Smart Mobility in Smart City. Action taxonomy, ICT intensity and public benefits,” Jan. 2016, vol. 11,
pp. 13–28.[27] J. O. Onatere, C. Nwagboso, and P. Georgakis, “Performance indicators for urban transport development in Nigeria,” The Algarve, Portugal,
May 2014, pp. 555–568. [Online]. Available: http://library.witpress.com/viewpaper.asp?pcode=UT14-046-1[28] Z. Toth-Szabo and A. Varhelyi, “Indicator framework for measuring sustainability of transport in the city,” Procedia - Social and Behavioral
Sciences, vol. 48, pp. 2035–2047, 2012, transport Research Arena 2012. [Online]. Available: https://www.sciencedirect.com/science/article/pii/S1877042812029205
[29] “SF-CHAMP Modeling.” [Online]. Available: https://www.sfcta.org/sf-champ-modeling[30] “- Highway Functional Classifications - Related - Statewide - Processes - Planning - FHWA.” [Online]. Available: https:
//www.fhwa.dot.gov/planning%20/processes/statewide/related/highway functional classifications/section02.cfm[31] Complete streets policies | US department of transportation. [Online]. Available: https://www.transportation.gov/mission/health/
complete-streets-policies[32] “Better Streets Plan | SF Planning.” [Online]. Available: https://sfplanning.org/resource/better-streets-plan[33] San jose complete streets design standards & guidelines, 2018. [Online]. Available: https://sanjose.legistar.com/LegislationDetail.aspx?ID=
3374912&GUID=91989EDD-9A4D-43D3-97CD-37DD05ED8A2A[34] “HERE Technologies | The world’s #1 location platform.” [Online]. Available: https://www.here.com/[35] C.-Y. Yu and X. Zhu, “Planning for Safe Schools: Impacts of School Siting and Surrounding Environments on Traffic Safety,” Journal of
Planning Education and Research, vol. 36, Nov. 2015.

21
[36] S. L. Kingsley, M. Eliot, L. Carlson, J. Finn, D. L. MacIntosh, H. H. Suh, and G. A. Wellenius, “Proximity of US Schools to Major Roadways:a Nationwide Assessment,” Journal of exposure science & environmental epidemiology, vol. 24, no. 3, pp. 253–259, 2014. [Online]. Available:https://www.ncbi.nlm.nih.gov/pmc/articles/PMC4179205/
[37] R. S. Green, S. Smorodinsky, J. J. Kim, R. McLaughlin, and B. Ostro, “Proximity of California public schools to busy roads.” EnvironmentalHealth Perspectives, vol. 112, no. 1, pp. 61–66, Jan. 2004. [Online]. Available: https://ehp.niehs.nih.gov/doi/10.1289/ehp.6566
[38] Y.-C. Wu and S. A. Batterman, “Proximity of schools in Detroit, Michigan to automobile and truck traffic,” Journal of Exposure Science &Environmental Epidemiology, vol. 16, no. 5, pp. 457–470, Sep. 2006, number: 5 Publisher: Nature Publishing Group. [Online]. Available:https://www.nature.com/articles/7500484
[39] “Road Traffic Safety Risk Estimation Method Based on Vehicle Onboard Diagnostic Data.” [Online]. Available: https://www.hindawi.com/journals/jat/2020/3024101/
[40] V. Shankar and S. Madanat, “Methods for Identifying High Collision Concentrations for Identifying Potential Safety Improvements: Developmentof Safety Performance Functions for California,” Jan. 2015, number: CA15-2317. [Online]. Available: https://trid.trb.org/view/1370064
[41] “MTC Equity Priority Communities in 2018 (ACS 2012 - 2016).” [Online]. Available: https://opendata.mtc.ca.gov/maps/MTC::mtc-equity-priority-communities-in-2018-acs-2012-2016
[42] U. C. Bureau, “American Community Survey Data.” [Online]. Available: https://www.census.gov/programs-surveys/acs/data.html