
1 Small Area Demographics Using Census 2010 TIGER Geographies With SF1 and American Community Survey...
51
1 Small Area Demographics Using Census 2010 TIGER Geographies With SF1 and American Community Survey (ACS) Data Frank Gossette November 16, 2013
-
Upload
natalie-spencer -
Category
Documents
-
view
215 -
download
0
Transcript of 1 Small Area Demographics Using Census 2010 TIGER Geographies With SF1 and American Community Survey...
1
Small Area Demographics
Using Census 2010 TIGER Geographies
With SF1 and American Community Survey (ACS) Data
Frank GossetteNovember 16, 2013
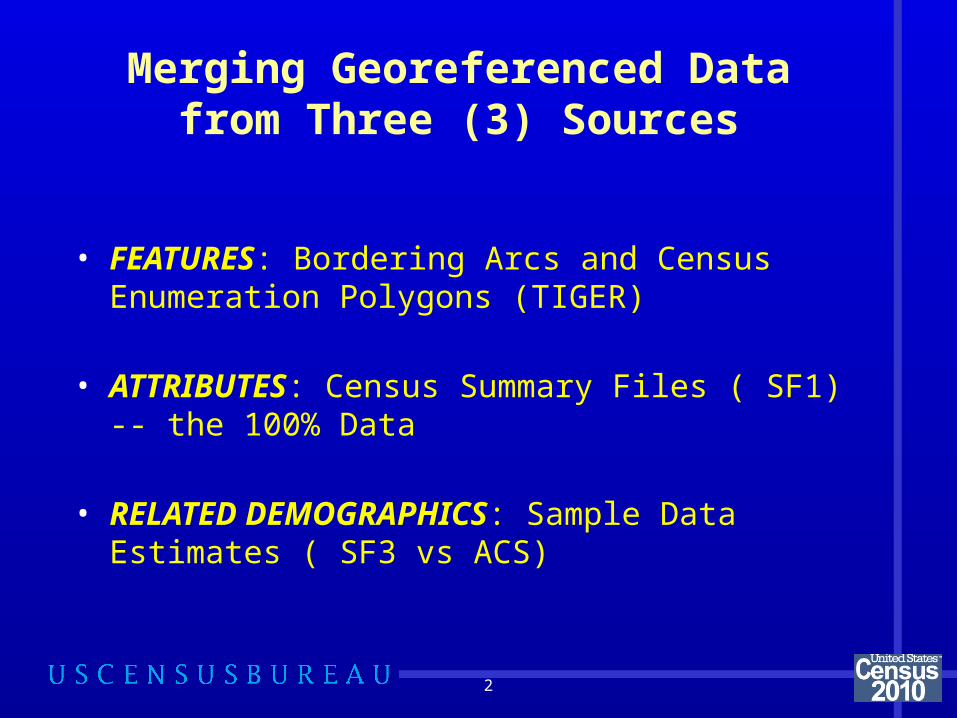
Merging Georeferenced Data from Three (3) Sources
• FEATURES: Bordering Arcs and Census Enumeration Polygons (TIGER)
• ATTRIBUTES: Census Summary Files ( SF1) -- the 100% Data
• RELATED DEMOGRAPHICS: Sample Data Estimates ( SF3 vs ACS)
2
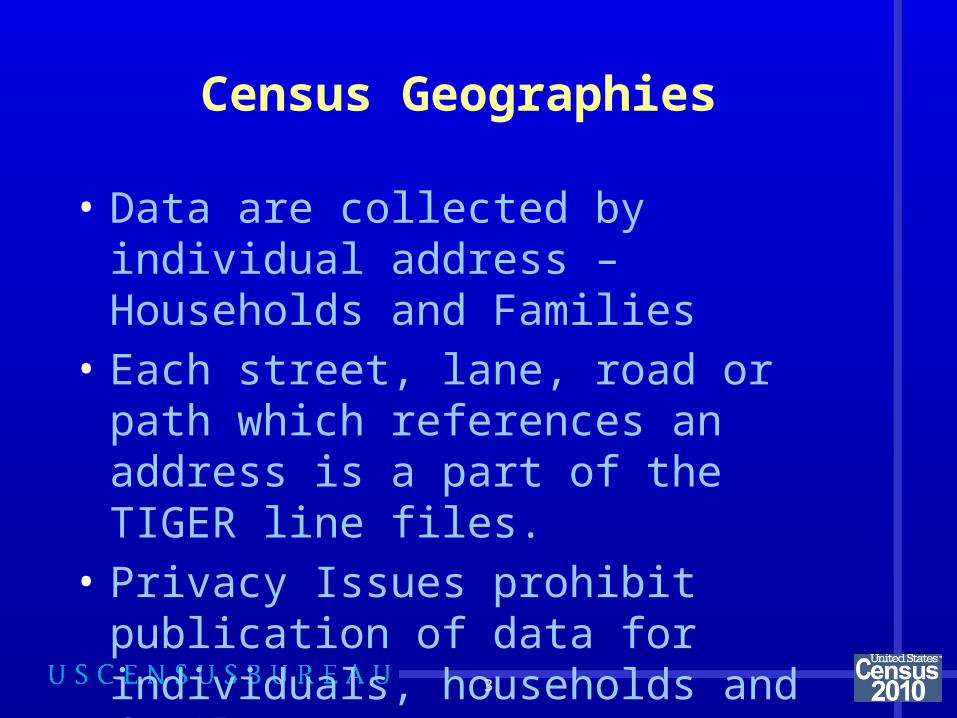
Census Geographies
• Data are collected by individual address – Households and Families
• Each street, lane, road or path which references an address is a part of the TIGER line files.
• Privacy Issues prohibit publication of data for individuals, households and families.
3
• Census Demographics are Aggregated into Enumeration Areas
• SummaryTabulations are made of individual records by area
• Census Geography is a Hierarchy of Nested Enumeration Areas.
4
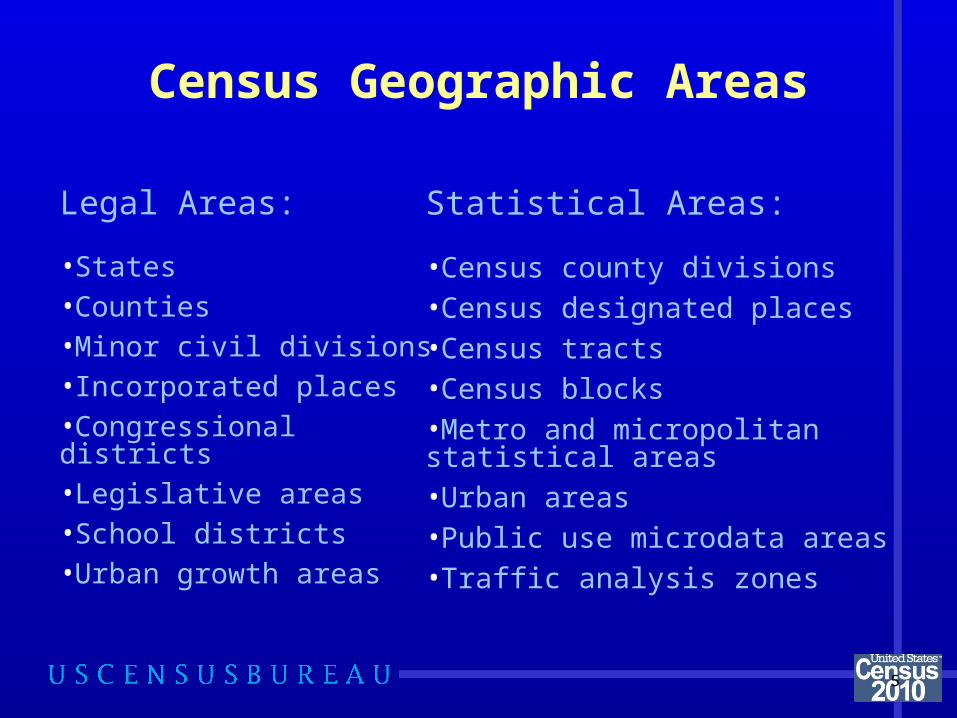
Census Geographic Areas
Legal Areas:
•States•Counties•Minor civil divisions•Incorporated places•Congressional districts•Legislative areas•School districts•Urban growth areas
Statistical Areas:
•Census county divisions•Census designated places•Census tracts•Census blocks•Metro and micropolitan statistical areas•Urban areas•Public use microdata areas•Traffic analysis zones
5
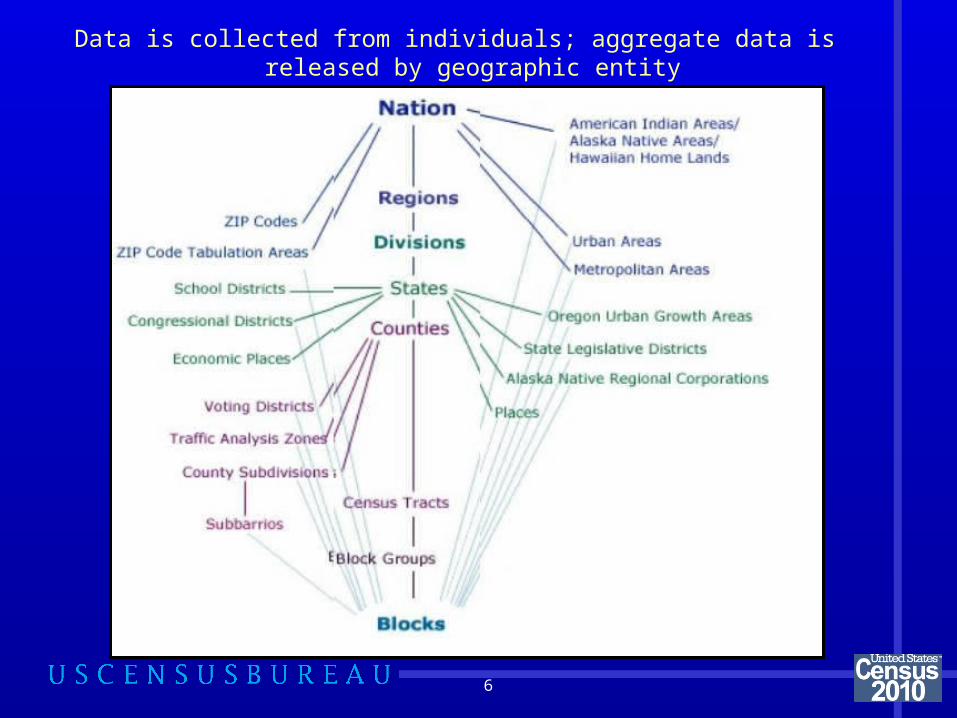
Data is collected from individuals; aggregate data is released by geographic entity
6
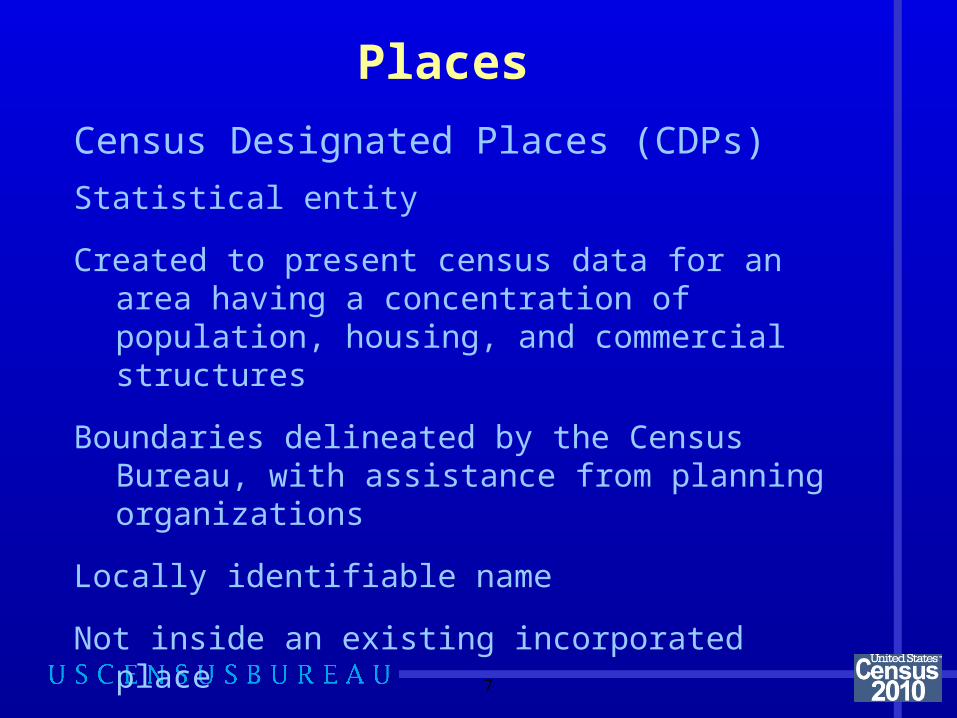
Places
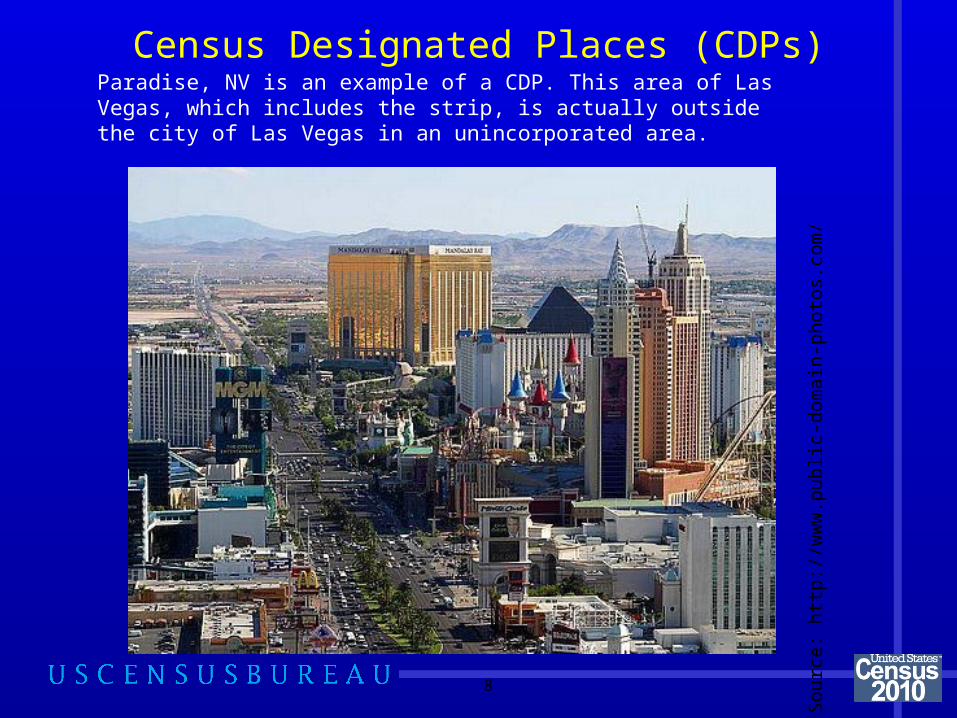
Census Designated Places (CDPs)
Statistical entity
Created to present census data for an area having a concentration of population, housing, and commercial structures
Boundaries delineated by the Census Bureau, with assistance from planning organizations
Locally identifiable name
Not inside an existing incorporated place
7
Census Designated Places (CDPs)
8
Sou
rce
: ht
tp:/
/ww
w.p
ublic
-dom
ain
-pho
tos.
com
/
Paradise, NV is an example of a CDP. This area of Las Vegas, which includes the strip, is actually outside the city of Las Vegas in an unincorporated area.
Small Geographic Areas
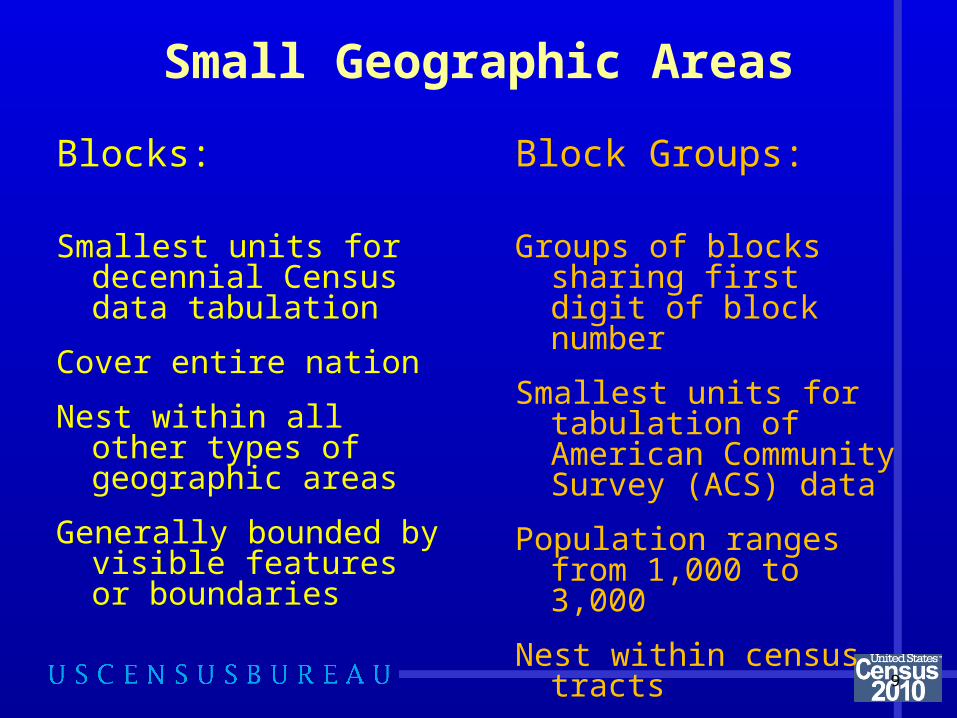
Blocks:
Smallest units for decennial Census data tabulation
Cover entire nation
Nest within all other types of geographic areas
Generally bounded by visible features or boundaries
Block Groups:
Groups of blocks sharing first digit of block number
Smallest units for tabulation of American Community Survey (ACS) data
Population ranges from 1,000 to 3,000
Nest within census tracts
9
Census Tracts
10
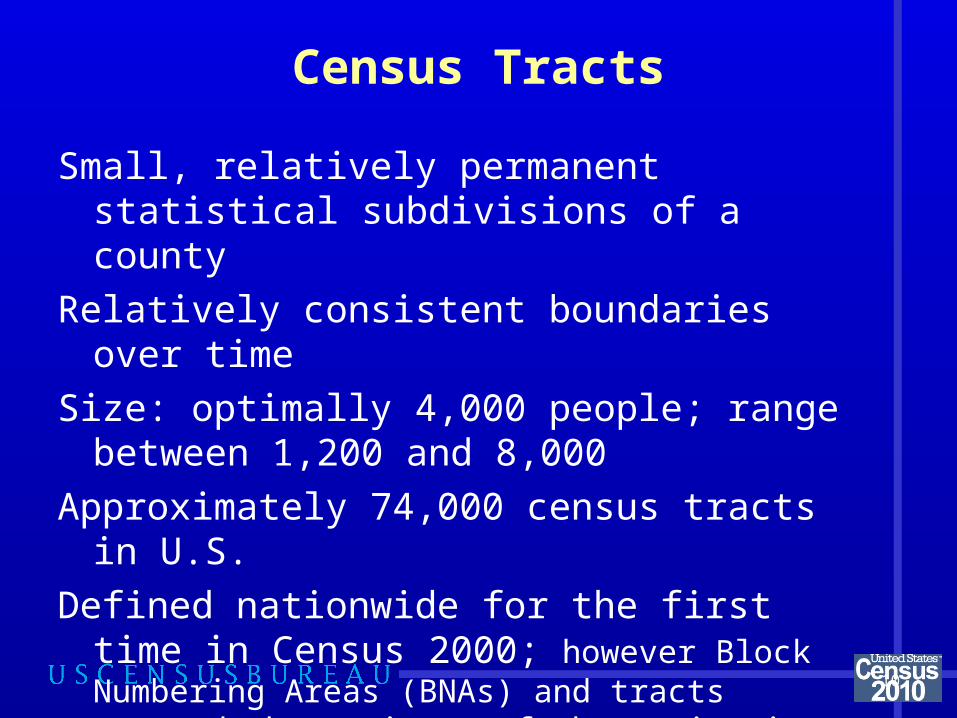
Small, relatively permanent statistical subdivisions of a county
Relatively consistent boundaries over time
Size: optimally 4,000 people; range between 1,200 and 8,000
Approximately 74,000 census tracts in U.S.
Defined nationwide for the first time in Census 2000; however Block Numbering Areas (BNAs) and tracts covered the entirety of the nation in 1990
Definition
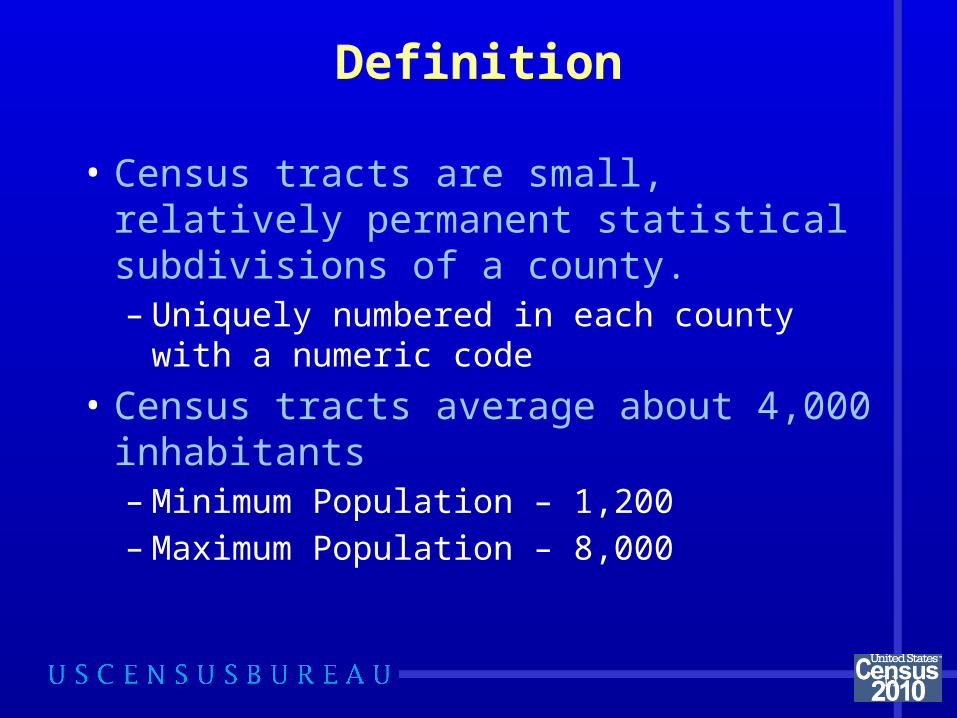
• Census tracts are small, relatively permanent statistical subdivisions of a county.– Uniquely numbered in each county with a
numeric code
• Census tracts average about 4,000 inhabitants– Minimum Population – 1,200– Maximum Population – 8,000
11

Map of census tracts
12
This figure displays an example of what census tracts look like. The black outlines represent the county boundaries in Alabama. The different colored polygons within each county represent the census tracts. The census tracts shown are from TIGER 2000.
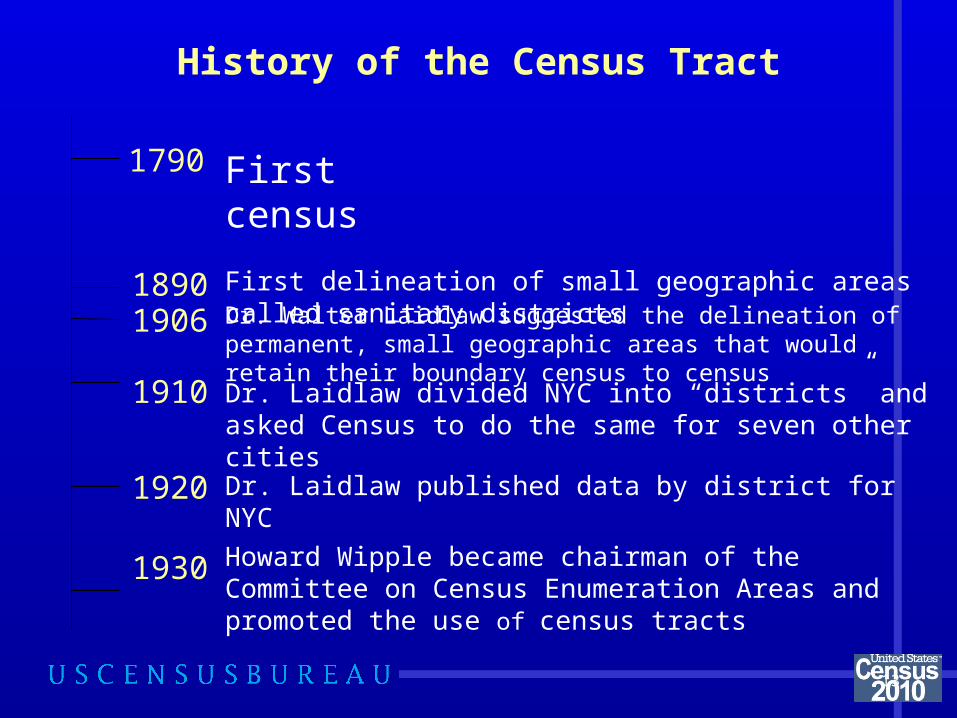
History of the Census Tract
1790 First census
1890 First delineation of small geographic areas called sanitary districts
1906
1910
Dr. Walter Laidlaw suggested the delineation of permanent, small geographic areas that would retain their boundary census to census
Dr. Laidlaw divided NYC into “districts” and asked Census to do the same for seven other cities
1920 Dr. Laidlaw published data by district for NYC
1930 Howard Wipple became chairman of the Committee on Census Enumeration Areas and promoted the use of census tracts
13
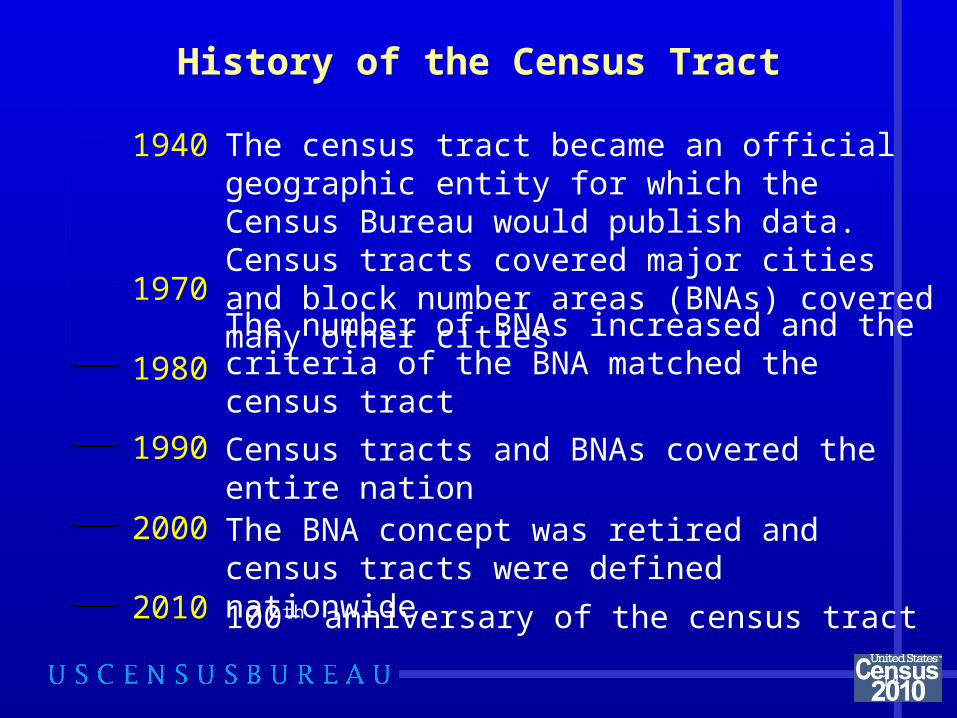
History of the Census Tract
1940 The census tract became an official geographic entity for which the Census Bureau would publish data. Census tracts covered major cities and block number areas (BNAs) covered many other cities
1970
1980The number of BNAs increased and the criteria of the BNA matched the census tract
Census tracts and BNAs covered the entire nation1990
2000 The BNA concept was retired and census tracts were defined nationwide.
100th anniversary of the census tract2010
14
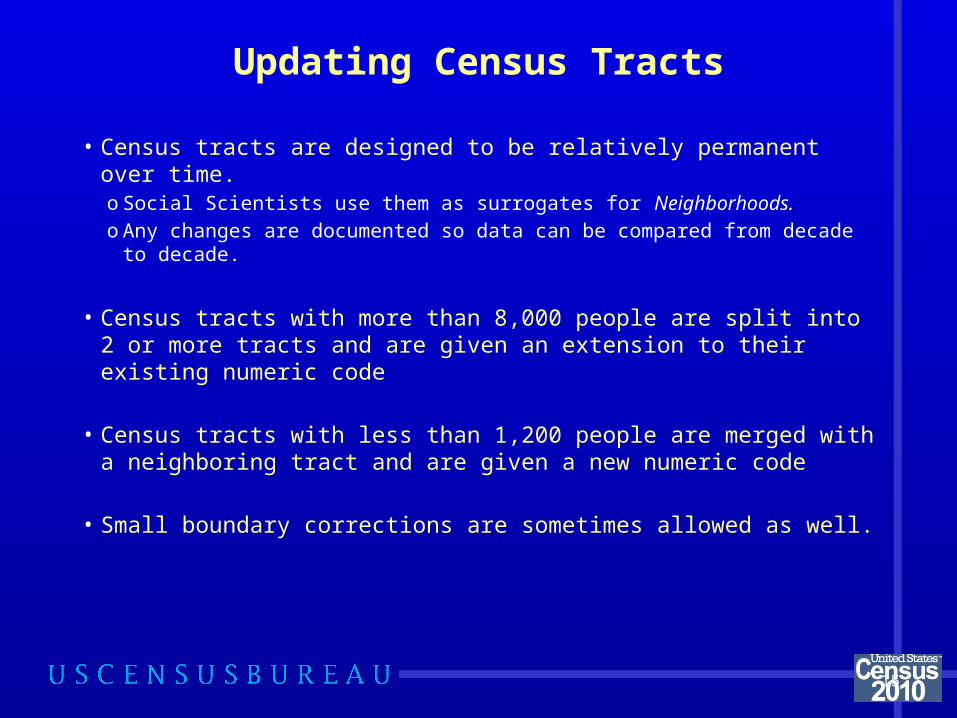
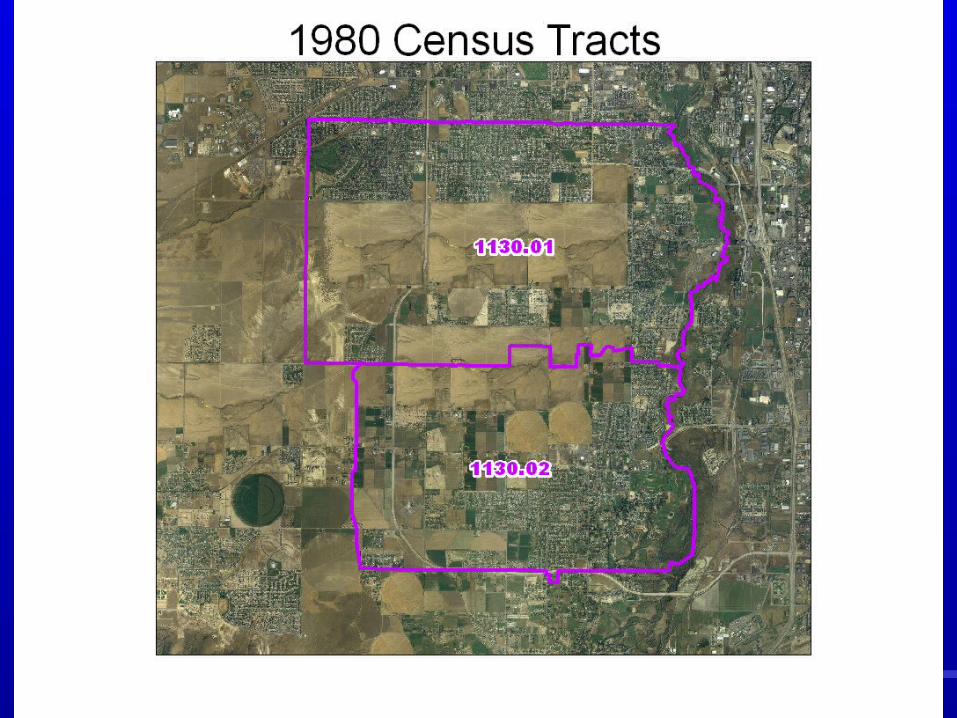
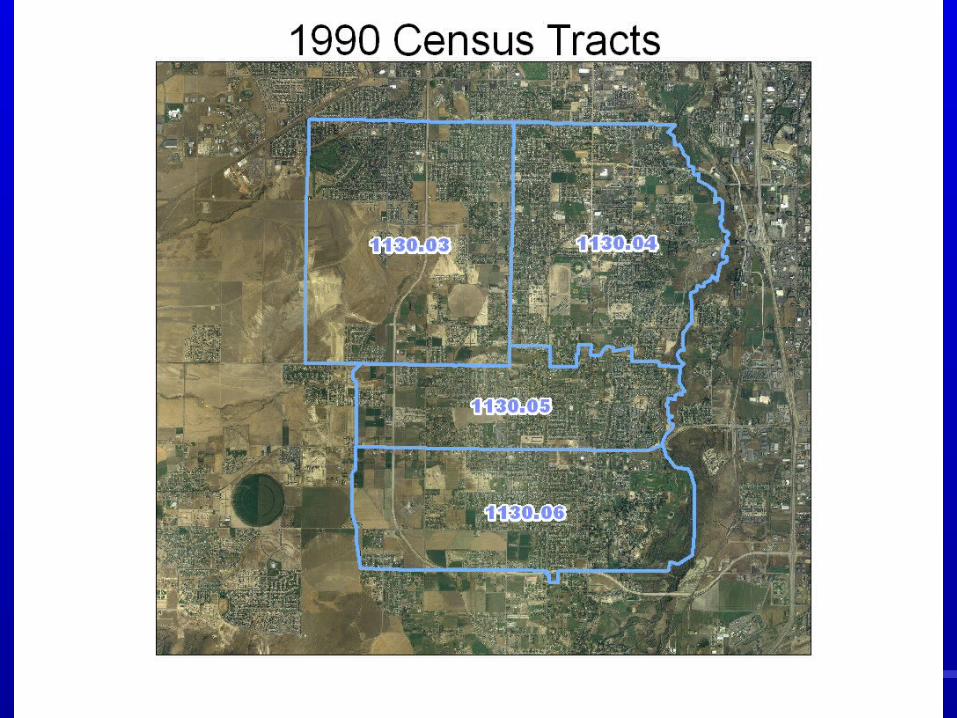
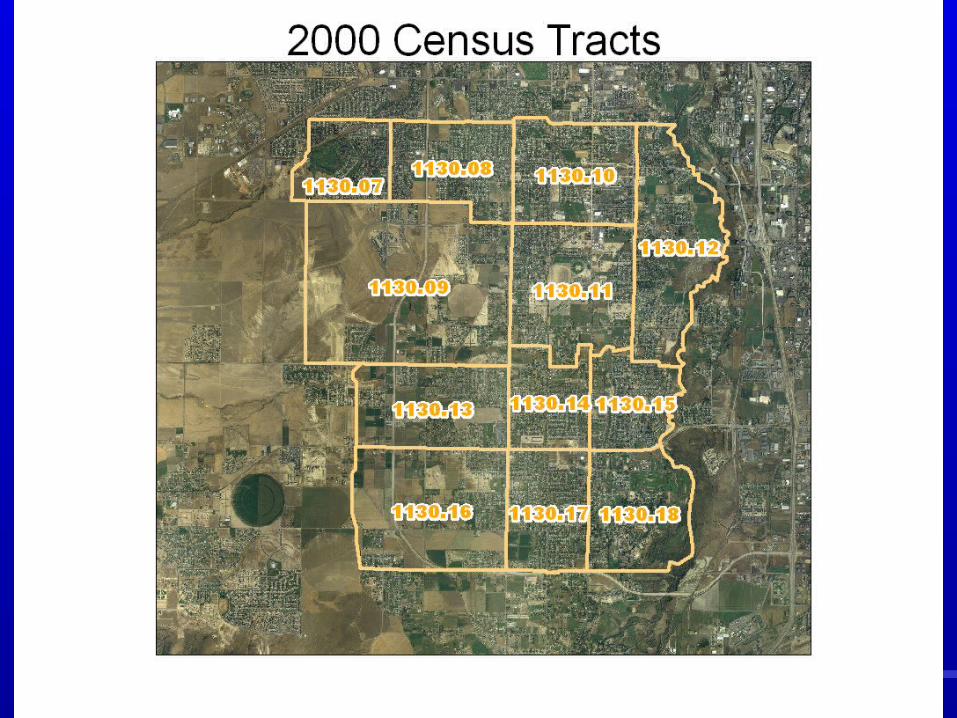
Updating Census Tracts
• Census tracts are designed to be relatively permanent over time. o Social Scientists use them as surrogates for Neighborhoods.o Any changes are documented so data can be compared from decade
to decade.
• Census tracts with more than 8,000 people are split into 2 or more tracts and are given an extension to their existing numeric code
• Census tracts with less than 1,200 people are merged with a neighboring tract and are given a new numeric code
• Small boundary corrections are sometimes allowed as well.
15
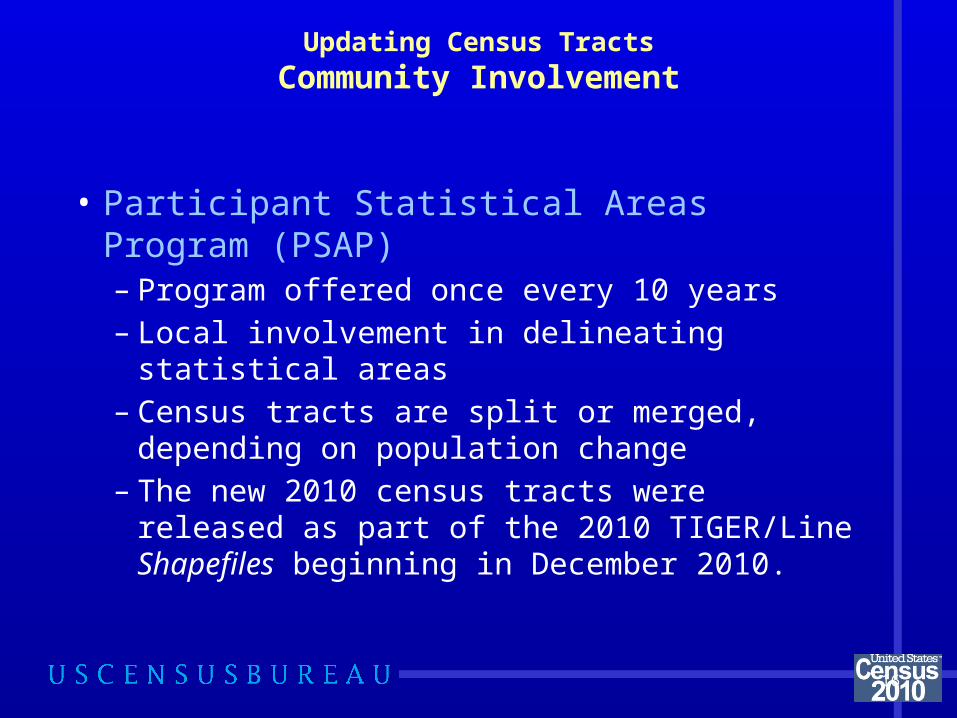
Updating Census Tracts
Community Involvement
• Participant Statistical Areas Program (PSAP)– Program offered once every 10 years– Local involvement in delineating statistical areas– Census tracts are split or merged, depending on
population change– The new 2010 census tracts were released as
part of the 2010 TIGER/Line Shapefiles beginning in December 2010.
16
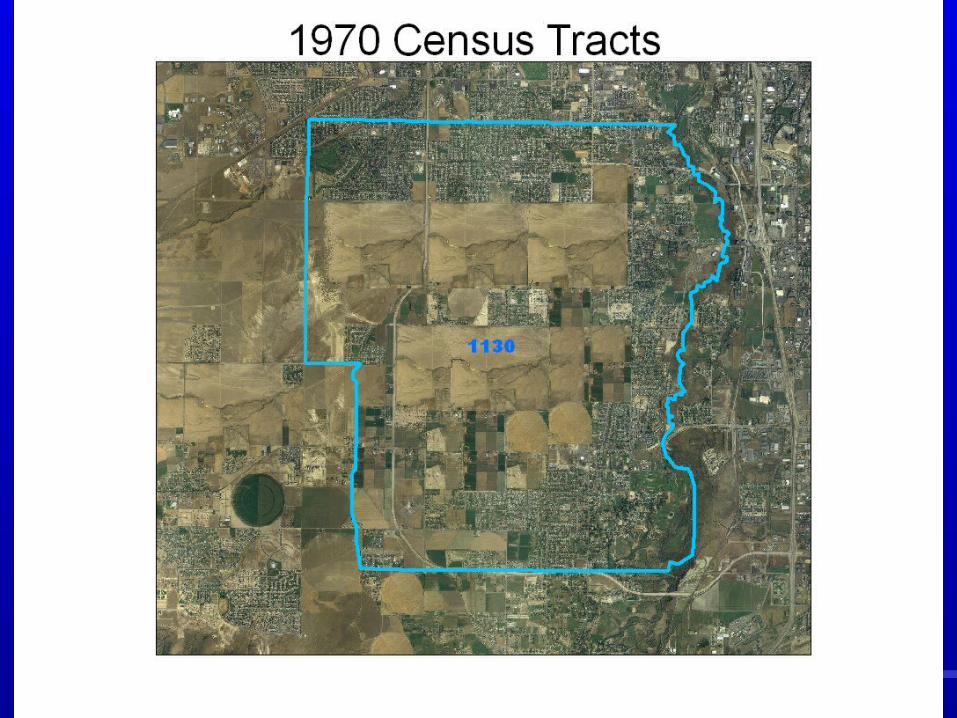
Longitudinal Studies
Comparing Demographic Changes over Time .. Also involves comparing Geographic Feature changes from Census to Census.
While there are some tools to aid in the identification and nature of changes, there remains a great deal of data “massaging” to make real comparisons.
21
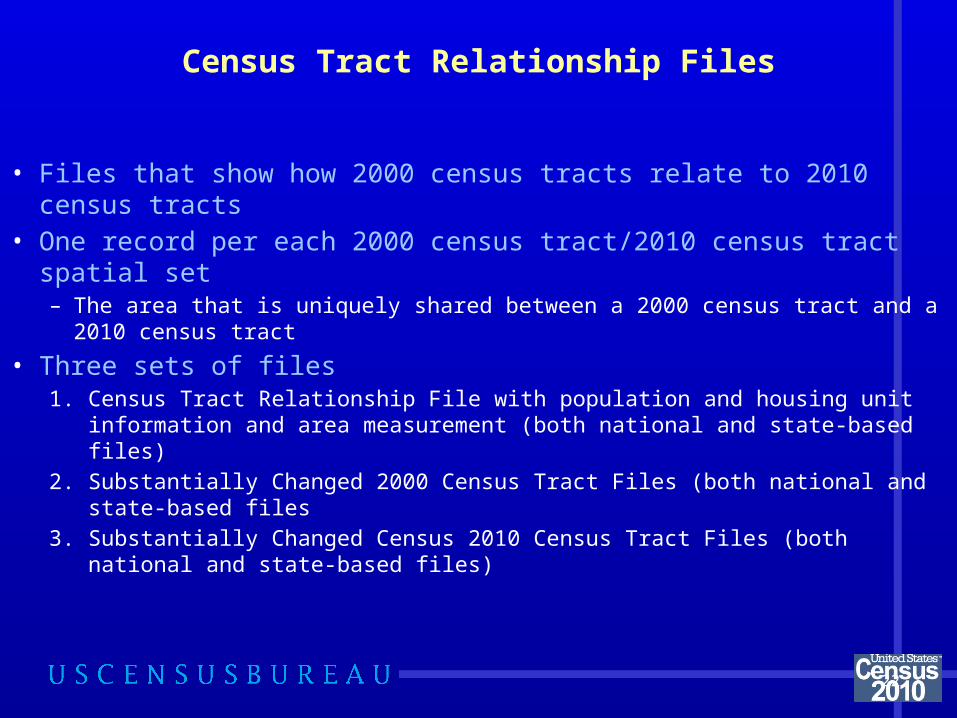
Census Tract Relationship Files
• Files that show how 2000 census tracts relate to 2010 census tracts• One record per each 2000 census tract/2010 census tract spatial set
– The area that is uniquely shared between a 2000 census tract and a 2010 census tract
• Three sets of files1. Census Tract Relationship File with population and housing unit information
and area measurement (both national and state-based files)
2. Substantially Changed 2000 Census Tract Files (both national and state-based files
3. Substantially Changed Census 2010 Census Tract Files (both national and state-based files)
22
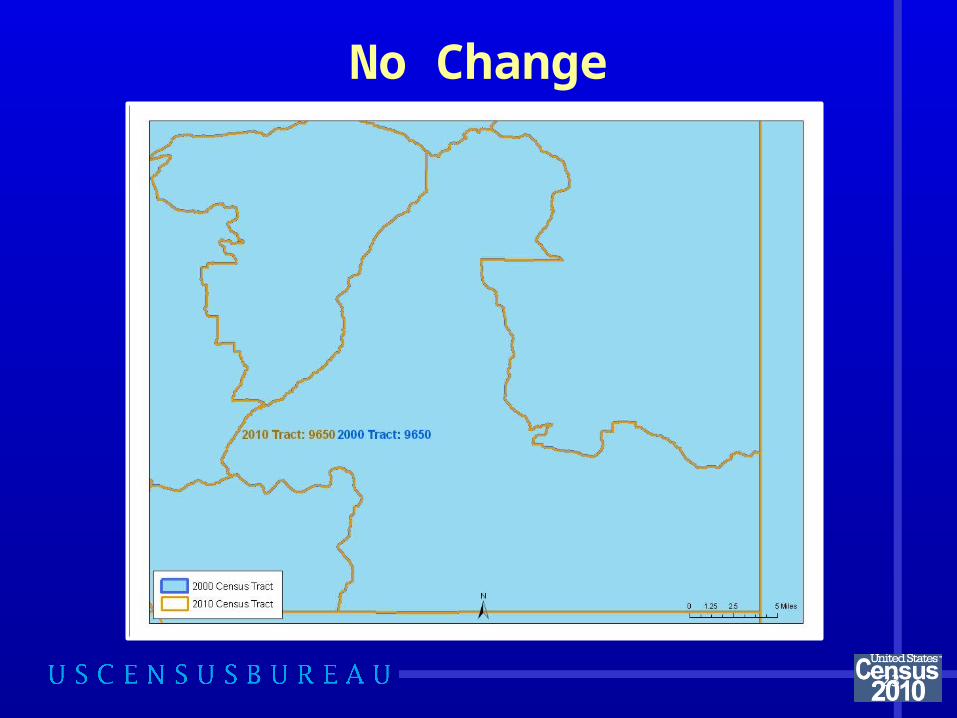
No Change
23
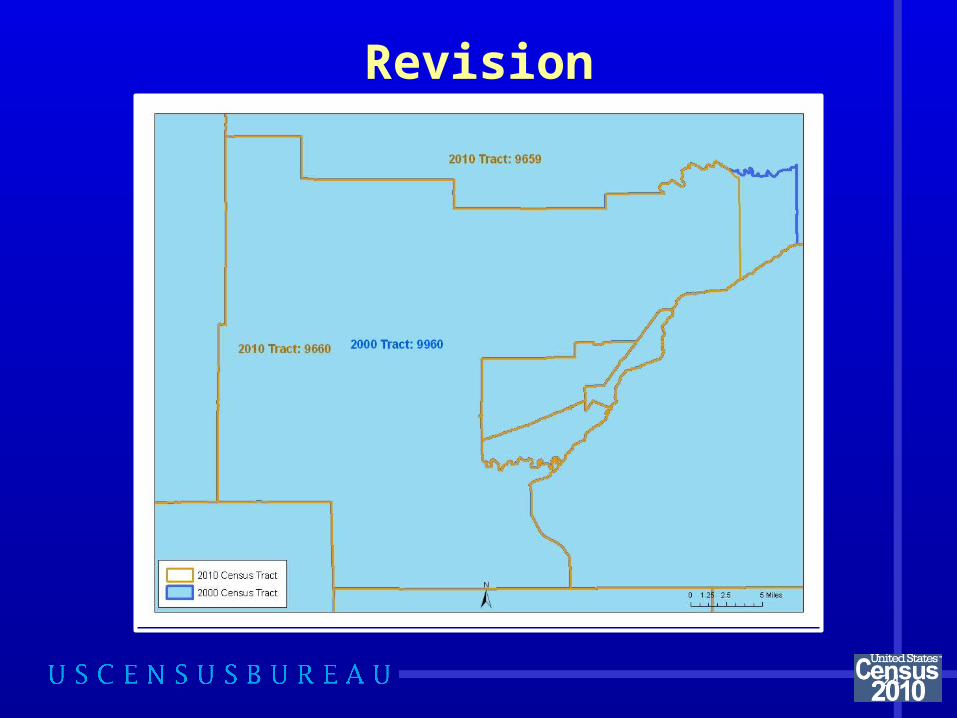
Revision
24

Merged
25
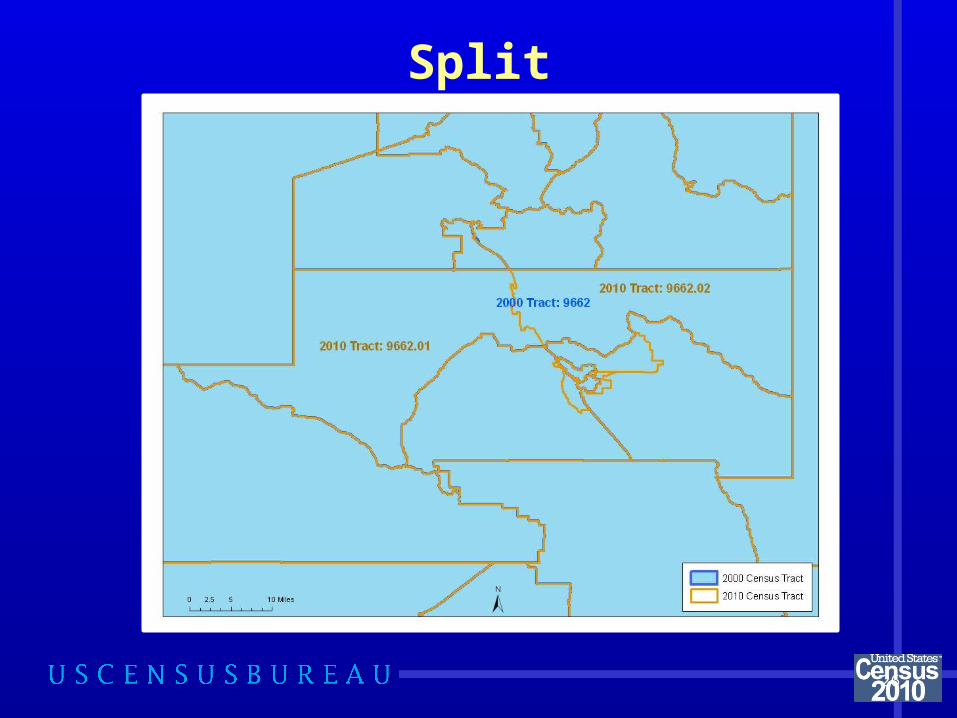
Split
26
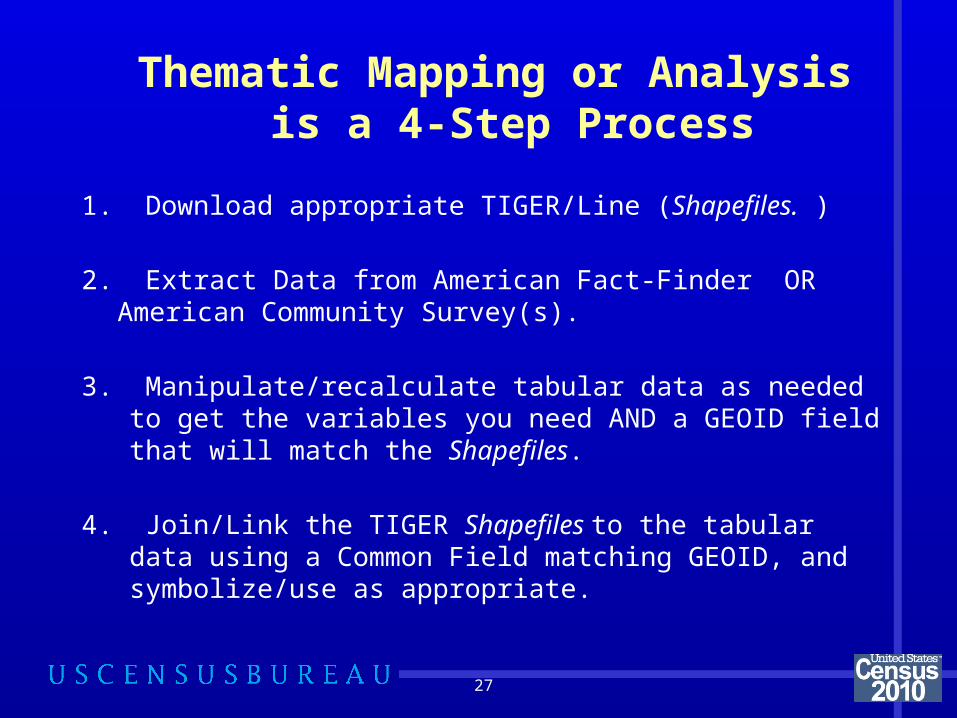
Thematic Mapping or Analysisis a 4-Step Process
1. Download appropriate TIGER/Line (Shapefiles. )
2. Extract Data from American Fact-Finder OR American Community Survey(s).
3. Manipulate/recalculate tabular data as needed to get the variables you need AND a GEOID field that will match the Shapefiles.
4. Join/Link the TIGER Shapefiles to the tabular data using a Common Field matching GEOID, and symbolize/use as appropriate.
27
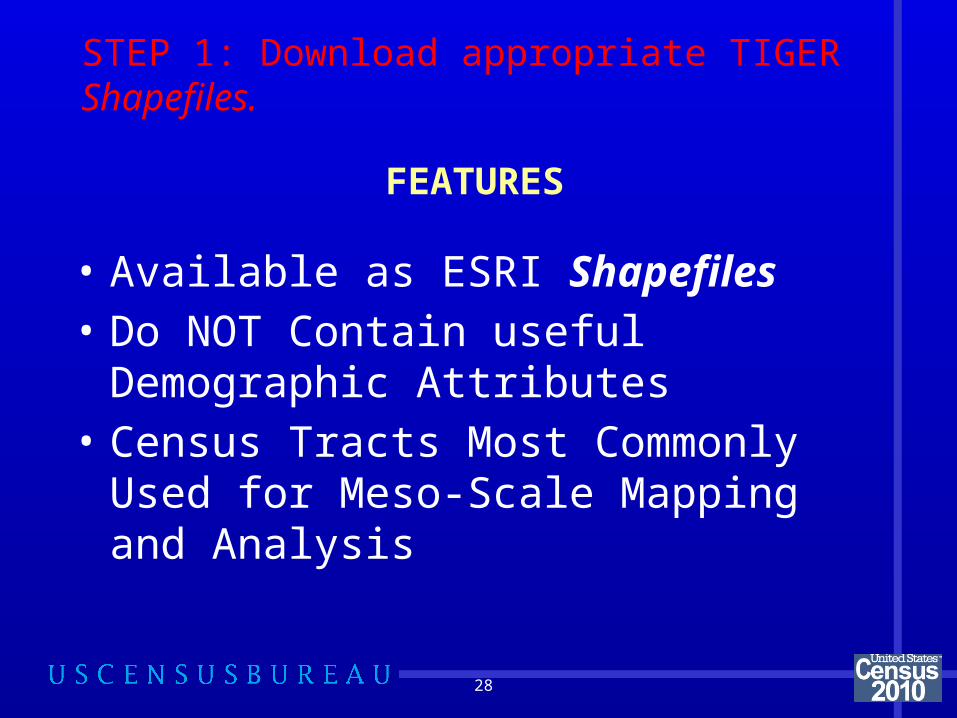
FEATURES
• Available as ESRI Shapefiles• Do NOT Contain useful Demographic
Attributes• Census Tracts Most Commonly Used
for Meso-Scale Mapping and Analysis
28
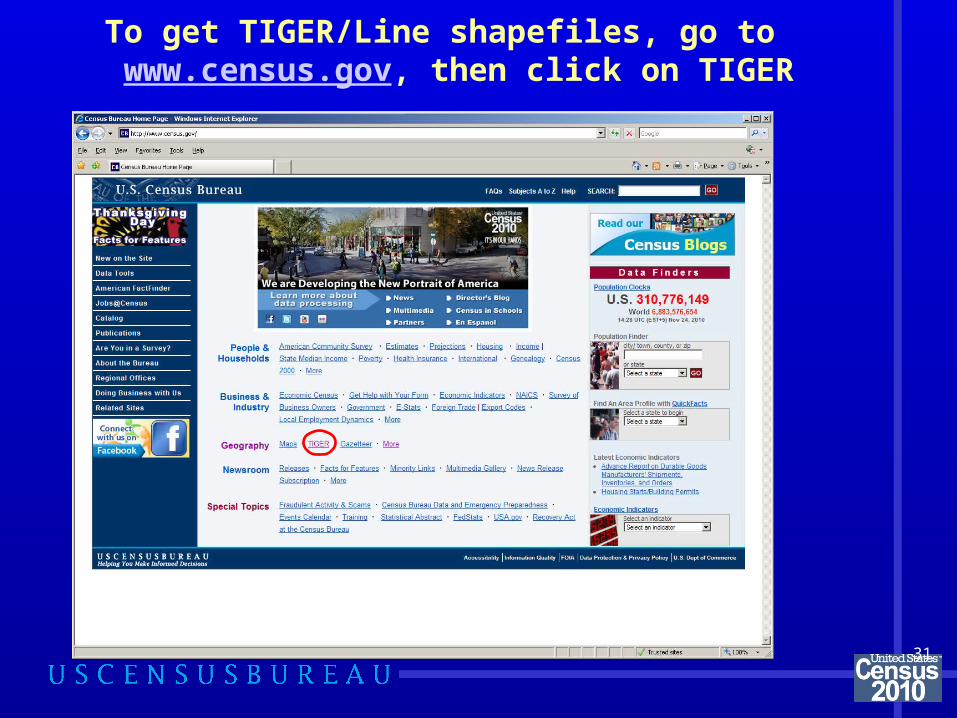
STEP 1: Download appropriate TIGER Shapefiles.
29
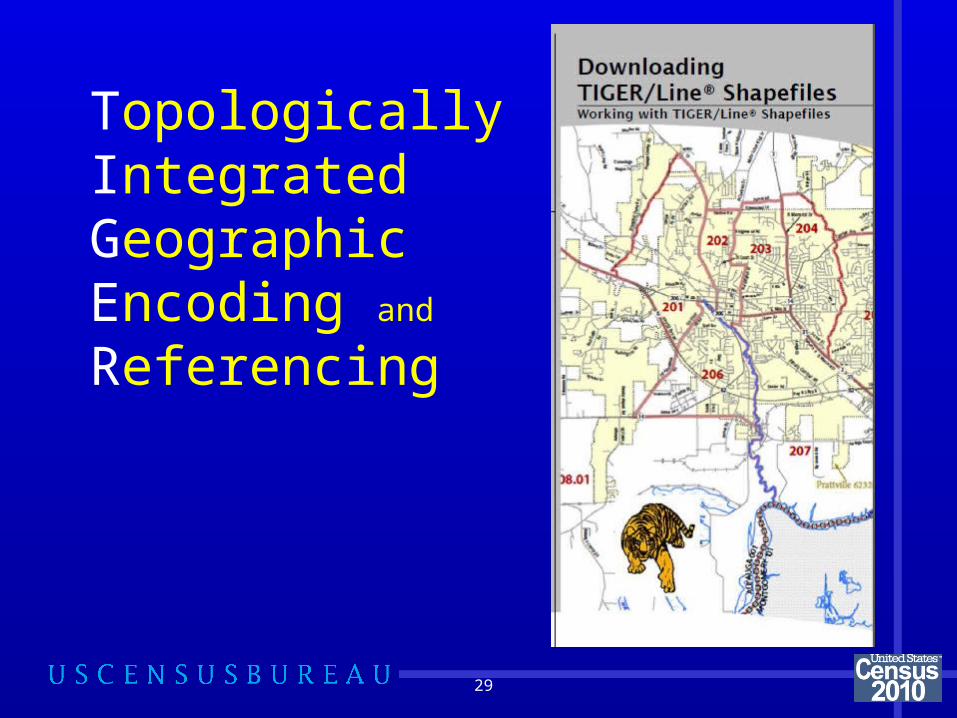
Topologically Integrated Geographic Encoding and
Referencing
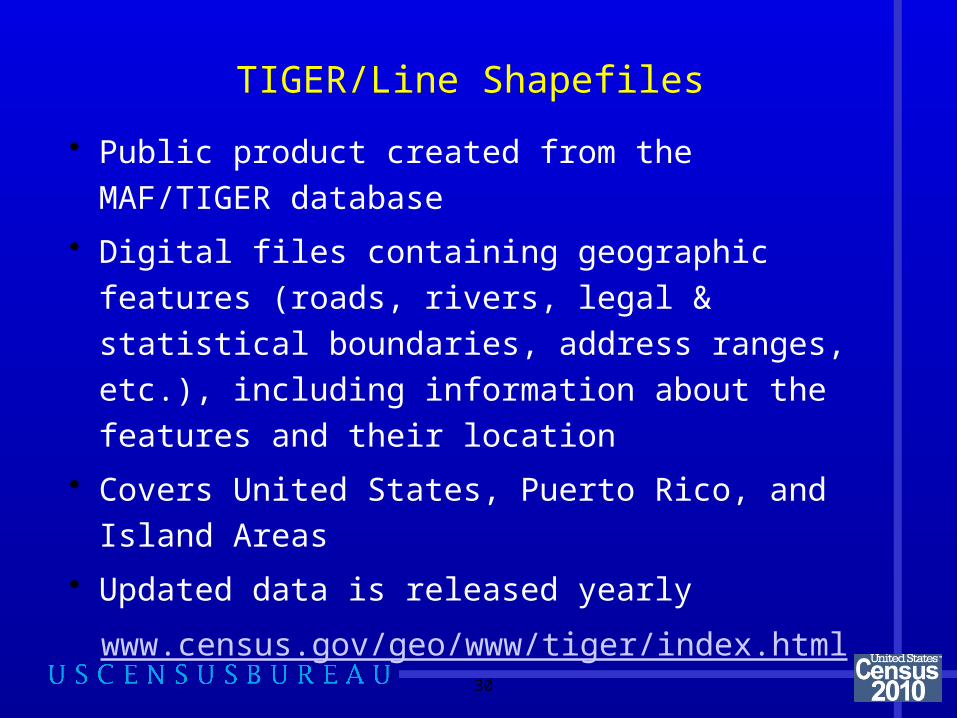
• Public product created from the MAF/TIGER database
• Digital files containing geographic features (roads,
rivers, legal & statistical boundaries, address ranges,
etc.), including information about the features and their
location
• Covers United States, Puerto Rico, and Island Areas
• Updated data is released yearly
www.census.gov/geo/www/tiger/index.html
30
TIGER/Line Shapefiles

Overview Documentation available online at:http://www.census.gov/geo/www/tiger/wwtl/wwtl.html
32
*** This is where to start for using Census data in GIS.
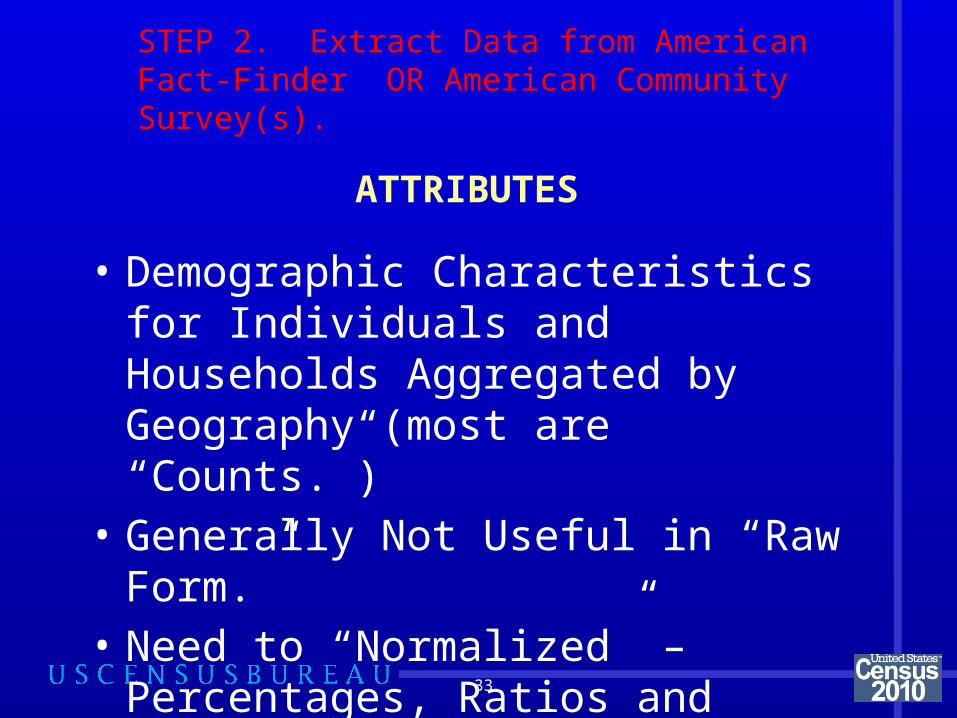
ATTRIBUTES
• Demographic Characteristics for Individuals and Households Aggregated by Geography (most are “Counts.”)
• Generally Not Useful in “Raw Form.”• Need to “Normalized” – Percentages,
Ratios and Densities.
33
STEP 2. Extract Data from American Fact-Finder OR American Community Survey(s).
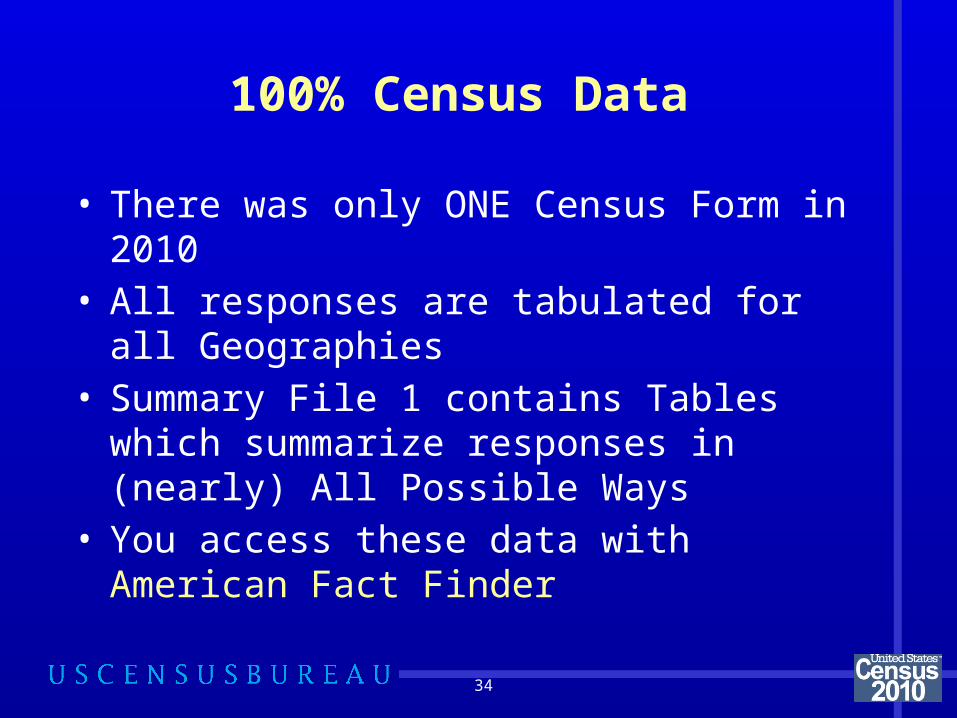
100% Census Data
• There was only ONE Census Form in 2010• All responses are tabulated for all
Geographies• Summary File 1 contains Tables which
summarize responses in (nearly) All Possible Ways
• You access these data with American Fact Finder
34
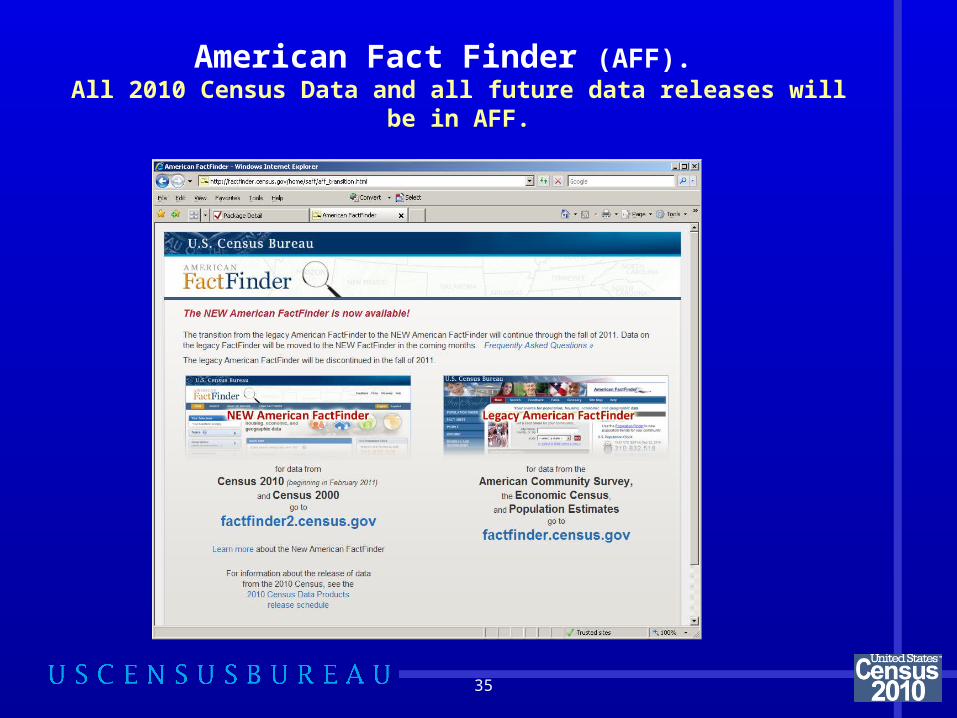
American Fact Finder (AFF). All 2010 Census Data and all future data releases will be in AFF.
35
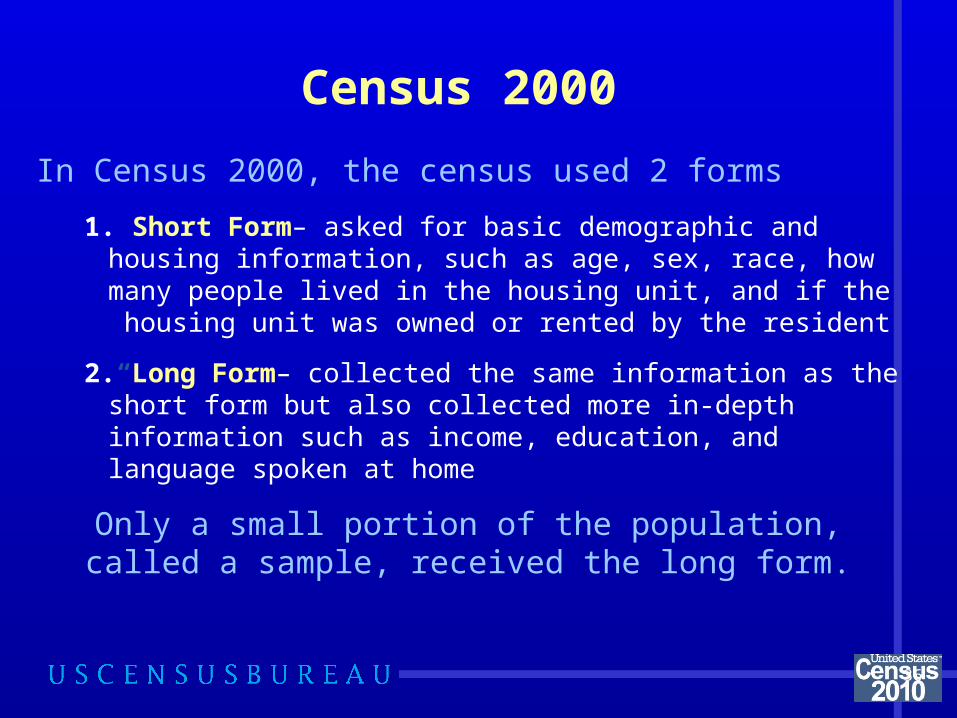
Census 2000
In Census 2000, the census used 2 forms
1. Short Form– asked for basic demographic and housing information, such as age, sex, race, how many people lived in the housing unit, and if the housing unit was owned or rented by the resident
2.“Long Form– collected the same information as the short form but also collected more in-depth information such as income, education, and language spoken at home
Only a small portion of the population, called a sample, received the long form.
36
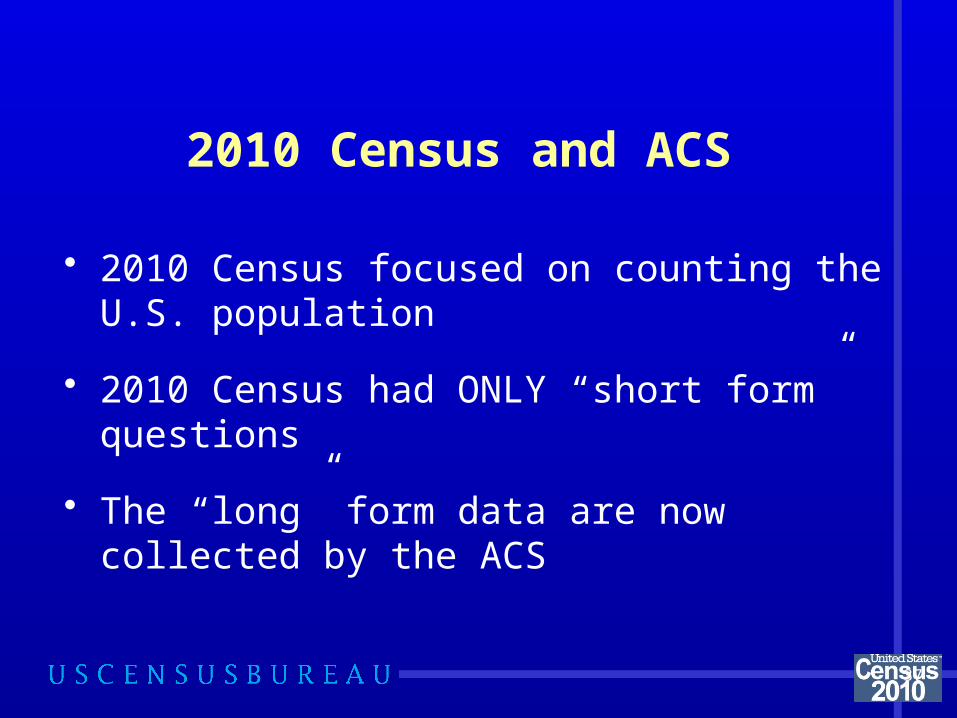
2010 Census and ACS
• 2010 Census focused on counting the U.S. population
• 2010 Census had ONLY “short form” questions
• The “long” form data are now collected by the ACS
37
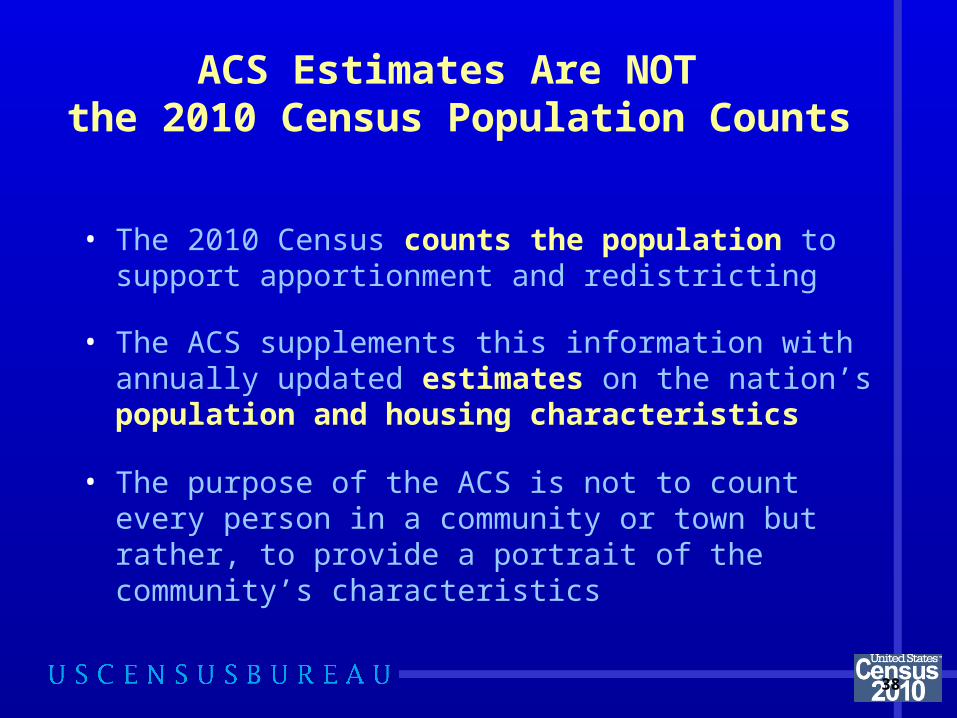
ACS Estimates Are NOT the 2010 Census Population Counts
• The 2010 Census counts the population to support apportionment and redistricting
• The ACS supplements this information with annually updated estimates on the nation’s population and housing characteristics
• The purpose of the ACS is not to count every person in a community or town but rather, to provide a portrait of the community’s characteristics
38
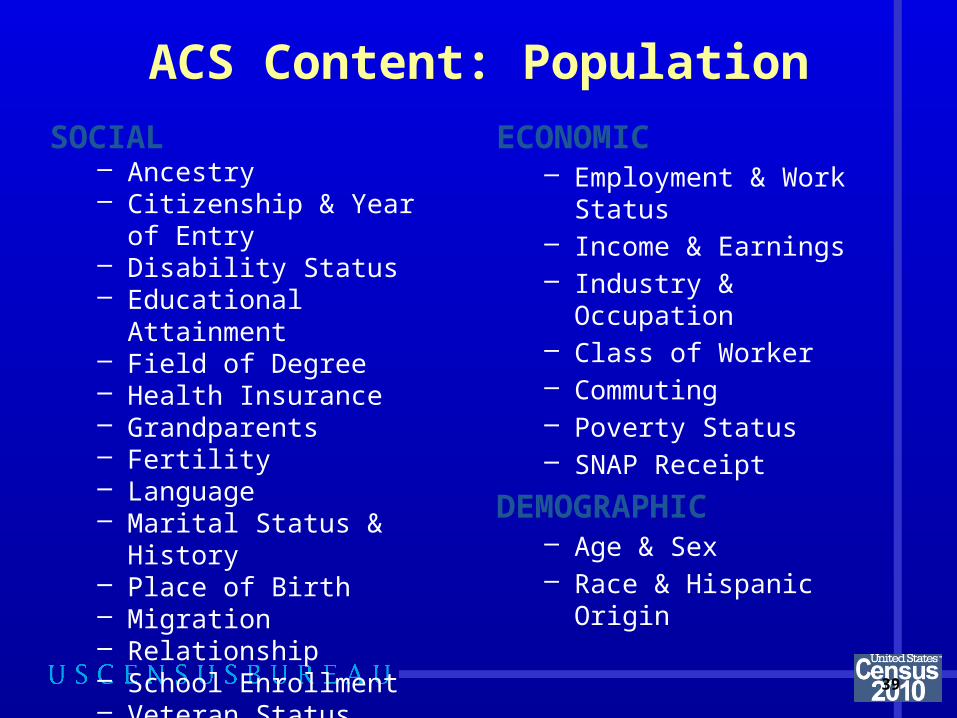
ACS Content: Population
SOCIAL– Ancestry– Citizenship & Year of Entry– Disability Status– Educational Attainment– Field of Degree– Health Insurance – Grandparents– Fertility– Language– Marital Status & History– Place of Birth– Migration– Relationship– School Enrollment– Veteran Status
ECONOMIC– Employment & Work Status– Income & Earnings– Industry & Occupation– Class of Worker– Commuting– Poverty Status– SNAP Receipt
DEMOGRAPHIC– Age & Sex– Race & Hispanic Origin
39
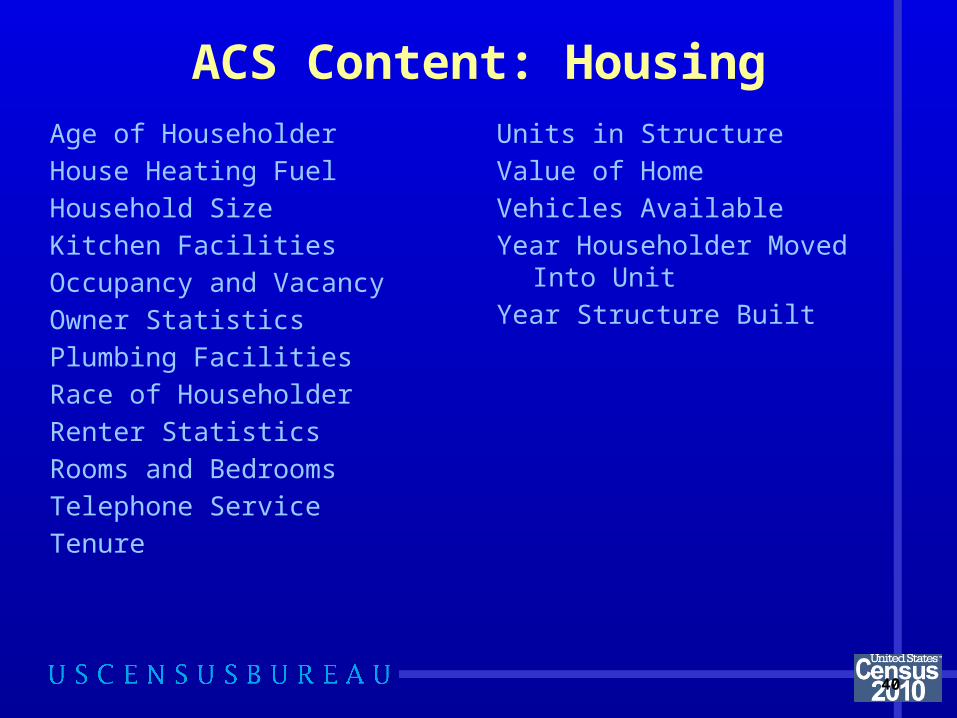
ACS Content: HousingAge of Householder
House Heating Fuel
Household Size
Kitchen Facilities
Occupancy and Vacancy
Owner Statistics
Plumbing Facilities
Race of Householder
Renter Statistics
Rooms and Bedrooms
Telephone Service
Tenure
Units in Structure
Value of Home
Vehicles Available
Year Householder Moved Into Unit
Year Structure Built
40

Data Product Release Schedule
The ACS annually releases:
1-year estimates (2010)– Areas with populations of 65,000+
• The Nation• Every state, the District of Columbia, and Puerto Rico• Every Congressional District• About 25 percent of all counties
3-year estimates (2008-2010)– Areas with populations of 20,000+
5-year estimates (2006-2010)– All areas
41
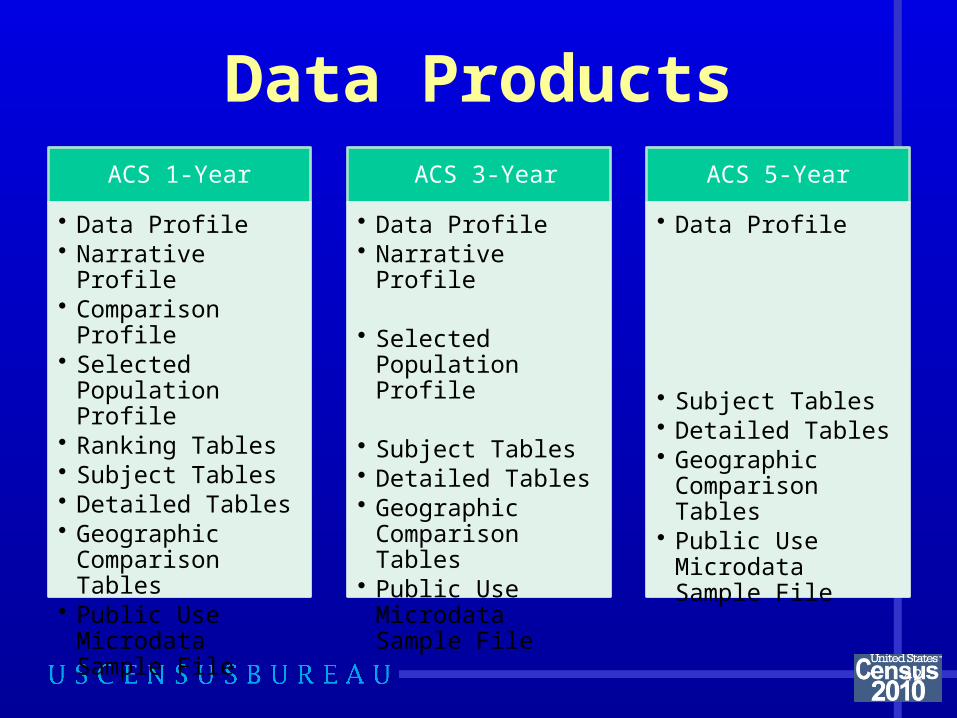
Data ProductsACS 1-Year
• Data Profile• Narrative Profile• Comparison Profile• Selected Population
Profile• Ranking Tables• Subject Tables• Detailed Tables• Geographic
Comparison Tables• Public Use
Microdata Sample File
ACS 3-Year
• Data Profile• Narrative Profile
• Selected Population Profile
• Subject Tables• Detailed Tables• Geographic
Comparison Tables• Public Use
Microdata Sample File
ACS 5-Year
• Data Profile
• Subject Tables• Detailed Tables• Geographic
Comparison Tables• Public Use
Microdata Sample File
42
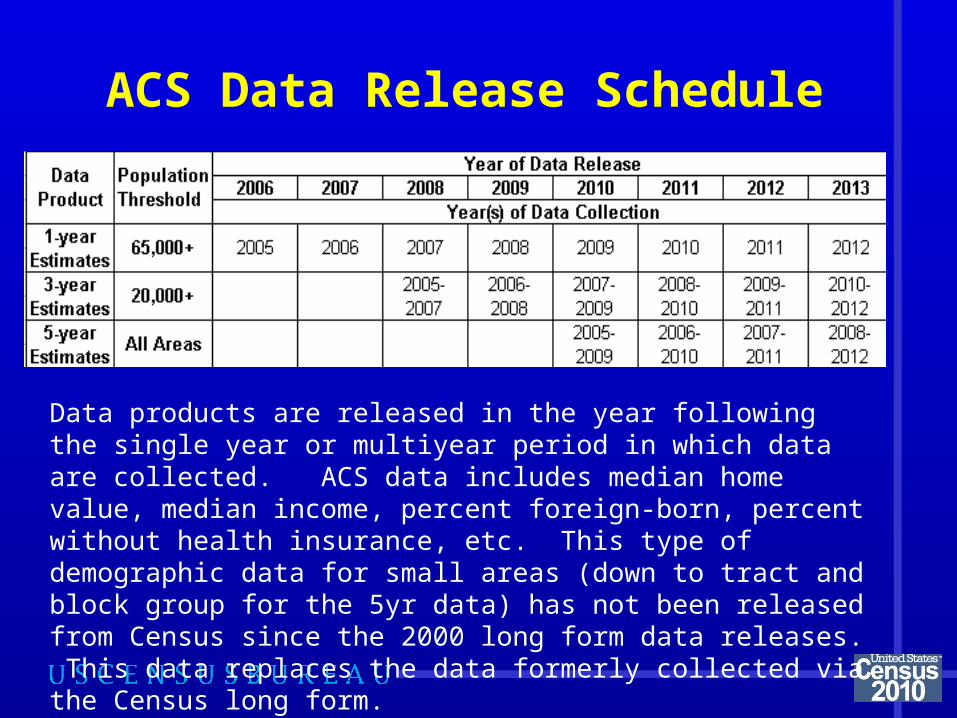
ACS Data Release Schedule
Data products are released in the year following the single year or multiyear period in which data are collected. ACS data includes median home value, median income, percent foreign-born, percent without health insurance, etc. This type of demographic data for small areas (down to tract and block group for the 5yr data) has not been released from Census since the 2000 long form data releases. This data replaces the data formerly collected via the Census long form.
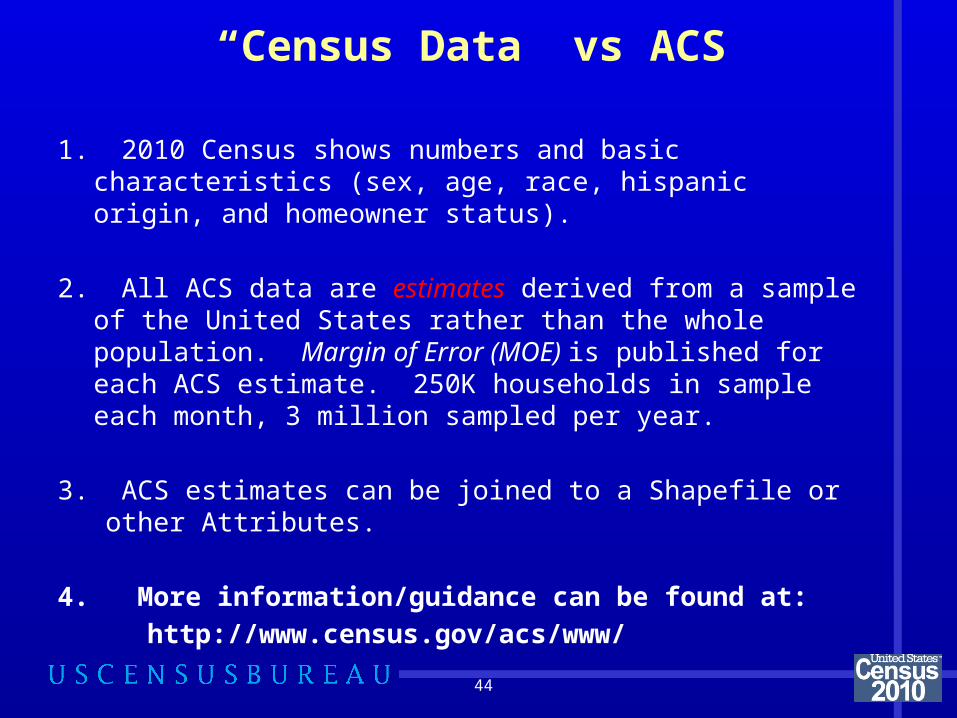
“Census Data” vs ACS
1. 2010 Census shows numbers and basic characteristics (sex, age, race, hispanic origin, and homeowner status).
2. All ACS data are estimates derived from a sample of the United States rather than the whole population. Margin of Error (MOE) is published for each ACS estimate. 250K households in sample each month, 3 million sampled per year.
3. ACS estimates can be joined to a Shapefile or other Attributes.
4. More information/guidance can be found at:
http://www.census.gov/acs/www/
44
45
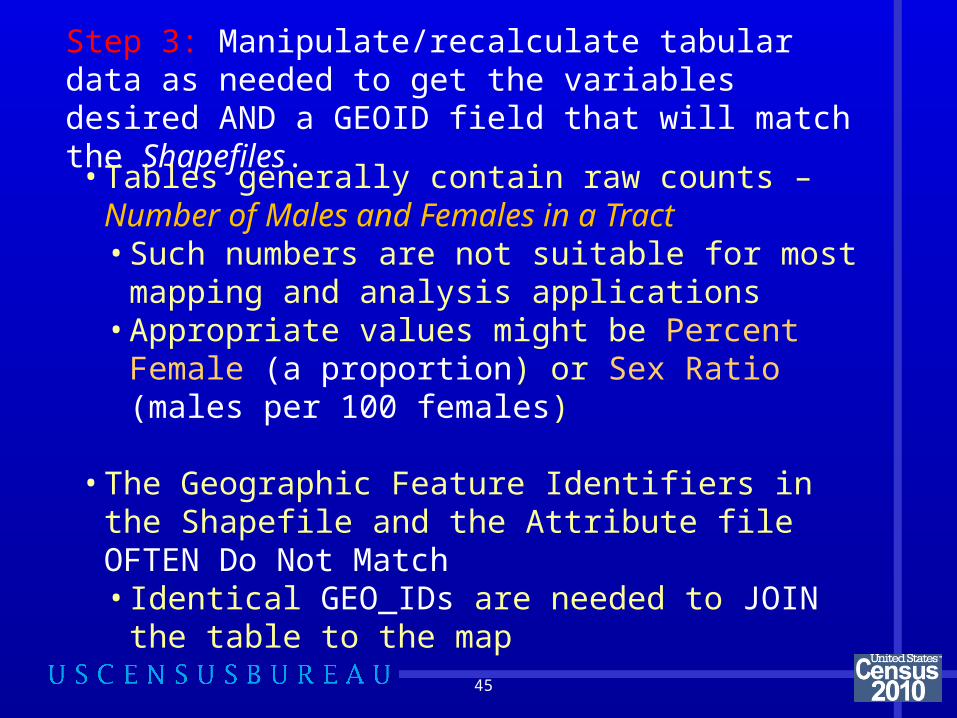
Step 3: Manipulate/recalculate tabular data as needed to get the variables desired AND a GEOID field that will match the Shapefiles.
• Tables generally contain raw counts – Number of Males and Females in a Tract• Such numbers are not suitable for most mapping
and analysis applications• Appropriate values might be Percent Female (a
proportion) or Sex Ratio (males per 100 females)
• The Geographic Feature Identifiers in the Shapefile and the Attribute file OFTEN Do Not Match • Identical GEO_IDs are needed to JOIN the table to
the map
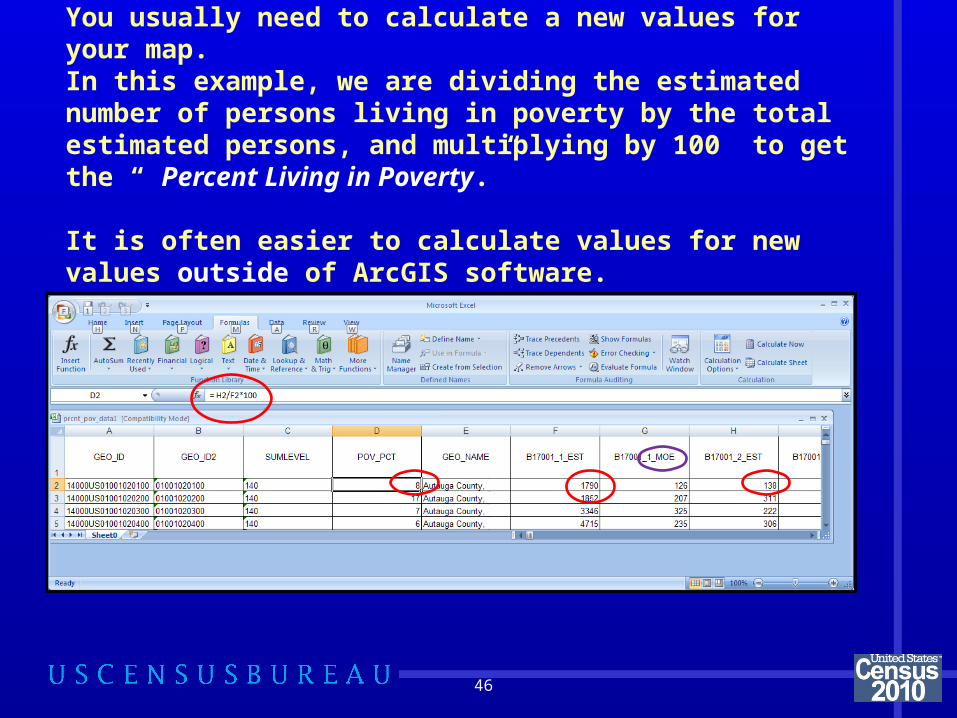
You usually need to calculate a new values for your map. In this example, we are dividing the estimated number of persons living in poverty by the total estimated persons, and multiplying by 100 to get the “ Percent Living in Poverty.”
It is often easier to calculate values for new values outside of ArcGIS software.
46
• This Is NOT straightforward. • No matter how easy it seems, there are
always glitches. • Most commonly, the data types
(numbers vs text) do not match. • Some rudimentary “programming” is
often necessary.
47
STEP 4. Join/Link the TIGER Shapefiles to the tabular data using a Common Field matching GEO_ID
• Requires careful examination of the so-called GEO_ID Fields in both the attribute- and shape-files.
• Often a “new data column” must be created to satisfy this simple requirement.
• Learn to recognize “TEXT” from “Numbers.”
48
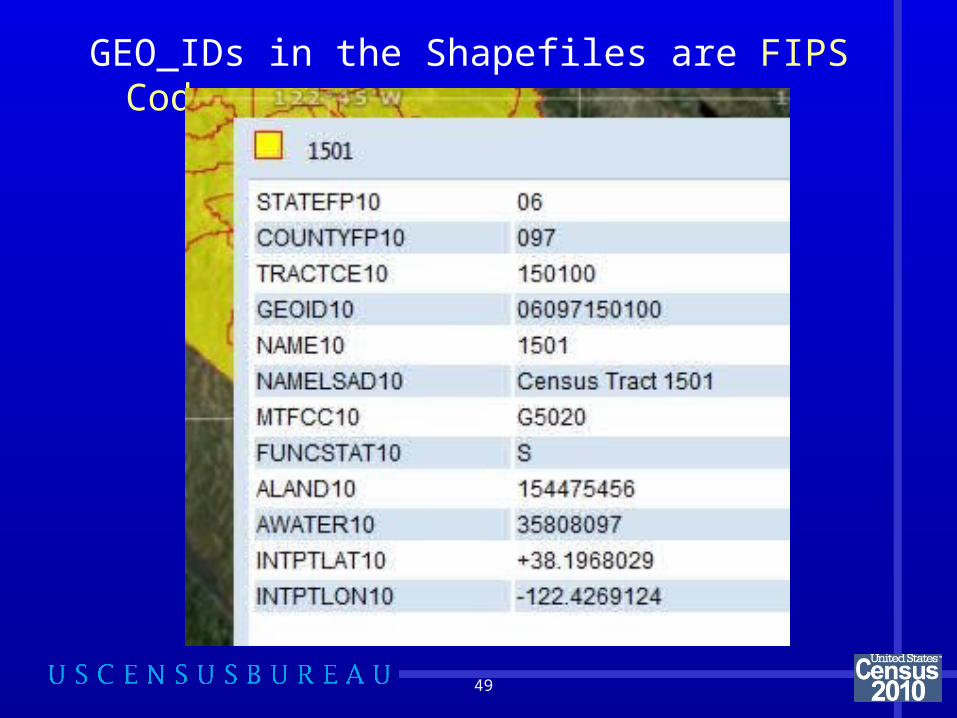
GEO_IDs in the Shapefiles are FIPS Codes
49
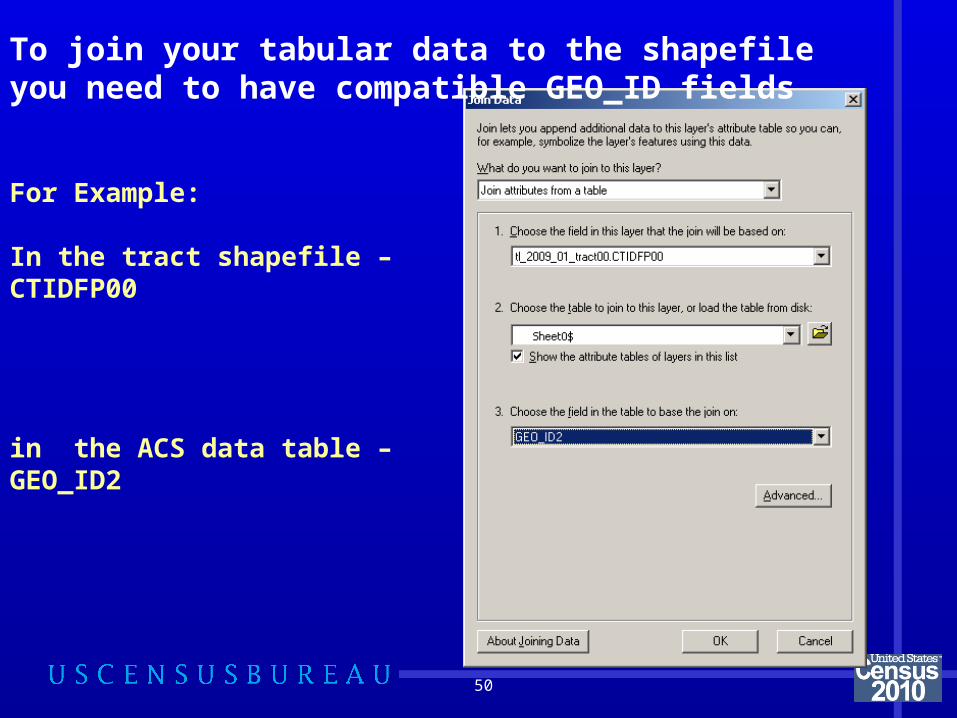
For Example:
In the tract shapefile – CTIDFP00
in the ACS data table – GEO_ID2
50
To join your tabular data to the shapefile you need to have compatible GEO_ID fields

51
When we return ..
Percent Hispanic by Census Tract
Sonoma County, California 2010