1 Single dose pharmacodynamics of amphotericin B against
21
1 Single dose pharmacodynamics of amphotericin B against Aspergillus species in an in vitro 1 pharmacokinetic/pharmacodynamic model 2 3 Running title: Single-dose AMB pharmacodynamics for Aspergillus spp 4 5 6 Rafal Al-Saigh 1 , Maria Siopi 1 , Nikolaos Siafakas 1 , Aristea Velegraki 2 , 7 Loukia Zerva 1 , Joseph Meletiadis 1 8 9 10 Clinical Microbiology Laboratory, Attikon Hospital 1 , Mycology Research Lab, Department of 11 Microbiology 2 , Medical School, National and Kapodistrian University of Athens, Athens, Geece 12 13 14 15 16 Correspondence: Joseph Meletiadis, Ph. D. 17 Lecturer in Mycology, 18 Clinical Microbiology Laboratory, 19 Attikon University Hospital 20 Rimini 1, Haidari, 124 62 Athens 21 Tel: 210-583-1909 22 Fax: 210-532-6421 23 Email: [email protected] 24 Copyright © 2013, American Society for Microbiology. All Rights Reserved. Antimicrob. Agents Chemother. doi:10.1128/AAC.02484-12 AAC Accepts, published online ahead of print on 28 May 2013 on April 10, 2019 by guest http://aac.asm.org/ Downloaded from
Transcript of 1 Single dose pharmacodynamics of amphotericin B against

1
Single dose pharmacodynamics of amphotericin B against Aspergillus species in an in vitro 1
pharmacokinetic/pharmacodynamic model 2
3
Running title: Single-dose AMB pharmacodynamics for Aspergillus spp 4
5
6
Rafal Al-Saigh1, Maria Siopi1, Nikolaos Siafakas1, Aristea Velegraki2, 7
Loukia Zerva1, Joseph Meletiadis1 8
9
10
Clinical Microbiology Laboratory, Attikon Hospital1, Mycology Research Lab, Department of 11
Microbiology2, Medical School, National and Kapodistrian University of Athens, Athens, Geece 12
13
14
15
16
Correspondence: Joseph Meletiadis, Ph. D. 17
Lecturer in Mycology, 18
Clinical Microbiology Laboratory, 19
Attikon University Hospital 20
Rimini 1, Haidari, 124 62 Athens 21
Tel: 210-583-1909 22
Fax: 210-532-6421 23
Email: [email protected] 24
Copyright © 2013, American Society for Microbiology. All Rights Reserved.Antimicrob. Agents Chemother. doi:10.1128/AAC.02484-12 AAC Accepts, published online ahead of print on 28 May 2013
on April 10, 2019 by guest
http://aac.asm.org/
Dow
nloaded from
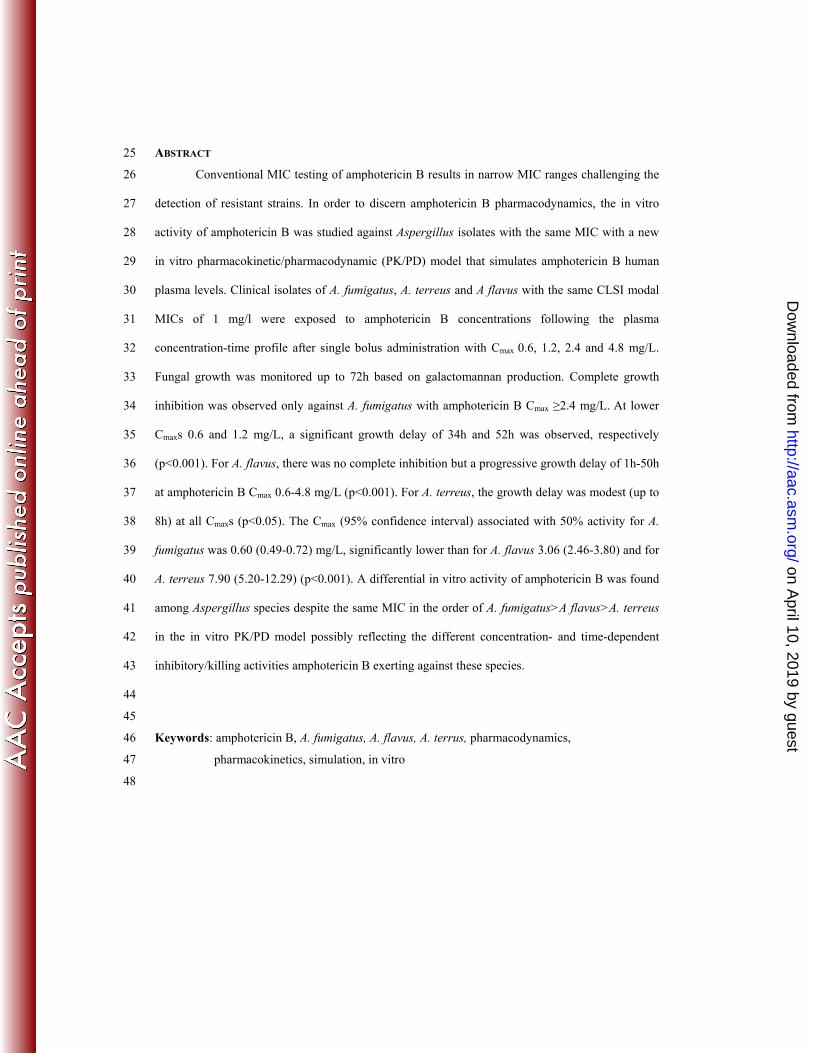
ABSTRACT 25
Conventional MIC testing of amphotericin B results in narrow MIC ranges challenging the 26
detection of resistant strains. In order to discern amphotericin B pharmacodynamics, the in vitro 27
activity of amphotericin B was studied against Aspergillus isolates with the same MIC with a new 28
in vitro pharmacokinetic/pharmacodynamic (PK/PD) model that simulates amphotericin B human 29
plasma levels. Clinical isolates of A. fumigatus, A. terreus and A flavus with the same CLSI modal 30
MICs of 1 mg/l were exposed to amphotericin B concentrations following the plasma 31
concentration-time profile after single bolus administration with Cmax 0.6, 1.2, 2.4 and 4.8 mg/L. 32
Fungal growth was monitored up to 72h based on galactomannan production. Complete growth 33
inhibition was observed only against A. fumigatus with amphotericin B Cmax ≥2.4 mg/L. At lower 34
Cmaxs 0.6 and 1.2 mg/L, a significant growth delay of 34h and 52h was observed, respectively 35
(p<0.001). For A. flavus, there was no complete inhibition but a progressive growth delay of 1h-50h 36
at amphotericin B Cmax 0.6-4.8 mg/L (p<0.001). For A. terreus, the growth delay was modest (up to 37
8h) at all Cmaxs (p<0.05). The Cmax (95% confidence interval) associated with 50% activity for A. 38
fumigatus was 0.60 (0.49-0.72) mg/L, significantly lower than for A. flavus 3.06 (2.46-3.80) and for 39
A. terreus 7.90 (5.20-12.29) (p<0.001). A differential in vitro activity of amphotericin B was found 40
among Aspergillus species despite the same MIC in the order of A. fumigatus>A flavus>A. terreus 41
in the in vitro PK/PD model possibly reflecting the different concentration- and time-dependent 42
inhibitory/killing activities amphotericin B exerting against these species. 43
44
45
Keywords: amphotericin B, A. fumigatus, A. flavus, A. terrus, pharmacodynamics, 46
pharmacokinetics, simulation, in vitro 47
48
on April 10, 2019 by guest
http://aac.asm.org/
Dow
nloaded from

INTRODUCTION 49
Amphotericin B (AMB) is an antifungal drug of major importance in the treatment of 50
invasive aspergillosis (1). It is a highly lipophilic and amphoteric molecule that interacts with 51
fungal cell membrane forming pores and disrupting its integrity (2). Due to its unique mechanism of 52
action, it demonstrates a wide range of pharmacodynamic effects and broad spectrum of antifungal 53
activity. However, conventional MIC testing of amphotericin B resulted in narrow MIC ranges 54
within 1-2 twofold dilutions challenging the detection of resistant strains (3-5). Efforts to develop in 55
vitro assays that separate susceptible and resistant strains using richer media or gradient drug 56
concentrations strips were unsuccessful (3, 5). Species-specific epidemiological cutoff values 57
(ECV) have been proposed for amphotericin B and Aspergillus spp. based on CLSI broth 58
microdilution methodology with A. terreus ECV being one dilution higher than A. fumigatus and A. 59
flavus ECV (6). 60
In addition to inhibitory activity captured by the MIC, amphotericin B exerts a range of 61
different pharmacodynamic effects such as post-antifungal effect and concentration-dependent 62
killing (7). All these effects are usually determined after fungal exposure to constant drug 63
concentrations (2). However, in vivo, fungus is exposed to non-constant amphotericin B 64
concentrations as the drug undergoes metabolism, distribution and excretion. In particular, its 65
plasma levels follow a triphasic time-concentration profile characterized by the alpha-phase 66
observed within the first 4h after administration with a half-life of <1h, the beta-phase observed 67
within 4-24h after administration with a half life of 6-10h, and the gamma phase observed >24h of 68
administration with a half-life of >120h (8). Simulating this time-concentration profile in vitro is a 69
challenge because amphotericin B binds to plastic surfaces and degrades over time (9). 70
We recently developed an in vitro model that simulated human pharmacokinetics of 71
antifungal drugs and enabled to study the pharmacodynamics of decreasing drug concentrations as 72
in human plasma (10). This pharmacokinetic/pharmacodynamic (PK/PD) model showed 73
considerable differences of voriconazole activity against Asperillus species which had the same 74
on April 10, 2019 by guest
http://aac.asm.org/
Dow
nloaded from

MICs indicating that studying the in vitro activity of decreasing drug concentrations provides 75
unique information of pharmacodynamic effects of antifungal drugs (11). With this model, the time- 76
and concentration-dependent pharmacodynamic properties of antifungal drugs can be studied and 77
PK/PD analysis simulating human pharmacokinetics can be performed. 78
We therefore studied the activity of amphotericin B against A. fumigatus, A. flavus and A. 79
terreus strains with similar MICs with the new in vitro PK/PD model simulating single-dose 80
pharmacokinetics of amphotericin B in human plasma and monitoring Aspergillus growth over time 81
with galactomannan production. Despite the same MICs, important pharmacodynamic differences 82
were found among the three species with amphotericin B being less active against A. flavus and A. 83
terreus than against A. fumigatus reflecting differences in inhibitory, killing and post-drug exposure 84
effects. 85
86
MATERIAL AND METHODS 87
Strains. Three clinical strains of A. fumigatus, A. flavus and A. terreus isolated from patients 88
with invasive pulmonary aspergillosis were studied. The minimal inhibitory concentrations (MIC) 89
as determined thrice with the CLSI broth microdilution method were 1-1 mg/L for A. fumigatus, 1-1 90
mg/L for A. flavus and 1-2 mg/L (mode 1 mg/L) for A. terreus (12, 13). The A. terreus strain was 91
included because of its known reduced susceptibility to amphotericin B. The strains were 92
maintained at-70oC in 10% glycerol and cultured twice in Sabouraud Dextrose agar at 30oC for 5-7 93
days. A conidial suspension was prepared in normal saline with 1% Tween 20. Conidia were 94
counted with a Newbauer chamber in order to obtain a final suspension 1x10⁵CFU/ml and their 95
concentration was confirmed by quantitative cultures on Sabouraud Dextrose Agar. 96
Antifungal susceptibility testing. In order to explore the in vitro susceptibility of the three 97
isolates with other methodologies, the isolates were also tested with the gradient concentration strip 98
method Liofilchem™ MIC Test Strips (MTS) (Varelas SA, Athens, Greece) according to 99
manufacturer’s instructions and the XTT methodology as previously described (14). Briefly, for 100
on April 10, 2019 by guest
http://aac.asm.org/
Dow
nloaded from

MTS method agar plates with RPMI1640+MOPS+2% glucose were inoculated in three directions 101
with a cotton swab dipped into a 0.5MacFarland conidial inoculum and the MTS was applied and 102
incubated at 35oC for 24h and 48h. The MIC was determined as drug concentration at which the 103
border of the elliptical inhibition zone corresponding to 100% inhibition intersected the strip. For 104
XTT methodology, twofold serial dilutions of amphotericin B in RPMI1640+MOPS in 96-105
flatbottom well microtitration plates were inoculated with 1-5x10⁴CFU/ml, incubated for 48h when 106
0.1 mg/ml XTT + 25 μM Menadione was added in each well, further incubated for 2h at 35οC when 107
absorbance at 450nm was measured and % growth in each well was calculated in comparison to 108
growth in the drug-free control. The MIC was determined as the lowest drug concentration with 109
<10% growth. Furthermore, the minimal fungicidal concentration (MFC) was determined with an 110
XTT methodology as previously described (13). Briefly, after XTT MIC determination, fresh 111
medium was added to all clear wells after washed with saline and after incubation for 24h at 35oC 112
XTT+MEN was added and % growth was calculated based on absorbance at 450nm. The MFC was 113
determined as the lowest drug concentration showing <10% growth. All tests were performed three 114
times. 115
Antifungal drug and medium. Amphotericin B (AMB, Fungizone, Bristol-Myers) was 116
reconstituted at 10,000 mg/L according to manufacturer’s instructions and stored at-70oC. The 117
medium contained 10.4 g/L RPMI1640 with glutamine without sodium bicarbonate (Sigma-118
Aldrich, St. Luis, MO) and 0.165M buffer MOPS (Invitrogen, Carlsbad, CA), pH 7.0, with 100 119
mg/L chloramphenicol (Sigma -Aldrich, St. Luis, MO). 120
In vitro pharmacokinetic/pharmacodynamic model. The in vitro pharmacokinetic 121
simulation model consists of a) a glass beaker containing 700ml medium (external compartment 122
EC) in which is placed, b) a dialysis tube of 10 ml volume (internal compartment IC) the wall of 123
which consists of cellulose permeable membrane allowing the free diffusion of molecules with a 124
molecular weight <20kD, and c) a peristaltic pump (Minipuls Evolution, Gilson, France), which 125
removes the content of EC and adds medium within it at a rate equivalent to drug removal from 126
on April 10, 2019 by guest
http://aac.asm.org/
Dow
nloaded from

human serum (10). The conidial suspension is inoculated in the IC within which the growing fungus 127
and its derivative galactomannan (molecular weight 20-60kD) remain trapped, while nutrients and 128
drug diffuse freely between IC and EC. The concentration of the galactomannan increases with 129
fungal growth. The drug is injected into the EC and its concentration is adjusted by the pump to 130
correspond to the average half-life observed in human plasma after intravenous administration of 131
amphotericin B. The EC was covered with aluminum foil in order to minimize light exposure and 132
placed on a heated magnetic stirrer (37oC). Before starting each experiment, temperature and flow 133
rate were controlled. All experiments were repeated twice. 134
Determination of amphotericin B concentrations. The drug levels in the IC were 135
determined by a microbiological method using the strain Paecilomyces variotii ATTC 22319, 136
susceptible to AMB (15). Specifically, P.variotii conidia at final concentration 5x10⁵CFU/ml were 137
inoculated into prewarmed at 54oC RPMI1640 medium + MOPS with 15 g/L agar and poured to 138
plastic plates 10x10cm. After solidification of the agar, 1 cm-diameter holes were opened and filled 139
with 100μl of known drug dilutions (range 0.25-16 mg/L), as well as 100μl of IC samples. The 140
plates were incubated at 37oC for 24h when diameters of inhibition zones were measured. Unknown 141
drug concentrations in the IC samples were determined using the standard curve constructed from 142
known drug concentrations and corresponding diameters of inhibition zones. 143
Pharmacokinetic analysis. Several clinically relevant AMB doses (0.25, 0.5, 1 and 1.5 144
mg/kg) were simulated in the in vitro model with maximum concentrations in human plasma Cmax 145
of 0.6, 1.2, 2.4 and 4.8 mg/L and AUC values of 9.4, 21, 46.3 and 57.3 (8, 16, 17). After taking 146
into account any loss of amphotericin B during the experiments due to degradation and surface 147
binding, the flow rate was adjusted in order to approximate the plasma concentration profile of 148
amphotericin B in humans with an alpha phase with a short half life of <1h observed within 4h after 149
drug administration followed by a beta phase with a longer half life of 6-10h observed 4-24h after 150
drug administration and a gamma phase with a half life of 120h observed >24h after drug 151
administration (8). Amphotericin B concentrations were determined at 0h, 4h, 6h, 8h, 20h, 24h, 152
on April 10, 2019 by guest
http://aac.asm.org/
Dow
nloaded from

44h, 48h and 72h after the introduction of the drug in the IC using the bioassay. The data were 153
analyzed by nonlinear regression based on a three-compartment model described by the equation 154
C= Cαekαt+Cβekβt+Cγe
kγt where kα, kβ and kγ are the rate constants, Cα, Cβ and Cγ are the Y-155
intercepts for alpha, beta and gamma phase, respectively, and C is the concentration at a given time 156
t. The half-lives of alpha, beta and gamma phases were calculated for EC and IC separately using 157
the equations t1/2.α=kα/ln(2), t1/2.β=kβ/ln(2), and t1/2.γ=kγ/ln(2), respectively, and were compared with 158
the corresponding values observed in human plasma. 159
Determination of fungal growth. Fungal growth in the IC was assessed in samples of 160
100μl at regular time intervals by determining galactomannan production using an ELISA (Platellia, 161
Biorad, Athens, Greece). Samples were diluted with 200μl saline in order to reach the final volume 162
of 300μl before processing. Results were expressed as a galactomannan index (GI) according to the 163
manufacturer's instructions. Galactomannan levels were also determined in the EC in order to 164
ensure that no galactomannan was escaped from the IC. 165
Real time PCR conidial equivalent was used as an alternative biomarker of fungal growth 166
and killing. Aspergillus DNA was extracted from 200μl samples from the IC of the in viro PKPD 167
model after 0h and 72h with the Qiagen DNA Blood Mini kit (Roche Diagnostics, Athens, Greece) 168
after enzymatic (incubation with protenase K at 56oC for 10 min) and mechanical (1 min vortex 169
with glass beads) extraction as previously described (18). Real time PCR was performed with a 170
previously described assay (2Asp assay) using Aspergillus specific primers (ASF1 and ADR1) and 171
probe (ASP28P) (19). The threshold cycle (Ct) of each sample, which identifies the cycle number 172
during PCR when fluorescence exceeds a threshold value determined by the software, was 173
converted to conidial equivalent (CE) A. fumigatus DNA by interpolation from a 6-point standard 174
curve of Ct values obtained with 103-108 Aspergillus CFU/ml. The reduction of the PCR CE after 175
72h of incubation compared to 0h was calculated for each species and amphotericin B doses. 176
Pharmacodynamic analysis. In vitro pharmacodynamics of each amphotericin B dose and 177
Aspergillus species were determined based on the GI-time relationship analyzed with the Emax 178
on April 10, 2019 by guest
http://aac.asm.org/
Dow
nloaded from
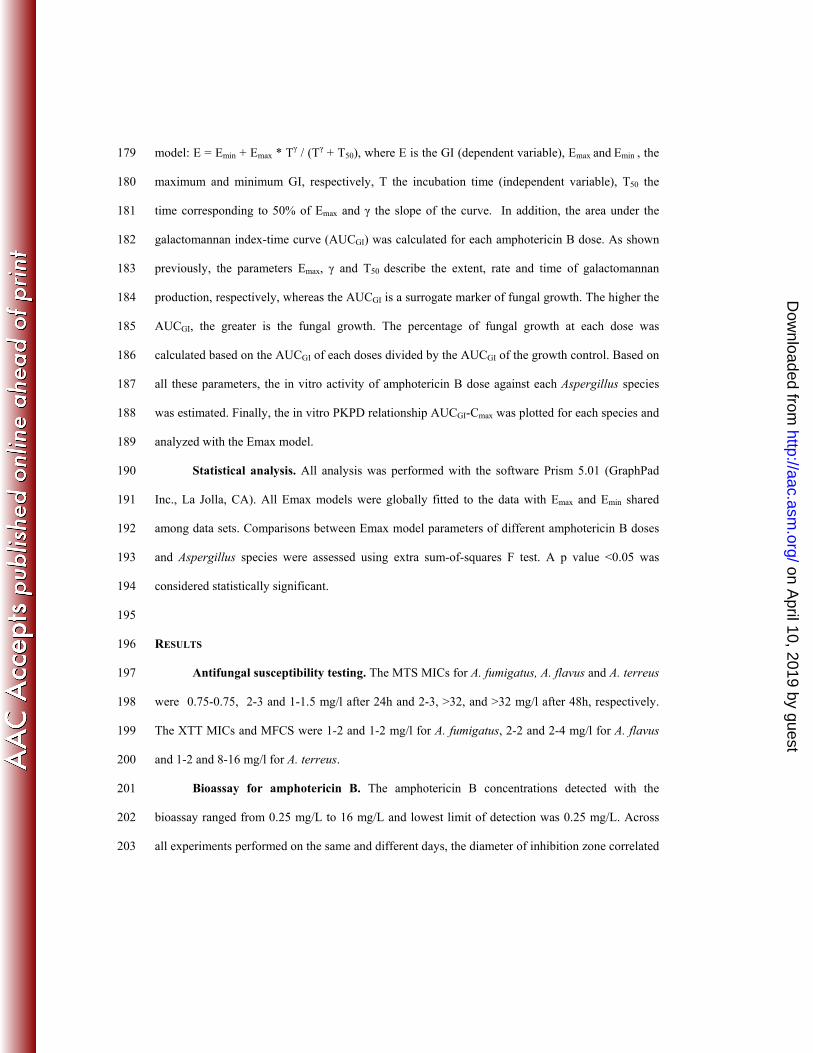
model: E = Emin + Emax * Tγ / (Tγ + T50), where E is the GI (dependent variable), Emax and Emin , the 179
maximum and minimum GI, respectively, T the incubation time (independent variable), T50 the 180
time corresponding to 50% of Emax and γ the slope of the curve. In addition, the area under the 181
galactomannan index-time curve (AUCGI) was calculated for each amphotericin B dose. As shown 182
previously, the parameters Emax, γ and T50 describe the extent, rate and time of galactomannan 183
production, respectively, whereas the AUCGI is a surrogate marker of fungal growth. The higher the 184
AUCGI, the greater is the fungal growth. The percentage of fungal growth at each dose was 185
calculated based on the AUCGI of each doses divided by the AUCGI of the growth control. Based on 186
all these parameters, the in vitro activity of amphotericin B dose against each Aspergillus species 187
was estimated. Finally, the in vitro PKPD relationship AUCGI-Cmax was plotted for each species and 188
analyzed with the Emax model. 189
Statistical analysis. All analysis was performed with the software Prism 5.01 (GraphPad 190
Inc., La Jolla, CA). All Emax models were globally fitted to the data with Emax and Emin shared 191
among data sets. Comparisons between Emax model parameters of different amphotericin B doses 192
and Aspergillus species were assessed using extra sum-of-squares F test. A p value <0.05 was 193
considered statistically significant. 194
195
RESULTS 196
Antifungal susceptibility testing. The MTS MICs for A. fumigatus, A. flavus and A. terreus 197
were 0.75-0.75, 2-3 and 1-1.5 mg/l after 24h and 2-3, >32, and >32 mg/l after 48h, respectively. 198
The XTT MICs and MFCS were 1-2 and 1-2 mg/l for A. fumigatus, 2-2 and 2-4 mg/l for A. flavus 199
and 1-2 and 8-16 mg/l for A. terreus. 200
Bioassay for amphotericin B. The amphotericin B concentrations detected with the 201
bioassay ranged from 0.25 mg/L to 16 mg/L and lowest limit of detection was 0.25 mg/L. Across 202
all experiments performed on the same and different days, the diameter of inhibition zone correlated 203
on April 10, 2019 by guest
http://aac.asm.org/
Dow
nloaded from

linearly with amphotericin B concentration (r2>0.77, global r2=0.84). The coefficient of variation 204
ranged from 5% to 25% (average 15%) for all concentrations. 205
Pharmacokinetic analysis. The Cmax in the IC were 0.76-0.78, 1.05-1.10, 2.5-2.7 and 3.9-206
4.4 mg/L and the AUCs 4.5-5, 8-8.6, 31.9-33.2, 64.8-67.9 mg.h/l, respectively, with t1/2,α 0.2-2h, 207
t1/2,β 10-17h and t1/2,γ 71h for the simulated amphotericin B doses 0.25, 0.5, 1 and 1.5 mg/kg, 208
respectively. Because of the low detection limit of the bioassay, a gamma phase was observed only 209
for the highest dose of amphotericin B with Cmax 4.8 mg/L. These values were similar to those 210
observed in human plasma after administration of amphotericin B doses 0.25-1.5 mg/kg with the 211
largest deviations observed at lower doses (Figure 1). 212
Pharmacodynamic analysis (PD). The GI–time curves were described very well with the 213
Emax model (R2> 0.86) and they were characterized by the same Emax but different slopes and T50s 214
for the different amphotericin B doses and Aspergillus species. Among all species and doses tested, 215
complete inhibition of galactomannan production was observed only against A. fumigatus with 216
amphotericin B doses corresponding to Cmax ≥2.4 mg/L (Figure 2). At lower doses, a significant 217
delay in galactomannan production was observed with a mean±SEM T50 of 38.1±2.3h for Cmax 0.6 218
mg/L and 57.9±2.7h for Cmax 1.2 mg/L compared to 4.2±0.4h for the drug free control (p<0.001). 219
For A. flavus, there was no complete inhibition but a progressive delay of galactomannan 220
production with increasing amphotericin B doses since the T50 increased from 8.2±0.6h for the 221
growth control to 9.3±0.6h at amphotericin B dose with Cmax 0.6 mg/L, 24.3±3.2h at Cmax 1.2 mg/L, 222
36.7±3.1h at Cmax 2.4 mg/L and 57.8±2.7h at Cmax 4.8 mg/L (p<0.001). For A. terreus, the delay in 223
galactomannan production was modest since the T50 of 4±0.4h for the growth control increased to 224
12.6±3.3h at the highest dose of amphotericin B with Cmax 4.8 mg/L (p=0.013). The differences 225
among the tree species in galactomannan production with the two high doses of amphotericin B 226
with Cmax 2.4 and 4.8 mg/l were confirmed with real time PCR results with PCR CE at 72h being 227
reduced by 0.7 and 0.8 log10CE of A. fumigatus, 0.1 and 0.4 log10CE of A. flavus and increased by 228
1.5 and 0.1 log10CE of A. terreus, respectively (data not shown). 229
on April 10, 2019 by guest
http://aac.asm.org/
Dow
nloaded from

Finally, the in vitro activity of amphotericin B against the three Aspergillus species was 230
compared by constructing PK/PD curves. In order to quantify the effect of each amphotericin B 231
dose at the entire 72h period of incubation, the AUCGI was calculated for each dose and species as a 232
surrogate marker of fungal growth and plotted against the corresponding Cmaxs (Figure 3). The in 233
vitro PK/PD relationship followed a sigmoid pattern (global R2=0.99). The Cmax (95% confidence 234
interval) associated with 50% activity for A. fumigatus was 0.60 (0.49-0.72), which was statistically 235
significant lower than the corresponding Cmax against A. flavus (3.06, 2.46-3.80) and A. terreus 236
(7.90, 5.20-12.29) (p<0.001). 237
238
DISCUSSION 239
Important pharmacodynamic differences of amphotericin B against the three Aspergillus 240
species were found in the recently developed in vitro PK/PD model where conidia were exposed to 241
decreasing drug concentrations simulating the plasma concentration-time profile of amphotericin B. 242
Despite the same MICs, the strongest in vitro activity of amphotericin B was found against A. 243
fumigatus followed by A. flavus and A. terreus. The XTT and gradient concentration strips methods 244
showed minor differences in the MIC of the three isolates which clustered within 1-2 twofold 245
dilution, emphasizing the problem of narrow amphotericin B MIC ranges with these techniques. 246
However, 48h MTS MICs were similar for A. flavus and A. terreus and higher for A. fumigatus 247
whereas XTT MFCs were similar for A. fumigatus and A. flavus and higher for A. terreus 248
advocating for the different pharmacodynamic effects amphotericin B possessed against different 249
Aspergillus species. 250
Studying the effect of decreasing concentrations of antifungal drugs provides information 251
about pharmacodynamic properties related with sub-MIC effect, post-antifungal effect, time- and 252
concentration-dependent activities. These effects can be quantified by a surrogate marker of fungal 253
growth based on galactomannan production kinetics which captures any difference regarding the 254
above antifungal effects. Differential antifungal activity was also previously found with the present 255
on April 10, 2019 by guest
http://aac.asm.org/
Dow
nloaded from

in vitro PK/PD model for voriconazole against the three Apergillus species with identical MICs 256
emphasizing the importance of studying non-constant drug concentrations (10, 11). 257
The findings of the present study are in agreement with previous time-kill assays where 258
supra-MIC (4x and 20xMIC) concentrations of amphotericin B killed A. fumigatus but not A. 259
terreus (20). Minimal fungicidal concentrations of amphotericin B were similar against A. 260
fumigatus and A. flavus and much higher against A. terreus. However, MFC/MIC ratios for A. 261
fumigatus were lower than those for A. flavus differentiating the in vitro activity of amphotericin B 262
against these two species (13). In addition, the three species were previously found to differ also in 263
the post-drug exposure effects since 4x and 1xMIC of amphotericin B demonstrated >4h post 264
antifungal effect against A. fumigatus and <4h against A. flavus and A. terreus (21). Time-265
dependent activity of amphotericin B inhibition also differed among the three Aspergillus species 266
(22). Exposure of Aspergillus conidia to supra-MIC concentrations for 8h resulted in significant 267
amount of metabolic activity for A. terreus (16%), less for A. flavus (8%) and even lesser for A. 268
fumigatus (5%) isolates. Furthermore, despite the same concentration-effect curves of amphotericin 269
B for A. fumigatus and A. flavus at 48h, the inhibitory concentration-effect curve after 8h of 270
exposure to amphotericin B were shifted to the left for A. fumigatus but not for A. flavus indicating 271
that amphotericin B activity is faster against A. fumigatus than A. flavus species (22). 272
Taking into account all these different effects exerted by amphotericin B, the order of 273
amphotericin B in vitro activity demonstrated by the present model (A. fumigatus>A. flavus>A. 274
terreus) could be explained by a fast inhibitory action and increased killing rate against A. 275
fumigatus, a slower inhibitory action and reduced killing efficiency against A. flavus and the 276
slowest inhibitory action and no killing against A. terreus as also found with real time PCR results. 277
In particular, the delayed galactomannan production of A. fumigatus but not A. flavus at Cmax=0.6 278
mg/L indicates a strong sub-MIC effect of amphotericin B against the former species. Although 279
there are no data on sub-MIC effects of amphotericin B against Aspergillus spp. such effects were 280
described against Candida spp.(23). At Cmax=1.2 mg/L, galactomannan was detected after 48h 281
on April 10, 2019 by guest
http://aac.asm.org/
Dow
nloaded from

incubation for A. fumigatus reflecting the minimal fungicidal action at this concentration (usually 282
observed at 2xMIC) (13) and the long post-antifungal effect observed at 1xMC (21) together with a 283
sub-MIC effect possibly occurred after amphotericin B concentrations fell below the MIC. The 284
absence of galactomannan production at concentrations >2xMIC reflects the fungicidal activity 285
amphotericin B demonstrated at time-kill assays (20). For A. flavus, galactomannan was detected at 286
Cmax=4.8, 2.4 and 1.2 mg/L after 48h, 24h and 6h as soon as the concentration fell below MIC 287
reflecting the absence of killing and post-antifungal effects as previously described (21). Of note, at 288
all three doses galactomannan production was detected after 4h despite amphotericin B 289
concentrations being higher than the MIC reflecting the slow inhibitory action of amphotericin B 290
against this species, as previously found (22). Finally, the modest delay in galactomannan 291
production of A. terreus at all doses reflects the lack of killing, post-antifungal and possibly sub-292
MIC effect and the slow inhibitory action against this species. Thus, single-dose pharmacodynamics 293
in the present in vitro PK/PD model where amphotericin B concentrations decrease over time may 294
reflect concentration- and time-dependent inhibitory and killing activities described by MFC, time-295
kill and post-antifungal effect assays. 296
Amphotericin B was for decades the treatment of choice for aspergillosis. Clinical and 297
animal data indicated different drug efficacy against infections caused by various Aspergillus 298
species (24). Lack of in vivo efficacy, however, was not associated with significantly increased 299
MIC values (3, 25, 26), which remained similar for all three species examined in the present study 300
(13, 27). Results obtained by the new in vitro model revealed striking differences in efficacy of 301
amphotericin B against the three Aspergillus species despite their similar MICs with the following 302
order: A. fumigatus>A. flavus>A. terreus. These findings are in agreement with previous 303
comparative animal studies where treatment with amphotericin B was more effective against 304
experimental infection caused by A. fumigatus than infection with A. flavus and less effective 305
against infection with A. terreus (4, 20). In particular, amphotericin B treatment of guinea pigs 306
infected with an A. flavus or an A. fumigatus strain (each with MIC of 1 mg/L), resulted in 0% and 307
on April 10, 2019 by guest
http://aac.asm.org/
Dow
nloaded from

80% survival, respectively at the highest dosage of 2.5 mg/kg (4, 20). Furthermore, the in vivo 308
PKPD parameter Cmax/MIC associated with near maximum survival in an animal model of 309
experimental aspergillosis by A. fumigatus was previously found to be 2.4 similar to the Cmax/MIC 310
ratio found in the present study to be associated with the maximum suppressive effect of 311
amphotericin B against A. fumigatus (28). However, differences in pathogenesis and virulence 312
among these species may confound in vitro-in vivo correlation (29, 30). Clinical studies also 313
demonstrated a higher mortality rate of infections by A. terreus compared to those by A. fumigatus 314
despite amphotericin B therapy (31, 32). It seems that the new in vitro model, described here, may 315
better characterize the pharmacodynamic characteristics of amphotericin B against the most 316
clinically significant Aspergillus species than conventional in vitro susceptibility systems. 317
In summary, the in vitro model simulated well amphotericin B human pharmacokinetics 318
and demonstrated a differential in vitro activity against the three Aspergillus species that was not 319
reflected by their respective MICs. The effects observed in the in vitro PK/PD model may be the 320
sum of concentration- and time-dependent inhibitory/killing activities exerted by amphotericin B 321
with the greatest activity found against A. fumigatus and the lowest against A. terreus. Future 322
studies should focus on testing larger collections of isolates in order to describe the distribution of 323
this new pharmacodynamic effect and taking into account protein binding and amphotericin B 324
disposition in human body in order to obtain clinically relevant drug exposures that was not 325
obtained with the current model. A composite pharmacodynamic effect that describes the different 326
in vitro activities of amphotericin B may overcome the MIC clustering, assess better antifungal 327
activity and help distinguish susceptible and from resistant strains. 328
329
FUNDING 330
This study was supported by the Marie Curie Reintegration Grant MIRG-CT-2007-208796 331
of the European Commission. 332
333
on April 10, 2019 by guest
http://aac.asm.org/
Dow
nloaded from

REFERENCES 334
1. Walsh TJ, Anaissie EJ, Denning DW, Herbrecht R, Kontoyiannis DP, Marr KA, 335
Morrison VA, Segal BH, Steinbach WJ, Stevens DA, van Burik JA, Wingard JR, 336
Patterson TF. 2008. Treatment of aspergillosis: clinical practice guidelines of the Infectious 337
Diseases Society of America. Clin Infect Dis 46:327-360. 338
2. Moore CB, Sayers N, Mosquera J, Slaven J, Denning DW. 2000. Antifungal drug 339
resistance in Aspergillus. J Infect 41:203-220. 340
3. Johnson EM, Oakley KL, Radford SA, Moore CB, Warn P, Warnock DW, Denning 341
DW. 2000. Lack of correlation of in vitro amphotericin B susceptibility testing with 342
outcome in a murine model of Aspergillus infection. J Antimicrob Chemother 45:85-93. 343
4. Odds FC, Van Gerven F, Espinel-Ingroff A, Bartlett MS, Ghannoum MA, Lancaster 344
MV, Pfaller MA, Rex JH, Rinaldi MG, Walsh TJ. 1998. Evaluation of possible 345
correlations between antifungal susceptibilities of filamentous fungi in vitro and antifungal 346
treatment outcomes in animal infection models. Antimicrob Agents Chemother 42:282-288. 347
5. Verweij PE, Oakley KL, Morrissey J, Morrissey G, Denning DW. 1998. Efficacy of 348
LY303366 against amphotericin B-susceptible and -resistant Aspergillus fumigatus in a 349
murine model of invasive aspergillosis. Antimicrob Agents Chemother 42:873-878. 350
6. Espinel-Ingroff A, Cuenca-Estrella M, Fothergill A, Fuller J, Ghannoum M, Johnson 351
E, Pelaez T, Pfaller MA, Turnidge J. 2011. Wild-type MIC distributions and 352
epidemiological cutoff values for amphotericin B and Aspergillus spp. for the CLSI broth 353
microdilution method (M38-A2 document). Antimicrob Agents Chemother 55:5150-5154. 354
7. Dodds ES, Drew RH, Perfect JR. 2000. Antifungal pharmacodynamics: review of the 355
literature and clinical applications. Pharmacotherapy 20:1335-1355. 356
8. Bekersky I, Fielding RM, Dressler DE, Lee JW, Buell DN, Walsh TJ. 2002. 357
Pharmacokinetics, excretion, and mass balance of liposomal amphotericin B (AmBisome) 358
and amphotericin B deoxycholate in humans. Antimicrob Agents Chemother 46:828-833. 359
on April 10, 2019 by guest
http://aac.asm.org/
Dow
nloaded from

9. Lewis RE, Wiederhold NP, Prince RA, Kontoyiannis DP. 2006. In vitro 360
pharmacodynamics of rapid versus continuous infusion of amphotericin B deoxycholate 361
against Candida species in the presence of human serum albumin. J Antimicrob Chemother 362
57:288-293. 363
10. Meletiadis J, Al-Saigh R, Velegraki A, Walsh TJ, Roilides E, Zerva L. 2012. 364
Pharmacodynamic effects of simulated standard doses of antifungal drugs against 365
Aspergillus species in a new in vitro pharmacokinetic/pharmacodynamic model. Antimicrob 366
Agents Chemother 56:403-410. 367
11. Al-Saigh R, Elefanti A, Velegraki A, Zerva L, Meletiadis J. 2012. In vitro 368
pharmacokinetic/pharmacodynamic modeling of voriconazole activity against Aspergillus 369
species in a new in vitro dynamic model. Antimicrob Agents Chemother 56:5321-5327. 370
12. CLSI. 2008. Reference method for broth dilution antifungal susceptibility testing of 371
filamentous fungi; Approved standard. Second edition M38-A2. 28. 372
13. Meletiadis J, Antachopoulos C, Stergiopoulou T, Pournaras S, Roilides E, Walsh TJ. 373
2007. Differential fungicidal activities of amphotericin B and voriconazole against 374
Aspergillus species determined by microbroth methodology. Antimicrob Agents Chemother 375
51:3329-3337. 376
14. Meletiadis J, Mouton JW, Meis JF, Bouman BA, Donnelly JP, Verweij PE. 2001. 377
Colorimetric assay for antifungal susceptibility testing of Aspergillus species. J Clin 378
Microbiol 39:3402-3408. 379
15. Shadomy S, McCay JA, Schwartz SI. 1969. Bioassay for hamycin and amphotericin B in 380
serum and other biological fluids. Appl Microbiol 17:497-503. 381
16. Ayestaran A, Lopez RM, Montoro JB, Estibalez A, Pou L, Julia A, Lopez A, Pascual B. 382
1996. Pharmacokinetics of conventional formulation versus fat emulsion formulation of 383
amphotericin B in a group of patients with neutropenia. Antimicrob Agents Chemother 384
40:609-612. 385
on April 10, 2019 by guest
http://aac.asm.org/
Dow
nloaded from

17. Sanders SW, Buchi KN, Goddard MS, Lang JK, Tolman KG. 1991. Single-dose 386
pharmacokinetics and tolerance of a cholesteryl sulfate complex of amphotericin B 387
administered to healthy volunteers. Antimicrob Agents Chemother 35:1029-1034. 388
18. Griffiths LJ, Anyim M, Doffman SR, Wilks M, Millar MR, Agrawal SG. 2006. 389
Comparison of DNA extraction methods for Aspergillus fumigatus using real-time PCR. J 390
Med Microbiol 55:1187-1191. 391
19. White PL, Barton R, Guiver M, Linton CJ, Wilson S, Smith M, Gomez BL, Carr MJ, 392
Kimmitt PT, Seaton S, Rajakumar K, Holyoake T, Kibbler CC, Johnson E, Hobson 393
RP, Jones B, Barnes RA. 2006. A consensus on fungal polymerase chain reaction 394
diagnosis?: a United Kingdom-Ireland evaluation of polymerase chain reaction methods for 395
detection of systemic fungal infections. J Mol Diagn 8:376-384. 396
20. Walsh TJ, Petraitis V, Petraitiene R, Field-Ridley A, Sutton D, Ghannoum M, Sein T, 397
Schaufele R, Peter J, Bacher J, Casler H, Armstrong D, Espinel-Ingroff A, Rinaldi 398
MG, Lyman CA. 2003. Experimental pulmonary aspergillosis due to Aspergillus terreus: 399
pathogenesis and treatment of an emerging fungal pathogen resistant to amphotericin B. J 400
Infect Dis 188:305-319. 401
21. Vitale RG, Mouton JW, Afeltra J, Meis JF, Verweij PE. 2002. Method for measuring 402
postantifungal effect in Aspergillus species. Antimicrob Agents Chemother 46:1960-1965. 403
22. Antachopoulos C, Meletiadis J, Sein T, Roilides E, Walsh TJ. 2007. Use of high 404
inoculum for early metabolic signalling and rapid susceptibility testing of Aspergillus 405
species. J Antimicrob Chemother 59:230-237. 406
23. Garcia MT, Llorente MT, Minguez F, Prieto J. 2002. Postantifungal effect and effects of 407
sub-MIC concentrations on previously treated Candida sp. influence of growth phase. J 408
Infect 45:263-267. 409
24. Denning DW, Marinus A, Cohen J, Spence D, Herbrecht R, Pagano L, Kibbler C, 410
Kcrmery V, Offner F, Cordonnier C, Jehn U, Ellis M, Collette L, Sylvester R. 1998. An 411
on April 10, 2019 by guest
http://aac.asm.org/
Dow
nloaded from

EORTC multicentre prospective survey of invasive aspergillosis in haematological patients: 412
diagnosis and therapeutic outcome. EORTC Invasive Fungal Infections Cooperative Group. 413
J Infect 37:173-180. 414
25. Lionakis MS, Lewis RE, Chamilos G, Kontoyiannis DP. 2005. Aspergillus susceptibility 415
testing in patients with cancer and invasive aspergillosis: difficulties in establishing 416
correlation between in vitro susceptibility data and the outcome of initial amphotericin B 417
therapy. Pharmacotherapy 25:1174-1180. 418
26. Mosquera J, Warn PA, Morrissey J, Moore CB, Gil-Lamaignere C, Denning DW. 419
2001. Susceptibility testing of Aspergillus flavus: inoculum dependence with itraconazole 420
and lack of correlation between susceptibility to amphotericin B in vitro and outcome in 421
vivo. Antimicrob Agents Chemother 45:1456-1462. 422
27. Baddley JW, Marr KA, Andes DR, Walsh TJ, Kauffman CA, Kontoyiannis DP, Ito JI, 423
Balajee SA, Pappas PG, Moser SA. 2009. Patterns of susceptibility of Aspergillus isolates 424
recovered from patients enrolled in the Transplant-Associated Infection Surveillance 425
Network. J Clin Microbiol 47:3271-3275. 426
28. Wiederhold NP, Tam VH, Chi J, Prince RA, Kontoyiannis DP, Lewis RE. 2006. 427
Pharmacodynamic activity of amphotericin B deoxycholate is associated with peak plasma 428
concentrations in a neutropenic murine model of invasive pulmonary aspergillosis. 429
Antimicrob Agents Chemother 50:469-473. 430
29. Slesiona S, Gressler M, Mihlan M, Zaehle C, Schaller M, Barz D, Hube B, Jacobsen 431
ID, Brock M. 2012. Persistence versus escape: Aspergillus terreus and Aspergillus 432
fumigatus employ different strategies during interactions with macrophages. PLoS One 433
7:e31223. 434
30. Blum G, Perkhofer S, Haas H, Schrettl M, Wurzner R, Dierich MP, Lass-Florl C. 435
2008. Potential basis for amphotericin B resistance in Aspergillus terreus. Antimicrob 436
Agents Chemother 52:1553-1555. 437
on April 10, 2019 by guest
http://aac.asm.org/
Dow
nloaded from

31. Lass-Florl C, Kofler G, Kropshofer G, Hermans J, Kreczy A, Dierich MP, 438
Niederwieser D. 1998. In-vitro testing of susceptibility to amphotericin B is a reliable 439
predictor of clinical outcome in invasive aspergillosis. J Antimicrob Chemother 42:497-502. 440
32. Steinbach WJ, Benjamin DK, Jr., Kontoyiannis DP, Perfect JR, Lutsar I, Marr KA, 441
Lionakis MS, Torres HA, Jafri H, Walsh TJ. 2004. Infections due to Aspergillus terreus: 442
a multicenter retrospective analysis of 83 cases. Clin Infect Dis 39:192-198. 443
444
445
on April 10, 2019 by guest
http://aac.asm.org/
Dow
nloaded from

0 6 12 18 24 30 36 42 48 54 60 66 720.0
0.5
1.0
1.5
2.0
2.5
3.0
3.5
4.0
4.5
5.0
In vitro pharmacokineticsof Amphotericin B
Internal compartmentExpected
Time(h)
Co
nce
ntr
atio
n (
mg
/l)
446
Figure 1. Pharmacokinetic analysis of simulated amphotericin B doses 0.3, 0.5, 1 and 1.5 mg/kg in 447
humans (dashed lines) and in the in vitro pharmacokinetic/pharmacodynamic model (solid lines) 448
with Cmax 0.6 (light gray), 1.2 (medium gray), 2.4 (dark gray) and 4.8 mg/L (black), respectively. 449
on April 10, 2019 by guest
http://aac.asm.org/
Dow
nloaded from

Aspergillus fumigatus (mode MIC 1 mg/l)
0 6 12 18 24 30 36 42 48 54 60 66 720
2
4
6
8
10
12
Time (hours)
Gal
acto
man
nan
in
dex
Aspergillus flavus (mode MIC 1 mg/l)
0 6 12 18 24 30 36 42 48 54 60 66 720
2
4
6
8
10
12
Time (hours)
Gal
acto
man
nan
in
dex
Aspergillus terreus (mode MIC 1 mg/l)
0 6 12 18 24 30 36 42 48 54 60 66 720
2
4
6
8
10
12AMB Cmax=0.6 mg/lAMB Cmax=1.2 mg/lAMB Cmax=2.4 mg/lAMB Cmax=4.8 mg/l
Control w/o AMB
Time (hours)
Gal
acto
man
nan
in
dex
450 451
Figure 2. Single-dose pharmacodynamic analysis of simulated amphotericin B doses with Cmax 0.6, 452
1.2, 2.4 and 4.8 mg/L against A. fumigatus, A. flavus and A. terreus isolates with mode CLSI MIC of 453
1 mg/l as determined by galactomannan index in the in vitro PK/PD model. 454
455
on April 10, 2019 by guest
http://aac.asm.org/
Dow
nloaded from

In vitro pkd relationship
0
20
40
60
80
100A. fumigatusA. flavusA. terreus
4.82.41.20.60.30 9.6
A. fumigatusA. flavusA. terreus
Amphotericin B Cmax (mg/L)
% F
un
gal
gro
wth
(A
UC
GI)
456 457 458 Figure 3. Single-dose exposure-efficacy relationship of amphotericin B against each Aspergillus 459
species with modal CLSI MICs 1 mg/L for A. fumigatus, A. flavus and A. terreus in the in vitro 460
PK/PD system simulating amphotericin B human plasma levels based on the increasing 461
amphotericin B Cmaxs (maximum concentration) and the galactomannan index as a marker of fungal 462
growth. 463
464
465
on April 10, 2019 by guest
http://aac.asm.org/
Dow
nloaded from