1 Section 2: Obesity in Children Be Our Voice is a program of the National Initiative for...
32
1 Section 2: Obesity in Children Be Our Voice is a program of the National Initiative for Children’s Healthcare Quality (NICHQ), in cooperation with: Sponsored by the Robert Wood Johnson Foundation.
-
Upload
annis-williamson -
Category
Documents
-
view
213 -
download
0
Transcript of 1 Section 2: Obesity in Children Be Our Voice is a program of the National Initiative for...

1
Section 2: Obesity in Children
Be Our Voice is a program of the National Initiative for Children’s Healthcare Quality (NICHQ), in cooperation with:
Sponsored by the Robert Wood Johnson Foundation.

2
Objectives1. Describe the magnitude and trends associated with the nation’s obesity epidemic.
2. Identify those children at greatest risk for obesity.3. Rank states with the highest risk for obesity.4. Describe why children need advocates for obesity
prevention.5. Articulate at lest two policy strategies to support
obesity prevention.

3
www.ncsl.org/.../programs/health/ObesityMap.jpgThe National Survey of Children's Health, Overweight and Physical Activity Among Children: A Portrait of States and the Nation 2005; HRSA,Health, United States, U.S. Department of Health and Human Services,Centers for Disease Control and Prevention, National Center for Health Statistics, 2007.
National Perspective

4
State Rankings
Rank States% Overweight & Obese
10-to 17- year-olds (95% CIs)1 Mississippi 44.4% (+/- 4.3)2 Arkansas 37.5% (+/- 4.2)3 Georgia 37.3% (+/- 5.6)4 Kentucky 37.1% (+/- 4.1)5 Tennessee 36.5% (+/- 4.3)6 Alabama 36.1% (+/- 4.6)7 Louisiana 35.9% (+/- 4.6)8 West Virginia 35.5% (+/- 3.9)9 D.C. 35.4% (+/- 4.8)10 Illinois 34.9% (+/- 4.1)

5
A Closer Look Opportunity to customize slide here with Local State or County Data

6
The 2007 national Youth Risk Behavior Survey(High School Students) 13% Obese Unhealthy Dietary Behaviors
79% ate fruits and vegetables less than five times per day during the 7 days before the survey.
34% drank a can, bottle, or glass of soda or pop (not including diet soda or diet pop) at least one time per day during the 7 days before the survey.
Dietary Patterns
7
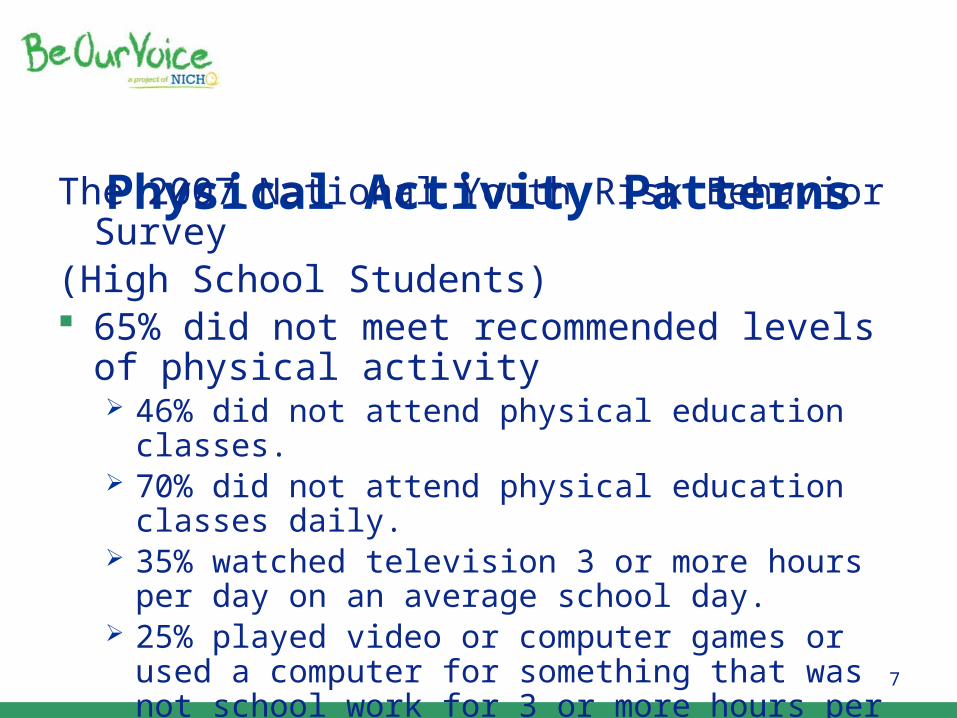
Physical Activity PatternsThe 2007 National Youth Risk Behavior Survey(High School Students) 65% did not meet recommended levels of physical
activity 46% did not attend physical education classes. 70% did not attend physical education classes daily. 35% watched television 3 or more hours per day on an
average school day. 25% played video or computer games or used a computer
for something that was not school work for 3 or more hours per day on an average school day.

8
Health ConsequencesIn childhood, obese children are more at risk for: Type 2 diabetes; High blood pressure; Liver disease; Dyslipidemia including high cholesterol, high
triglycerides and low HDL cholesterol; Upper Airway Obstruction Sleep Apnea Syndrome;
and Hip and knee problems.

9
Health Consequences In addition to the devastating physical health consequences, overweight and obese children suffer social and emotional health consequences as well.
Obese children: have lower self-esteem; are more likely to be depressed; suffer from bullying and teasing; and have lower academic achievement.

10
Cost of Obesity An obese child’s healthcare costs are roughly three times more than the average child.
Childhood obesity is estimated to cost $14 billion annually in direct and indirect health expenses. Children in Medicaid account for $3 billion of those expenses
Annual obesity-related hospital costs for children and adolescents were $238 million in 2005, nearly doubling between 2003 and 2005.

11
Health Disparities Mexican-American and African-American children ages 6-11 are more likely to be overweight or obese than white children: 43% of Mexican-American children 37% of African-American children 32% of white children
Data on Native American children is limited, but one study of the Aberdeen Area youths age 5-17 found: 48% of Native American boys were obese or overweight 46% of Native American girls were obese or overweight

12
A Closer Look Opportunity to customize with data regarding marginalized populations in your target community or state

13
Environment Where Children Live Where a child lives and goes to school has a
significant impact on his health Today’s food and physical activity environment make
it hard to be healthy. For example: Lack of physical activity in schools (i.e. no PE or recess) Car-focused world – active transport (i.e. walking or biking)
is not easy Lack of available and affordable fresh fruits and veggies Massive marketing of unhealthy food and beverages Overabundance of energy dense nutrient poor foods
14
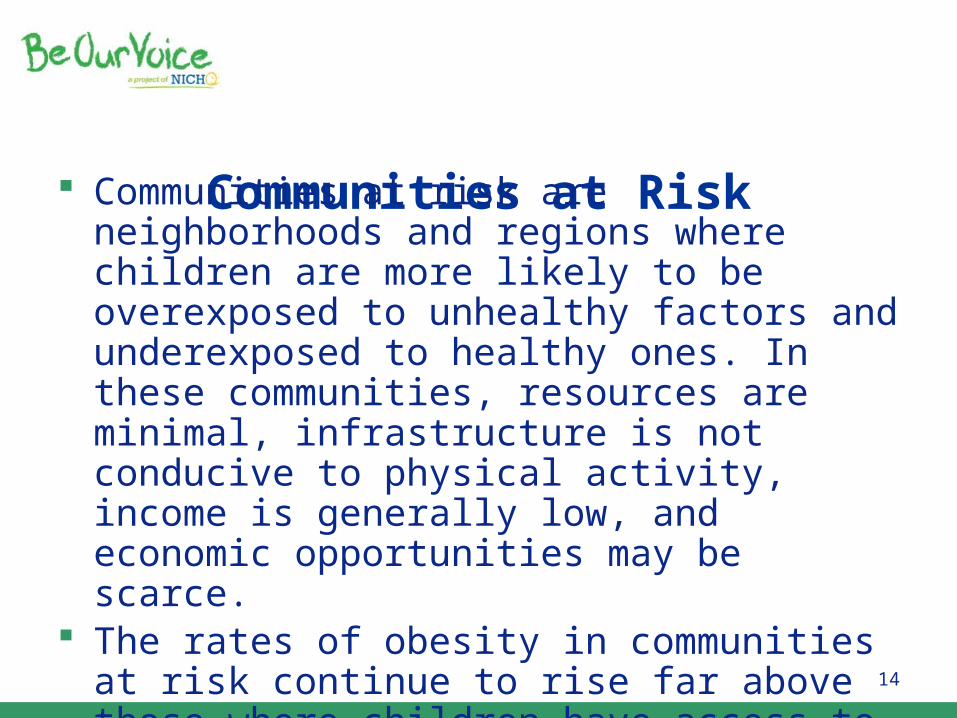
Communities at Risk Communities at risk are neighborhoods and regions where children are more likely to be overexposed to unhealthy factors and underexposed to healthy ones. In these communities, resources are minimal, infrastructure is not conducive to physical activity, income is generally low, and economic opportunities may be scarce.
The rates of obesity in communities at risk continue to rise far above those where children have access to healthy foods and places where they can engage in physical activity.

15
Making the Link: Practice and CommunityCase Study A 12 year-old girl
At her 12 year well check mother reports her daughter’s increasing comments about her weight and being “fat”.
BMI = 23, 90th percentile for a 12 year-old girl Identified as overweight

16
Community/Social/Demographic
Parenting Styles
Child Characteristics
Child’s WeightStatus
gender age
Dietary Intake
DecisionMaking family
genetics
SedentaryBehavior
PhysicalActivity
Schedule
ChildFeedingPractices
Peer/Sibling
InteractionsFoods
AvailableIn House
NutritionalKnowledge
ParentDietaryIntake Parent
FoodPreferences
ParentWeight Status
ParentEncouragement
of Activity
ParentActivityPatterns
Parent Monitoring
of TV
Family TVViewingSchool
Schedule
SchoolLunch
Program
Ethnicity
Work Hours
SchoolEnvironment
Availabilityof Recreational
Activities
Accessibility ofConvenience Foods
& Restaurants
FamilyLeisureTime
CornerStore
SchoolPhysical
EducationPrograms
Crime RatesGeneral
Safety
SocioeconomicStatus
Activities At Home

17
12 Year-Old GirlDietary Patterns – Behavioral Perspective
Skips breakfast (no time) Eats pretzel and juice for lunch (not hungry for a
regular lunch) After school – soda and snack food (poor choices) Dinner – Family eats out 3x/week (too busy to cook) Bedtime – Cereal (eating while watching TV)

18
Community/Social/Demographic
Parenting Styles
Child Characteristics
Child’s WeightStatus
gender age
Dietary Intake
DecisionMaking family
genetics
SedentaryBehavior
PhysicalActivity
Schedule
ChildFeedingPractices
Peer/Sibling
InteractionsFoods
AvailableIn House
NutritionalKnowledge
ParentDietaryIntake Parent
FoodPreferences
ParentWeight Status
ParentEncouragement
of Activity
ParentActivityPatterns
Parent Monitoring
of TV
Family TVViewingSchool
Schedule
SchoolLunch
Program
Ethnicity
Work Hours
SchoolEnvironment
Availabilityof Recreational
Activities
Accessibility ofConvenience Foods
& Restaurants
FamilyLeisureTime
CornerStore
SchoolPhysical
EducationPrograms
Crime RatesGeneral
Safety
SocioeconomicStatus
Activities At Home

19
12 Year-Old GirlDietary Patterns – Environmental Perspective
Skips breakfast (school start time/availability of school breakfast)
Eats pretzel and juice for lunch (school lunch) After school – soda and snack food (corner store) Dinner – Family eats out 3x/week (fast food
availability) Bedtime – Cereal (TV in bedroom)

20
Community/Social/Demographic
Parenting Styles
Child Characteristics
Child’s WeightStatus
gender age
Dietary Intake
DecisionMaking family
genetics
SedentaryBehavior
PhysicalActivity
Schedule
ChildFeedingPractices
Peer/Sibling
InteractionsFoods
AvailableIn House
NutritionalKnowledge
ParentDietaryIntake Parent
FoodPreferences
ParentWeight Status
ParentEncouragement
of Activity
ParentActivityPatterns
Parent Monitoring
of TV
Family TVViewingSchool
Schedule
SchoolLunch
Program
Ethnicity
Work Hours
SchoolEnvironment
Availabilityof Recreational
Activities
Accessibility ofConvenience Foods
& Restaurants
FamilyLeisureTime
CornerStore
SchoolPhysical
EducationPrograms
Crime RatesGeneral
Safety
SocioeconomicStatus
Activities At Home

21
12 Year-Old Girl Physical Activity Patterns - Behavioral Perspective
No outdoor time (doesn’t want to go outside) Computer, IM etc 3 hours/day (nothing else to do) Homework 2 hours/day (prefers not to do homework
at study period) Weekends “TV all the time” (doesn’t know what to
do if not watching TV) Extracurricular activity - Cheerleading 2x/week

22
Community/Social/Demographic
Parenting Styles
Child Characteristics
Child’s WeightStatus
gender age
Dietary Intake
DecisionMaking family
genetics
SedentaryBehavior
PhysicalActivity
Schedule
ChildFeedingPractices
Peer/Sibling
InteractionsFoods
AvailableIn House
NutritionalKnowledge
ParentDietaryIntake Parent
FoodPreferences
ParentWeight Status
ParentEncouragement
of Activity
ParentActivityPatterns
Parent Monitoring
of TV
Family TVViewingSchool
Schedule
SchoolLunch
Program
Ethnicity
Work Hours
SchoolEnvironment
Availabilityof Recreational
Activities
Accessibility ofConvenience Foods
& Restaurants
FamilyLeisureTime
CornerStore
SchoolPhysical
EducationPrograms
Crime RatesGeneral
Safety
SocioeconomicStatus
Activities At Home

23
12 Year-Old Girl Physical Activity Patterns - Environmental Perspective
No gym this session (school schedule) No recess (school schedule) No outdoor time (neighborhood safety) Computer, IM etc 3 hours/day (family entertainment
environment) Homework 2 hours/day (family scheduling) Weekends “TV all the time” (family activity) Extracurricular activity Cheerleading 2x/week

24
Community/Social/Demographic
Parenting Styles
Child Characteristics
Child’s WeightStatus
gender age
Dietary Intake
DecisionMaking family
genetics
SedentaryBehavior
PhysicalActivity
Schedule
ChildFeedingPractices
Peer/Sibling
InteractionsFoods
AvailableIn House
NutritionalKnowledge
ParentDietaryIntake Parent
FoodPreferences
ParentWeight Status
ParentEncouragement
of Activity
ParentActivityPatterns
Parent Monitoring
of TV
Family TVViewingSchool
Schedule
SchoolLunch
Program
Ethnicity
Work Hours
SchoolEnvironment
Availabilityof Recreational
Activities
Accessibility ofConvenience Foods
& Restaurants
FamilyLeisureTime
CornerStore
SchoolPhysical
EducationPrograms
Crime RatesGeneral
Safety
SocioeconomicStatus
Activities At Home

25
Obesity in the Context of This 12 Year-Old’s Environment Interaction of environment and behavior is critical
Making healthy decisions only works when there are safe and affordable healthy options readily available in the environment
The next slide highlights all the factors that influence this 12 year-old’s food and physical activity environments

26
Community/Social/Demographic
Parenting Styles
Child Characteristics
Child’s WeightStatus
gender age
Dietary Intake
DecisionMaking family
genetics
SedentaryBehavior
PhysicalActivity
Schedule
ChildFeedingPractices
Peer/Sibling
InteractionsFoods
AvailableIn House
NutritionalKnowledge
ParentDietaryIntake Parent
FoodPreferences
ParentWeight Status
ParentEncouragement
of Activity
ParentActivityPatterns
Parent Monitoring
of TV
Family TVViewingSchool
Schedule
SchoolLunch
Program
Ethnicity
Work Hours
SchoolEnvironment
Availabilityof Recreational
Activities
Accessibility ofConvenience Foods
& Restaurants
FamilyLeisureTime
CornerStore
SchoolPhysical
EducationPrograms
Crime RatesGeneral
Safety
SocioeconomicStatus
Activities At Home

27
Exercise:Obesity and Your Environment Take a minute to complete the Healthy Lifestyles and
Your Environment Exercise

28
Take Action You can help your patients/clients and improve your clinical care by becoming an advocate and being part of a movement to create healthy environments that foster healthy active living for all children.
Children need you to be their advocates because environmental change does not occur without advocacy and children don’t have a voice in their childcare/school operations, community, and public policy.
You can provide the voice and the expertise to make positive changes in the environment.

29
Policy Opportunities:Where You Can Take Action A variety of policy strategies exist to support healthier
communities Centers for Disease Control & Prevention, Institute of
Medicine, Robert Wood Johnson Foundation and AAP have identified some specific strategies that fall into the following categories: Improving access to healthy foods and beverages Limit access to unhealthy foods and beverages Improve opportunities for safe and affordable physical activity Increase active transportation through community design Improve school and childcare environments Support breastfeeding

30
Policy Opportunities Tool To further distill the various policy strategies, the AAP created a tool that looks at the different opportunities in terms of: existing clinical anticipatory guidance and messaging (5, 2, 1,
0,breastfeeding and BMI), and the various sectors where changes can occur (practice, community,
school, state, and federal) The tool also highlights which strategies are recommended by
AAP, CDC, IOM, RWJF, and/or the National Governors Association
www.aap.org/obesity/policymatrix An additional tool is the RWJF Key Local Strategies to Address
Childhood Obesity www.reversechildhoodobesity.org/webfm_send/121
31
Policy Tool Exercise Opportunity to pick a high-risk behavior and figure
out a strategy to address this behavior in schools

32
Conclusion Now you have an understanding of: Magnitude and trends of obesity; The children at highest risk; Why children need advocates for obesity prevention; and What policy opportunities exist.
In the next section of this training, you will learn the “how” of advocacy.