
1-s2.0-S1462901113001202-main
10
Exploring climate change uncertainties to support adaptive management of changing flood-risk Judy Lawrence a, *, Andy Reisinger b,1 , Brett Mullan c , Bethanna Jackson d a New Zealand Climate Change Research Institute and School of Government, Victoria University of Wellington, PO Box 600, Wellington 6140, New Zealand b New Zealand Climate Change Research Institute, Victoria University of Wellington, PO Box 600, Wellington 6140, New Zealand c National Institute of Water and Atmosphere, Private Bag 14901, Wellington, New Zealand d School of Geography, Environment and Earth Sciences, Victoria University of Wellington, PO Box 600, Wellington 6140, New Zealand 1. Introduction An increase in the intensity and frequency of extreme precipitation events is projected over most land areas as a consequence of global warming (IPCC, 2007b; Trenberth, 2006, 2011). Exposure of human settlements and long-lived, strate- gic assets such as transport and utility networks to flood risk is increasing due to climatic changes such as sea level rise and extreme precipitation as well as development intensification, e n v i r o n m e n t a l s c i e n c e & p o l i c y 3 3 ( 2 0 1 3 ) 1 3 3 – 1 4 2 a r t i c l e i n f o Keywords: Uncertainty Climate change Flood risk Adaptation a b s t r a c t Increasing intensity and frequency of extreme precipitation events projected as a conse- quence of global warming pose significant challenges for decision-making. Climate change creates a dynamic risk, but flood risk management decision-making based on single ‘best estimate’ scenarios is entrenched within decision-making frameworks and professional operating practices. This conceals uncertainties and focuses attention on enhancements to existing ‘protection’ structures, giving a false sense of security to those living within presumed ‘safe’ areas. A more nuanced, risk-based approach to flood frequency changes is needed to reflect climate change uncertainties, but this is constrained by the high cost and complexity of modelling. We present a quick and relatively low-cost methodology to explore the implications of alternative climate change scenarios for flood frequency, and apply it for illustrative purposes, to the Hutt River located in New Zealand’s lower North Island. Annual exceedance probabilities increase under all scenarios but with considerable differences between alternative emissions scenarios and climate models. We evaluated the salience of this information for planning responses with flood management and planning practi- tioners. We found that ‘mind-sets’ changed to consider a greater range of response options according to their lock-in potential in existing and Greenfield urban settlements. Tools to rapidly explore alternative futures can therefore support evaluation of a wider range of response options at the exploratory stages of decision-making, which helps avoid planning responses that are predicated on historical experience and a single ‘best estimate’ scenario. This encourages responses that better reflect the changing nature of the risk. # 2013 Elsevier Ltd. All rights reserved. * Corresponding author. Tel.: +64 4 5685118; mobile: +64 4 021 499011. E-mail addresses: [email protected], [email protected] (J. Lawrence), [email protected] (A. Reisinger), [email protected] (B. Mullan), [email protected] (B. Jackson). 1 Present address: New Zealand Agriculture Greenhouse Gas Research Centre, PO Box 5290, Wellington 6145, New Zealand. Available online at www.sciencedirect.com journal homepage: www.elsevier.com/locate/envsci 1462-9011/$ – see front matter # 2013 Elsevier Ltd. All rights reserved. http://dx.doi.org/10.1016/j.envsci.2013.05.008
-
Upload
raluca-iustina -
Category
Documents
-
view
213 -
download
1
description
Climate change
Transcript of 1-s2.0-S1462901113001202-main

Exploring climate change uncertainties to supportadaptive management of changing flood-risk
Judy Lawrence a,*, Andy Reisinger b,1, Brett Mullan c, Bethanna Jackson d
aNew Zealand Climate Change Research Institute and School of Government, Victoria University of Wellington, PO
Box 600, Wellington 6140, New ZealandbNew Zealand Climate Change Research Institute, Victoria University of Wellington, PO Box 600, Wellington 6140,
New ZealandcNational Institute of Water and Atmosphere, Private Bag 14901, Wellington, New ZealanddSchool of Geography, Environment and Earth Sciences, Victoria University of Wellington, PO Box 600, Wellington
6140, New Zealand
e n v i r o n m e n t a l s c i e n c e & p o l i c y 3 3 ( 2 0 1 3 ) 1 3 3 – 1 4 2
a r t i c l e i n f o
Keywords:
Uncertainty
Climate change
Flood risk
Adaptation
a b s t r a c t
Increasing intensity and frequency of extreme precipitation events projected as a conse-
quence of global warming pose significant challenges for decision-making. Climate change
creates a dynamic risk, but flood risk management decision-making based on single ‘best
estimate’ scenarios is entrenched within decision-making frameworks and professional
operating practices. This conceals uncertainties and focuses attention on enhancements to
existing ‘protection’ structures, giving a false sense of security to those living within
presumed ‘safe’ areas. A more nuanced, risk-based approach to flood frequency changes
is needed to reflect climate change uncertainties, but this is constrained by the high cost and
complexity of modelling. We present a quick and relatively low-cost methodology to explore
the implications of alternative climate change scenarios for flood frequency, and apply it for
illustrative purposes, to the Hutt River located in New Zealand’s lower North Island. Annual
exceedance probabilities increase under all scenarios but with considerable differences
between alternative emissions scenarios and climate models. We evaluated the salience of
this information for planning responses with flood management and planning practi-
tioners. We found that ‘mind-sets’ changed to consider a greater range of response options
according to their lock-in potential in existing and Greenfield urban settlements. Tools to
rapidly explore alternative futures can therefore support evaluation of a wider range of
response options at the exploratory stages of decision-making, which helps avoid planning
responses that are predicated on historical experience and a single ‘best estimate’ scenario.
This encourages responses that better reflect the changing nature of the risk.
# 2013 Elsevier Ltd. All rights reserved.
Available online at www.sciencedirect.com
journal homepage: www.elsevier.com/locate/envsci
1. Introduction
An increase in the intensity and frequency of extreme
precipitation events is projected over most land areas as a
* Corresponding author. Tel.: +64 4 5685118; mobile: +64 4 021 499011.E-mail addresses: [email protected], judy.lawrence@parad
(A. Reisinger), [email protected] (B. Mullan), bethanna.jackson1 Present address: New Zealand Agriculture Greenhouse Gas Resear
1462-9011/$ – see front matter # 2013 Elsevier Ltd. All rights reservedhttp://dx.doi.org/10.1016/j.envsci.2013.05.008
consequence of global warming (IPCC, 2007b; Trenberth, 2006,
2011). Exposure of human settlements and long-lived, strate-
gic assets such as transport and utility networks to flood risk is
increasing due to climatic changes such as sea level rise and
extreme precipitation as well as development intensification,
ise.net.nz (J. Lawrence), [email protected]@vuw.ac.nz (B. Jackson).
ch Centre, PO Box 5290, Wellington 6145, New Zealand..

e n v i r o n m e n t a l s c i e n c e & p o l i c y 3 3 ( 2 0 1 3 ) 1 3 3 – 1 4 2134
population increases and economic growth. Lloyds (2008) and
the World Bank (2010) identified inadequate preparedness for
climate-related risks and ongoing development in hazard
prone areas as factors increasing costs several-fold as a result
of extreme weather events.
Climate change creates a dynamic risk, with changes in
flood frequency both uncertain and changing over time,
requiring consideration of a range of response options and
‘what if’ scenarios (IPCC, 2007a; Yohe, 2009). However, flood
risk management decision-making tends to be based on static
single numbers (Milly et al., 2008) entrenched within deci-
sion-making frameworks (Merz et al., 2010) and professional
operating practice. A review of scenario use in water policy in
the Netherlands (Haasnoot and Middelkoop, 2012) concluded
that while policy studies over the past 15 years have used
several scenarios, the guidelines for adaptation flowing from
these studies recommend the use of only one scenario as a
‘best estimate’ for design of policy, with few considering
worst-case scenarios or structural uncertainties in underly-
ing models. The legal, engineering and planning practice
within current decision frameworks further encourage
certainty and have difficulty dealing with a range of possible
outcomes. The use of single flood standards (e.g. 1:100 year
event) for the design of flood levees and stormwater systems,
or demarcation of fixed hazard lines spatially to control land
uses, result in path-dependent decisions that are inflexible
for changing flood risk. Siloed professional groups operating
within organisations (Kennedy et al., 2010; van den Berg and
Coenen, 2012) further reduces consideration of complemen-
tary risk management options to address and provide
flexibility.
Methods for designing flexible response strategies have
been suggested, such as real options analysis (Dobes, 2008;
Ranger et al., 2010), robust decision-making (Lempert and
Collins, 2007), new methods based on trigger points (Haasnoot
et al., 2011; Kwadijk et al., 2010) and adaptive pathways
(Walker et al., 2013) which provide insights into how
uncertainty can be managed when assessing response
options. However, the ability to fully explore the implications
of climate change uncertainty across a range of emissions
scenarios and climate models is highly constrained by the cost
of available expertise at local levels where responsibility for
flood risk management has been devolved. Some examples of
simpler approaches that consider a range of possible climate
futures are emerging, but their application has been limited to
major infrastructure projects, rather than to spatial planning
(Haasnoot et al., 2012; Katsman et al., 2011; Reeder and Ranger,
2010).
Here we present a methodology to quickly and at
relatively low cost explore the implications of alternative
climate change scenarios (emissions scenarios and out-
comes for alternative global climate models) for flood
frequency, and apply it for illustrative purposes to the Hutt
River located in New Zealand’s lower North Island. We
evaluated the salience of this information for planning
responses. Workshops and interviews with practitioners
were used to examine whether providing a fuller assessment
of uncertain futures can help shift the ‘mind-set’ from
single-number best estimates towards a more dynamic
treatment of risk and thus help to reduce the risk of lock-in
to legacy decision-approaches and encourage more flexible
thinking about response options.
Our study focused on the exploration of climate-related
impacts on precipitation and hydrology. Quantifying all
salient sources of uncertainty was beyond the scope of our
case study, notably the uncertainty in current flood risk based
on limited historical data, scenarios of land-use change, and
sea level rise contributing to flood risk near the river mouth.
Including those factors would likely have further strengthened
our results about the importance of uncertainty for the design
of risk management approaches.
Section 2 sets out the simplified methodology for estimat-
ing changes in flood frequency under a range of emissions
scenarios and for different global climate models. Section 3
discusses the decision challenges that flood risk managers
face in the context of climate change, and Section 4 shows how
our approach can practically influence how practitioners
conceptualise their task of managing a dynamic flood risk.
Section 5 suggests further research that could enhance our
approach.
2. Simplified methodology for estimatingchanges in flood frequencies
A key constraint on exploring future changes in flood risk and
their uncertainty under climate change is that global climate
models, especially where they need to be downscaled to reflect
highly orographic rainfall regimes, do not capture local
changes in the frequency and intensity of high intensity
rainfall events. Such information can be gained from nested
models or simplified scaling of historical time series (e.g. based
on the Clausius–Clapeyron equation), but the former are not
amenable to a systematic exploration of inter-model uncer-
tainties, while the latter can be too simplistic to support
formal planning.
A simplified, yet physically realistic and location-specific
methodology for estimating changes in flood frequencies,
was therefore developed (Ministry for the Environment,
2010) and applied in the study area. The Hutt River flows
54 km within a catchment area of 655 km2 comprising
native and exotic forests in the upper catchment and a
largely urbanised floodplain with around 130,000 people.
The flood protection scheme to protect this urban area is
one of the largest in New Zealand (Wellington Regional
Council, 2001).
The approach used to assess the potential changes in flood
frequency through to the 2090s comprised three steps:
1. Statistically downscaled 12 Atmosphere-Ocean Global
Circulation models (AOGCMs) and four emissions scenarios
to produce 48 alternative climates (changes in monthly
average rainfall and temperature) over the 21st century for
the Hutt River catchment.
2. Used a simple algorithm to estimate changes in extreme
rainfall for the catchment.
3. Ran hourly rainfall data (both historical and adjusted for
future climate changes in both means and extremes)
through a hydrological model to derive flood frequencies
under historical and 48 alternative future climates.

Fig. 1 – Percentage change in rainfall amount as a function
of the percentile in the distribution of daily rainfall. Note:
the grey line shows results from a regional climate model,
which exhibits an average regional warming of 2.58. The
black line shows the changes for the idealised rainfall
distributional adjustment model (see text for details). The
horizontal coordinate is the negative of the natural
logarithm of (100 S P), where P is the percentile in the
distribution of daily rainfall amounts.
e n v i r o n m e n t a l s c i e n c e & p o l i c y 3 3 ( 2 0 1 3 ) 1 3 3 – 1 4 2 135
2.1. Changes in monthly mean climate variables
New Zealand’s highly variable topography means that results
from AOGCMs cannot be applied directly. They need to be
downscaled to give meaningful information about changes in
monthly mean climate variables (Mullan et al., 2001). Dynamical
downscaling using high resolution regional models is compu-
tationally expensive and tends to be limited to only a few global
climate patterns. This means that reliance on dynamical
downscaling can strongly under-sample the true uncertainty
in future changes, particularly for rainfall. We therefore used a
statistical downscaling scheme and applied it to data from 12
different AOGCMs (Mullan et al., 2001). We used three emissions
scenarios from the Special Report of Emissions Scenarios (SRES)
A2, A1B and B1, plus inferred changes for a fourth emissions
scenario where global average temperature increase is limited
to 2 8C above pre-industrial levels by 2090 (for the average of all
models). Details of this procedure and resulting changes in
monthly mean temperature and rainfall across the range of
AOGCMs and emissions scenarios across New Zealand can be
found elsewhere (Reisinger et al., 2010).
2.2. Deriving changes to daily rainfall distributions
Changes in flood risk result mostly from changes in daily and
sub-daily rainfall and are not captured by statistically
downscaled AOGCMs. We therefore perturbed the historical
time series of daily rainfall in a two-step process, described in
detail in Ministry for the Environment (2010). The first
adjustment applied the monthly precipitation offsets from
the statistically downscaled climate changes (see Section 2.1)
to the historical time series, pro-rated across all wet-days to
preserve inter-annual variance of monthly rainfall. The
second step adjusted the rainfall quantiles to increase
extreme daily rainfall in the upper tail of the distribution,
decrease moderate rainfall totals and increase the number of
dry days. This conserves the total monthly mean rainfall
changes based on statistical downscaling.
The detailed equation used to alter the percentile distribu-
tion was, consistent with results from a regional climate
model (Ministry for the Environment, 2010):
Change in daily rainfall ðin% per �CÞ
¼ min 8:0; 6:15 � 1 � logð100 � PÞ2:3
� �� �(1)
The formula gives a zero change in daily rainfall at
percentile 90 (relative to the output from step one), a +8%
increase per degree Celsius at percentile 99.5, and about �6%
decrease per degree Celsius at percentile zero. For percentiles
greater than 99.5, the change is capped at +8% per degree
Celsius, consistent with the Clausius–Clapeyron equation.
Recent evidence suggests that extreme rainfall may increase
even more than implied by the Clausius–Clapeyron equation
(Allan and Soden, 2008), but we consider the evidence to be
insufficient at this stage to justify greater change in such a
simplified and general formula. Fig. 1 graphically illustrates
the results of this quantile scaling approach and compares it
with the detailed results from a regional climate model run for
the Hutt River catchment area.
This method essentially repeats recorded past weather
data, perturbed to mimic the implications of a warmer climate
with altered mean and extreme rainfall and temperature
patterns. The algorithm is simpler than some other quantile
scaling schemes (Benestad, 2010) but more nuanced than
scaling heavy rainfall by temperature only (Ministry for the
Environment, 2008). Applying it to multiple global climate
models and emission scenarios allows rapid exploration of the
implication of alternative emissions scenarios and global
climate models on extreme rainfall than is usually possible
with a single regional climate model. Note that the hourly
rainfalls needed by the hydrological model are simply pro-
rated from the changed daily total, an assumption which can
have important consequences for flood risk and which is an
area of active research (Hardwick Jones et al., 2010).
One note of caution is that the algorithm has been derived
from a single Regional Climate Model nested in a single
AOGCM, but we then apply this relationship to scale rainfall
quantiles more generally, based on monthly mean changes in
temperature and rainfall derived from a range of AOGCMs. The
assumption that the algorithm can be used also for AOGCMs
remains exploratory. A recent study (Benestad et al., 2012)
demonstrated a robust prediction of wet-day percentiles from
mean precipitation, although in this case there was no explicit
link to projected temperature increases. Calibrating our
approach to other AOGCMs and nested RCMs would thus be
useful to confirm its utility for planning purposes.
2.3. Hydrological modelling of altered flood frequenciesand intensities
The hydrological model TopNet (Bandaragoda et al., 2004;
Clark et al., 2008), a distributed and modified implementation
of the TOPMODEL approach (Beven, 1997), was calibrated to
the Hutt River catchment (Ibbitt and Woods, NIWA, pers.
comm.). TopNet simulates river flows based on hourly rainfall
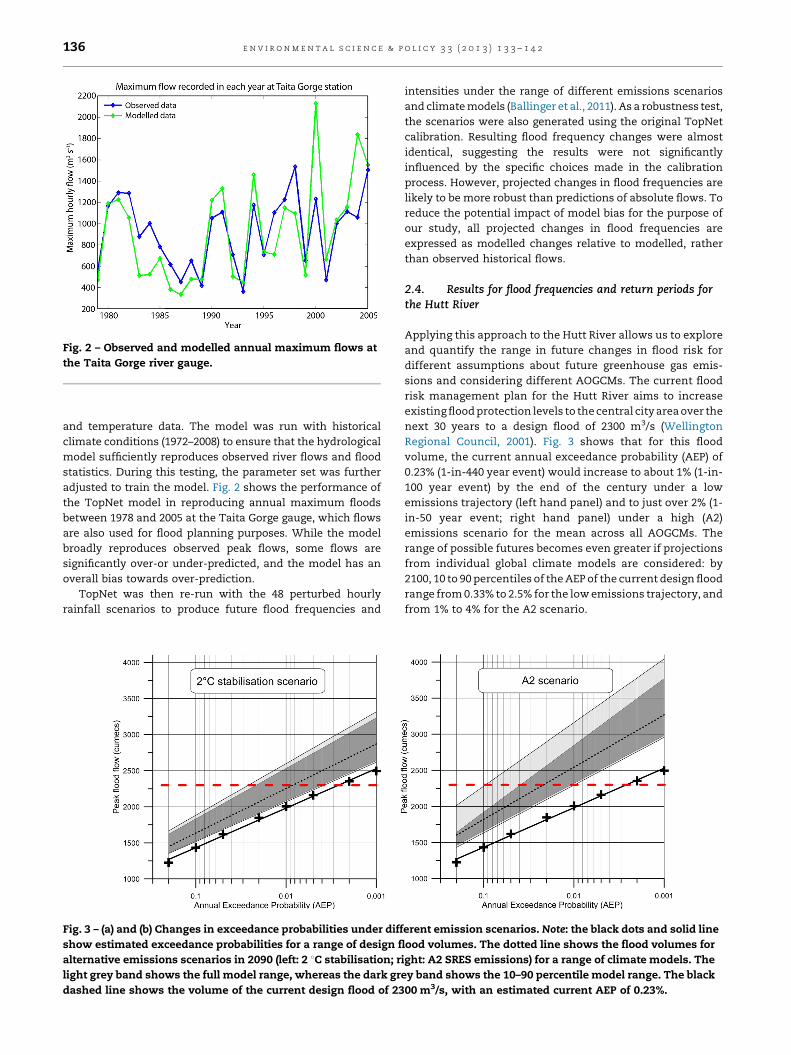
Fig. 2 – Observed and modelled annual maximum flows at
the Taita Gorge river gauge.
e n v i r o n m e n t a l s c i e n c e & p o l i c y 3 3 ( 2 0 1 3 ) 1 3 3 – 1 4 2136
and temperature data. The model was run with historical
climate conditions (1972–2008) to ensure that the hydrological
model sufficiently reproduces observed river flows and flood
statistics. During this testing, the parameter set was further
adjusted to train the model. Fig. 2 shows the performance of
the TopNet model in reproducing annual maximum floods
between 1978 and 2005 at the Taita Gorge gauge, which flows
are also used for flood planning purposes. While the model
broadly reproduces observed peak flows, some flows are
significantly over-or under-predicted, and the model has an
overall bias towards over-prediction.
TopNet was then re-run with the 48 perturbed hourly
rainfall scenarios to produce future flood frequencies and
Fig. 3 – (a) and (b) Changes in exceedance probabilities under diff
show estimated exceedance probabilities for a range of design f
alternative emissions scenarios in 2090 (left: 2 8C stabilisation; r
light grey band shows the full model range, whereas the dark gr
dashed line shows the volume of the current design flood of 23
intensities under the range of different emissions scenarios
and climate models (Ballinger et al., 2011). As a robustness test,
the scenarios were also generated using the original TopNet
calibration. Resulting flood frequency changes were almost
identical, suggesting the results were not significantly
influenced by the specific choices made in the calibration
process. However, projected changes in flood frequencies are
likely to be more robust than predictions of absolute flows. To
reduce the potential impact of model bias for the purpose of
our study, all projected changes in flood frequencies are
expressed as modelled changes relative to modelled, rather
than observed historical flows.
2.4. Results for flood frequencies and return periods forthe Hutt River
Applying this approach to the Hutt River allows us to explore
and quantify the range in future changes in flood risk for
different assumptions about future greenhouse gas emis-
sions and considering different AOGCMs. The current flood
risk management plan for the Hutt River aims to increase
existing flood protection levels to the central city area over the
next 30 years to a design flood of 2300 m3/s (Wellington
Regional Council, 2001). Fig. 3 shows that for this flood
volume, the current annual exceedance probability (AEP) of
0.23% (1-in-440 year event) would increase to about 1% (1-in-
100 year event) by the end of the century under a low
emissions trajectory (left hand panel) and to just over 2% (1-
in-50 year event; right hand panel) under a high (A2)
emissions scenario for the mean across all AOGCMs. The
range of possible futures becomes even greater if projections
from individual global climate models are considered: by
2100, 10 to 90 percentiles of the AEP of the current design flood
range from 0.33% to 2.5% for the low emissions trajectory, and
from 1% to 4% for the A2 scenario.
erent emission scenarios. Note: the black dots and solid line
lood volumes. The dotted line shows the flood volumes for
ight: A2 SRES emissions) for a range of climate models. The
ey band shows the 10–90 percentile model range. The black
00 m3/s, with an estimated current AEP of 0.23%.

e n v i r o n m e n t a l s c i e n c e & p o l i c y 3 3 ( 2 0 1 3 ) 1 3 3 – 1 4 2 137
Our results are broadly consistent with an earlier study of
climate-induced changes in flood risk for the Hutt River, which
indicated that the current 1-in-100 year event could become as
frequent as a 1-in-33 year event (Leong et al., 1992). That study
assumed an increase in heavy precipitation by up to 15%, but
did not model precipitation changes explicitly, nor quantify
uncertainties related to emissions or climate models. The
result was also broadly consistent with a general ‘rule of
thumb’ promoted in New Zealand, that climate change could
result in an up to fourfold increase in flooding by the 2070s, but
that the change could also be much less than that (Pearson and
McKerchar, 1999). Our analysis represents a key advance on
those earlier studies in that it quantifies uncertainties in the
projected changes depending on emissions and climate
models. This supports a more risk-based assessment of
impacts and response options and avoids a premature
collapse of a range of futures into single estimates, or reliance
on simple scaling of current flood volumes that may not
account for non-linearities and thresholds in catchment
hydrology.
These uncertainties in future flood frequency changes have
profound implications for planning responses which are
explored in Sections 3 and 4. We note though that, given
the relatively short historical records of floods in New Zealand,
there is a significant underlying uncertainty in estimating
even current flood risk (taken as known for this analysis).
Future changes in up-stream land-use, stream management
and sea level rise at the river mouth could also significantly
alter flood characteristics, thus implying a large but un-
quantified uncertainty on future flood frequencies. Rather
than quantify all those changes, we used climate-related
uncertainties as an entry point for a more generic evaluation
of the management implications of uncertainty in future flood
frequencies, and the extent to which highlighting and
quantifying these uncertainties can help shift planning
perspectives. Including additional uncertainties explicitly in
inundation maps would expand uncertainties further and
thus likely strengthen our conclusions from the following
sections.
3. The decision-making challenges
Flood risk management and consideration of the effects of
climate change is devolved to local government in New
Zealand. These functions operate within a common institu-
tional framework across New Zealand mandated through the
Resource Management Act 1991, the Local Government Act
2002, the Soil Conservation and Rivers Control Act 1941, Civil
Defence and Emergency Management Act 2002 and the
Building Act 2004. There is a multi-layered governance
structure at three levels—national, regional and district—
with the national level providing guidance to the two other
levels for estimating the effects of climate change on flood
flows (Ministry for the Environment, 2010) and standards for
risk management (Standards Australia and Standards New
Zealand, 2009).
Local government also has the responsibility to make
decisions about infrastructure and spatial planning of land
uses which last decades and often more than 100 years.
Practice research in New Zealand and Australia (Carlman,
2005; McDonald, 2011) shows that statutory processes and
assessment methods have not demonstrated their flexibility
for addressing changing risks over long timeframes. Over the
last 50 years there has been rapid build-up of urban
settlements and assets in low lying floodplains and exposed
coastal areas (Freeman and Cheyne, 2008), thus increasing the
risks of damage from extreme climate events.
3.1. Uncertainty compounded by legacy issues
Downscaled scenarios based on a single emission scenario or
climate model can be misleading (Wilby et al., 2004). The
likelihood that the future will turn out like the single number
or ‘best estimate’ scenario will be small. Where non-linear
rates of change are ignored, decisions are exposed to more
extreme outcomes (Jones and Preston, 2011; Reisinger et al.,
2011). This can give decision-makers the impression that they
can just continue to adjust existing responses, like adding
height to a levee or raise floor levels of dwellings to protect
existing land-uses.
However, decision-makers need to defend their decisions
against the opportunity cost that is created by withholding
infill and new development in flood risk areas. For existing
land uses they are faced with a legacy of past decisions that
assume stationarity. This has raised community expectations
of ongoing protection from flooding (Lawrence and Quade,
2011). The cognitive effect of experience from the past further
anchors people’s perceptions (Schoemaker, 1993) and has the
effect of closing off other than the familiar structural
protection options. Once development has occurred behind
levees, there is usually the demand to maintain and increase
protection over time (Burby and French, 1981; Gordon and
Little, 2009; Lyle, 2001; Reisinger et al., in press; Stevens et al.,
2010; Sutton and Tobin, 2011; Tobin, 1995). A dominant use of
hard structures and a cycle of ‘serial’ engineering has thus
resulted, rather than use of non-structural measures like land
use planning. In New Zealand existing uses can be changed
under the Resource Management Act (Berry and Vella, 2011).
Hazard zones with progressive risk-based controls on land
uses, have been designed in a few areas, but took more than 10
years to implement (Hawkes Bay Regional Council, 2012;
Tasman District Council, 2011). Strong pressures continue on
local decision-makers to maintain dominant practice, even for
Greenfield developments.
The mutual interdependency of social and technological
systems create a development path-dependency that con-
strains policy options for the future (Arthur, 1989; Barnett and
O’Neill, 2010; David, 1985; Unruh, 2000; Unruh and Carrillo-
Hermosilla, 2006). This masks the role that a wider range of
response options might play for avoiding or mitigating the
increasing residual risk over time. It is therefore necessary
that risk assessments consider the spread of results across a
number of models and scenarios.
The pressure on decision-makers is thus twofold: (1) the
cost of generating scenarios to explore the full risk profile, and
(2) the political, regulatory and cognitive pressures to create
certainty for the present generation and be able to withstand
legal contest from those affected. Both these issues reinforce
the use of single numbers as ‘best estimates’. For example,

2 16 practitioners recruited from strategic planning, districtplanning, hazards management, emergency management, floodengineering, stormwater management and climate change func-tions.
e n v i r o n m e n t a l s c i e n c e & p o l i c y 3 3 ( 2 0 1 3 ) 1 3 3 – 1 4 2138
time constraints, resources, project objectives and pressure
from development interest, have led to some studies using
only a single climate model and/or single emissions scenario
to project future climate state(s) (Haasnoot and Middelkoop,
2012). In statutory decision-making processes uncertainty can
be construed to signal a fundamental lack of knowledge about
the future and lead to climate change effects being omitted or
their consideration delayed (Carlman, 2005), despite precau-
tionary mandates in governing legislation (McDonald, 2011).
Even though engineers use the concept of ‘residual risk’ to
communicate what is not protected by the design level
chosen, this has been largely ineffective outside those with
direct experience of flooding (Lawrence and Quade, 2011). Our
workshops and interviews showed that practitioners and
decision-makers routinely consider that residual risk is the
role of the emergency services, without much thought given to
their burden becoming greater as design levels are eroded by
more frequent flood events (Lawrence et al., 2011).
‘‘The 440 year design standard was chosen, because it was
considered ‘high enough’. . . the development behind the
stop banks [levees]was considered flood-free and emer-
gency services will pick up what is left’’ [engineer at a
workshop]
The partitioning of roles between responsible organisa-
tions (Næss et al., 2005), between the different levels of
government and siloed organisational structures (Gupta et al.,
2010), can further compound these effects and contribute to a
lack of integration between planning and disaster manage-
ment (Glavovic et al., 2010). This leads to the question of
whether the characterisation of flood risk across a range of
scenarios would help to communicate the dynamic nature of
the risk and the possibility of increasing residual risk, thus
overcoming some of the legacy barriers and address ‘what
else’ needs to be considered.
4. Application of the approach
In the Hutt valley, options other than structural protection
were constrained by the primary discussion on the design
level for protection structures (1:440 ARI), which was
perceived as high (Edwards et al., 2011). While the practical
implications, costs and benefits of other options were not
examined in depth (Wellington Regional Council, 2001), even
though a range of complementary planning measures were
canvassed in the preliminary report before the management
plan was developed (Wellington Regional Council, 1996). This
is now a standard practice in most country guidance for
addressing uncertainty including in New Zealand and the
United Kingdom (Defra, 2013b; Ministry for the Environment,
2010).
However, in the Hutt valley the reporting of other options
has had little influence on the ultimate decisions on how to
manage flood risk, except within the floodway and some small
unprotected areas. The implementation of complementary
non-structural responses has been limited, due to a perception
of ‘safety’ afforded by ‘protection’ in areas protected by levees.
Despite previous studies of the effect of climate change on
flood risk in the Hutt valley (Leong et al., 1992; Pearson and
McKerchar, 1999; Tait et al., 2002) climate change hardly
features as a factor in long-term planning. Intensification of
development close to and outside the levees has continued the
path-dependent legacy.
To test the claim that the use of a range of scenarios in
decision-making could materially alter the response options
considered, we conducted a workshop and in-depth semi-
structured interviews with a group of local government
practitioners2 from within the Wellington region (Lawrence
et al., 2011). Respondents consistently expressed surprise at
the effect of climate change on flood frequency as framed in
Fig. 3, acknowledging the effect it could have on their design
and planning assumptions within the life of the current flood
protection structures. This triggered discussion amongst
practitioners about how the risk of flooding (including residual
risks beyond the design flood) could be better communicated
and what other options could complement the structural
options currently used. Options put forth by participants
included upper catchment land use control; secondary flow
paths outside the levee to manage overtopping or levee
breach and retreat of properties in such areas; minimum floor
levels for buildings; egress plans for hospitals, residential
care facilities; implications for electricity utilities, port and
airport facilities, commercial development plans, storm-
water, waste water and water supply systems and the effect
of sea level rise on ground conditions (e.g. liquefaction from
rising groundwater). Practitioners also questioned the cur-
rent assumptions about population growth, how develop-
ment might occur in future and affect vulnerability to
flooding, and the reliance they were putting on flood
warnings and emergency management.
Practitioners identified landuses and assets with different
lifetimes and suggested that change could be staged to address
the changing risk—thus prompting consideration of adaptive
management. The limits of any one response option were
acknowledged and that at some point in time more transfor-
mational approaches would need to be anticipated. The value
of using non-statutory strategic planning and risk scanning
outside the constraints of statutory planning, emerged as a
framework within which our simplified methodology might be
used to help respond to changing climate risk.
The approach catalysed a shift in thinking from static
safety and path-dependency, to thinking about how to build
flexibility into decision-making, whatever the outcome might
be, at an acceptable cost to current and future generations.
Indications are that local government practitioners are now
considering a wider range of options to complement structural
protection as the Hutt flood scheme is being reviewed. This
will enable a risk dialogue with affected communities as a
result of reframing the risk across a range of possible
outcomes, based on the simplified methodology outlined in
Section 2 (G. Campbell, Greater Wellington Regional Council,
pers. comm.).

e n v i r o n m e n t a l s c i e n c e & p o l i c y 3 3 ( 2 0 1 3 ) 1 3 3 – 1 4 2 139
4.1. The value of a range of scenarios
These practitioner responses demonstrate that once a full
range of future flood frequencies is considered, the inability of
local government to absolutely protect communities becomes
clearer. This challenges the notion of ‘safe’ development areas
and encourages consideration of the increasing and indeed
unavoidable residual risk, thus triggering consideration of
more flexible and adaptive responses. Use of multiple
scenarios in which damaging floods become more frequent
reduce the tendency for decision-makers to ‘latch on’ to any
particular scenario. The benefits of a different set of options
that is more robust across several scenarios and their
evolution over time could thus become more apparent in
the decision-making process.
Modelling studies require time and expertise and cogni-
tively challenge decision-makers. Our simplified approach
reduces resource inputs and can therefore support an
evaluation of the implications of alternative futures at the
exploratory stages of decision-making, when options are still
wide open, avoid planning responses that optimise the
response to a single ‘best estimate’ scenario and encourage
responses that reflect the changing nature of the risk. A quick
high level understanding of the scope and scale of the problem
allows resources to be targeted at assessing the appropriate
balance between a range of response options, including
protection, accommodation, spatial planning, and potentially,
retreat using tools such as those developed in recent studies
(Haasnoot et al., 2012; Ranger et al., 2010; Roggema, 2009). Our
approach has particular salience for lower levels of govern-
ment with human and financial resource constraints.
5. Conclusion
Our study demonstrates that if flood risk managers are
presented with the range of possible futures with their
respective consequences, using our relatively quick and
low-cost but robust science-based estimation of future
changes in flood risk, the pitfalls of ‘picking’ a number or
‘best estimate’ can be reduced. The approach provides an
opportunity for exploring a number of response options for
wider community dialogue of preferences (Downton et al.,
2005) with a greater chance that risk will be reduced (Aerts
et al., 2008). Using our approach also allows consideration of
different land use activities and assets according to their
function and lifetime (Hallegatte, 2009; Stafford Smith et al.,
2011).
The workshop, interviews and subsequent discussions
with practitioners, showed that they could self-identify the
risks and traps inherent in designing flood risk management
plans around single number assumptions for future flood
frequencies. This has the potential to catalyse a move away
from the current practice which shoehorns misleading
‘certainty’ into investment and planning decisions, locking
in current development pathways dependent on structural
protection with its inherent inflexibility and limits under a
changing climate.
The method outlined and the shift in thinking it can
generate, is however only part of the challenge for flood risk
managers. The institutions and the organisational and
professional cultures were highlighted in the workshops
and interviews as being influential over the decision-making
practice and deeply entrenched, creating leadership chal-
lenges that are yet to be fully explored (Defra, 2013a; Dovers
and Hezri, 2010; Merz et al., 2010) in the climate adaptation
context. There are clear signs emerging from several councils
(in part as a result of the 2011 and 2012 Canterbury
earthquakes experience) that the legal liability for the
consequences of changing climate risk, at least in the New
Zealand context, may prove a catalyst for local decision-
makers to anticipate future changes. For this they need cost-
effective assessment tools. Our method is one approach that
could assist but clearly will not resolve all the challenges in
dealing with a dynamic and uncertain risk profile. A range of
tools to deal with such situations exists in the literature
(Dobes, 2008; Lempert and Collins, 2007; Ranger et al., 2010;
Yohe, 2009) but testing their implementation was outside the
scope of this study, which focused on quantifying and
demonstrating the range of uncertainty and its planning
implications as a first step.
Three enhancements of our approach could be explored
further. First, our approach could be tested for other GCMs and
nested RCMs, including in other locations, to assist the
potential for expanding this approach for planning purposes.
Second, further practical testing of the range of decision-
making tools for charting adaptive pathways to address
uncertainty through alternative futures, would expand the
practical utility of our approach. Third, the role of governance
and institutions that enable adaptive responses to be devel-
oped and implemented could be further examined, to ensure
that flood risk management does not result in a fall-back on
the past as the only certainty.
Acknowledgements
This research was part of the Community Vulnerability,
Resilience and Adaptation to Climate Change Programme
(VICX805) funded by the New Zealand Ministry of Science and
Innovation. We thank the practitioners for their insights, and
also two anonymous referees for their constructive feedback
which has improved the paper.
r e f e r e n c e s
Aerts, J.C.J.H., Botzen, W., Veen, A.v.d., Krywkow, J., Werners, S.,2008. Dealing with uncertainty in flood managementthrough diversification. Ecology and Society 13, 1045–1060.
Allan, R.P., Soden, B.J., 2008. Atmospheric warming and theamplification of precipitation extremes. Science 321,1481–1484.
Arthur, W.B., 1989. Competing technologies, increasing returns,and lock-in by historical events. Economic Journal 99,116–131.
Ballinger, J., Jackson, B., Stokes, K., Reisinger, A., 2011. ThePotential Effects of Climate Change on Flood Frequency inthe Hutt River School of Geography, the Environment, andEarth Sciences. Victoria University of Wellington,Wellington.

e n v i r o n m e n t a l s c i e n c e & p o l i c y 3 3 ( 2 0 1 3 ) 1 3 3 – 1 4 2140
Bandaragoda, C., Tarboton, D.G., Woods, R., 2004. Application ofTOPNET in the distributed model intercomparison project.Journal of Hydrology 298, 178–201.
Barnett, J., O’Neill, S., 2010. Maladaptation. GlobalEnvironmental Change 202, 211–213.
Benestad, R.E., 2010. Downscaling precipitation extremes—correction of analog models through PDF predictions.Theoretical and Applied Climatology 100, 1–21.
Benestad, R.E., Nychka, D., Mearns, L.O., 2012. Spatially andtemporally consistent prediction of heavy precipitation frommean values. Nature Climate Change 2, 544–547.
Berry, S., Vella, J., 2011. Planning Controls and Property Rights-Striking the Balance. Resource Management LawAssociation. Roadshow 2010. In: Daya-Winterbottom, T.(Ed.), Resource Management Theory and Practice. ResourceManagement Law Association, Auckland, pp. 136–194.
Beven, K.J., 1997. TOPMODEL: a critique. Hydrological Processes11, 1069–1086.
Burby, R.J., French, S.P., 1981. Coping with floods: the land usemanagement paradox. Journal of the American PlanningAssociation 47, 289–300.
Carlman, I., 2005. The rule of sustainability and planningadaptivity. Ambio 34, 163–168.
Clark, M.P., Rupp, D.E., Woods, R.A., Zheng, X., Ibbitt, R.P.,Slater, A.G., Schmidt, J., Uddstrom, M.J., 2008. Hydrologicaldata assimilation with the ensemble Kalman filter: use ofstreamflow observations to update states in a distributedhydrological model. Advances in Water Resources 31,1309–1324.
David, P.A., 1985. Clio and the economics of QWERTY. AmericanEconomic Review 75, 332–337.
Defra, 2013a. Economics of Climate Resilience NaturalEnvironment Theme: National Flood Management CA0401.Report Prepared for Defra and the DevolvedAdministrations. Frontier Economics/Irbaris/Ecofys,London118.
Defra, 2013b. Flooding and Coastal Change: Guidance forPractitioners. https://www.gov.uk/flooding-and-coastal-change-guidance-for-practitioners.
Dobes, L., 2008. Getting real about adapting to climate change:using ‘real options’ to address uncertainties. Agenda 15,55–68.
Dovers, S.R., Hezri, A.A., 2010. Institutions and policy processes:the means to the ends of adaptation. Wiley InterdisciplinaryReviews: Climate Change 1, 212–231.
Downton, M.W., Morss, R.E., Wilhelmi, O.V., Gruntfest, E.,Higgins, M.L., 2005. Interactions between scientificuncertainty and flood management decisions: two casestudies in Colorado. Global Environmental Change Part B:Environmental Hazards 6, 134–146.
Edwards, F., Dixon, J., Friel, S., Hall, G., Larsen, K., Lockie, S.,Wood, B., Lawrence, M., Hanigan, I., Hogan, A., Hattersley, L.,2011. Climate change adaptation at the intersection of foodand health. Asia-Pacific Journal of Public Health 23,91S–104S.
Freeman, C., Cheyne, C., 2008. Coasts for sale: gentrification inNew Zealand. Planning Theory and Practice 9, 33–56.
Glavovic, B.C., Saunders, W.S.A., Becker, J.S., 2010. Realising thepotential of land-use planning to reduce hazard risks in NewZealand. Australasian Journal of Disaster and TraumaStudies 1, 679–706.
Gordon, P., Little, R.G., 2009. Rethinking flood protection. PublicWorks Management & Policy 14 (1) 37–54.
Gupta, J., Termeer, C., Klostermann, J., Meijerink, S., van denBrink, M., Jong, P., Nooteboom, S., Bergsma, E., 2010. Theadaptive capacity wheel: a method to assess the inherentcharacteristics of institutions to enable the adaptive capacityof society. Environmental Science & Policy 13,459–471.
Haasnoot, M., Middelkoop, H., 2012. A history of futures: areview of scenario use in water policy studies in theNetherlands. Environmental Science & Policy 19–20, 108–120.
Haasnoot, M., Middelkoop, H., Offermans, A., van Beek, E., vanDeursen, W.P.A., 2012. Exploring pathways for sustainablewater management in river deltas in a changingenvironment. Climatic Change, http://dx.doi.org/10.1007/s10584-012-0444-2.
Haasnoot, M., Middelkoop, H., Van Beek, E., Van Deursen,W.P.A., 2011. A method to develop sustainable watermanagement strategies for an uncertain future. SustainableDevelopment 199, 369–381.
Hallegatte, S., 2009. Strategies to adapt to an uncertain climatechange. Global Environmental Change 19, 240–247.
Hardwick Jones, R., Westra, S., Sharma, A., 2010. Observedrelationships between extreme sub-daily precipitation,surface temperature, and relative humidity. GeophysicalResearch Letters 37, L22805, http://dx.doi.org/10.1029/2010GL045081.
Hawkes Bay Regional Council, 2012. Hawkes Bay RegionalCoastal Environment Plan Version 3. Hawkes Bay RegionalCouncil, 299 http://www.hbrc.govt.nz/HBRC-Documents/HBRC%20Document%20Library/Current%20RCEP%20(All%20Vol1).pdf.
IPCC, 2007a. In: Pachauri, R.K., Reisinger, A. (Eds.), ClimateChange 2007: Synthesis Report. Contribution of WorkingGroups I, II and III to the fourth Assessment Report.Intergovernmental Panel on Climate Change, Geneva.
IPCC, 2007b. In: Solomon, S., Qin, D., Manning, M., Marquis,M., Averyt, K., Tignor, M., Miller, H.L., Chen, Z. (Eds.),Climate Change 2007: The Physical Science Basis.Contribution of Working Group I to the Fourth AssessmentReport of the Intergovernmental Panel on Climate Change.Cambridge University Press, Cambridge, UK.
Jones, R.N., Preston, B.L., 2011. Adaptation and riskmanagement. Wiley Interdisciplinary Reviews: ClimateChange 2, 296–308.
Katsman, C.A., Sterl, A., Beersma, J.J., van den Brink, H.W.,Church, J.A., Hazeleger, W., Kopp, R.E., Kroon, D., Kwadijk, J.,Lammersen, R., Lowe, J., Oppenheimer, M., Plag, H.P., Ridley,J., von Storch, H., Vaughan, D.G., Vellinga, P., Vermeersen,L.L.A., van de Wal, R.S.W., Weisse, R., 2011. Exploring high-end scenarios for local sea level rise to develop floodprotection strategies for a low-lying delta—the Netherlandsas an example. Climatic Change 109, 617–645.
Kennedy, D., Stocker, L., Burke, G., 2010. Australian localgovernment action on climate change adaptation: somecritical reflections to assist decision-making. LocalEnvironment 15, 805–816.
Kwadijk, J., Haasnoot, M., Mulder, J., Hoogvliet, M., Jeuken, A.,van der Krogt, R., van Oostrom, N., Schelfhout, H., vanVelzen, E., van Waveren, H., de Wit, M., 2010. Usingadaptation tipping points to prepare for climate change andsea level rise: a case study in the Netherlands. WileyInterdisciplinary Reviews: Climate Change 1, 729–740.
Lawrence, J., Quade, D., 2011. Perspectives on Flood-riskManagement and Climate Change—Implications for LocalGovernment Decision Making. NZCCRI Report 07. NewZealand Climate Change Research Institute, VictoriaUniversity of Wellington, Wellington49.
Lawrence, J., Tegg, S., Reisinger, A., Quade, D., 2011. Hutt ValleyFlood Vulnerability. NZCCRI-2011-02. New Zealand ClimateChange Research Institute, Victoria University of Wellington,Wellington76.
Lempert, R.J., Collins, M.T., 2007. Managing the risk of uncertainthreshold responses: comparison of robust, optimum, andprecautionary approaches. Risk Analysis 27, 1009–1026.
Leong, D.C.K., Jordan, R.S., Ibitt, R., 1992. The Potential Effects ofClimate Change on River Protection: Case Study on the Hutt

e n v i r o n m e n t a l s c i e n c e & p o l i c y 3 3 ( 2 0 1 3 ) 1 3 3 – 1 4 2 141
River Network. DSIR Marine and Freshwater, HydrologyCentre, Christchurch87.
Lloyds, 2008. Coastal Communities and Climate Change—Maintaining Future Insurability. 360 Driving the Debate onEmerging Risk. http://www.lloyds.com/NR/rdonlyres/33811190-E508-4065-BB15-92EF5F3DFD41/0/360_Coastalcommunitiesandclimatechange_final.pdf.
Lyle, T.S., 2001. Non-structural Flood Management: Solutions forthe Lower Fraser Valley, British Columbia. Simon FraserUniversity, Burnaby, British Columbia, Canada.
McDonald, J., 2011. The role of law in adapting to climatechange. Wiley Interdisciplinary Reviews: Climate Change 2,283–295.
Merz, B., Hall, J., Disse, M., Schumann, A., 2010. Fluvial flood riskmanagement in a changing world. Natural Hazards andEarth System Science 10, 509–527.
Milly, P., Betancourt, J., Falkenmark, M., Hirsch, R.M.,Kundzewicz, Z.W., Lettenmaier, D.P., Stouffer, R.J., 2008.Climate change: stationarity is dead:whither watermanagement? Science 319, 573.
Ministry for the Environment, 2008. Climate Change Effects andImpacts Assessment: A Guidance Manual for LocalGovernment in New Zealand, 2nd ed., Wellington, NewZealand.
Ministry for the Environment, 2010. Tools for estimating theeffects of climate change on flood flow-a guidance manualfor local government in New Zealand. Woods, R., Mullan,A.B., Smart, G., Rouse, H., Hollis, M., McKercher, A., Ibbitt, R.,Dean, S., Collins, D, (NIWA). In: Environment, M.f.t. (Ed.),Prepared for Ministry for the Environment, Ministry for theEnvironment, Wellington.
Mullan, A.B., Wratt, D.S., Renwick, J.A., 2001. Transient modelscenarios of climate changes for New Zealand. Weather andClimate 3–33.
Næss, L.O., Bang, G., Eriksen, S., Vevatne, J., 2005. Institutionaladaptation to climate change: flood responses at themunicipal level in Norway. Global Environmental ChangePart A 15, 125–138.
Pearson, C., McKerchar, A., 1999. An Update of Hutt RiverFlood Frequency. NIWA Client Report CHC99/11,Wellington. , p. 24.
Ranger, N., Millner, A., Dietz, S., Sam Fankhauser, S., Lopez, A.,Ruta, G., 2010. Adaptation in the UK: A Decision-makingProcess, A Policy Brief. Grantham Institute on ClimateChange and the Environment and Centre for Climate ChangeEconomics and Policy, p. 64.
Reeder, T., Ranger, N., 2010. How do you Adapt in an UncertainWorld? Lessons from the Thames Estuary 2100 Project.Washington, DC. Available online at http://www.worldresourcesreport.org, p. 16.
Reisinger, A., Lawrence, J., Hart, G., Chapman, R., in press.From coping to managed retreat: the role of managedretreat in highly developed coastal regions. In: Glavovic,B., Kaye, R., Kelly, M., Travers, A. (Eds.), Climate Changeand the Coast: Building Resilient Communities. Taylor andFrancis (in press).
Reisinger, A., Mullan, A.B., Manning, M., Wratt, D.W., Nottage,R.A.C., 2010. Global and local climate change scenarios tosupport adaptation in New Zealand. In: Nottage, R.A.C.,Wratt, D.S., Bornman, J.F., Jones, K. (Eds.), ClimateChange Adaptation in New Zealand: Future Scenarios andSome Sectoral Perspectives. New Zealand Climate ChangeCentre, Wellington, pp. 26–43.
Reisinger, A., Wratt, D., Allan, S., 2011. The role of localgovernment in adapting to climate change: lessons fromNew Zealand. In: Ford, J.D., Berrang-Ford, L. (Eds.), ClimateChange Adaptation in Developed Nations. Springer,Netherlands.
Roggema, R., 2009. Adaptation to Climate Change: A SpatialChallenge. Springer, Dordrecht.
Schoemaker, P.J.H., 1993. Multiple scenario development: itsconceptual and behavioral foundation. StrategicManagement Journal 14, 193–213.
Stafford Smith, M., Horrocks, L., Harvey, A., Hamilton, C., 2011.Rethinking adaptation for a 4 8C world. PhilosophicalTransactions of the Royal Society A: Mathematical, Physicaland Engineering Sciences 369, 196–216.
Standards Australia, Standards New Zealand, 2009. AS/NZS ISO31000:2009 Risk Management—Principles and Guidelines.Standards Australia and Standards New Zealand, Sydneyand Wellington, p. 10.
Stevens, M., Song, Y., Berke, P., 2010. New urbanistdevelopments in flood-prone areas: safe development, orsafe development paradox? Natural Hazards 53, 605–629.
Sutton, S.G., Tobin, R.C., 2011. Constraints on communityengagement with Great Barrier Reef climate changereduction and mitigation. Global Environmental Change 21,894–905.
Tait, A., Bell, R., Burgess, S., 2002. Meteorological Hazards andthe Potential Impacts of Climate Change in WellingtonRegion—A Scoping Study. Report for NIWA & WellingtonRegional Council WLG2002/19. , p. 152.
Tasman District Council, 2011. Public Notice of Legal Effect ofParts of Proposed Change 22 Mapua and Ruby Bay. TasmanResource Management Plan. Retreived from http://www.tasman.govt.nz/home/SearchForm?Search=Plan+Change+22&action_results=Search (5.01.11).
Tobin, G.A., 1995. The levee love affair: a stormy relationshipJAWRA. Journal of the American Water ResourcesAssociation 31, 359–367.
Trenberth, K.E., 2006. The Impact of Climate Change andVariability on Heavy Precipitation, Floods, and Droughts:Encyclopedia of Hydrological Sciences. John Wiley & Sons Ltd.
Trenberth, K.E., 2011. Changes in precipitation with climatechange. Climate Research 47, 123–138.
Unruh, G.C., 2000. Understanding carbon lock-in. Energy Policy28, 817–830.
Unruh, G.C., Carrillo-Hermosilla, J., 2006. Globalizing carbonlock-in. Energy Policy 34, 1185–1197.
van den Berg, M., Coenen, F., 2012. Integrating climate changeadaptation into Dutch local policies and the role ofcontextual factors. Local Environment 17, 441–460.
Walker, W., Haasnoot, M., Kwakkel, J., 2013. Adapt or perish: areview of planning approaches for adaptation under deepuncertainty. Sustainability 5, 955–979.
Wellington Regional Council, 1996. Living with the River: HuttRiver Floodplain Management Plan Phase One SummaryReport. , p. 113.
Wellington Regional Council, 2001. Hutt River FloodplainManagement Plan: For the Hutt River and its Environment. ,Wellington.
Wilby, R.L., Charles, S.P., Zorita, E., Timbal, B., Whetton, P.,Mearns, L.O., 2004. Guidelines for Use of Climate ScenariosDeveloped from Statistical Downscaling Methods: IPCC TaskGroup on Data and Scenario Support for Impact and ClimateAnalysis. , p. 27.
World Bank, 2010. World Development Report 2010:Development and Climate Change World DevelopmentReport. World Bank, Washington.
Yohe, G., 2009. Toward an integrated framework derived from arisk-management approach to climate change. ClimaticChange 95, 325–339.
Judy Lawrence is adjunct research associate at the NZ ClimateChange Research Institute and undertaking doctoral research inthe School of Government, at Victoria University of Wellington,

e n v i r o n m e n t a l s c i e n c e & p o l i c y 3 3 ( 2 0 1 3 ) 1 3 3 – 1 4 2142
New Zealand. Her research interests lie in decision-making underuncertainty, flexible institutional responses to climate changeimpacts and local government practice. She is director of PSCon-sulting advising on science/policy links, governance and institu-tional issues and was formerly director of the NZ Climate ChangeOffice at the Ministry for the Environment and Convenor of theNational Science Strategy Committee for Climate Change.
Andy Reisinger is deputy director (International) of the NZ Agri-cultural Greenhouse Gas Research Centre. His research interestslie in scenario- and risk-based analysis of responses to climatechange, in particular dealing with uncertainty in adaptation andthe use of alternative metrics to evaluate mitigation of non-CO2
greenhouse gases. He is currently serving as coordinating leadauthor for the fifth Assessment Report of Working Group II of theIntergovernmental Panel on Climate Change.
Brett Mullan is a principal scientist and group manager at theNational Institute of Water and Atmosphere’s (NIWA) NationalClimate Centre. He leads the climate prediction programme,which includes seasonal climate forecasting and statistical anddynamical downscaling of long-term climate change projections.He was a member of the WMO Commission for Climatology ExpertTeam on El Nino and La Nina, a past President of the Meteorologi-cal Society of New Zealand, and a member of the Royal Society ofNew Zealand Climate Committee since 1990.
Bethanna Jackson is senior lecturer in Hydrology and WaterResources in the School of Geography, Environment and EarthSciences at Victoria University of Wellington, New Zealand. Herresearch interests are in predicting the impact of land manage-ment and climate change on flood risk and general ecosystemservices.


