
1-s2.0-S0377027314003886-main
51
Magma Fracturing and Degassing Associated with Obsidian Formation: The Explosive-Effusive Transition Agust´ ın Cabrera, Roberto F. Weinberg, Heather M.N. Wright PII: S0377-0273(14)00388-6 DOI: doi: 10.1016/j.jvolgeores.2014.12.014 Reference: VOLGEO 5468 To appear in: Journal of Volcanology and Geothermal Research Please cite this article as: Cabrera, Agust´ ın, Weinberg, Roberto F., Wright, Heather M.N., Magma Fracturing and Degassing Associated with Obsidian Formation: The Explosive-Effusive Transition, Journal of Volcanology and Geothermal Research (2015), doi: 10.1016/j.jvolgeores.2014.12.014 This is a PDF file of an unedited manuscript that has been accepted for publication. As a service to our customers we are providing this early version of the manuscript. The manuscript will undergo copyediting, typesetting, and review of the resulting proof before it is published in its final form. Please note that during the production process errors may be discovered which could affect the content, and all legal disclaimers that apply to the journal pertain.
-
Upload
vicentecampos -
Category
Documents
-
view
4 -
download
2
description
1-s2.0-S0377027314003886-main
Transcript of 1-s2.0-S0377027314003886-main
�������� ����� ��
Magma Fracturing and Degassing Associated with Obsidian Formation: TheExplosive-Effusive Transition
Agustı́n Cabrera, Roberto F. Weinberg, Heather M.N. Wright
PII: S0377-0273(14)00388-6DOI: doi: 10.1016/j.jvolgeores.2014.12.014Reference: VOLGEO 5468
To appear in: Journal of Volcanology and Geothermal Research
Please cite this article as: Cabrera, Agust́ın, Weinberg, Roberto F., Wright, HeatherM.N., Magma Fracturing and Degassing Associated with Obsidian Formation: TheExplosive-Effusive Transition, Journal of Volcanology and Geothermal Research (2015), doi:10.1016/j.jvolgeores.2014.12.014
This is a PDF file of an unedited manuscript that has been accepted for publication.As a service to our customers we are providing this early version of the manuscript.The manuscript will undergo copyediting, typesetting, and review of the resulting proofbefore it is published in its final form. Please note that during the production processerrors may be discovered which could affect the content, and all legal disclaimers thatapply to the journal pertain.
ACC
EPTE
D M
ANU
SCR
IPT
ACCEPTED MANUSCRIPT
1
Magma Fracturing and Degassing Associated with Obsidian
Formation: The Explosive-Effusive Transition
Agustín Cabrera, Roberto F. Weinberg* and Heather M.N. Wright
a
School of Geosciences, Monash University, Australia
a Currently at: Cascades Volcano Observatory, USGS, 1300 SE Cardinal Court, Building
10, Suite 100, Vancouver, WA 98683, USA
* Corresponding author at: School of Geosciences, Building 28, Monash University,
Clayton, VIC. 3800, Australia.
Email address: [email protected]
Abstract
This paper explores the role of melt fracturing in degassing rhyolitic volcanic
systems. The Monte Pilato-Rocche Rosse eruptions in Italy evolved from explosive to
effusive in style, and H2O content in quenched glasses changed over time from relatively
H2O-rich (~0.90 wt%) to H2O-poor dense obsidian (~0.10-0.20 wt%). In addition, healed
fractures have been recorded in all different eruptive materials, from the glass of early-
erupted tube pumice and rinds of breadcrusted obsidian pyroclasts, to the glass of late-
erupted dense obsidian pyroclasts, and throughout the final effusive Rocche Rosse lava
flow. These rocks show multiple fault sets, some with crenulated fault planes indicating
resumption of viscous flow after faulting, complex obsidian breccias with evidence for
post-brecciation folding and stretching, and centimetre- to metre-thick tuffisite preserved
in pyroclasts and lava, representing collapsed foam due to fracturing of vesicle walls.
These textural observations indicate that multiple fracturing and healing events occurred
ACC
EPTE
D M
ANU
SCR
IPT
ACCEPTED MANUSCRIPT
2
during both explosive and effusive eruptions. H2O content in glass decreases by as much
as 0.14 wt% towards healed fractures/faults and decreases in stretched obsidian breccias
towards regions of intense brecciation. A drop in pressure and increase in temperature
along fractures caused diffusive H2O migration through melt toward fracture surfaces.
Repetitive and pervasive fracturing and healing thereby creates conditions for diffusive
H2O loss into fractures and subsequent escape through permeable paths. This type of
progressive magma degassing provides a potential mechanism to explain the formation of
dense obsidian and the evolution from explosive to effusive eruption style.
Key words: Rhyolite, Melt fracturing, Degassing, Explosive-effusive transition,
Obsidian.
1. Introduction
Deposits from rhyolite volcanoes worldwide indicate that many eruptions evolve
from explosive to effusive (e.g., Barclay et al., 1996; Cortese et al., 1986; Dellino and La
Volpe, 1995; Eichelberger and Westrich, 1981; Lara, 2009;Watt et al., 2013). Recent
observations of rhyolite eruptions at El Chaitén, and Puyehue–Cordón-Caulle, Chile,
follow the explosive-effusive pattern for rhyolite volcanoes, where Plinian explosive
activity transitioned to lava effusion within a week (e.g., Castro and Dingwell, 2009;
Castro et al., 2012b; Schipper et al., 2013).
The whole-rock major element composition of rhyolites extruded during
explosive-effusive rhyolite eruptions is generally constant within the eruptive cycle (e.g.,
Gioncada et al., 2003; Pallister et al., 2013; Watt et al., 2013). Although there can be a
relative increase in crystal content in the products of effusive compared to explosive
ACC
EPTE
D M
ANU
SCR
IPT
ACCEPTED MANUSCRIPT
3
eruptions (e.g., Castro and Dingwell, 2009; Watt et al., 2013), commonly the main
change is a decrease in volatile contents (H2O, CO2, F, Cl, Li, Be and S) is recorded in
matrix glasses (e.g., Barclay et al., 1996; Dunbar and Kyle, 1992; Lowenstern et al.,
2012; Newman et al., 1988; Westrich et al., 1988).
H2O is the main volatile phase in volcanic melts, and dissolved H2O contents in
erupted rhyolite glasses vary from ~2.2 wt% in explosive products, to between 0.5 and
0.1 wt% in effusive deposits (e.g., Castro and Dingwell, 2009; Eichelberger and
Westrich, 1981; Westrich et al., 1988). Generally, the juvenile components of explosive
rhyolite deposits are dominantly pumice, whereas obsidian (vesicle-poor glass) forms a
small proportion of the deposits (e.g., Eichelberger and Westrich, 1981; Schipper et al.,
2013). However, H2O-poor obsidian dominates amongst effusive deposits (Fink, 1980;
Furukawa et al., 2010; Manley and Fink, 1987; Stevenson et al., 1994; Tuffen and Castro,
2009). Primary, magmatic H2O dissolved in glass from pyroclastic obsidian and feeder
dikes can vary widely from 2.2 wt% down to values in equilibrium with atmospheric
pressure (0.10 wt%; e.g., Castro and Dingwell, 2009; Eichelberger and Westrich, 1981;
Watkins et al., 2012; Westrich et al., 1988). In contrast, glasses from obsidian lava record
a narrower range at low values (0.1 – 0.5 wt%; e.g., von Aulock et al., 2013; Castro et al.,
2005; Clay et al., 2012; Westrich et al., 1988).
The explosivity and style of volcanic eruptions are controlled by the ability of
magmatic gas to escape as magma ascends and decompresses. Magma overpressure
driving eruption is a function of the balance between gas exsolution and gas loss (e.g.,
Sparks, 2003). Permeable networks of connected bubbles and shear-induced brittle
fractures are thought to allow gas migration and outgassing of the system (e.g., Cabrera et
ACC
EPTE
D M
ANU
SCR
IPT
ACCEPTED MANUSCRIPT
4
al., 2011; Eichelberger et al., 1986; Gonnermann and Manga, 2003; Holland et al., 2011;
Jaupart and Allègre, 1991; Lavallée et al., 2013; Schipper et al., 2013; Stasiuk et al.,
1996). The critical vesicularity at which significant gas loss occurs varies due to complex
relationships between porosity and permeability (e.g., Rust and Cashman, 2004), partly
controlled by shear flow (e.g., Wright and Weinberg, 2009). Measurements of the
permeability of natural, vesicular volcanic samples and laboratory analogs indicate that
bubbles form a percolating network at porosities between 30 and 80 vol %, depending on
melt viscosity, crystallinity, magnitude of shear, and bubble expansion rate (e.g., Klug
and Cashman, 1996; Mueller et al., 2005; Saar and Manga, 1999).
For the expected range of permeabilities in vesicular magmas (10-15
to 10-12
m2;
cf. Rust and Cashman, 2011), calculated degassing times are longer than the estimated
timescale of magma ascent through shallow conduits (Gonnermann and Manga, 2003;
Okumura et al., 2009; Takeuchi et al., 2008). Slow degassing implies that another
mechanism must explain the gas loss required to defuse explosive volcanic systems and
give rise to effusive lava flows. Shearing experiments and measurements of natural
vesicular rhyolite samples indicate that deformation of foams can greatly enhance the
permeability of the system (Caricchi et al. 2011; Okumura et al., 2010; Okumura et al.,
2009; Wright and Weinberg, 2009) and give rise to oriented, tube-like, bubble-bubble
open paths, thought more typical of the relatively deep parts of conduit based on their
presence in highly vesicular pumiceous pyroclasts (Blower, 2001; Okumura et al., 2009;
Wright et al., 2006).
Torsional shear deformation experiments on vesicular samples have also shown
that foams can sustain brittle fracture and degas (Okumura et al., 2010). However, these
ACC
EPTE
D M
ANU
SCR
IPT
ACCEPTED MANUSCRIPT
5
experiments also indicate that slip in the fractured interface prevents further brittle failure
and shear-induced bubble coalescence. Healing of fractures results in resumption of
viscous deformation (Tuffen et al., 2003), thus fracturing will only be a significant
degassing mechanism if magma fracturing and healing events are common and pervasive
(Okumura et al., 2010).
Different mechanisms have been proposed to explain the lack of preserved open
permeable pathways in obsidian and the change from explosive to effusive behaviour in
silicic volcanic systems. Vesicle collapse as well as fracturing and healing of melt, both
induced by magma shearing in the conduit, can potentially explain: a) degassing, b) low
porosity in eruptive products, and c) change in eruptive behaviour from explosive to
effusive (e.g., Castro et al., 2012a; Eichelberger et al., 1986; Gonnermann and Manga,
2003; Okumura et al., 2013; Schipper et al., 2013). Cabrera et al. (2011) measured H2O
content across a healed fault in pyroclastic obsidian glass and demonstrated that fractures
are directly related to degassing by providing low pressure and/or high temperature sites,
which lead to diffusion of volatiles from the melt into the fracture, and provide a
permeable path for gas escape.
In order to account for considerable degassing of melt and explain explosive to
effusive transitions, fracturing and healing must be a pervasive and repetitive process
(e.g., Cabrera et al., 2011; Castro et al., 2012b; Gonnermann and Manga, 2003; Rust and
Cashman, 2007). Repeated fracturing and healing of melt during eruptions has been
demonstrated in several volcanoes, both in the conduit during ascent and in lavas (e.g.,
Castro et al., 2012b; Rust and Cashman, 2007; Rust et al., 2004; Schipper et al., 2013;
Stasiuk et al., 1996; Tuffen and Castro, 2009; Tuffen and Dingwell, 2005; Tuffen et al.,
ACC
EPTE
D M
ANU
SCR
IPT
ACCEPTED MANUSCRIPT
6
2003; Tuffen et al., 2010). Estimated fracturing and healing times of obsidian glass are
compatible with the interevent earthquake times recorded during silicic lava eruptions
(e.g., Cabrera et al., 2011; Castro et al., 2012b; Tuffen et al., 2003, Yoshimura and
Nakamura, 2010).
Castro et al. (2012b) estimated the degree of melt fracture pervasiveness required
to defuse El Chaitén’s 2008 explosive eruption via diffusive water loss into fractures.
They measured H2O concentration profiles in the matrix glass of pyroclasts (with
evidence of pervasive fracture and healing) and lava. They found that H2O contents drop
towards tuffisite veins and towards the edges of clasts within tuffisite veins. Modelled
diffusion times that would account for these H2O drops are ~102- 10
5 seconds, similar to
modelled times for diffusion of H2O into healed faults in the rind of breadcrusted
obsidian bombs on Lipari Island (Cabrera et al., 2011). The transition from explosive to
effusive behaviour occurred within 10 days, therefore Castro et al. (2012b) argued that
unless the magma at El Chaitén was fragmented into mm-size particles across the
conduit, shear-induced fragmentation could only have accounted for enhanced degassing
from magma near the conduit margins. However, the hybrid and concomitant explosive-
effusive phases at Chaitén and Cordón Caullé rhyolite eruptions in Chile, indicate the
occurrence of shear-induced degassing processes at the scale of the conduit (Schipper et
al., 2013). Schipper et al. (2013) proposed that during the Cordón Caulle eruptions, areas
of strain localisation and shear induced magma-fragmentation were not restricted to
conduit margins, but rather prevailed within the conduit through a network of branched
shallow permeable zones that extended over more than 100 meters depth and intersected
highly sheared vesicular melt. These zones allowed degassing, where permeable gas
ACC
EPTE
D M
ANU
SCR
IPT
ACCEPTED MANUSCRIPT
7
escape from a foamed magma dominated over diffusive gas escape into fractures
(Schipper et al., 2013). In this paper, we investigate the extent of fracturing and healing in
eruptive products; the resultant effects on H2O content of melt; and infer relationships
between fracture, degassing, and eruption style during the explosive-effusive Monte
Pilato-Rocche Rosse sequences on Lipari Island.
2. The Monte Pilato-Rocche Rosse Sequences
Rhyolite magmas in the Aeolian Islands have been erupting for the last ~55
thousand years (Donato et al., 2006) and over the last ~42 thousand years on Lipari
Island. On Lipari, rhyolite eruptive activity is typically cyclic, beginning with an
explosive phase and ending with extrusion of obsidian lava flows without a major change
in chemical composition (Cortese et al., 1986; Gioncada et al., 2003). The rhyolite
explosive and effusive Monte Pilato-Rocche Rosse sequences at the northeastern corner
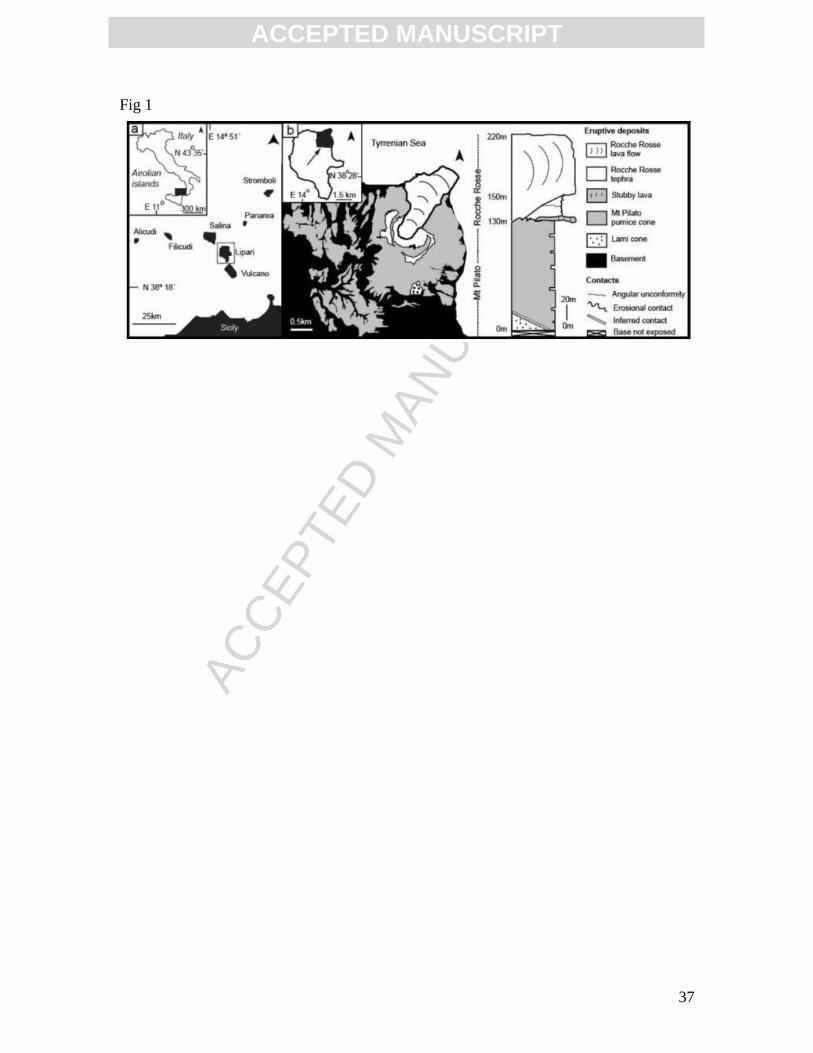
of Lipari Island (Fig. 1) represent the most recent volcanic activity on the island (Cortese
et al., 1986; Dellino and La Volpe, 1995) and took place during the sixth century AD
(e.g., Dellino and La Volpe, 1995; Lucchi et al., 2010).
The Monte Pilato sequence began with explosive activity forming a large pumice
cone (Monte Pilato itself) and the smaller, coeval, parasitic pumice Lami cone on its
southern flank (Fig. 1b; Cortese et al., 1986). A small lava body was then erupted in the
main crater of Monte Pilato (Tranne et al., 2002). Explosive activity then resumed within
the ~1 km wide Monte Pilato crater forming a small tephra cone (Fig. 1b) that
corresponds to the Rocche Rosse sequence (Cortese et al., 1986; Dellino and La Volpe,
1995). This later eruptive sequence ended with extrusion of the ~ 2 km long Rocche
Rosse obsidian lava flow that covers the northern slope of the Monte Pilato pumice cone
ACC
EPTE
D M
ANU
SCR
IPT
ACCEPTED MANUSCRIPT
8
(Cortese et al., 1986) and extends into the sea (Gamberi and Marani, 1997). The small
lava flow located below the Rocche Rosse tephra and above the Monte Pilato pumice,
and an erosional surface located in the crater walls of the Monte Pilato pumice cone (Fig.
1b) separate the Monte Pilato and Rocche Rosse sequences (Dellino and La Volpe, 1995).
Petrographic studies of the explosive and effusive products found that these are nearly
aphyric containing only rare microlites of K-feldspar and pyroxene (e.g., Clay et al.,
2012; Davì et al., 2009; Davì et al., 2010; Gimeno, 2003; Gioncada et al., 2003).
2.1. Eruptive Products
Pyroclastic deposits from the Monte Pilato-Rocche Rosse sequences contain
alternating layers of phreatomagmatic and purely magmatic tephra (Dellino and La
Volpe, 1995, 1996). This study focuses on the magmatic, juvenile products and ignores
deposits significantly influenced by external water. The pyroclastic magmatic component
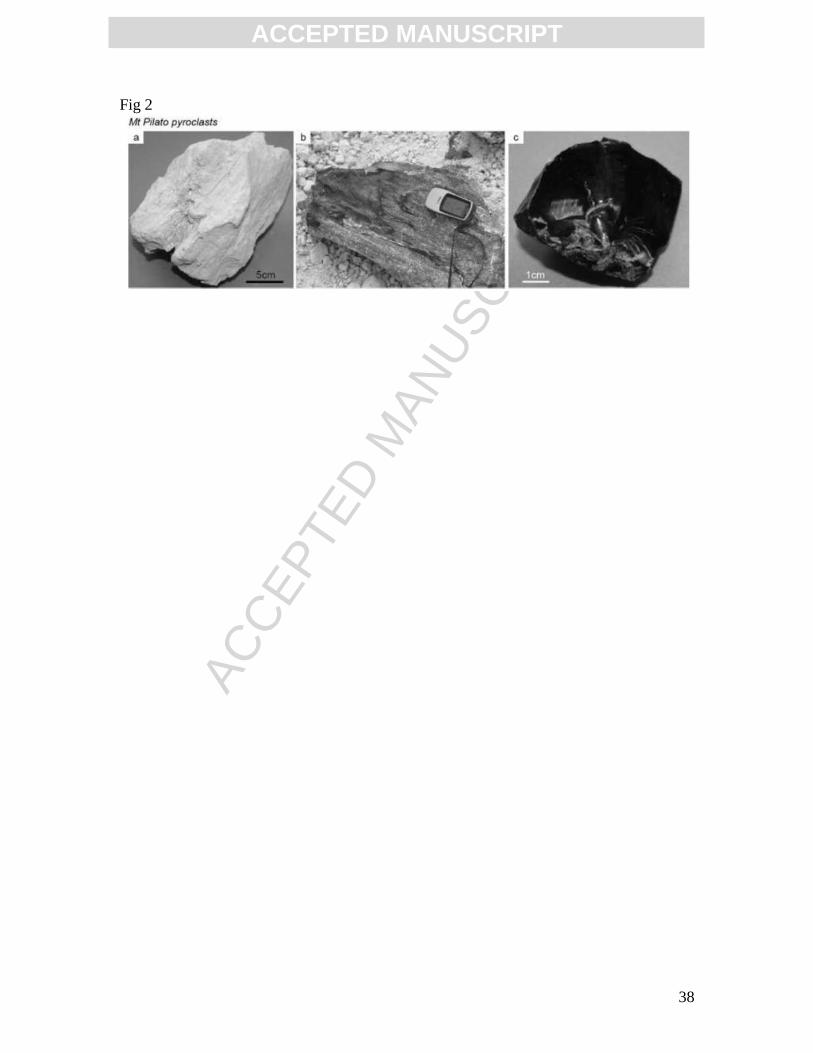
is divided into several textural categories: white and grey tube pumices, and obsidian
clasts including breadcrust bombs, Pele’s tears, dense obsidian lapilli and bombs, and
tuffisitic obsidian (Fig. 2). Colour differences in tube pumice clasts are attributed to
differences in density, where grey tube pumice has a higher density than white (Davì et
al., 2011), rather than differences in crystal content or chemistry (Appendix A). The
relative proportion of pyroclast types vary with different phases of the eruption. The
earlier magmatic deposits related to the Lami cone include white tube pumice pyroclasts,
Pele’s tear obsidian pyroclasts, and breadcrusted obsidian bombs, with variably fractured
and healed glassy rinds (see section below Breadcrust obsidian). The coeval and main
explosive Monte Pilato phase includes white tube pumice, scattered dense obsidian, and
highly vesicular obsidian pyroclasts. In contrast dense obsidian and tuffisitic obsidian
ACC
EPTE
D M
ANU
SCR
IPT
ACCEPTED MANUSCRIPT
9
pyroclasts and grey tube pumice resulted from the last explosive phase that formed the
Rocche Rosse tephra. These are overlain by the Rocche Rosse lava flow formed by
obsidian and variably vesicular and devitrified textural types (e.g., Clay et al., 2012;
Gimeno, 2003).
3. Samples and Methods
Healed fractures are commonly present in glass forming both explosive and
effusive deposits and representative hand samples of a range of textural types were
collected. Clasts were cut and polished perpendicular to macroscopic discontinuities and
thin sections prepared. Back-scattered electron (BSE) images were obtained on a JEOL
840A Scanning Electron Microscope (SEM) at the Monash Centre for Electron
Microscopy, Monash University, Melbourne. The SEM was operated at 20kV
accelerating voltage, 15mm working distance and a probe current of 1x10⁻⁹
A. Three
samples were selected (L01, RRT and Li07-64) which contain healed fractures for
detailed analyses of H2O content variations in groundmass glass in the vicinity of healed
fractures. H2O contents were further analysed of pristine glass in 23 samples from
explosive and effusive deposits (Table 1) using Fourier transform infrared (FTIR)
spectroscopy (see below). In order to measure H2O contents in glass, doubly polished
chips from each sample were prepared into wafers with parallel sides ranging in
thicknesses from 77 to 1000 μm. The thickness of each wafer was measured with a
micrometer with precision of ± 5 μm. H2O contents were measured using benchtop FTIR
and synchrotron FTIR (SFTIR) instruments.
Transmission spectra were obtained from obsidian glass in pyroclast interiors,
bomb rinds, and from the Rocche Rosse lava flow using a Varian FTS 7000 FTIR
ACC
EPTE
D M
ANU
SCR
IPT
ACCEPTED MANUSCRIPT
10
Spectrometer at the School of Chemistry, Monash University, and Synchrotron
Spectrometer at the Australian Synchrotron. The Monash University bench spectrometer
and the Australian Synchrotron FTIR are equipped with an IR microscope and single
point and Focal Plane MCT detectors.
In order to determine groundmass glass H2O concentrations of each sample,
H2Omol and OH- concentrations were measured using the single point MCT detector
interfaced with a KBr beam-splitter. The aperture size was set between 60 and 220 m.
Between 5 and 10 spectra of 128 scans each were acquired, on different spots on each
wafer using a white light source. Straightline baselines were used to calculate peak
heights. Glass density was taken to be 2370 kg/m3. H2O concentrations were determined
in two different ways: (1) from the intensity of the broad 3570 cm-1
absorption band using
the Beer-Lambert law as in Newman et al. (1986) and using an absorption coefficient of
80 L/mol.cm
-1 (Ihinger et al., 1994), and (2) from the intensities of the 4500 cm
-1 and
5200 cm-1
absorption bands for those samples with saturated or oddly shaped peaks at
3570 cm-1
. Where both the peak at 3570 cm-1
and the pair of peaks at 4500 and 5200 cm-
1 were calculated, calculated concentrations are consistently higher using the 3570
cm-1
peak than using the 4500 and 5200 cm-1
peaks, but are within uncertainty limits of
each other. Total H2O concentration (H2Ototal) was calculated using these near-IR
absorption peaks according to the calibration technique of Zhang et al. (1997). Peak
heights were commonly ~3 times greater for the OH- peak (4500 cm
-1) than the H2O peak
(5200 cm-1
; Table 1). Further, for those samples with heterogeneous textures (e.g., healed
fractures and truncation planes), the 64 x 64 pixel focal plane array detector at the School
of Chemistry, Monash University was used, with pixel size of 5.5 μm, and resulting in a
ACC
EPTE
D M
ANU
SCR
IPT
ACCEPTED MANUSCRIPT
11
single tile, 352 x 352 μm raw array H2O map image. For each tile we acquired 128 scans.
H2Ototal concentrations were determined from the intensity of the broad 3570 cm-1
absorption band as above. Errors associated with thicknesses measurements or microlite
influences are smaller than variation for repeated measurements through different
techniques. Average and standard variations of measurements for each analysed area of
samples are noted in Table 1. Although measured H2O concentrations have standard
deviations of up to ±0.09 wt% , measurements were not repeated in the exact same
spot and do not calculate errors related to absorption coefficient and baseline fit; a
conservative relative uncertainty value of ± 10% (Castro et al., 2008; Tuffen et al., 2010)
is herein adopted.
In order to display H2O concentration variations in glass, a Bruker Optus version
6.5 and Varian Resolutions Pro 4.0 software to convert 2D raw data array H2O maps into
2D or 3D images was employed. Each array map varies between one single tile (352 x
352 μm) and up to 5 horizontal or vertically aligned tiles (352 x ~1056 μm, sample Li07-
64). Furthermore, SFTIR H2O transects were assembled into rectangular point H2O maps
using multiple single point measurements, within areas up to 80 μm wide and 1840 μm
long. For methodology see Cabrera et al. (2011). Transects and measurements are spaced
every 10 μm (sample RRT), 40 and 60 μm (sample LO1). 128 scans for each spectrum
were used and analyzed the background every 5 measurements. Blue and green colours
represent areas where IR absorption peak heights for bands were minimum and
yellow to red colours correspond to areas where maximum values were obtained.
4. Results
ACC
EPTE
D M
ANU
SCR
IPT
ACCEPTED MANUSCRIPT
12
Here we summarize whole-rock chemistry and
4.1. Whole-Rock Chemistry and H2O Concentration
Whole rock compositions of juvenile material from explosive and effusive phases are
within error of each other (Appendix A and Cabrera et al., 2011; Clay et al., 2012; Davì
et al., 2011; Davì et al., 2010; Gioncada et al., 2003; Gottsmann and Dingwell, 2001).
Samples are all rhyolitic in composition, and the glass contains an average of 74.4 ± 0.3
wt% SiO2. Furthermore, both explosive and effusive juvenile clasts (excluding devitrified
areas of the lava flow) are crystal-free with less than ~1 vol. % microlite needles of
pyroxene and feldspar. Significant differences were found for the dissolved H2O
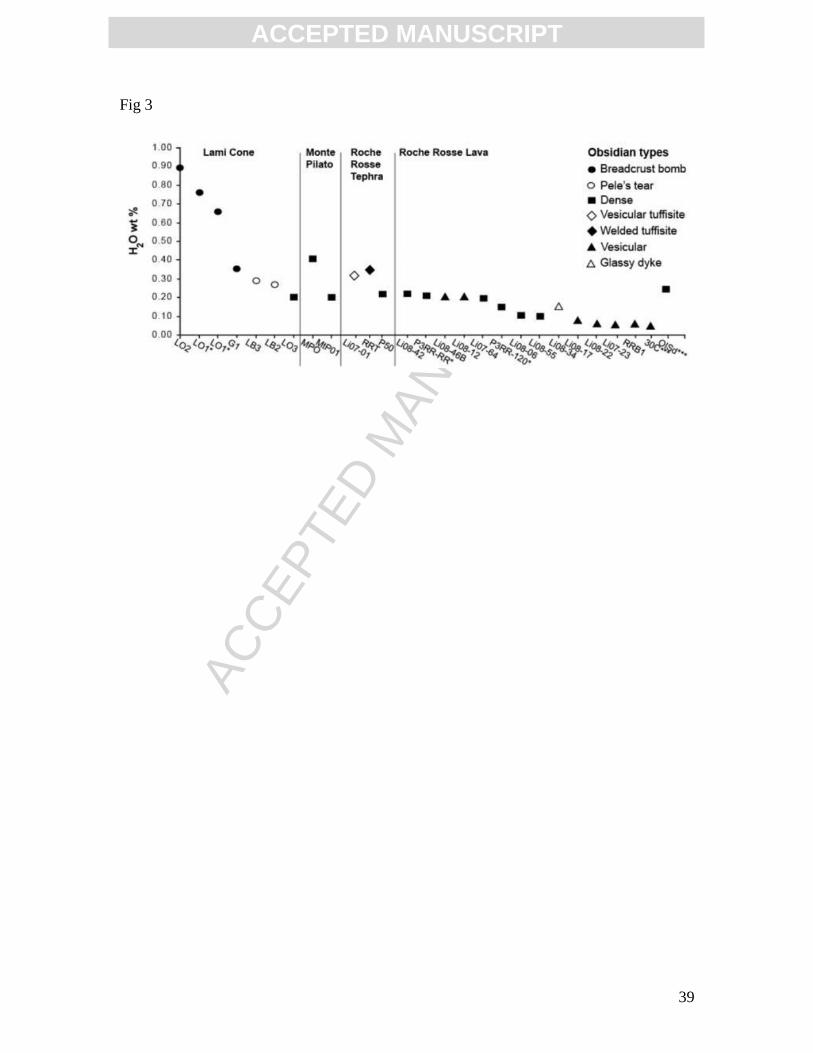
concentration in glasses. Maximum H2O concentration is greater in samples from
explosive phases (0.9 wt%) than from effusive phases (0.26 wt%; Table 1 and Fig. 3).
Carbon dioxide concentrations, in all cases, were below detection.
The explosive Lami cone, the earliest in the sequence of events, contains samples
with wide variations in H2O concentration depending on clast type (Fig. 4). Glasses from
pyroclasts that dominate the cone-building phase of the eruption are relatively H2O-rich.
These pyroclasts remained ductile after their fragmentation and deposition. The glassy
rind of breadcrusted obsidian pyroclasts with highly-vesiculated interiors have H2O
concentration varying between ~0.6 and 0.9 wt%, whereas glass from Pele’s tear
pyroclasts vary between 0.27 and 0.35 wt%. These values contrast with those measured
ACC
EPTE
D M
ANU
SCR
IPT
ACCEPTED MANUSCRIPT
13
in a dense obsidian pyroclast from the same eruption with only 0.20 wt% (sample L03 in
Fig. 3 and Table 1).
Glass from dense obsidian pyroclasts of the simultaneously active Monte Pilato
vent has a similarly low H2O concentration, between 0.20 and 0.41 wt%. The last
explosive eruption that formed the Rocche Rosse tephra deposits is characterized by
dense obsidian and tuffisitic obsidian glasses (samples Li07-1 and RRT in Fig. 3, and
Table 1), which have H2O concentrations between 0.22 and 0.34 wt%.
Glass samples from the Rocche Rosse lava flow, the latest in the sequence of
events, have the lowest measured H2O concentrations of 0.10 to 0.26 wt% (Fig. 3).
Similarly, glass from highly vesicular material in the carapace of the lava flow and hinge
zones of large flow folds includes 0.23 and 0.05 wt% H2O, respectively. These results
reproduce the same range of values obtained by FTIR (e.g., Davì et al., 2010; Gottsmann
and Dingwell, 2001) and secondary ionization mass spectrometry (Clay et al., 2012)
recorded for glass on the Rocche Rosse lava flow.
4.2. Microstructures in Fractured and Healed Obsidian
Fracturing of obsidian is documented in the different types of pyroclasts and lava flow.
Healing tends to erase evidence for fracturing, but displacement of pre-existing features
across the fracture plane together with dusty particles on the plane make fractures
obvious.
4.2.1. Breadcrusted and Tuffisitic Obsidian Pyroclasts
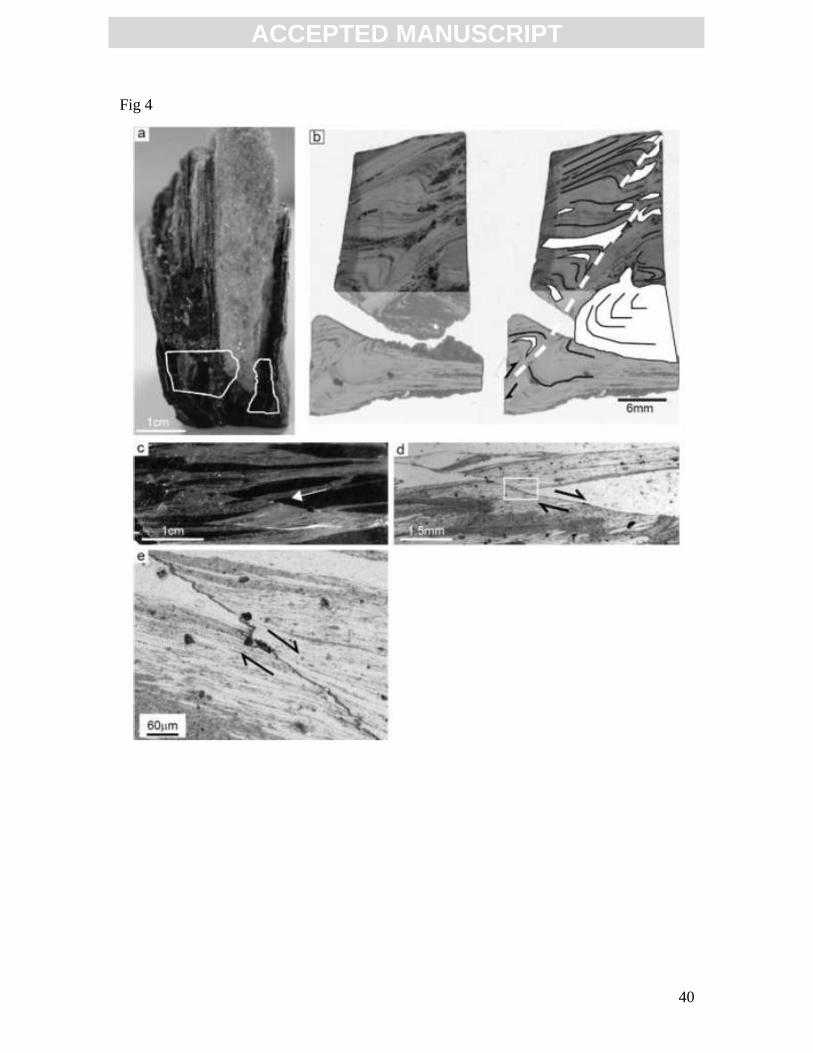
A breadcrusted obsidian bomb from the Lami cone shows a single planar micro-fault in
its rind. The fault truncates folded micro-vesicle and microlite-rich bands (~1% needles
ACC
EPTE
D M
ANU
SCR
IPT
ACCEPTED MANUSCRIPT
14
of very thin and < 100 μm long pyroxene) and pristine glassy bands (Fig. 4a, b; Cabrera
et al., 2011).
Single planar faults are also present in dense tuffisite (clastic material) glass from
pyroclasts in the Rocche Rosse tephra. For example, sample RRT contains a healed fault
that offsets tuffisite bands (Fig. 4c- e). The fault trace is highlighted by a dusty brown
colour due to a concentration of small <10 μm opaque microlites (Fig. 4e). The fault trace
is crenulated and crenulations are asymmetric, which combined with drag folding of
banding on the glass on either side of the fault, indicate sense of movement and that the
glass resumed its viscous behaviour after faulting (Fig. 4e).
Two types of tuffisite are present within obsidian pyroclastic samples from the
Rocche Rosse tephra deposits: vesicular tuffisite and banded tuffisite. Vesicular tuffisite
contains narrow tuffisite bands in pyroclasts with both dense obsidian and pumiceous
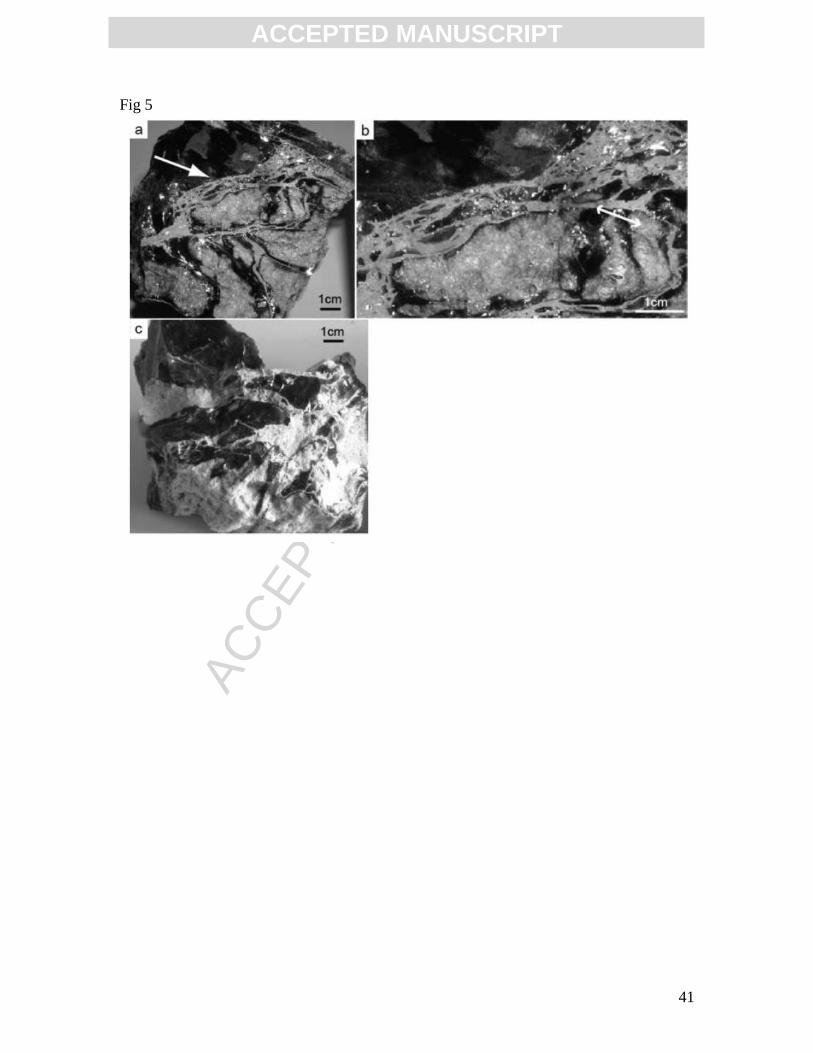
domains. In the sample in Fig. 5, vesicular tuffisite bands cut across a block-sized
pyroclast. The bands are up to 1 cm wide and filled with grey, clastic glassy matrix < 1
mm in particle size surrounding elongated black obsidian clasts that vary in length from
millimetres to 1 cm. In some cases, obsidian clasts are broken up into fragments with a
jig-saw fit pattern (Fig. 5b). These dense clasts are oriented parallel to tuffisite band
margins and have asymmetric shapes indicative of shearing, marked by curved foliation
in the fine matrix wrapping around the clasts (Fig. 5a). Both dense and pumiceous
textural domains surround the tuffisite bands. However, dense veneers around pumiceous
domains and separating pumice from tuffisite suggest that vesiculation in pumiceous
domains occurred after tuffisite formation (Fig. 5).
ACC
EPTE
D M
ANU
SCR
IPT
ACCEPTED MANUSCRIPT
15
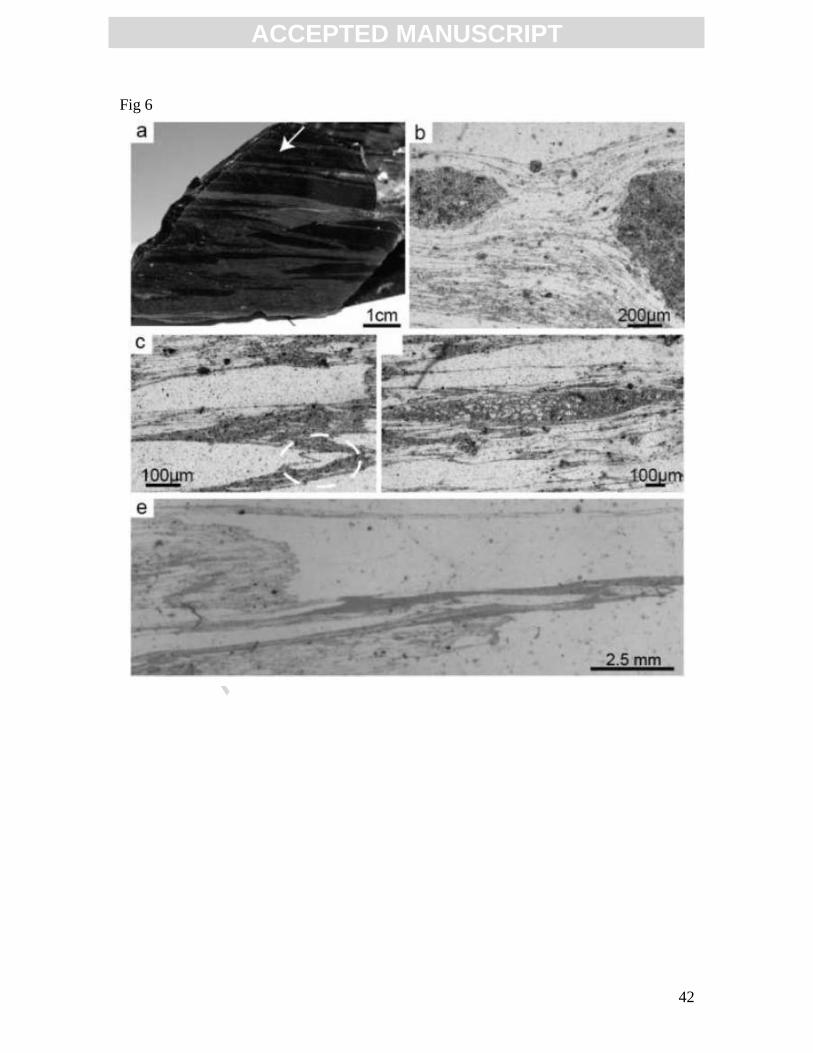
In contrast, banded tuffisite (Fig. 6) forms disconnected lenses or irregular and
connected grey bands in hand-specimen (Figs. 4c and 6a) separated by lenses or bands of
clean, microlite-free obsidian (black in hand specimen; Fig. 6d) or jig-saw fit angular
clasts (Fig. 6c and d). Banded tuffisite further lacks vesicular domains. Tuffisite in these
clasts is comprised of brown glass, rich in opaque microlites and small clasts of
transparent glass (Fig. 6b-e). The edges of each transparent glass lens are well-defined by
concentrations of opaques, whereas interiors are clean. Both glass types form lenses with
their longest axes varying in length from ~50 μm to ~3 mm. The distribution of lenses in
Fig. 6 is complex in detail. In some areas, lenses of brown dusty glass are surrounded by
transparent glass (Fig. 6b). In other areas, the opposite is true (Fig. 6c). In Fig. 6d,
angular transparent, clasts are hosted by brown glass matrix, which in turn forms a
separate clast within transparent obsidian. Commonly, the two types of glass are found as
long, thin bands that show complex folding structures (Fig. 6e). However, as exemplified
by the sample in Fig. 6, the definition of matrix and clast in banded tuffisite depends on
scale. The two glass types are mingled at various scales, fractured, folded, and stretched
into long lenses (see Discussion).
4.2.2. Obsidian Lava Flows
Obsidian from the Rocche Rosse lava flow commonly exhibits multiple micro-
fault sets showing both planar and crenulated faults (e.g., Fig. 7). The northwestern edge
of the Rocche Rosse lava flow front is also cut by subplanar breccia zones (Fig. 8). Road
cut exposures demonstrate that the breccias bands persist for at least ~20 m into the lava
body and maintain a consistent ~N350/30E orientation. Breccia bands are ~1 m wide and
continuous for up to 6 m (Fig. 8a) near the flow margin. Toward the interior of the lava,
ACC
EPTE
D M
ANU
SCR
IPT
ACCEPTED MANUSCRIPT
16
bands narrow, varying from ~3 cm to ~40 cm wide, and are continuous for up to 2 m. The
bands consist of angular to elongated and welded clasts in a finer clastic glassy matrix
bordered by localised bands of dark blue to brown banded obsidian concentrated near the
breccia zone walls. Breccia contents are similar in composition and texture to tuffisite in
pyroclasts, although clasts reach larger sizes in breccia band than in tuffisite. Clasts
within breccia bands are generally oriented parallel to fracture walls and vary in size from
lapilli to block-size (Fig. 8b). Clasts are variably vesicular and variably devitrified.
Abrasion of breccia margins during fracturing of the lava is evidenced by preservation of
different stages of break-up of wall clasts (Fig. 8b). Doubly polished wafers of the
obsidian matrix reveal high aspect ratio vesicles (>100 μm long and <10 μm across, Fig.
8c) defining foliations that are truncated by sharp fault surfaces (Fig. 8d) and flow folds
(Fig. 8e).
4.3. Microstructures in Fractured and Healed Pumice
Pumice pyroclasts show distinct domains characterized by vesicles of different
orientation or aspect ratio in 2D sections (Fig. 9). Boundaries between these domains may
be more or less sharp (compare differences in Fig. 9). Figure 9d shows three bands of
strongly elongated vesicles forming tube pumice (top, middle and bottom) interlayered
with two bands of moderately to weakly elongated vesicles with stair-stepping foliation,
containing kernels where vesicles are roughly circular. Banded textures are interpreted to
represent zones of high strain interlayered with zones of low strain. The asymmetry of the
foliation defines a stair-stepping structure, where in Figure 9 shear is in a top-to-the-left
direction.
4.4. H2O Distribution Around Fractures
ACC
EPTE
D M
ANU
SCR
IPT
ACCEPTED MANUSCRIPT
17
SFTIR and FTIR 3D maps of H2O concentrations across healed fractures in
pyroclastic and effusive obsidian define V-shaped troughs of low H2O content coincident
with the fracture planes (Fig. 10). In pyroclastic obsidian sample LO1-Lami, H2O varies
from 0.66 and 0.73 wt% on either side of the fault trace, to a low of 0.61 wt% at its trace
(Fig. 10a). Single point FTIR H2O content measurements on either side of healed
fractures in different areas of the same sample show a broadly similar pattern (Fig. 10c).
Similarly, the trace of healed faults in the glass from the late Rocche Rosse lava flow
sample Li07-64 in Fig. 7 defines H2O content troughs (Fig. 10d-h). Interestingly, H2O
profiles in the vicinity of the two faults are similar to each other and decrease from a high
of 0.26 wt% away from the faults to a low of 0.12 wt% in the fault plane (Fig. 10e-h).
Figure 11 shows a SFTIR H2O transect that crosses both the brown, dusty tuffisite
and the clean, microlite-free obsidian bands in a banded tuffisite. As is common, the
brown glass hosts smaller and elongated clasts of transparent obsidian (Fig. 6). H2O
content decreases gradually from 0.34 and 0.29 wt% in the transparent and clastic-free
obsidian lenses, to 0.26 wt% at the centre of the clast-rich brown obsidian breccia.
5. Discussion
The Monte Pilato-Rocche Rosse sequence evolved from explosive to effusive
eruptions and the products of eruption include obsidian with variable dissolved H2O
contents reaching very low values, and healed fractures at many scales (e.g., Tuffen and
Dingwell, 2005). In this section, we discuss evidence for fracture and healing processes
and degassing during fracturing. Our results support models suggesting that fracturing of
magmas in conduits can explain both the formation of volatile-poor, vesicle-free obsidian
ACC
EPTE
D M
ANU
SCR
IPT
ACCEPTED MANUSCRIPT
18
(Cabrera et al., 2011, Yoshimura and Nakamura, 2010) and the decrease in explosivity
during a typical eruptive cycle (e.g., Gonnermann and Manga, 2005).
5.1. General Features of Obsidian in the Monte Pilato-Rocche Rosse Sequences
5.1.1. Repeated Fracturing and Healing
Like high-silica erupted rhyolite glasses elsewhere, obsidian from the Monte
Pilato-Rocche Rosse explosive eruptions is richer in H2O than the effusive counterpart
(Fig. 3). Given similar whole-rock major element compositions of explosive and effusive
products (Appendix A), it is most likely that magmatic volatile content controlled the
change in eruption style (e.g., Newman et al., 1988; Villemant and Boudon, 1998).
Microstructural features documented above indicate that melts forming the eruptive
Monte Pilato-Rocche Rosse products underwent multiple brittle-ductile transitions during
emplacement and that degassing due to fracturing may have played an important role in
the decreasing explosivity of the eruptive sequence.
Evidence for multiple brittle-ductile transitions in a single sample is demonstrated
by healed and crenulated fault planes in pyroclasts (e.g., Fig. 4). This structure indicates
that the melt resumed viscous flow after faulting, leading to crenulation (Fig. 4e).
Repeated crossing of the glass transition in this manner implies a strain-rate dependent
rheological transition (as opposed to strictly temperature-dependent transition). We infer
that strain rate variations thereby led to in-conduit brecciation, as recorded by vesicular
and banded tuffisites (Figs. 5 and 6). Vesicular tuffisite (Fig. 5) marks brecciation and
local vesiculation interrupted by ejection. Banded tuffisite (Fig. 6) records multiple
brecciation events followed by resumption of viscous flow, giving rise to a “stretched and
ACC
EPTE
D M
ANU
SCR
IPT
ACCEPTED MANUSCRIPT
19
folded” and rather cryptic breccia in the conduit before final ejection (Fig. 6). Similarity
to microstructures from other rhyolite deposits suggests that multiple events of silicic
magma fracturing and healing might be a general process (Rust and Cashman, 2007) and
that these could result in typical flow banding characteristic of obsidian (Tuffen and
Dingwell, 2005; Tuffen et al., 2003) as supported by the models (Gonnermann and
Manga, 2005).
Brecciation is not restricted to non-vesicular regions of melt; vesicular material
(foams) also experienced multiple fracture events. Pumice pyroclasts have line-sharp
planes that separate distinct textural domains, where domains vary in vesicle elongation
direction and aspect ratio (tube pumice in Fig. 9a-c) or in degree of strain (banded pumice
with asymmetric vesicles, Fig. 9d; Wright and Weinberg, 2009). These microstructures
could have formed in two ways: a) fragmentation of foam into individual clasts and
subsequent healing in the conduit (Fig. 9a-c) (Tuffen and Dingwell, 2005; Tuffen et al.,
2003), or b) strain localization into narrow shear zones where stresses exceed the yield
strength for foams (Fig. 9d; yield behaviour is characteristic of foams, cf. Weaire, 2008).
These microstructures in tube pumice pyroclasts on Lipari (see also Wright and
Weinberg, 2009) are comparable to those in pumice clasts from the Cordón Caulle, Chile
2011-2012 eruptions (Schipper et al., 2013), Vesuvius 79 A.D. (Shea et al. 2012), and to
those experimentally reproduced from sheared silicic foams (Okumura et al., 2010).
Brecciation and healing or strain localization in silicic foams with yield strength may
therefore be general features of eruptive activity (Castro et al., 2012b; Okumura et al.,
2010; Shea et al. 2012; Schipper et al., 2013). In-conduit brecciation of pumice may
represent events where the fragmentation threshold of the vesicular magma was exceeded
ACC
EPTE
D M
ANU
SCR
IPT
ACCEPTED MANUSCRIPT
20
locally but not globally, and thereby was insufficient to produce an explosive eruption
(cf. Spieler et al., 2004).
Evidence for fracturing and healing is also present in the Roche Rosse lava flow.
Here too, obsidian from the lava flow records early crenulated and healed micro-fractures
displaced by sets of later faults (Fig. 7) indicating a crossing of the glass transition at least
twice. At the macro-scale, parts of the lava fractured into metre-long clasts that were
included in the flowing magma within breccia planes (Fig. 8b). The obsidian matrix in
these subplanar breccia zones has microstructures suggestive of rapid emplacement, with
strongly elongated vesicles (Fig. 8c), folding of obsidian bands (Fig. 8e), as well as
fracturing and healing (Fig. 8d).
5.1.2. H2O Loss Associated to Melt Fracturing
In the previous section, we discussed microstructural evidence for multiple
fracturing and healing events during conduit flow and extrusion, and of both highly
vesicular (Figs. 5 and 9) and dense (Figs. 4 and 6) magma. Melt fracturing is not
restricted to a particular clast type. In this section we discuss evidence that fracturing is
accompanied by degassing.
The link between faulting of glass in the conduit and H2O loss has been
documented here and in other studies (Cabrera et al., 2011; Shea et al. 2012; Castro et al.,
2012b; Watkins et al., 2012). Profiles presented here show H2O loss of up to 0.14 wt%
towards single fractures in pyroclasts and lava samples (Fig. 10) as well as tuffisite bands
in the stretched breccias formed in the conduit (Fig. 11). H2O troughs across healed faults
indicate that H2O escaped while fractures were still open and hot (Fig. 10a-b). The drop
in water content indicates that fracturing gave rise to low pressure or local increase in
ACC
EPTE
D M
ANU
SCR
IPT
ACCEPTED MANUSCRIPT
21
temperature, possibly due to friction, imposing water diffusion from the glass into the
fracture (Cabrera et al., 2011). Pressure or temperature inside the fracture cannot be
gauged accurately from the curve, because P-T could fluctuate over time scales too short
to allow H2O content equilibration, and because H2O changes during fracturing will be at
least partly homogenized by post-healing H2O diffusion (Cabrera et al., 2011; Yoshimura
and Nakamura, 2010). Fractures remain open for an undetermined time, which depends
upon relative pressure within the fracture, relative degree of translation of fragments, and
timescale to heal juxtaposed surfaces, which is itself dependent upon temperature and
roughness of the fracture surface (Yoshimura and Nakamura, 2010). The presence of
crenulated healed faults (Figs. 4e and 7) suggests that the glass was sufficiently hot to
flow after fracturing.
Decrease in H2O content of glass across banded tuffisite from the Rocche Rosse
tephra (Fig. 11) is continuous from the centre of a nonvesicular obsidian domain to the
most intensely brecciated clastic band (from left to right in Fig. 11). We suggest that this
H2O profile is the result of H2O loss during syn-eruptive brecciation in the conduit, with
maximum loss where fracturing was most intense, as marked by fine clastic material (see
also Rust and Cashman, 2007; Stasiuk et al., 1996; Tuffen et al., 2010). The H2O profile
has been smoothed after healing by diffusion while the material was still hot (cf. Castro et
al., 2005; Yoshimura and Nakamura, 2008 and 2010). Castro et al. (2012b) found that
glass of vesicular tuffisite pyroclasts from Chaiten also have maximum H2O loss linked to
fractured areas (e.g., Fig. 3b in Castro et al., 2012b). Similar to our results, Rust and
Cashman (2007) found H2O variations of up to 0.25 wt % amongst healed clasts in
welded breccia from pyroclastic deposits at Newberry Volcano. They interpreted that
ACC
EPTE
D M
ANU
SCR
IPT
ACCEPTED MANUSCRIPT
22
shearing and flowing of rising magma could have brought together clasts from different
areas of the conduit.
5.2. Melt Fracturing, Degassing and Decreasing Explosivity of Rhyolite Eruptions
Degassing through fractures inhibits explosive fragmentation by inhibiting the
formation and growth of bubbles (Yoshimura and Nakamura, 2010), increasing the
pressure difference necessary for explosive fragmentation (Spieler et al., 2004). The
textural, structural and chemical signatures described here indicate that degassing due to
fracturing is pervasive during silicic eruptions and has the potential to be a defusing
mechanism for rhyolite volcanoes (e.g., Gonnermann and Manga, 2003).
A similar scenario to Cordón Caullé in Chile, may have occurred in the Monte
Pilato-Rocche Rosse conduit, whereby non-explosive magma fragmentation develops
branched fractures that intersect variably vesicular magma in the conduit and leads to
efficient degassing (Schipper et al., 2013). In other words, fracturing events will not only
release water dissolved in melt but also have the potential to abruptly but locally release
gas trapped in bubbles, leading to vesicle collapse and forming the tuffisites documented
above.
The evolution of rhyolitic eruptions from explosive to effusive may be
summarized by focusing on the difference between the total volatile content of the
magma, including H2O in vesicles and dissolved in the melt (Xtot), and the H2O content
that the melt can dissolve at equilibrium (Xeq) for given P-T conditions. This can be
considered a measure of the magma potential to erupt explosively (W= Xtot - Xeq). For a
volume of melt that ascends and vesiculates, the total H2O content will remain
approximately constant if outgassing is inefficient, increasing its potential to decompress
ACC
EPTE
D M
ANU
SCR
IPT
ACCEPTED MANUSCRIPT
23
explosively (W increases). High-permeability fracturing events (e.g. Gonnermann and
Manga, 2003) resulting from magma shearing against conduit walls or shock waves due
to local pressure differences exceding the threshold for fragmentation of vesicular melt
allows for a step-wise drop in that potential, and equilibration of the magma, decreasing
explosivity.
Extensive fracturing documented on Lipari samples, including the pervasive
fragmentation in obsidian breccias and tuffisites (Figs. 5 and 6) and pumice breccias (Fig.
9), combined with development of H2O-poor obsidian, suggest that fracture degassing
may have played a significant role in defusing the intensity of the rhyolite eruption.
6. Conclusions
Monte Pilato-Rocche Rosse eruptions ejected rhyolite pyroclasts with relatively
high and variable dissolved H2O contents followed by effusion of H2O-poor obsidian
lava. During these eruptions, fracturing and healing of the high viscosity magmas is
responsible for a number of different microstructures, ranging from simple planar faults,
multiple cross-cutting fault sets, crenulated fault planes, and stretched out and complex
obsidian and pumice breccias. These features indicate that fracturing was a common,
repetitive and pervasive process in the conduit. This study also demonstrates that
fracturing leads to diffusive H2O loss from the melt, and that repeated fracturing events
lead to high permeability gas loss events. Fractures not only capture newly exsolved
volatiles, but also provide escape paths for volatiles present in vesicles. Thus, syn-
eruptive degassing at depth through combined vesiculation and extensive fracturing could
explain decreasing H2O content from early explosive pyroclasts to late effusive lava flow.
This process may be critical in defusing explosive potential and behaviour.
ACC
EPTE
D M
ANU
SCR
IPT
ACCEPTED MANUSCRIPT
24
Acknowledgments
This research forms part of the author’s PhD thesis at Monash University.
Valuable field work and early discussions were provided by Ray Cas, Guido Giordano,
Arnaldo De Benedetti, Rossana De Rosa and Marcella Davì. We thank the Australian
Synchrotron and Advanced Light Source for the beamtime required to perform this study
and Ljiljana Puskar for her assistance during measurements. The authors thank Finley
Shanks at the School of Chemistry for help with FTIR measurements and Hugh Tuffen
and Yan Lavallée for constructive comments of an early version of the manuscript.
Sample preparation facilities in the School of Geosciences and the imaging facilities of
the Monash Centre for Electron Microscopy were used for this research. We also
acknowledge constructive criticisms from Tina Neal and two anonymous reviewers.
References
Barclay, J., Carroll, M. R., Houghton, B. F., and Wilson, C. J. N., 1996, Pre-eruptive
volatile content and degassing history of an evolving peralkaline volcano: Journal
of Volcanology and Geothermal Research, v. 74, no. 1-2, p. 75-87.
Blower, 2001, Factors controlling permeability-porosity relationships in magma: Bulletin
of Volcanology, v. 63, no. 7, p. 497-504.
Cabrera, A., Weinberg, R. F., Wright, H., Zlotnik, S., and Cas, R. A. F., 2011, Melt
fracturing and healing: a mechanism for degassing and origin of silicic obsidian:
Geology, v. 39, p. 67-70.
Caricchi, L., Pommier, A., Pistone, M., Castro, J., Burgisser, A., and Perugini, D., 2011,
Strain-induced magma degassing: Insights from simple-shear experiments on
bubble bearing melts: Bulletin of Volcanology, v. 73, no. 9, p. 1245-1257.
Castro, J., Burgisser, A., Schipper, C. I., and Mancini, S., 2012a, Mechanisms of bubble
coalescence in silicic magmas: Bulletin of Volcanology, v. 74, no. 10, p. 2339-
2352.
Castro, J. M., Beck, P., Tuffen, H., Nichols, A. R. L., Dingwell, D. B., and Martin, M. C.,
2008, Timescales of spherulite crystallization in obsidian inferred from water
concentration profiles: American Mineralogist, v. 93, no. 11-12, p. 1816-1822.
Castro, J. M., Cordonnier, B., Tuffen, H., Tobin, M. J., Puskar, L., Martin, M. C., and
Bechtel, H. A., 2012b, The role of melt-fracture degassing in defusing explosive
ACC
EPTE
D M
ANU
SCR
IPT
ACCEPTED MANUSCRIPT
25
rhyolite eruptions at volcán Chaitén: Earth and Planetary Science Letters, v.
333-334, p. 63-69.
Castro, J. M., and Dingwell, D. B., 2009, Rapid ascent of rhyolitic magma at Chaiten
volcano, Chile: Nature, v. 461, no. 7265, p. 780-783.
Castro, J. M., Manga, M., and Martin, M. C., 2005, Vesiculation rates of obsidian domes
inferred from H2O concentration profiles Geophysical Research Letters, v. 32, p.
21307.
Clay, P. L., O’Driscoll, B., Gertisser, R., Busemann, H., Sherlock, S. C., and Kelley, S.
P., 2012, Textural characterization, major and volatile element quantification and
Ar-Ar systematics of spherulites in the Rocche Rosse obsidian flow, Lipari,
Aeolian Islands: a temperature continuum growth model: Contributions to
Mineralogy and Petrology, p. 1-23.
Cortese, M., Frazzetta, G., and Lavolpe, L., 1986, Volcanic history of Lipari (Aeolian
Islands, Italy) during the last 10,000 years: Journal of Volcanology and
Geothermal Research, v. 27, no. 1-2, p. 117-133.
Davì, M., De Rosa, R., and Barca, D., 2009, A LA-ICP-MS study of minerals in the
Rocche Rosse magmatic enclaves: Evidence of a mafic input triggering the latest
silicic eruption of Lipari Island (Aeolian Arc, Italy): Journal of Volcanology and
Geothermal Research, v. 182, no. 1-2, p. 45-56.
Davì, M., De Rosa, R., Donato, P., and Sulpizio, R., 2011, The Lami pyroclastic
succession (Lipari, Aeolian Islands): A clue for unravelling the eruptive dynamics
of the Monte Pilato rhyolitic pumice cone: Journal of Volcanology and
Geothermal Research, v. 201, no. 1-4, p. 285-300.
Davì, M., De Rosa, R., and Holtz, F., 2010, Mafic enclaves in the rhyolitic products of
Lipari historical eruptions; relationships with the coeval Vulcano magmas
(Aeolian Islands, Italy): Bulletin of Volcanology, v. 72, p. 991-1008.
Dellino, P., and La Volpe, L., 1995, Fragmentation versus transportation mechanisms in
the pyroclastic sequence of Monte Pilato-Rocche Rosse (Lipari, Italy): Journal of
Volcanology and Geothermal Research, v. 64, no. 3-4, p. 211-231.
Dellino, P., and La Volpe, L., 1996, Image processing analysis in reconstructing
fragmentation and transportation mechanisms of pyroclastic deposits. The case of
Monte Pilato-Rocche Rosse eruptions, Lipari (Aeolian islands, Italy): Journal of
Volcanology and Geothermal Research, v. 71, no. 1, p. 13-29.
Donato, P., Behrens, H., De Rosa, R., Holtz, F., and Parat, F., 2006, Crystallization
conditions in the Upper Pollara magma chamber, Salina Island, Southern
Tyrrhenian Sea: Mineralogy and Petrology, v. 86, no. 1, p. 89-108.
Dunbar, N. W., and Kyle, P. R., 1992, Volatile contents of obsidian clasts in tephra from
the Taupo Volcanic Zone, New Zealand: Implications to eruptive processes:
Journal of Volcanology and Geothermal Research, v. 49, no. 1-2, p. 127-145.
Eichelberger, J. C., Carrigan, C. R., Westrich, H. R., and Price, R. H., 1986, Non-
explosive silicic volcanism: Nature, v. 323, p. 598-602.
Eichelberger, J. C., and Westrich, H. R., 1981, Magmatic volatiles in explosive rhyolitic
eruptions: Geophysical Research Letters, v. 8, no. 7, p. 757-760.
Fink, J. H., 1980, Gravity instability in the Holocene Big and Little Glass Mountain
rhyolitic obsidian flows, northern California: Tectonophysics, v. 66, no. 1-3, p.
147-166.
ACC
EPTE
D M
ANU
SCR
IPT
ACCEPTED MANUSCRIPT
26
Furukawa, K., Uno, K., and Miyagi, I., 2010, Mechanisms of oxidation and degassing in
the Takanoobane rhyolite lava of Aso Volcano, Japan: Journal of Volcanology
and Geothermal Research, v. 198, no. 3-4, p. 348-354.
Gamberi, F., and Marani, M. P., 1997, Detailed bathymetric mapping of the eastern
offshore slope of Lipari Island (Tyrrhenian Sea): Insight into the dark side of an
arc volcano: Marine Geophysical Researches, v. 19, no. 4, p. 363-377.
Gimeno, D., 2003, Devitrification of natural rhyolitic obsidian glasses: petrographic and
microstructural study (SEM+EDS) of recent (Lipari island) and ancient (Sarrabus,
SE Sardinia) samples: Journal of Non-Crystalline Solids, v. 323, no. 1-3, p. 84-90.
Gioncada, A., Mazzuoli, R., Bisson, M., and Pareschi, M. T., 2003, Petrology of volcanic
products younger than 42 ka on the Lipari-Vulcano complex (Aeolian Islands,
Italy): an example of volcanism controlled by tectonics: Journal of Volcanology
and Geothermal Research, v. 122, no. 3-4, p. 191-220.
Gonnermann, H. M., and Manga, M., 2003, Explosive volcanism may not be an
inevitable consequence of magma fragmentation: Nature, v. 426, no. 6965, p. 432-
435.
Gonnermann, H. M., and Manga, M., 2005, Flow banding in obsidian: A record of
evolving textural heterogeneity during magma deformation: Earth and Planetary
Science Letters, v. 236, no. 1-2, p. 135-147.
Gottsmann, J., and Dingwell, D. B., 2001, The cooling of frontal flow ramps: a
calorimetric study on the Rocche Rosse rhyolite flow, Lipari, Aeolian Islands,
Italy: Terra Nova, v. 13, p. 157-164.
Holland, A. S. P., Watson, I. M., Phillips, J. C., Caricchi, L., and Dalton, M. P., 2011,
Degassing processes during lava dome growth: Insights from Santiaguito lava
dome, Guatemala: Journal of Volcanology and Geothermal Research, v. In Press,
Corrected Proof.
Ihinger, P. D., Hervig, R. L., and McMillan, P. F., 1994, Analytical methods for volatiles
in glasses: Reviews in Mineralogy and Geochemistry, v. 30, p. 67-121.
Jaupart, C., and Allègre, C. J., 1991, Gas content, eruption rate and instabilities of
eruption regime in silicic volcanoes: Earth and Planetary Science Letters, v. 102,
no. 3-4, p. 413-429.
Klug, C., and Cashman, K. V., 1996, Permeability development in vesiculating magmas:
implications for fragmentation: Bulletin of Volcanology, v. 58, no. 2, p. 87-100.
Lara, L. E., 2009, The 2008 eruption of the Chaiten Volcano, Chile: a preliminary report:
Andean Geology, v. 36, no. 1, p. 125-129.
Lavallée, Y., Benson, P. M., Heap, M. J., Hess, K.-U., Flaws, A., Schillinger, B.,
Meredith, P. G., and Dingwell, D. B., 2013, Reconstructing magma failure and the
degassing network of dome-building eruptions: Geology, v. 41, no. 4, p. 515-518.
Lowenstern, J. B., Bleick, H., Vazquez, J. A., Castro, J. M., and Larson, P. B., 2012,
Degassing of Cl, F, Li, and Be during extrusion and crystallization of the rhyolite
dome at Volcan Chaiten, Chile during 2008 and 2009: Bulletin of Volcanology, v.
74, no. 10, p. 2303-2319.
Lucchi, F., Tranne, C. A., and Rossi, P. L., 2010, Stratigraphic approach to geological
mapping of the late Quaternary volcanic island of Lipari (Aeolian archipelago,
southern Italy): Geological Society of America Special Papers, v. 464, p. 1-32.
ACC
EPTE
D M
ANU
SCR
IPT
ACCEPTED MANUSCRIPT
27
Manley, C. R., and Fink, J. H., 1987, Internal textures of rhyolites flows as revealed by
research drilling: Geology, v. 15, p. 549-552.
Marti, J., Soriano, C., and Dingwell, D. B., 1999, Tube pumices as strain markers of the
ductile-brittle transition during magma fragmentation: Nature, v. 402, no. 6762, p.
650-653.
Mueller, S., Melnik, O., Spieler, O., Scheu, B., and Dingwell, D. B., 2005, Permeability
and degassing of dome lavas undergoing rapid decompression: An experimental
determination: Bulletin of Volcanology, v. 67, no. 6, p. 526-538.
Newman, S., Epstein, S., and Stolper, E., 1988, Water, carbon dioxide, and hydrogen
isotopes in glasses from the ca. 1340 A.D. eruption of the Mono Craters,
California: Constraints on degassing phenomena and initial volatile content:
Journal of Volcanology and Geothermal Research, v. 35, no. 1-2, p. 75-96.
Newman, S., Stolper, E. M., and Epstein, S., 1986, Measurement of water in rhyolitic
glasses: calibration of an infrared spectroscopic technique: American
Mineralogist, v. 71, p. 1521-1541.
Okumura, S., Nakamura, M., Nakano, T., Uesugi, K., and Tsuchiyama, A., 2010, Shear
deformation experiments on vesicular rhyolite: Implications for brittle fracturing,
degassing, and compaction of magmas in volcanic conduits: Journal of
Geophysical Research, v. 115, no. B6, p. B06201.
Okumura, S., Nakamura, M., Takeuchi, S., Tsuchiyama, A., Nakano, T., and Uesugi, K.,
2009, Magma deformation may induce non-explosive volcanism via degassing
through bubble networks: Earth and Planetary Science Letters, v. 281, no. 3-4, p.
267-274.
Okumura, S., Nakamura, M., Uesugi, K., Nakano, T., and Fujioka, T., 2013, Coupled
effect of magma degassing and rheology on silicic volcanism: Earth and Planetary
Science Letters, v. 362, p. 163-170.
Pallister, J. S., Diefenbach, A. K., Burton, W. C., Munoz, J., Griswold, J. P., Lara, L. E.,
Lowenstern, J. B., and Valenzuela, C. E., 2013, The Chaiten rhyolite lava dome:
Eruption sequence, lava dome volumes, rapid effusion rates and source of the
rhyolite magma: Andean Geology, v. 40, no. 2, p. 277-294.
Rust, A., and Cashman, K., 2007, Multiple origins of obsidian pyroclasts and
implications for changes in the dynamics of the 1300 B.P. eruption of Newberry
Volcano, USA: Bulletin of Volcanology, v. 69, p. 825-845.
Rust, A. C., and Cashman, K. V., 2004, Permeability of vesicular silicic magma: inertial
and hysteresis effects: Earth and Planetary Science Letters, v. 228, no. 1-2, p. 93-
107.
Rust, A. C., and Cashman, K. V., 2011, Permeability controls on expansion and size
distributions of pyroclasts: Journal of Geophysical Research, v. 116, B11202, doi:
10.1029/2011JB008494.
Rust, A. C., Cashman, K. V., and Wallace, P. J., 2004, Magma degassing buffered by
vapor flow through brecciated conduit margins: Geology, v. 32, no. 4, p. 349-352.
Saar, M. O., and Manga, M., 1999, Permeability-porosity relationship in vesicular
basalts: Geophys. Res. Lett., v. 26, no. 1, p. 111-114.
Schipper, C. I., Castro, J. M., Tuffen, H., James, M. R., and How, P., 2013, Shallow vent
architecture during hybrid explosive-effusive activity at Cordón Caullé (Chile,
ACC
EPTE
D M
ANU
SCR
IPT
ACCEPTED MANUSCRIPT
28
2011-12): Evidence from direct observations and pyroclast textures: Journal of
Volcanology and Geothermal Research, v. 262, p. 25-37.
Shea, T., Gurioli, L., and Houghton, B.F., 2012, Transitions between fall phases and
pyroclastic density currents during the AD 79 eruption at Vesuvius: building a
transient conduit model from the textural and volatile record: Bulletin of
Volcanology, v. 74, p. 2363-2381.
Sparks, R. S. J., 2003, Dynamics of magma degassing: Geological Society, London,
Special Publications, v. 213, no. 1, p. 5-22.
Spieler, O., Kennedy, B., Kueppers, U., Dingwell, D. B., Scheu, B., and Taddeucci, J.,
2004, The fragmentation threshold of pyroclastic rocks: Earth and Planetary
Science Letters, v. 226, p. 139-148.
Stasiuk, M. V., Barclay, J., Carroll, M. R., Jaupart, C., Ratté, J. C., Sparks, R. S. J., and
Tait, S. R., 1996, Degassing during magma ascent in the Mule Creek vent (USA):
Bulletin of Volcanology, v. 58, no. 2, p. 117-130.
Stevenson, R. J., Briggs, R. M., and Hooder, A. P. W., 1994, Physical volcanology and
emplacement history of the Ben-Lomond rhyolite lava flow, Taupo volcanic
center, New Zealand: Journal of Geology and Geophysics, v. 37, p. 345-358.
Takeuchi, S., Nakashima, S., and Tomiya, A., 2008, Permeability measurements of
natural and experimental volcanic materials with a simple permeameter: Toward
an understanding of magmatic degassing processes: Journal of Volcanology and
Geothermal Research, v. 177, no. 2, p. 329-339.
Tranne, C., Lucchi, F., Calanchi, N., Lanzafame, G., and Rossi, P. L., 2002, Geological
map of the island of Lipari (Aeolian Island, Italy): L.A.C. Firenze. 2002.
Tuffen, H., and Castro, J. M., 2009, The emplacement of an obsidian dyke through thin
ice: Hrafntinnuhryggur, Krafla Iceland: Journal of Volcanology and Geothermal
Research, v. 185, no. 4, p. 352-366.
Tuffen, H., and Dingwell, D., 2005, Fault textures in volcanic conduits: evidence for
seismic trigger mechanisms during silicic eruptions: Bulletin of Volcanology, v.
67, no. 4, p. 370-387.
Tuffen, H., Dingwell, D. B., and Pinkerton, H., 2003, Repeated fracture and healing of
silicic magma generate flow banding and earthquakes?: Geology, v. 31, no. 12, p.
1089-1092.
Tuffen, H., Owen, J., and Denton, J., 2010, Magma degassing during subglacial eruptions
and its use to reconstruct palaeo-ice thicknesses: Earth-Science Reviews, v. 99, p.
1-18.
Villemant, B., and Boudon, G., 1998, Transition from dome-forming to plinian eruptive
styles controlled by H2O and Cl degassing: Nature, v. 392, no. 6671, p. 65-69.
Von Aulock, F. W., Nichols, A. R. L., Kennedy, B., and Oze, C., 2013, Timescales of
texture development in a cooling lava dome: Geochimica et Cosmochimica Acta,
v. 114, p. 72-80.
Watkins, J. M., Manga, M., and DePaolo, D. J., 2012, Bubble geobarometry: A record of
pressure changes, degassing, and regassing at Mono Craters, California: Geology,
v. 40, no. 8, p. 699-702.
Watt, S. F. L., Pyle, D. M., and Mather, T. A., 2013, Evidence of mid-to late-Holocene
explosive rhyolitic eruptions from Chaiten Volcano, Chile: Andean Geology, v.
40, no. 2, p. 216-226.
ACC
EPTE
D M
ANU
SCR
IPT
ACCEPTED MANUSCRIPT
29
Weaire, D., 2008, The rheology of foam: Current Opinion in Colloid & Interface Science,
v. 13, no. 3, p. 171-176.
Westrich, H. R., Stockman, H. W., and Eichelberger, J. C., 1988, Degassing of rhyolitic
magma during ascent and emplacement: Journal of Geophysical Research, v. 93,
p. 6503-6511.
Wright, H. M. N., Roberts, J. J., and Cashman, K. V., 2006, Permeability of anisotropic
tube pumice: Model calculations and measurements: Geophys. Res. Lett., v. 33,
no. 17, L17316.
Wright, H. M. N., and Weinberg, R. F., 2009, Strain localization in vesicular magma:
Implications for rheology and fragmentation: Geology, v. 37, p. 1023-1026.
Yoshimura, S., and Nakamura, M., 2008, Diffusive dehydration and bubble resorption
during open-system degassing of rhyolitic melts: Journal of Volcanology and
Geothermal Research, v. 178, no. 1, p. 72-80.
Yoshimura, S., and Nakamura, M., 2010, Fracture healing in a magma: An experimental
approach and implications for volcanic seismicity and degassing: Journal of
Geophysical Research. Solid Earth, v. 115, B09209, doi:10.1029/2009JB000834.
Zhang, Y., Jenkins, J., and Xu, Z., 1997, Kinetics of the reaction + O – 2OH in
rhyolitic glasses upon cooling: Geospeedometry and comparison with glass
transition: Geochemica et Cosmochimica Acta, v. 61, p. 2167-2173.
ACC
EPTE
D M
ANU
SCR
IPT
ACCEPTED MANUSCRIPT
30
FIGURE CAPTIONS
Figure 1. a) Schematic map of the Aeolian Islands in southern Italy. The box in the left
top corner shows the location of the islands, b) Lipari Island in the top left corner and the
extension of the Monte Pilato-Rocche Rosse deposits in the centre, modified from
(Tranne et al., 2002); the box on the right is an idealised lithologic column representing
the vertical distribution and contact relationships for the Monte Pilato-Rocche Rosse
deposits, modified from Dellino and La Volpe (1995).
Figure 2. Examples of the Monte Pilato pyroclasts: a) white tube pumice, b) foamed
obsidian, c) dense obsidian.
Figure 3. H2O content of samples from the different eruptive centres corresponding to the
Monte Pilato-Rocche Rosse sequences and related textural product types. Letters and
numbers on horizontal axis are sample labels, vertical lines separate each eruptive centre.
* = FTIR H2O values from Cabrera et al. (2011); ** = FTIR H2O values from Gottsmann
and Dingwell (2001); *** = FTIR H2O data from Davi et al. (2010).
Figure 4: Healed faults in obsidian glass. a) Edge of a breadcrusted obsidian pyroclastic
bomb from Lami cone (sample RRT). Black is obsidian glass and white is vesiculated
glass. White lines depict the shape and position of the two wafers in (b). b) 900 and 1000
μm thick wafers from pyroclast in (a) covering parts of a 3cm-long fault. Light grey is
clean glass, dusty bands are microlite-rich glass, and black irregular patches are vesicles
ACC
EPTE
D M
ANU
SCR
IPT
ACCEPTED MANUSCRIPT
31
and voids. On right-hand-side, interpretative black lines represent microlite-rich bands,
and white polygons indicate vesicle-rich domains. Note vesicles concentrated at the hinge
of drag folds. White dashed line marks position of fault and black half-arrows indicate
movement sense. c) Fault (white arrow) in obsidian pyroclast from Rocche Rosse tephra.
Black bands are obsidian and grey bands are tuffisite. d) Scanned thin section of (c),
white is obsidian, and grey is tuffisite. Note truncation, dragging and displacement of
bands by fault. White square marks the area shown in (e). e) Detail of (d) showing
truncation and displacement of tuffisite and obsidian bands across a crenulated fault plane
indicating resumption of viscous behavior after faulting. Half arrows in (d) and (e)
indicate movement sense on fault interpreted from asymmetric crenulation and dragging
of banding.
Figure 5: Vesicular tuffisite obsidian pyroclast, from Rocche Rosse sequence (sample
Li07-01): a) fragment of a large (~1m) obsidian pyroclast containing light grey tuffisite
bands that include elongate and asymmetric obsidian clasts. Morphology of these clasts
indicates shearing wrapped by foliation in fine matrix. b) Enlargement of (a). Vesicles in
pumiceous domains are elongated parallel to the double-pointed arrow on the right-hand-
side of image. We interpret these features to indicate stretching of low pressure,
vesiculated bands. c) In some cases, obsidian clasts in tuffisite preserve jig-saw fit
textures.
Figure 6: Banded tuffisite obsidian pyroclasts, Rocche Rosse sequence: a) hand specimen
of obsidian pyroclast sample RRT with black obsidian bands and grey clastic bands
ACC
EPTE
D M
ANU
SCR
IPT
ACCEPTED MANUSCRIPT
32
(tuffisite). (b) to (f) are photomicrographs from sample in (a). b) Brown dusty clasts rich
in oxide microlites surrounded by light grey, clean regions of oxide-free glass. Fine bands
define flow into a pressure shadow around the dusty clasts. c) Brown dusty matrix with
large and small clean white clasts. Dashed circle depicts jig-saw fit in situ fragmentation.
d) Elongated large white and brown dusty clasts. Brown clasts host smaller white
fragments. e) Complex folding and stretching of both white and dusty clasts. Combined,
microstructures suggest this was a multiple breccia of the two types of melt (dusty brown
and clear obsidian) and the strained aspect of clasts, particularly in (e), suggest post-
brecciation flow.
Figure 7: Faults in sample of dense obsidian Li07-64 from Rocche Rosse lava flow.
Black is obsidian, vesicle-rich bands are in white and thin, crenulated white lines are
different fault sets. White sub-horizontal crenulated lines are early faults (continuous
arrow) that together with vesicle-rich bands are displaced by two later faults from upper
right to lower left (dashed arrow).
Figure 8: a) Subplanar breccia zones marked by dashed lines in the flow front of the
Rocche Rosse lava flow (2 km away from vent, in the vicinity of Aquacalda). Breccias is
composed of welded clastic material derived from abrasion of the walls. Clasts are
elongate and irregular in shape. Rectangle indicates location of (b). b) Large (~1.5 metre
long) devitrified obsidian clast at the wall of the breccia zone broken in situ into smaller
clasts. c-e) Photomicrographs (plane polarized light) of obsidian matrix. White
(transparent) is glass, black is oxides. Arrow in (e) points to an elongate vesicle (in 2D).
ACC
EPTE
D M
ANU
SCR
IPT
ACCEPTED MANUSCRIPT
33
Small dark ellipses are high aspect ratio micro-vesicles and thin brown lines are
concentrations of elongate micro-vesicles in 2D. Note truncation planes in (d) and tight
folds in (e) indicated by white line.
Figure 9: Sharp discontinuities between textural domains in pumice pyroclasts in 2D. a)
Backscattered electron (BSE) image of a pyroclast from Rocche Rosse sequence: an
irregular band of sheared vesicles in the top third of photomicrograph showing
asymmetry indicative of top-to-the-right movement, sharply separated from a region
below of roughly circular vesicles. b) Photomicrograph (plane polarized light) from a
pyroclast sample from Lami cone: stretched and folded vesicles define a spiral
surrounded by zones of roughly circular vesicles. (c) BSE image of Monte Pilato tube
pumice pyroclasts with a sharp boundary above and below a central kernel with circular
vesicles. d) BSE image of same sample as (c): three bands of strongly stretched vesicles
(high strain zones, HS) forming tube pumice (top, middle and bottom) interlayered with
two bands of moderately to weakly stretched vesicles with stair-stepping foliation (low
strain zones, LS) indicative of shearing with top to the left. Note three kernels in these
two bands where vesicles are rounded. Line drawing shows interpretation of image,
including asymmetric vesicles. Sharp changes in vesicle aspect ratio between textural
domains suggest regions with different strain histories. These regions are interpreted to
represent re-healed pumice clasts.
Figure 10. Healed fractures in pyroclastic obsidian from Lami and Rocche Rosse lava
flow and associated H2O content variations. a) Thick wafer from sample L01-Lami
ACC
EPTE
D M
ANU
SCR
IPT
ACCEPTED MANUSCRIPT
34
(shown in Fig. 4; see also Fig. 5b and Cabrera et al., 2011). Dashed line marks a fault that
truncates banding. Black circles and values mark three selected synchrotron FTIR
measurements of H2O content with a minimum at the fault (0.61 wt %). Black arrows
indicate movement sense on fault; white arrow highlights a devitrified healed glassy clast.
b) Raw SFTIR molecular H2O distribution from the 5200 cm-1
absorption band
corresponding to two transects plotted side-by-side as a single band (Cabrera et al., 2011)
across fault in (a). Black dots mark position of the three values in (a). c) Rocche Rosse
lava flow: wafer 120 μm thick, from sample in Fig. 7, marking position of FTIR transects
across two faults (black lines). Medium grey is obsidian and light grey are open vesicles.
Black marks oxides. White rectangle shows the position of the 64 x 64 pixel focal plan
array H2O maps with a pixel size of 5.5 μm shown in (e) and (f). d) 3D representation of
H2O concentration distribution. H2O content variations define two troughs spatially
coincident with the trace of the two faults shown in (c) area 1 covered by the two black
lines. Area is a mosaiced tile 700 by 352 μm across obtained by the 64 x 64 MCT Focal
Plane Array detector. Colours represent different H2O contents according to IR
absorption peak heights for the 3570 cm-1
absorption band. Blue and green colours
represent minimum values and yellow to red colours represent maximum values. Narrow
positive red peaks match oxides in glass. (e) Plan view image of the raw data of H2O
variation. Red box is a zoom into the healed fault trace shown in (f). f) Photomicrograph
of the area highlighted by white rectangle in (c), overlain by the raw data of H2O
variation. Grey is obsidian, black is devitrified products, and random black points are
oxides. Fracture plane is discontinuous and marked by concentration of black oxides. g)
ACC
EPTE
D M
ANU
SCR
IPT
ACCEPTED MANUSCRIPT
35
3D representation of H2O concentration distribution for the area covered in (e) and (f)
covering 352 x 352 μm.
Figure 11: H2O variations in Banded tuffisite obsidian from the Rocche Rosse pyroclasts:
a) Wafer 92 μm thick from sample RRT. The rectangle highlights the area of two parallel
synchrotron FTIR H2O transects. Each transect (A to B, red dot-line) and points (dots) are
spaced at 10 μm. White is obsidian glass, brown is welded tuffisite, b) H2O profile for
transect A-B with calculated H2O content values (average between the two parallel
transects). H2O decreases gradually from A to B. The H2O content in the clast-free
obsidian band at A is ~0.08 wt% higher than the clast-rich band near B. Standard
deviation for H2O content at each point is < 0.002 wt%. Dashed vertical lines separate
boundaries between bands free of clastic material and bands rich in clasts.
Table 1. H2O content variations (wt %) in obsidian glass from explosive and effusive
products. Samples listed from oldest (Lami samples) on top, to youngest (Roche Rosse)
on bottom of table. FTIR H2O values with standard variations performed on glass of
eruptive products and different techniques used for measurements. Zhang et al. method
refers to calculation of water concentration using 4520 and 5230 peaks (Zhang et al.
1999). Array = plane focal array; SFTIR = synchrotron FTIR; n = number of analyses; σ
= standard deviation. Last column shows the ratio of obtained absorption peaks at 4520
and 5230 cm-1
. Note: table includes two FTIR H2O values out of ten reported in
Gottsmann and Dingwell (2001), and four out of ten reported in Davi et al. (2010). For

ACC
EPTE
D M
ANU
SCR
IPT
ACCEPTED MANUSCRIPT
36
sample RRT we only show maximum value out of a large (300 analyses) set of data
shown in Fig. 11b.
ACC
EPTE
D M
ANU
SCR
IPT
ACCEPTED MANUSCRIPT
37
Fig 1
ACC
EPTE
D M
ANU
SCR
IPT
ACCEPTED MANUSCRIPT
38
Fig 2
ACC
EPTE
D M
ANU
SCR
IPT
ACCEPTED MANUSCRIPT
39
Fig 3
ACC
EPTE
D M
ANU
SCR
IPT
ACCEPTED MANUSCRIPT
40
Fig 4
ACC
EPTE
D M
ANU
SCR
IPT
ACCEPTED MANUSCRIPT
41
Fig 5
ACC
EPTE
D M
ANU
SCR
IPT
ACCEPTED MANUSCRIPT
42
Fig 6
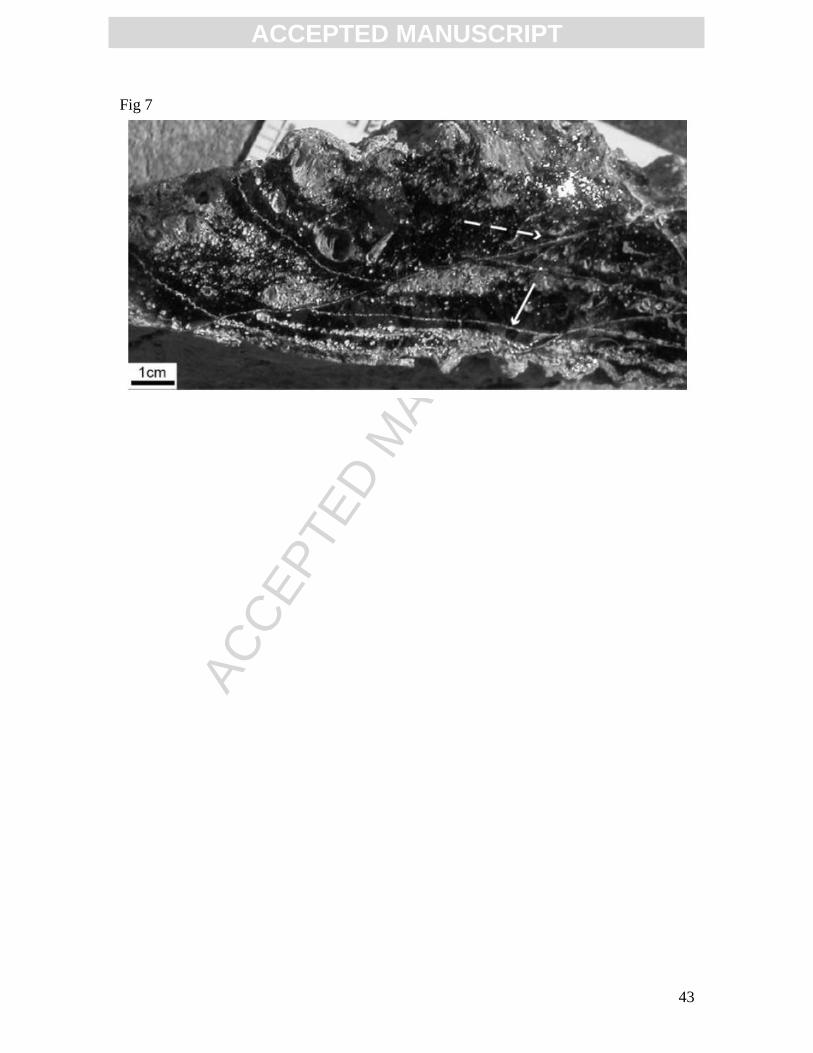
ACC
EPTE
D M
ANU
SCR
IPT
ACCEPTED MANUSCRIPT
43
Fig 7
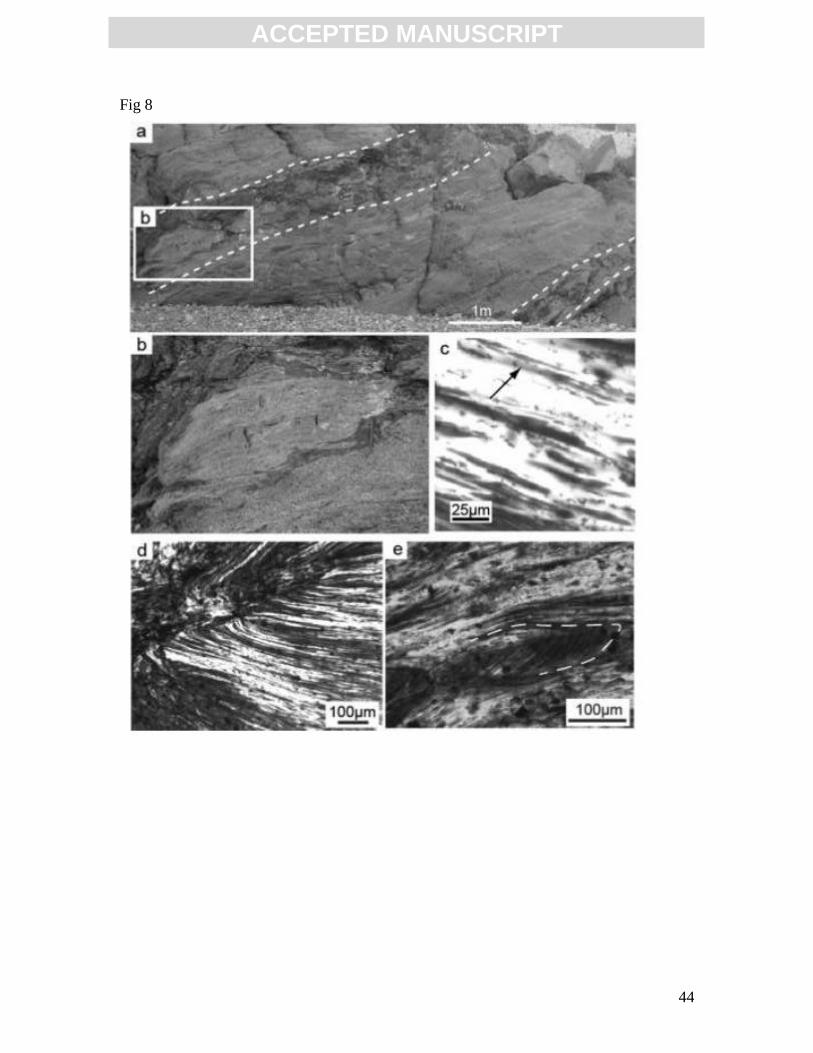
ACC
EPTE
D M
ANU
SCR
IPT
ACCEPTED MANUSCRIPT
44
Fig 8
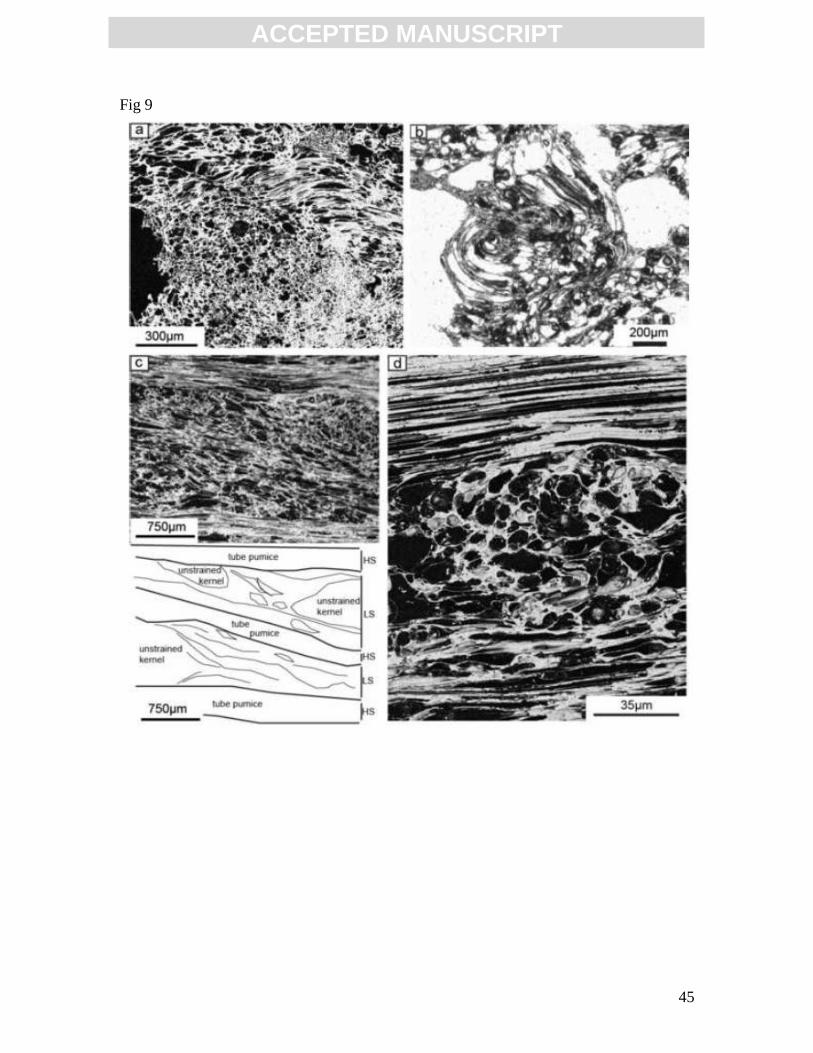
ACC
EPTE
D M
ANU
SCR
IPT
ACCEPTED MANUSCRIPT
45
Fig 9
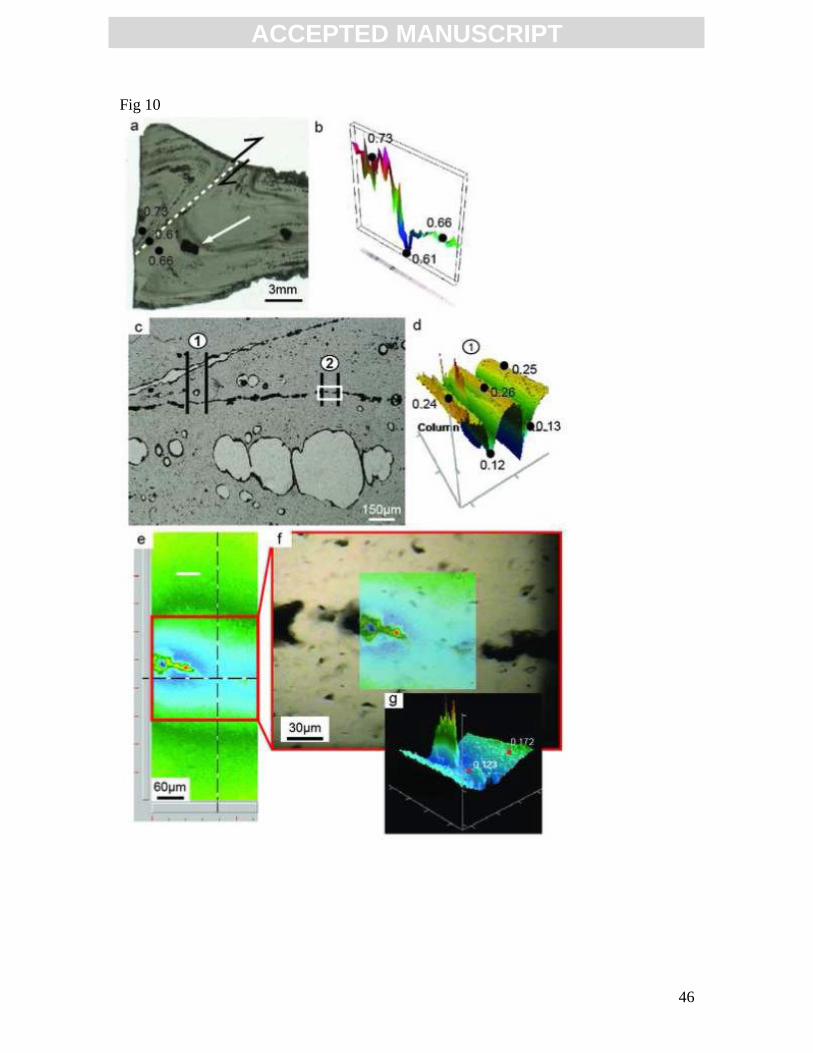
ACC
EPTE
D M
ANU
SCR
IPT
ACCEPTED MANUSCRIPT
46
Fig 10
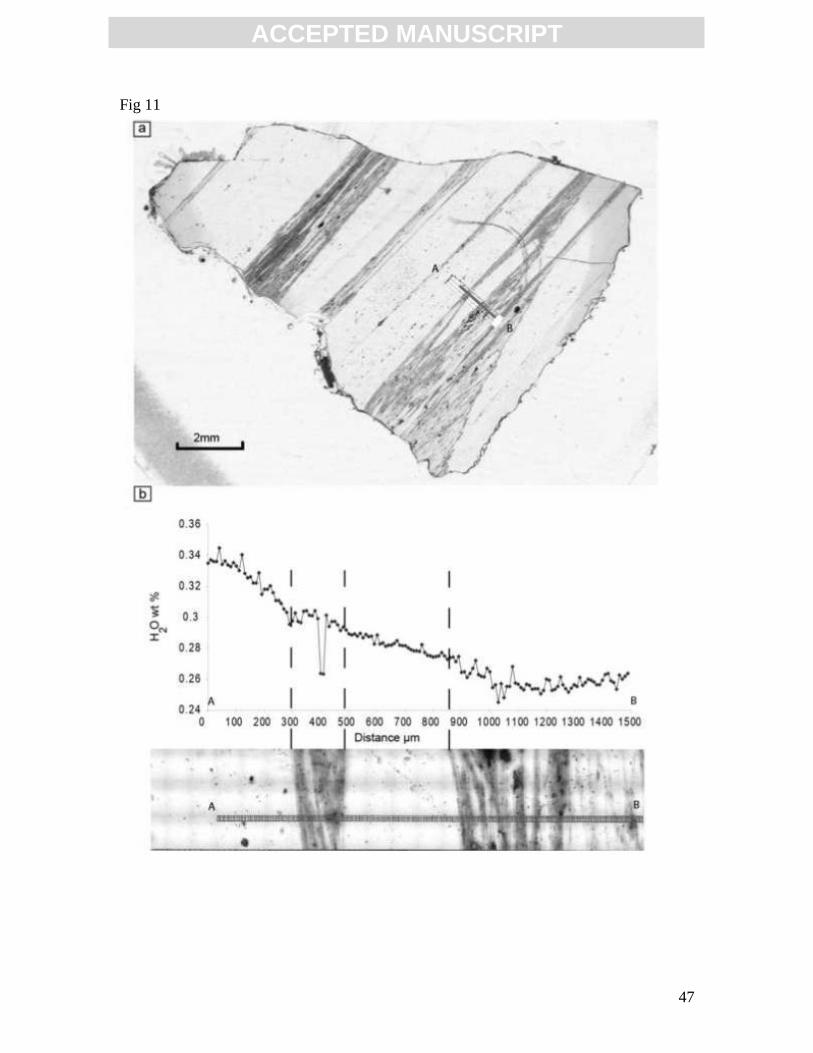
ACC
EPTE
D M
ANU
SCR
IPT
ACCEPTED MANUSCRIPT
47
Fig 11
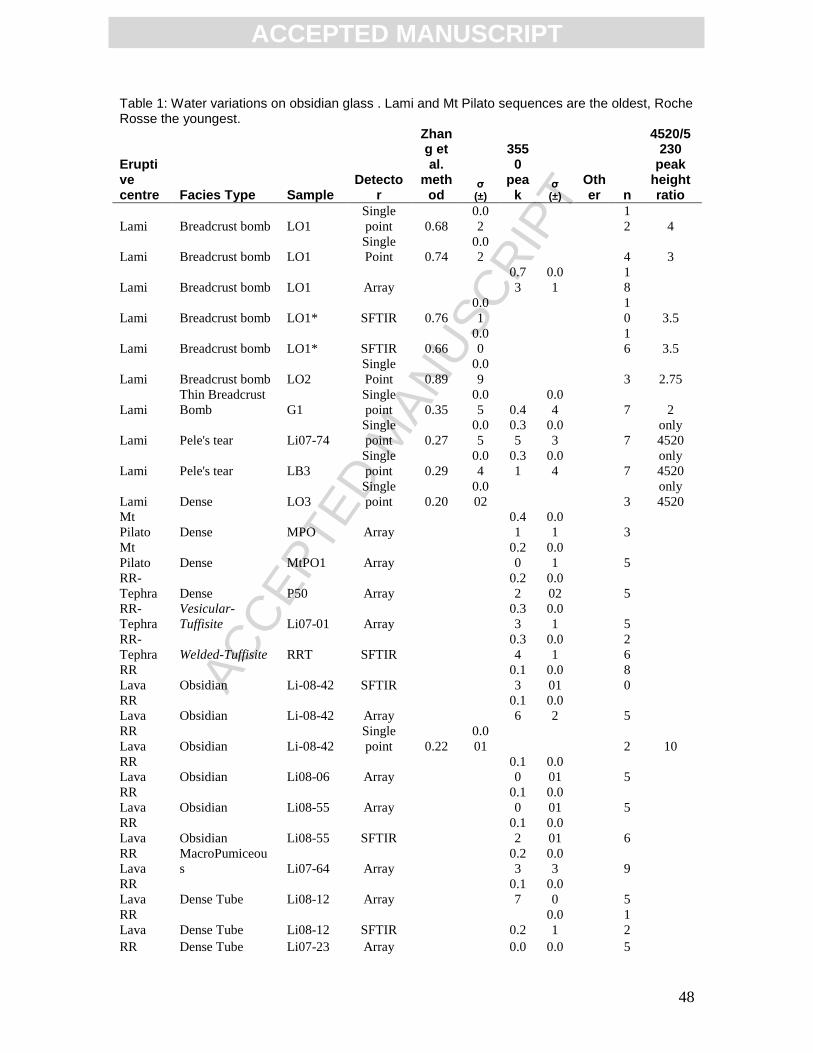
ACC
EPTE
D M
ANU
SCR
IPT
ACCEPTED MANUSCRIPT
48
Table 1: Water variations on obsidian glass . Lami and Mt Pilato sequences are the oldest, Roche Rosse the youngest.
Eruptive centre Facies Type Sample
Detector
Zhang et al.
method
σ (±)
3550
peak
σ (±)
Other n
4520/5230
peak height ratio
Lami Breadcrust bomb LO1
Single
point 0.68
0.0
2
1
2 4
Lami Breadcrust bomb LO1
Single
Point 0.74
0.0
2
4 3
Lami Breadcrust bomb LO1 Array
0.7
3
0.0
1
1
8
Lami Breadcrust bomb LO1* SFTIR 0.76
0.0
1
1
0 3.5
Lami Breadcrust bomb LO1* SFTIR 0.66
0.0
0
1
6 3.5
Lami Breadcrust bomb LO2
Single
Point 0.89
0.0
9
3 2.75
Lami
Thin Breadcrust
Bomb G1
Single
point 0.35
0.0
5 0.4
0.0
4
7 2
Lami Pele's tear Li07-74
Single
point 0.27
0.0
5
0.3
5
0.0
3
7
only
4520
Lami Pele's tear LB3
Single
point 0.29
0.0
4
0.3
1
0.0
4
7
only
4520
Lami Dense LO3
Single
point 0.20
0.0
02
3
only
4520
Mt
Pilato Dense MPO Array
0.4
1
0.0
1
3
Mt
Pilato Dense MtPO1 Array
0.2
0
0.0
1
5
RR-
Tephra Dense P50 Array
0.2
2
0.0
02
5
RR-
Tephra
Vesicular-
Tuffisite Li07-01 Array
0.3
3
0.0
1
5
RR-
Tephra Welded-Tuffisite RRT SFTIR
0.3
4
0.0
1
2
6
RR
Lava Obsidian Li-08-42 SFTIR
0.1
3
0.0
01
8
0
RR
Lava Obsidian Li-08-42 Array
0.1
6
0.0
2
5
RR
Lava Obsidian Li-08-42
Single
point 0.22
0.0
01
2 10
RR
Lava Obsidian Li08-06 Array
0.1
0
0.0
01
5
RR
Lava Obsidian Li08-55 Array
0.1
0
0.0
01
5
RR
Lava Obsidian Li08-55 SFTIR
0.1
2
0.0
01
6
RR
Lava
MacroPumiceou
s Li07-64 Array
0.2
3
0.0
3
9
RR
Lava Dense Tube Li08-12 Array
0.1
7
0.0
0
5
RR
Lava Dense Tube Li08-12 SFTIR
0.2
0.0
1
1
2
RR Dense Tube Li07-23 Array
0.0 0.0
5
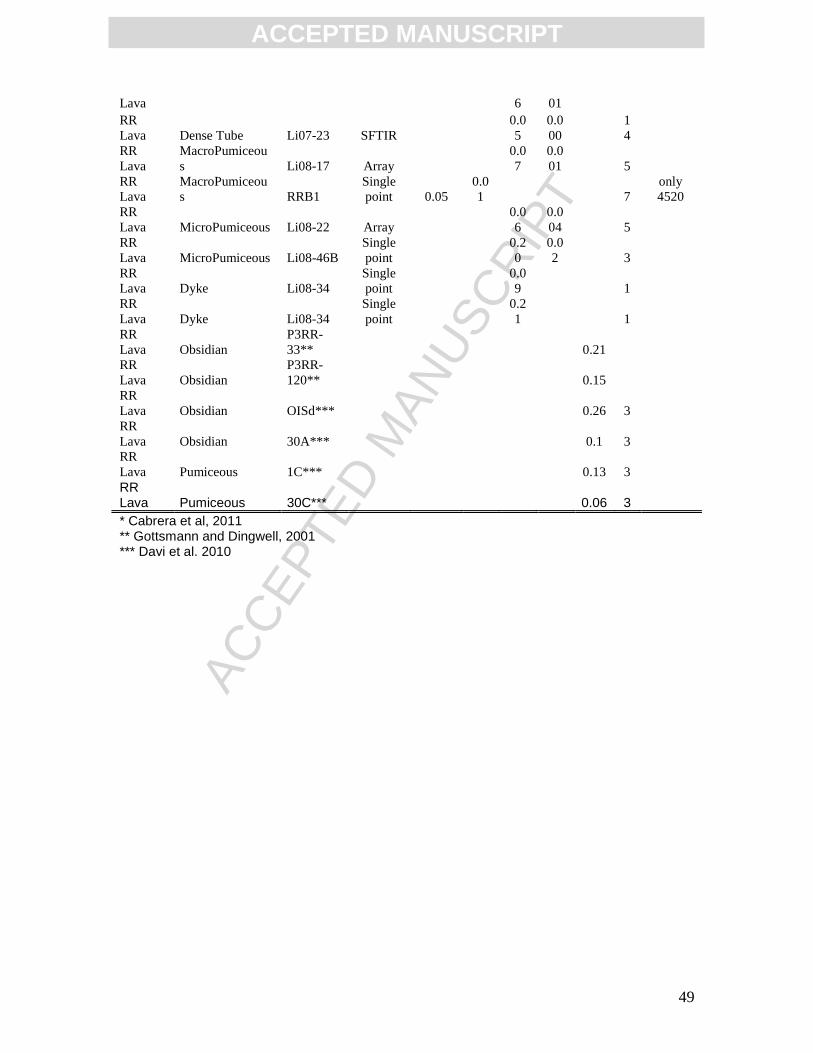
ACC
EPTE
D M
ANU
SCR
IPT
ACCEPTED MANUSCRIPT
49
Lava 6 01
RR
Lava Dense Tube Li07-23 SFTIR
0.0
5
0.0
00
1
4
RR
Lava
MacroPumiceou
s Li08-17 Array
0.0
7
0.0
01
5
RR
Lava
MacroPumiceou
s RRB1
Single
point 0.05
0.0
1
7
only
4520
RR
Lava MicroPumiceous Li08-22 Array
0.0
6
0.0
04
5
RR
Lava MicroPumiceous Li08-46B
Single
point
0.2
0
0.0
2
3
RR
Lava Dyke Li08-34
Single
point
0.0
9
1
RR
Lava Dyke Li08-34
Single
point
0.2
1
1
RR
Lava Obsidian
P3RR-
33**
0.21
RR
Lava Obsidian
P3RR-
120**
0.15
RR
Lava Obsidian OISd***
0.26 3
RR
Lava Obsidian 30A***
0.1 3
RR
Lava Pumiceous 1C***
0.13 3
RR Lava Pumiceous 30C*** 0.06 3
* Cabrera et al, 2011 ** Gottsmann and Dingwell, 2001 *** Davi et al. 2010

ACC
EPTE
D M
ANU
SCR
IPT
ACCEPTED MANUSCRIPT
50
Highlights
Fracturing and healing of melts occur in different stages of a rhyolitic eruption
Multiple fracturing-healing events lead to brecciation and degassing
Fracture degassing decreases explosivity of the system
Multiple fracturing-healing events produce low-water content obsidian


