
1-s2.0-S0308814612005821-main
8
Study on heavy metals levels and its risk assessment in some edible fishes from Bangshi River, Savar, Dhaka, Bangladesh M. Safiur Rahman a,⇑ , A. Hossain Molla b , Narottam Saha b , Atiqur Rahman c a Environmental Analytical Chemistry Laboratory, Institute of Nuclear Science and Technology, Bangladesh Atomic Energy Commission, GPO Box 3787, Dhaka 1000, Bangladesh b Department of Applied Chemistry and Chemical Engineering, Faculty of Engineering, University of Rajshahi, Rajshahi 6205, Bangladesh c Department of Applied Chemistry and Chemical Technology, Faculty of Applied Science and Technology, Islamic University, Kushtia 7003, Bangladesh a r t i c l e i n f o Article history: Received 27 December 2011 Received in revised form 1 March 2012 Accepted 22 March 2012 Available online 30 March 2012 Keywords: Heavy metals Health risks Fish muscle Bangshi River a b s t r a c t Concentrations of eight heavy metals (Pb, Cd, Ni, Cr, Cu, Zn, Mn, and As) in the muscles of ten species of fish collected from Bangshi River at Savar in Bangladesh were measured in two different seasons. The concentrations of the studied heavy metals, except Pb in Corica soborna, were found to be below the safe limits suggested by various authorities and thus gave no indication of pollution. The present study also showed that, Zn was the most and Cd was the least accumulated metal in the studied fish muscles. ANO VA analys is clea rly reveal ed that there was a significa nt variati on (CI = 95%) of the heav y meta l concentration s in different fish species in the Bangshi River. Significant positive correlations between the heavy metal concentrations in fish muscles were also observed in both seasons. From the human he alt h po int of vie w, this stu dy sho we d tha t the re wa s no pos sib le health risk to consumers due to int ak e of studied fishes under the current consumption rate. Crown Copyright 2012 Published by Elsevier Ltd. All rights reserved. 1. Introduction Heavy metals are potentially accumulated in marine environ- me nts inclu ding wate r, sedi ments, and fish, and subs eque ntly tra nsf err ed to hum an beings thr ough thefood cha in. The consump- tion of fish has incr ease d in imp orta nce among the heal th con- scious due to the ir hig h pr ote in sup pl y, low satur ate d fat and omega fatty acids content that are known to contribute to good he alt h (Copat et al., 2012). However , heavy me tals po lluti on in fish has become an important worldwide concern, not only because of the threat to fish, but also due to the health risks associated with fish consumption. For example, lead causes renal failure and liver damage (Lee et al., 2011; Luckey & Venugopal, 1977 ). Moreover, prolonged exposure to lead will result in coma, mental retardation and even de ath (Al- Busa idi et al., 2011). Cadmium injures the kid ney and caus e symptom s of chro nic toxi city, incl udin g imp aire d kid ney func tion, poo r reprod uctiv e capa city, hype rten sion, tu- mours and hepatic dysfunction (Al-Busaidi et al., 2011; Luckey & Ven ugop al, 197 7; Rah man & Islam , 2010 ). Some oth er me tal s (e.g. chromium, zinc, and cop per ) cause nephri tis, anur ia and ex ten siv e les ion s in the kid ne y (Luc key & Ve nug opal, 197 7; Rahman & Islam , 2009 ). Ther efor e, the pro blem of heavy met al contamination in fishes is increasing global attention. The inc re ase d ind ust ria liz ati on, urb aniza tio n, po pulat ion growth and over all ma n’s gree d to exp loit Mother Nature has aggr avat ed the pol lutio n. H eavy met als disc harg ed into the mar ine environment (Rahman, Molla, & Arafat, 2010) can damage marine species diversity as well as ecosystems, due to their toxicity, long persistence, and accumulative behavior (Ebrahim pour, Pourkhab - baz, Baramaki, Babaei, & Rezaei, 2011; Saha & Zaman, 2011), and finally assimilated by human consumers resulting in health risks. The concern is growing more and more serious globally especially in developing countries (Chen, Qian, Chen, & Li, 2011). Among the bioindicators of aquatic ecosystem, fishes are often deemed as the most suitable objects because they occupy high trophic level and ar e impo rta nt foo d so urc e of human po pulat io n (Abdel-B aki, Dkhil, & Al-Quraishy, 2011). Metal content in the tissues and organs of fishes indi cates the conc entr ations of metals in wate r and their accu mul atio n in foo d chai ns (Pintaeva, Bazarsadueva, Radnaeva , Pertov, & Smirnova, 2011). Fishes are well-known for their ability to conc entr ate heav y me tals in thei r mus cles . Ther efore, in this study we selected muscles as a primary site of metal uptake and since fishes are integral component of human diet, they need to carefully screened to ensure that unnecessary high level of heavy metals are not being tran sfer red to human pop ulati on via con- sumption of fish. The objective of this study was to assess contamination status of eight heavy metals in the muscles of ten common fish species in Bang shi Rive r, clos e to Dha ka Exp ort Process ing Zon e (DE PZ), Bang lade sh. An assessment on human heal th risk s due to con- sumption of those fishes has been conducted. 0308-8146/$ - see front matter Crown Copyright 2012 Published by Elsevier Ltd. All rights reserved. http://dx.doi.org/10.1016/j.foodchem.2012.03.099 ⇑ Corresp ondin g author . Address: Depar tment of Enviro nmen tal Engine ering , Faculty of Engineering, Dalhousie University. Halifax, Nova Scotia, Canada B3J 1Z1. E-mail address: safi[email protected] (M.S. Rahman). Food Chemistry 134 (2012) 1847–1854 Contents lists available at SciVerse ScienceDirect Food Chemistry journal homepage: www.elsevier.com/locate/foodchem
-
Upload
yunus-ahmed -
Category
Documents
-
view
220 -
download
0
Transcript of 1-s2.0-S0308814612005821-main
8/13/2019 1-s2.0-S0308814612005821-main
http://slidepdf.com/reader/full/1-s20-s0308814612005821-main 1/8
Study on heavy metals levels and its risk assessment in some edible fishes from
Bangshi River, Savar, Dhaka, Bangladesh
M. Safiur Rahman a,⇑, A. Hossain Molla b, Narottam Saha b, Atiqur Rahman c
a Environmental Analytical Chemistry Laboratory, Institute of Nuclear Science and Technology, Bangladesh Atomic Energy Commission, GPO Box 3787, Dhaka 1000, Bangladeshb Department of Applied Chemistry and Chemical Engineering, Faculty of Engineering, University of Rajshahi, Rajshahi 6205, Bangladeshc Department of Applied Chemistry and Chemical Technology, Faculty of Applied Science and Technology, Islamic University, Kushtia 7003, Bangladesh
a r t i c l e i n f o
Article history:
Received 27 December 2011
Received in revised form 1 March 2012
Accepted 22 March 2012
Available online 30 March 2012
Keywords:
Heavy metals
Health risks
Fish muscle
Bangshi River
a b s t r a c t
Concentrations of eight heavy metals (Pb, Cd, Ni, Cr, Cu, Zn, Mn, and As) in the muscles of ten species of
fish collected from Bangshi River at Savar in Bangladesh were measured in two different seasons. The
concentrations of the studied heavy metals, except Pb in Corica soborna, were found to be below the safe
limits suggested by various authorities and thus gave no indication of pollution. The present study also
showed that, Zn was the most and Cd was the least accumulated metal in the studied fish muscles.
ANOVA analysis clearly revealed that there was a significant variation (CI = 95%) of the heavy metal
concentrations in different fish species in the Bangshi River. Significant positive correlations between
the heavy metal concentrations in fish muscles were also observed in both seasons. From the human
health point of view, this study showed that there was no possible health risk to consumers due to intake
of studied fishes under the current consumption rate.
Crown Copyright 2012 Published by Elsevier Ltd. All rights reserved.
1. Introduction
Heavy metals are potentially accumulated in marine environ-
ments including water, sediments, and fish, and subsequently
transferred to human beings through the food chain. The consump-
tion of fish has increased in importance among the health con-
scious due to their high protein supply, low saturated fat and
omega fatty acids content that are known to contribute to good
health (Copat et al., 2012). However, heavy metals pollution in fish
has become an important worldwide concern, not only because of
the threat to fish, but also due to the health risks associated with
fish consumption. For example, lead causes renal failure and liver
damage (Lee et al., 2011; Luckey & Venugopal, 1977). Moreover,
prolonged exposure to lead will result in coma, mental retardation
and even death (Al-Busaidi et al., 2011). Cadmium injures the
kidney and cause symptoms of chronic toxicity, including impaired
kidney function, poor reproductive capacity, hypertension, tu-
mours and hepatic dysfunction (Al-Busaidi et al., 2011; Luckey &
Venugopal, 1977; Rahman & Islam, 2010). Some other metals
(e.g. chromium, zinc, and copper) cause nephritis, anuria and
extensive lesions in the kidney (Luckey & Venugopal, 1977;
Rahman & Islam, 2009). Therefore, the problem of heavy metal
contamination in fishes is increasing global attention.
The increased industrialization, urbanization, population
growth and overall man’s greed to exploit Mother Nature has
aggravated the pollution. Heavy metals discharged into the marine
environment (Rahman, Molla, & Arafat, 2010) can damage marine
species diversity as well as ecosystems, due to their toxicity, long
persistence, and accumulative behavior (Ebrahimpour, Pourkhab-
baz, Baramaki, Babaei, & Rezaei, 2011; Saha & Zaman, 2011), and
finally assimilated by human consumers resulting in health risks.
The concern is growing more and more serious globally especially
in developing countries (Chen, Qian, Chen, & Li, 2011). Among the
bioindicators of aquatic ecosystem, fishes are often deemed as the
most suitable objects because they occupy high trophic level and
are important food source of human population (Abdel-Baki, Dkhil,
& Al-Quraishy, 2011). Metal content in the tissues and organs of
fishes indicates the concentrations of metals in water and their
accumulation in food chains (Pintaeva, Bazarsadueva, Radnaeva,
Pertov, & Smirnova, 2011). Fishes are well-known for their ability
to concentrate heavy metals in their muscles. Therefore, in this
study we selected muscles as a primary site of metal uptake and
since fishes are integral component of human diet, they need to
carefully screened to ensure that unnecessary high level of heavy
metals are not being transferred to human population via con-
sumption of fish.
The objective of this study was to assess contamination status
of eight heavy metals in the muscles of ten common fish species
in Bangshi River, close to Dhaka Export Processing Zone (DEPZ),
Bangladesh. An assessment on human health risks due to con-
sumption of those fishes has been conducted.
0308-8146/$ - see front matter Crown Copyright 2012 Published by Elsevier Ltd. All rights reserved.http://dx.doi.org/10.1016/j.foodchem.2012.03.099
⇑ Corresponding author. Address: Department of Environmental Engineering,
Faculty of Engineering, Dalhousie University. Halifax, Nova Scotia, Canada B3J 1Z1.
E-mail address: [email protected] (M.S. Rahman).
Food Chemistry 134 (2012) 1847–1854
Contents lists available at SciVerse ScienceDirect
Food Chemistry
j o u r n a l h o m e p a g e : w w w . e l s e v i e r . c o m / l o c a t e / f o o d c h e m
8/13/2019 1-s2.0-S0308814612005821-main
http://slidepdf.com/reader/full/1-s20-s0308814612005821-main 2/8
2. Materials and methods
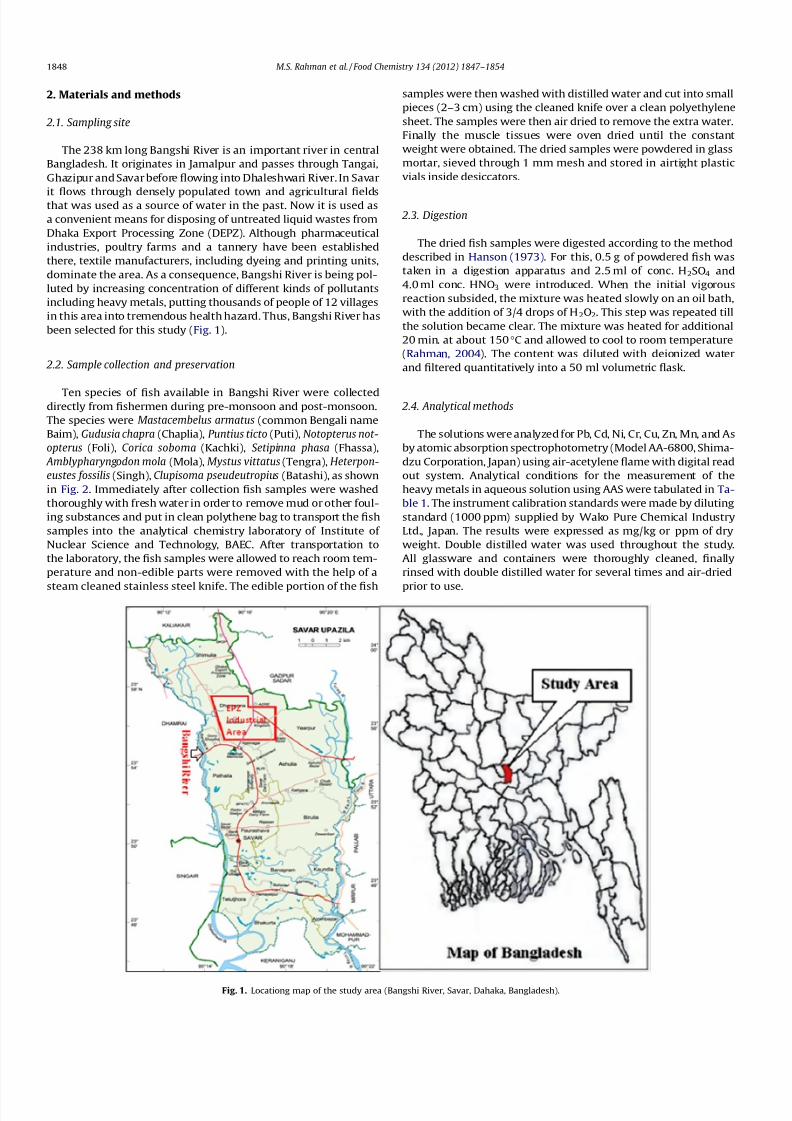
2.1. Sampling site
The 238 km long Bangshi River is an important river in central
Bangladesh. It originates in Jamalpur and passes through Tangai,
Ghazipur and Savar before flowing into Dhaleshwari River. In Savar
it flows through densely populated town and agricultural fieldsthat was used as a source of water in the past. Now it is used as
a convenient means for disposing of untreated liquid wastes from
Dhaka Export Processing Zone (DEPZ). Although pharmaceutical
industries, poultry farms and a tannery have been established
there, textile manufacturers, including dyeing and printing units,
dominate the area. As a consequence, Bangshi River is being pol-
luted by increasing concentration of different kinds of pollutants
including heavy metals, putting thousands of people of 12 villages
in this area into tremendous health hazard. Thus, Bangshi River has
been selected for this study (Fig. 1).
2.2. Sample collection and preservation
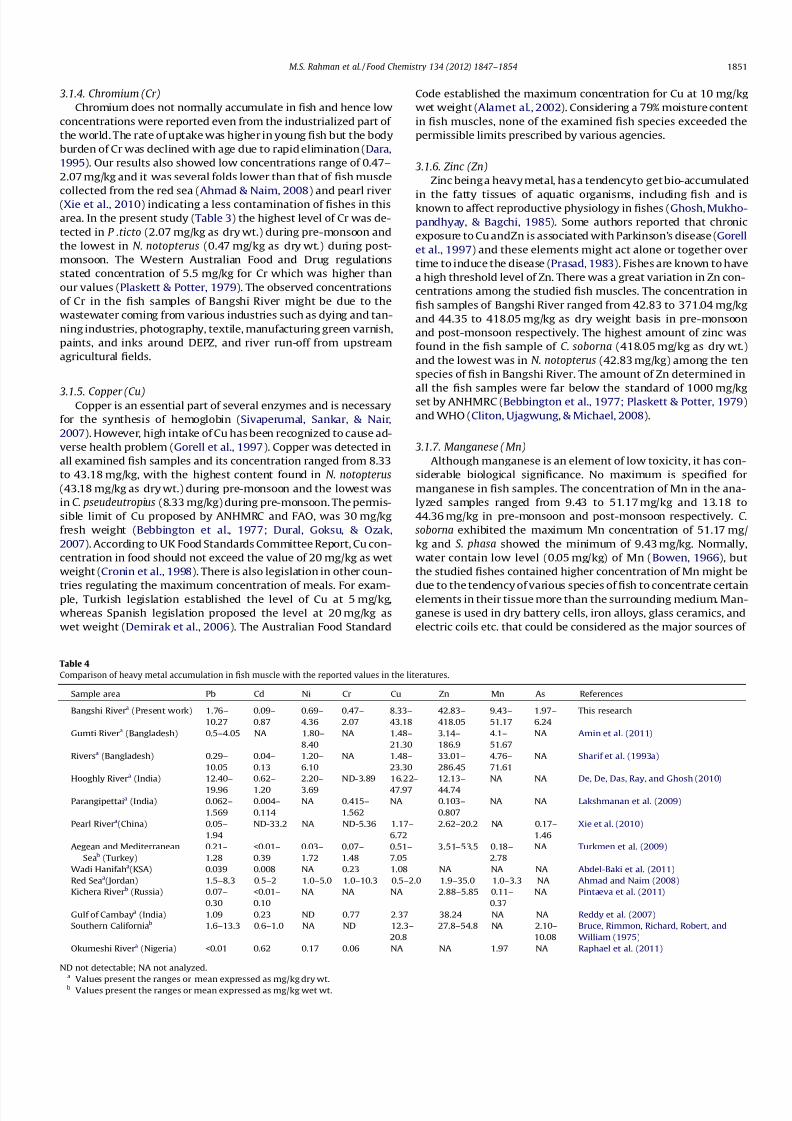
Ten species of fish available in Bangshi River were collecteddirectly from fishermen during pre-monsoon and post-monsoon.
The species were Mastacembelus armatus (common Bengali name
Baim), Gudusia chapra (Chaplia), Puntius ticto (Puti), Notopterus not-
opterus (Foli), Corica soborna (Kachki), Setipinna phasa (Fhassa),
Amblypharyngodon mola (Mola), Mystus vittatus (Tengra), Heterpon-
eustes fossilis (Singh), Clupisoma pseudeutropius (Batashi), as shown
in Fig. 2. Immediately after collection fish samples were washed
thoroughly with fresh water in order to remove mud or other foul-
ing substances and put in clean polythene bag to transport the fish
samples into the analytical chemistry laboratory of Institute of
Nuclear Science and Technology, BAEC. After transportation to
the laboratory, the fish samples were allowed to reach room tem-
perature and non-edible parts were removed with the help of a
steam cleaned stainless steel knife. The edible portion of the fish
samples were then washed with distilled water and cut into small
pieces (2–3 cm) using the cleaned knife over a clean polyethylene
sheet. The samples were then air dried to remove the extra water.
Finally the muscle tissues were oven dried until the constant
weight were obtained. The dried samples were powdered in glass
mortar, sieved through 1 mm mesh and stored in airtight plastic
vials inside desiccators.
2.3. Digestion
The dried fish samples were digested according to the method
described in Hanson (1973). For this, 0.5 g of powdered fish was
taken in a digestion apparatus and 2.5 ml of conc. H2SO4 and
4.0 ml conc. HNO3 were introduced. When the initial vigorous
reaction subsided, the mixture was heated slowly on an oil bath,
with the addition of 3/4 drops of H2O2. This step was repeated till
the solution became clear. The mixture was heated for additional
20 min. at about 150 C and allowed to cool to room temperature
(Rahman, 2004). The content was diluted with deionized water
and filtered quantitatively into a 50 ml volumetric flask.
2.4. Analytical methods
The solutions were analyzed for Pb, Cd, Ni, Cr, Cu, Zn, Mn, and As
by atomic absorption spectrophotometry (Model AA-6800, Shima-
dzu Corporation, Japan) using air-acetylene flame with digital read
out system. Analytical conditions for the measurement of the
heavy metals in aqueous solution using AAS were tabulated in Ta-
ble 1. The instrument calibration standards were made by diluting
standard (1000 ppm) supplied by Wako Pure Chemical Industry
Ltd., Japan. The results were expressed as mg/kg or ppm of dry
weight. Double distilled water was used throughout the study.
All glassware and containers were thoroughly cleaned, finally
rinsed with double distilled water for several times and air-dried
prior to use.
Fig. 1. Locationg map of the study area (Bangshi River, Savar, Dahaka, Bangladesh).
1848 M.S. Rahman et al. / Food Chemistry 134 (2012) 1847–1854

8/13/2019 1-s2.0-S0308814612005821-main
http://slidepdf.com/reader/full/1-s20-s0308814612005821-main 3/8
2.5. Accuracy check
The analytical procedure was checked using standard reference
material MA-A-2 (TM), fish flesh homogenate and MA-B-3 (TM),
lyophilized fish tissue. These fish samples were prepared and pro-
vided by the International Atomic Energy Agency (IAEA), Vienna.
The results indicated a good agreement between the certifiedand observed values. The standard deviations of the means ob-
served for the reported certified materials were between 1–7%
and the percentage recovery was between 95–106% as shown in
Table 2.
2.6. Statistical analysis
All samples were collected and analyzed in duplicate and the
duplicate tests were statistically similar is paired-samples t -test,
at 95% significance. The average results were used to represent
the data. Statistical software, Minitab 16.0 for Windows, was used
to test two-way analysis of variance (ANOVA) at 95% significance
to investigate the effect of seasons and different fish species on
variation of the metal concentrations in studied fishes. Other calcu-lations were performed by Microsoft Excel 2010.
3. Results
3.1. Heavy metal concentrations in fish muscles
Concentrations of eight heavy metals, Pb, Cd, Ni, Cr, Cu, Zn, Mn,
and As in muscle tissue of ten fish species from Bangshi River dur-
ing pre-monsoon and post-monsoon seasons were listed in Table 3.
It revealed that the ranking order of mean concentrations of the
heavy metals in the fish muscles were, Zn (168.97)> Mn
(23.77) > Cu (22.80) > Pb (4.64) > As (3.55) > Ni (2.59) > Cr (1.12) >
Cd (0.30) (mean; mg/kg dry wt.) respectively. Among the analyzed
fish samples, Pb was detected in amount ranging from 1.76–10.27,
Cd from 0.09–0.87, Ni from 0.69–4.36, Cr from 0.47–2.07, Cu from
8.33–43.18, Zn from 42.83–418.05, Mn from 9.43–51.17 and As
from 1.97–6.24 mg/kg-dry wt. basis.
3.1.1. Lead (Pb)
Lead is a non-essential element and it is well documented that
Pb can cause neurotoxicity, nephrotoxicity, and many others ad-
verse health effects (Garcia-Leston, Mendez, Pasaro, & Laffon,
2010). The details of lead concentration detected for individual fishof both seasons were given in Table 3. Among individual fish spe-
Fig. 2. Photographs of ten fish species of fishes collected from the Bangshi River, Savar, Dhaka, Bangladesh. Footnotes (Italic letter: Scientific Name, In parenthesis: Local
Name).
Table 1
Analytical conditions for measurement of heavy metals in aqueous solution using
AAS.
Elements Wavelength
(nm)
Slit
(nm)
Lamp
Current
(mA)
Mode Calibration
Range (mg/
L)
Detection
limit (mg/
L)
Pb 283.3 0.5 10 Flame 0.0–3.0 0.04
Cd 228.8 0.5 8 Flame 0.0–1.2 0.006
Ni 232.0 0.2 12 Flame 0.0–3.0 0.015Cr 357.9 0.5 10 Flame 0.0–2.0 0.01
Cu 324.8 0.2 6 Flame 0.0–3.0 0.006
Zn 213.9 0.2 8 Flame 0.0–1.6 0.005
Mn 285.2 0.5 8 Flame 0.0–2.0 0.02
As 193.7 0.5 12 HVG 0.001–
0.006
0.01
Table 2
Concentrations of metals found in Certified Reference Materials MA-A-2 (TM) and
MA-B-3 (TM) from IAEA (means ± standard errors, in mg/kg as dry wt.) by AAS (n = 3).
Element Certified value Observed value Deviation (%) Recovery (%)
MA-A-2 (TM)
Cd 0.066 ± 0.004 0.063 ± 0.01 4.55 95.45
Ni 1.1 ± 0.20 1.14 ± 0.1 3.64 103.63
Cr 1.3 ± 0.1 1.24 ± 0.0 4.62 95.38
Cu 4 ± 0.1 4.06 ± 0.31 1.50 101.5
Zn 33 ± 1.0 34 ± 0.23 3.03 103.03
Mn 0.81 ± 0.04 0.80 ± 0.01 1.23 98.77
As 2.6 ± 0.1 2.53 ± 0.24 2.69 97.31
MA-B-3 (TM)
Pb 4.62 ± 0.64 4.92 ± 0.55 6.49 106.49
Cu 3.08 ± 0.36 3.12 ± 0.38 1.30 101.30
M.S. Rahman et al. / Food Chemistry 134 (2012) 1847–1854 1849

8/13/2019 1-s2.0-S0308814612005821-main
http://slidepdf.com/reader/full/1-s20-s0308814612005821-main 4/8
cies, C. soborna (10.27 mg/kg) contained the highest lead concen-
tration during pre-monsoon whereas C. pseudeutropius (1.76 mg/
kg) contained the lowest during post-monsoon. The maximum per-
mitted concentration of Pb proposed by Australian National Health
and Medical Research Council (ANHMRC) is 2.0 mg/kg as wet
weight basis (Bebbington et al., 1977; Plaskett & Potter, 1979), that
is 9.6 mg/kg as dry weight, considering the conversion factor of 4.8(79% moisture content) for fresh weight. According to UK Lead (Pb)
in Food Regulations, Pb concentration in fish should not exceed
2 mg/kg as fresh weight basis (Cronin et al., 1998). There is also
legislation in other countries regulating the maximum concentra-
tion of metals. For instance, Spanish legislation also limits the
levels for Pb at 2 mg/kg (Demirak, Yilmaz, Tuna, & Ozdemir,
2006). The present observation showed that level of Pb in one fish
species (C. Soborna) among the ten species was beyond the pro-
posed acceptable limit for human consumption. From the litera-
ture survey, it was apparent that the fish samples of C. soborna,
was bottom living and therefore sediments could be the major
sources of Pb contamination in that fish as the mentioned fish
was almost always in contact with sediment. In addition, lead is
a ubiquitous pollutant which could finds its way into the Bangshi
River through discharge of industrial effluents from various indus-
tries such as printing, dyeing, oil refineries, and textile around
DEPZ and other sources.
3.1.2. Cadmium (Cd)
Cadmium is deemed as an element capable of producing
chronic toxicity even when it is present at concentration of 1
mg/kg (Friberg, Piscator, & Nordberg, 1971). Christensen and Olson
(1957) regard cadmium as being potentially more lethal than any
other metal. The Australian National Health and Medical Research
Council (ANHMRC) standard for Cd in seafood is 2.0 mg/kg,
whereas the Western Australian authorities proposed concentra-
tion of 5.5 mg/kg for Cd (Plaskett & Potter, 1979). Spanish legisla-
tion limits the levels for Cd at 1 mg/kg (Demirak et al., 2006). Cdconcentration in fish samples of Bangshi River ranged from 0.09
to 0.87 mg/kg and 0.16 to 0.68 mg/kg in pre-monsoon and post-
monsoon respectively. The highest amount of cadmium was found
in the fish sample of C. soborna (0.87 mg/kg) and the lowest
amount of Cd was found in the fish sample of N. notopterus
(0.09 mg/kg). From our experimental study it was vividly observed
that Cd in the selected fishes from Bangshi River were below the
above discussed standard values, but long period of accumulationof Cd in fish may pose health hazards.
3.1.3. Nickel (Ni)
Nickel normally occurs at very low levels in the environment
and it can cause variety of pulmonary adverse health effects, such
as lung inflammation, fibrosis, emphysema and tumours (Forti
et al., 2011). In the present investigation, the highest amount of
nickel was found in the fish sample of P. ticto (4.36 mg/kg) and
the lowest amount of nickel was found in the fish sample of C.
pseudeutropius (0.69 mg/kg). The result showed that there was a
considerable variation in the concentration of the element from
one sample to another. The range of nickel concentration in ten
species of fish was 0.69–4.13 mg/kg and 1.07–4.36 mg/kg in pre-monsoon and post-monsoon respectively. These values were simi-
lar to the reported value of Sharif, Alamgir, Mustafa, Hossain, and
Amin (1993a). Ni concentrations in Bangshi River water fishes
were below the established safe level of 5.5 mg/kg by Western
Australian Food and Drug Regulations (Plaskett & Potter, 1979).
Nickel and its salts are used in several industrial applications such
as in electroplating, storage batteries, auto-mobiles, aircraft parts,
spark, electrodes, cooking utensils, pigments, lacquer cosmetics,
water and printing fabrics. The industrial effluents of DEPZ were
the main sources of nickel contamination of the aquatic environ-
ment in Bangshi River. While the present study depicted that the
examined fish species were not contaminated by Ni, a long term
discharge of untreated industrial wastes could pollute the marine
organisms. Since, nickel is a cumulative body poison so its concen-tration should remain as low as possible.
Table 3
Heavy metals concentrations (mg/kg–dry wt.) and related statistical parameter for various fish samples.
Fishes species Season Metal concentration
Pb Cd Ni Cr Cu Zn Mn As
M. armatu Pre-M 3.07 0.27 2.19 0.79 27.14 267.31 24.27 2.48
Post-M 2.64 0.19 3.05 1.05 26.33 309.47 16.05 2.11
G. chapra Pre-M 2.93 0.13 1.71 0.58 12.57 53.18 19.14 2.42
Post-M 3.17 0.17 1.94 0.61 18.36 54.11 23.27 3.06
P. ticto Pre-M 7.22 0.46 4.13 2.07 38.11 174.61 34.91 5.11
Post-M 7.36 0.39 4.36 1.93 41.91 183.64 29.86 4.33
N. notopterus Pre-M 4.05 0.09 2.48 0.63 43.18 42.83 21.04 2.66
Post-M 3.82 0.17 3.02 0.47 38.64 44.35 13.18 1.97
C. soborna Pre-M 10.27 0.87 3.76 1.44 27.36 371.04 51.17 4.72
Post-M 9.56 0.68 3.38 0.97 23.97 418.05 44.36 3.86
S. phasa Pre-M 2.61 0.16 1.42 1.72 13.04 157.36 9.43 2.84
Post-M 3.07 0.23 1.94 1.43 15.63 149.71 14.11 3.05
A. mola Pre-M 3.52 0.11 0.96 1.48 28.19 97.14 14.55 3.17
Post-M 3.19 0.21 1.13 1.74 21.74 108.43 21.04 2.72
M. vittatus Pre-M 3.16 0.28 3.27 0.93 17.32 217.49 33.05 4.02
Post-M 2.42 0.16 2.82 0.82 13.68 233.75 28.25 5.11
H. fossilis Pre-M 7.71 0.31 4.11 0.71 14.17 203.19 26.11 6.24
Post-M 8.29 0.46 4.34 1.14 16.04 176.98 21.22 5.64C. pseudeutropius Pre-M 2.94 0.24 0.69 1.06 8.33 64.45 12.17 2.25
Post-M 1.76 0.32 1.07 0.87 10.36 52.31 18.13 3.28
Range 1.76–10.27 0.09–0.87 0.69–4.36 0.47–2.07 8.33–43.18 42.83–418 9.43–51.17 1.97–6.24
Mean 4.64 0.30 2.59 1.12 22.80 168.97 23.77 3.55
Pre-M: Pre-Monsoon, Post-M: Post -Monsoon.
1850 M.S. Rahman et al. / Food Chemistry 134 (2012) 1847–1854
8/13/2019 1-s2.0-S0308814612005821-main
http://slidepdf.com/reader/full/1-s20-s0308814612005821-main 5/8
3.1.4. Chromium (Cr)
Chromium does not normally accumulate in fish and hence low
concentrations were reported even from the industrialized part of
the world. The rate of uptake was higher in young fish but the body
burden of Cr was declined with age due to rapid elimination (Dara,
1995). Our results also showed low concentrations range of 0.47–
2.07 mg/kg and it was several folds lower than that of fish muscle
collected from the red sea (Ahmad & Naim, 2008) and pearl river
(Xie et al., 2010) indicating a less contamination of fishes in this
area. In the present study (Table 3) the highest level of Cr was de-
tected in P .ticto (2.07 mg/kg as dry wt.) during pre-monsoon and
the lowest in N. notopterus (0.47 mg/kg as dry wt.) during post-
monsoon. The Western Australian Food and Drug regulations
stated concentration of 5.5 mg/kg for Cr which was higher than
our values (Plaskett & Potter, 1979). The observed concentrations
of Cr in the fish samples of Bangshi River might be due to the
wastewater coming from various industries such as dying and tan-
ning industries, photography, textile, manufacturing green varnish,
paints, and inks around DEPZ, and river run-off from upstream
agricultural fields.
3.1.5. Copper (Cu)Copper is an essential part of several enzymes and is necessary
for the synthesis of hemoglobin (Sivaperumal, Sankar, & Nair,
2007). However, high intake of Cu has been recognized to cause ad-
verse health problem (Gorell et al., 1997). Copper was detected in
all examined fish samples and its concentration ranged from 8.33
to 43.18 mg/kg, with the highest content found in N. notopterus
(43.18 mg/kg as dry wt.) during pre-monsoon and the lowest was
in C. pseudeutropius (8.33 mg/kg) during pre-monsoon. The permis-
sible limit of Cu proposed by ANHMRC and FAO, was 30 mg/kg
fresh weight (Bebbington et al., 1977; Dural, Goksu, & Ozak,
2007). According to UK Food Standards Committee Report, Cu con-
centration in food should not exceed the value of 20 mg/kg as wet
weight (Cronin et al., 1998). There is also legislation in other coun-
tries regulating the maximum concentration of meals. For exam-ple, Turkish legislation established the level of Cu at 5 mg/kg,
whereas Spanish legislation proposed the level at 20 mg/kg as
wet weight (Demirak et al., 2006). The Australian Food Standard
Code established the maximum concentration for Cu at 10 mg/kg
wet weight (Alamet al., 2002). Considering a 79% moisture content
in fish muscles, none of the examined fish species exceeded the
permissible limits prescribed by various agencies.
3.1.6. Zinc (Zn)
Zinc being a heavy metal, has a tendencyto get bio-accumulated
in the fatty tissues of aquatic organisms, including fish and isknown to affect reproductive physiology in fishes (Ghosh, Mukho-
pandhyay, & Bagchi, 1985). Some authors reported that chronic
exposure to Cu andZn is associated with Parkinson’s disease (Gorell
et al., 1997) and these elements might act alone or together over
time to induce the disease (Prasad, 1983). Fishes are known to have
a high threshold level of Zn. There was a great variation in Zn con-
centrations among the studied fish muscles. The concentration in
fish samples of Bangshi River ranged from 42.83 to 371.04 mg/kg
and 44.35 to 418.05 mg/kg as dry weight basis in pre-monsoon
and post-monsoon respectively. The highest amount of zinc was
found in the fish sample of C. soborna (418.05 mg/kg as dry wt.)
and the lowest was in N. notopterus (42.83 mg/kg) among the ten
species of fish in Bangshi River. The amount of Zn determined in
all the fish samples were far below the standard of 1000 mg/kgset by ANHMRC (Bebbington et al., 1977; Plaskett & Potter, 1979)
and WHO (Cliton, Ujagwung, & Michael, 2008).
3.1.7. Manganese (Mn)
Although manganese is an element of low toxicity, it has con-
siderable biological significance. No maximum is specified for
manganese in fish samples. The concentration of Mn in the ana-
lyzed samples ranged from 9.43 to 51.17 mg/kg and 13.18 to
44.36 mg/kg in pre-monsoon and post-monsoon respectively. C.
soborna exhibited the maximum Mn concentration of 51.17 mg/
kg and S. phasa showed the minimum of 9.43 mg/kg. Normally,
water contain low level (0.05 mg/kg) of Mn (Bowen, 1966), but
the studied fishes contained higher concentration of Mn might be
due to the tendency of various species of fish to concentrate certainelements in their tissue more than the surrounding medium. Man-
ganese is used in dry battery cells, iron alloys, glass ceramics, and
electric coils etc. that could be considered as the major sources of
Table 4
Comparison of heavy metal accumulation in fish muscle with the reported values in the literatures.
Sample area Pb Cd Ni Cr Cu Zn Mn As References
Bangshi Rivera (Present work) 1.76–
10.27
0.09–
0.87
0.69–
4.36
0.47–
2.07
8.33–
43.18
42.83–
418.05
9.43–
51.17
1.97–
6.24
This research
Gumti Rivera (Bangladesh) 0.5–4.05 NA 1.80–
8.40
NA 1.48–
21.30
3.14–
186.9
4.1–
51.67
NA Amin et al. (2011)
Riversa (Bangladesh) 0.29–
10.05
0.04–
0.13
1.20–
6.10
NA 1.48–
23.30
33.01–
286.45
4.76–
71.61
NA Sharif et al. (1993a)
Hooghly Rivera (India) 12.40–
19.96
0.62–
1.20
2.20–
3.69
ND-3.89 16.22–
47.97
12.13–
44.74
NA NA De, De, Das, Ray, and Ghosh (2010)
Parangipettaia (India) 0.062–
1.569
0.004–
0.114
NA 0.415–
1.562
NA 0.103–
0.807
NA NA Lakshmanan et al. (2009)
Pearl Rivera(China) 0.05–
1.94
ND-33.2 NA ND-5.36 1.17–
6.72
2.62–20.2 NA 0.17–
1.46
Xie et al. (2010)
Aegean and Mediterranean
Seab (Turkey)
0.21–
1.28
<0.01–
0.39
0.03–
1.72
0.07–
1.48
0.51–
7.05
3.51–53.5 0.18–
2.78
NA Turkmen et al. (2009)
Wadi Hanifaha(KSA) 0.039 0.008 NA 0.23 1.08 NA NA NA Abdel-Baki et al. (2011)
Red Seaa(Jordan) 1.5–8.3 0.5–2 1.0–5.0 1.0–10.3 0.5–2.0 1.9–35.0 1.0–3.3 NA Ahmad and Naim (2008)
Kichera Riverb (Russia) 0.07–
0.30
<0.01–
0.10
NA NA NA 2.88–5.85 0.11–
0.37
NA Pintaeva et al. (2011)
Gulf of Cambaya (India) 1.09 0.23 ND 0.77 2.37 38.24 NA NA Reddy et al. (2007)
Southern Californiab 1.6–13.3 0.6–1.0 NA ND 12.3–
20.8
27.8–54.8 NA 2.10–
10.08
Bruce, Rimmon, Richard, Robert, and
William (1975)
Okumeshi Rivera (Nigeria) <0.01 0.62 0.17 0.06 NA NA 1.97 NA Raphael et al. (2011)
ND not detectable; NA not analyzed.a
Values present the ranges or mean expressed as mg/kg dry wt.b Values present the ranges or mean expressed as mg/kg wet wt.
M.S. Rahman et al. / Food Chemistry 134 (2012) 1847–1854 1851

8/13/2019 1-s2.0-S0308814612005821-main
http://slidepdf.com/reader/full/1-s20-s0308814612005821-main 6/8
Mn pollution. However, this result was in good agreement with the
value found in fish species from Gumti River, Bangladesh (Amin,
Begum, & Mondal, 2011).
3.1.8. Arsenic (As)
Arsenic is widespread in the environment due to both anthro-
pogenic and natural processes. It is a ubiquitous, but potentially
a toxic, trace element. The US Food and Drug Administration (USF-
DA, 1993), indicated that fish and other seafood account for 90% of
total As exposure. Arsenic concentration in ten species of fish
collected from Bangshi River were analyzed for the observation
of pollution status and the observed concentrations varied from
2.25 to 6.24 mg/kg (pre-monsoon) and 1.97 to 5.64 mg/kg (post-
monsoon). According to Australia New Zealand Food Standards
Code (ANZFA, 2011), the maximum permitted concentration for
As was 2.0 mg/kg wet weight. None of the fish samples exceeded
the ANZFA recommended value of 9.6 mg/kg dry weight (assuming
79% moisture content). The EPA has set arsenic tissue residues of
1.3 mg/kg fresh weight in freshwater fish as the criterion for hu-
man health protection (Burger & Gochfeld, 2005). Sharif, Alamgir,
Krishnamoorthy, and Mustafe (1993b) studied arsenic concentra-
tion in tropical marine fish of Bangladesh and the reported value
ranged from 2.84 to 3.92 mg/kg as dry weight basis.
4. Discussion
The concentrations of the heavy metals detected in fishes of this
study were compared with the other reported values (see Table 4)
as an effort to determine the degree of contamination in the study
area. Reported results in the literatures showed that metal con-
tents in the fish muscles varied widely depending on where and
which species were caught (Table 4). The metal content in various
fish species from Parangipettai (Lakshmanan, Kesavan, Vijayanand,
Rajaram, & Rajagopal, 2009), Aegean and Mediterranean Sea (Turk-
men, Turkmen, Tepe, Tore, & Ates, 2009), Wadi Hanifah (Abdel-Baki et al., 2011), Gulf of Cambay (Reddy et al., 2007) and Okume-
shi River (Raphael, Augustina, & Frank, 2011) were lower than this
result. Sharif et al. (1993a) measured concentrations of metals in
the freshwater fishes from different rivers in Bangladesh and the
reported values were agreed well to our values except Zn, Cu and
Cd.
However, the influence of the studied seasons and the different
fish species captured from the Bangshi River, Bangladesh was dem-
onstrated in Table 5. The metal concentration in the edible fish fil-
let of each fish species for two seasons was used for two-way
variance analysis ANOVA (Table 5). The data obtained from ANOVA
clearly demonstrated that there was significant variation (CI = 95%)
of the heavy metal concentrations in different fish species in the
Bangshi river. However, seasonal variation was not significant inten species of fish available in Bangshi River, Dhaka, Bangladesh.
Table 6 depicted the correlations between each analyzed trace
metal, listing the Pearson product moment correlation coefficients.
The concentrations of the investigated metals in fishes were signif-
icantly correlated with each other during both seasons. Significant
correlations were found between Cd and Pb (r = 0.855), Ni and Pb
(r = 0.776), Zn and Cd (r = 0.820), Mn and Pb (r = 0.810), Mn and
Cd (r = 0.884), Mn and Ni (r = 0.812), Mn and Zn (r = 0.770), As
and Pb (r = 0.804), and As and Ni (r = 0.862) at p < 0.01 level during
pre-monsoon. During post-monsoon, Cd–Pb, Ni–Pb, Mn–Pb,
Mn–Cd, and Mn–Zn were significantly correlated (Table 6). These
correlations might indicate that the distributions of these pairs of
metals were regulated by common local inputs and similar disper-
sion processes in the study area, except for Cr and Cu in Pre-mon-soon and Cr, Cu, Zn, and As in post-monsoon. T
a b l e
5
T w o
w a y A N O V A f o r t h e e f f e c t o f i n t e r - s e a s o n a n d i n t
e r - fi s h s p e c i e s o n t h e v a r i a b i l i t y o f h e a v y m e t a l c o n c e n t r a t i o n i n e d i b l e fi s h fi l l e t .
E f f e c t
P b
C d
N i
C r
C u
Z n
M n
A s
d f
F
p
( 2 - t a i l s )
d f
F
p
( 2 - t a i l s )
d f
F
p
( 2 - t a i l s )
d f
F
p
( 2 - t a i l s )
d f
F
p
( 2 - t a i l s )
d f
F
p
( 2 - t a i l s )
d f
F
p
( 2 - t a i l s )
d f
F
p
( 2 - t a i l s )
S e a s o n s a
1
1 . 4
9
0 . 3
8
1
0 . 0 3
0 . 9
8
1
3 . 4
0 . 1
8
1
0 . 1
8
0 . 8
9
1
0 . 0
5
0 . 9
7
1
1 . 3
0 . 4
2
1
0 . 7
1
0 . 6
1
1
0 . 1
1
0 . 9
3
F i s h S p e c i e s b
9
8 9 . 9
1 *
1 . 3
2
1 0 1 4
9
1 2 . 0 8
*
7 . 2
7
1 0 1 7
9
3 7 . 0
9 *
3 . 7
3
1 0 1 1
9
1 1 . 3
*
1 . 2
8
1 0 6
9
2 8 . 7
4 *
3 . 6
4
1 0 1 0
9
9 8 . 0
7 *
6 . 0
4
1 0 1 5
9
1 2 . 0
2 *
7 . 5
9
1 0 7
9
1 0 . 6
6 *
2 . 0
9
1 0 6
E r r o r
9
9
9
9
9
9
9
9
T o t a l
1 9
1 9
1 9
1 9
1 9
1 9
1 9
1 9
F c r i t i c
f o r F i s h e s = 3 . 1
8 ( a = 0 . 0
5 ) .
F c r i t i c
f o r S e a s o n s = 5 . 1
8 ( a = 0 . 0
5 ) .
a S e a s o n s : P r e - m o n s o o n a n d P o s t - m o n s o o n .
b F i s h S p e c i e s : B a i m ,
C h a p l i a ,
P u t i , F o l i , K a c h k i , F h a s s a ,
M o l a ,
T e n g r a ,
S i n g h ,
B a t a s h i .
*
S i g n i fi c a n t a t 9 5 % c o n fi d e n c e l e v e l .
1852 M.S. Rahman et al. / Food Chemistry 134 (2012) 1847–1854

8/13/2019 1-s2.0-S0308814612005821-main
http://slidepdf.com/reader/full/1-s20-s0308814612005821-main 7/8
Heavy metals have the tendency to accumulate in various or-
gans of marine organisms, especially fish which in turn may enter
into the human metabolism through consumption causing serious
health hazards (Bravo et al., 2010). Thus, the daily intake of some
selected trace metals were estimated and compared with the rec-
ommended values to assess whether the metal levels found in fish
samples from Bangshi River were safe for human consumption
(Table 7). This study was conducted only for the fish muscle as this
tissue was the most important part consumed by human popula-
tion. Estimates of fish consumption in Bangladesh (Begum, Amin,
Kaneco, & Ohta, 2005; Rahman & Haque, 1991) indicated that the
adult population consumes 21 g wet wt./person/day of both fresh-
water and sea fish species. This was equivalent to 147 g wet wt./
person/week. The EDI (estimated daily intake) values presented
in Table 7 were estimated by assuming that a 60 kg person will
consume 21 g fish per day. A conversion factor of 4.8 was used to
transform wet weight to dry weight. The result shown in Table 7
revealed that the EDI values for the examined fish samples were
below the recommended values ( JECFA, 1982, 1989, 2000; NRC,
1989; WHO, 1996), indicating that health risk associated with
the intake studied heavy metals through the consumption of
examined fish samples was absent.
5. Conclusion
In general, the data in this paper suggests that the heavy metal
concentrations found in the fish muscles sampled from the Bangshi
River, with the exception of Pb content in C. Soborna, were within
the standard limits proposed by various agencies (ANHMRC, AN-
ZFA, Western Australian Food and Drug Regulations etc.). It should
be noted that the concentrations of Zn were found considerably
higher among the eight heavy metals in the examined fish species.
The differences in heavy metal concentrations among ten different
fish species were statistically significant. However, these results
can be used to provide baseline information for risk assessmentassociated with their consumption as the estimated daily intake
(EDI) for the examined fishes and metals were far below the daily
dietary allowance recommended by various authorities ( JECFA,
1982, 1989, 2000; NRC, 1989; WHO, 1996). Therefore, we can con-
clude that these metals should not pose any health threat to the
consumers resulting from the consumption of studied fish.
Furthermore, constant monitoring of the Bangshi River ecosystem
near the Dhaka Export Processing Zone (DEPZ) is recommended in
view of the increased anthropogenic impact on the aquatic ecosys-
tems of this region that disturb the natural cycle of chemical
elements.
Acknowledgements
The authors thank the authority of Bangladesh Atomic Energy
Commission for providing laboratory facilities to analyze fish sam-
ples using conventional technique. The authors also delighted to
express their gratefulness and sincerest thanks to Professor Jasim
Uddin Ahmad (Ex Vice Chancellor, JU), Department of Chemistry,
Jahangirnagar University (JU), Savar, Dhaka for his valuable sugges-
tions and cooperation to carry out this research.
References
Abdel-Baki, A. S., Dkhil, M. A., & Al-Quraishy, S. (2011). Bioaccumulation of some
heavy metals in tilapia fish relevant to their concentration in water and
sediment of Wadi Hanifah, Saudi Arabia. African Journal of Biotechnology, 10,
2541–2547.
Ahmad, H. A. H., & Naim, S. I. (2008). Heavy Metals in Eleven Common Species of Fish from the Gulf of Aqaba, Red Sea. Jordan journal of Biological sciences, 1,
13–18.
Alam, M. G. M., Tanaka, A., Allinson, G., Laurenson, L. J. B., Stagnitti, F., & Snow, E. T.
(2002). A comparison of trace element concentrations in cultured and wild carp
(Cyprinus carpio) of Lake Kasumigaura, Japan. Ecotoxicology and EnvironmentalSafety, 53, 348–354.
Al-Busaidi, M., Yesudhason, P., Al-Mughairi, S., Al-Rahbi, W. A. K., Al-Harthy, K. S.,
Al-Mazrooei, N. A., et al. (2011). Toxic metals in commercial marine fish in
Oman with reference to national and international standards. Chemosphere, 85,
67–73.
Amin, M. N., Begum, A., & Mondal, M. G. K. (2011). Trace element concentrations
present in five species of freshwater fish of Bangladesh. Bangladesh journal of scientific and industrial research, 46 , 27–32.
ANZFA (2011). Australian and New Zealand Food Standards Code, Standard 1.4.1-
Contaminants and Natural Toxicants (F2011C00542). <http://
www.comlaw.gov.au/Details/F2011C00542> (accessed 20.11.11).
Bebbington, G. N., Mackay, N. J., Chvojka, R., Williams, R. J., Dunn, A., & Auty, E. H.
(1977). Heavy metals, selenium and arsenic in nine species of Australian
commercial fish. Australian Journal of Marine and Freshwater Research, 28,277–286.
Table 6
Correlation between heavy metals in the fishes samples in during the pre-monsoon
and the post-monsoon.
Pb Cd Ni Cr Cu Zn Mn As
Pre-monsoon
Pb 1 .855 .776 .283 .298 .631 .810 .804
Cd .855⁄⁄ 1 .624 .368 .148 .820 .884 .561
Ni .776⁄⁄ .624 1 .101 .349 .599 .812 .862
Cr .283 .368 .101 1 .216 .234 .155 .251Cu .298 .148 .349 .216 1 .066 .360 .110
Zn .631 .820⁄⁄ .599 .234 .066 1 .770 .519
Mn .810⁄⁄ .884⁄⁄ .812⁄⁄ .155 .360 .770⁄⁄ 1 .621
As .804⁄⁄ .561 .862⁄⁄ .251 .110 .519 .621 1
Post-monsoon
Pb 1 .878 .746 .250 .337 .527 .680 .508
Cd .878⁄⁄ 1 .467 .191 .052 .588 .736 .451
Ni .746⁄ .467 1 .119 .519 .476 .364 .514
Cr .250 .191 .119 1 .222 .139 .119 .180
Cu .337 .052 .519 .222 1 .054 .073 -.290
Zn .527 .588 .476 .139 .054 1 .669 .264
Mn .680⁄ .736⁄ .364 .119 .073 .669⁄ 1 .485
As .508 .451 .514 .180 -.290 .264 .485 1
* p < 0.05.** p < 0.01.
Table 7
Comparison of the estimated daily intake of heavy metals from fish species studied
with the recommended daily dietary allowances.
Metal Mean
concentration
(mg/kg-
drywt.)
Estimated
daily
intake
(EDI) in
mg/day/
person
Recommended
daily dietary
allowance
(mg/day/
person)
Contribution
(%)
References
Pb 4.64 0.0203 0.21a 9.67 JECFA
(2000)
Cd 0.30 0.0013 0.06a 2.17 JECFA
(1989)
Ni 2.59 0.0113 0.30
d
3.77 WHO(1996)
Cr 1.12 0.0049 0.05–2c 0.25–9.8 NRC
(1989)
Cu 22.80 0.0998 3–30b 0.33–3.33 JECFA
(1982)
Zn 168.97 0.7392 18–60b 1.23–4.11 JECFA
(1982)
Mn 23.77 0.1040 2.0–5.0c 2.08–5.2 NRC
(1989)
As 3.55 0.0155 0.13a 11.92 JECFA
(1989)
The average per capita consumption of fish was 21 g-wet wt./person/day. Conver-
sion factor (wet weight to dry weight): 4.8.a PTDI: provisional tolerable daily intake (60 kg body weight).b PMTDI: provisional maximum tolerable daily intake.c ESADDI: estimated safe and adequate daily dietary intake.
d Average daily intake from food.
M.S. Rahman et al. / Food Chemistry 134 (2012) 1847–1854 1853

8/13/2019 1-s2.0-S0308814612005821-main
http://slidepdf.com/reader/full/1-s20-s0308814612005821-main 8/8
Begum, A., Amin, M. N., Kaneco, S., & Ohta, K. (2005). Selected elemental
consumption of the muscle tissue of three species of fish, Tilapia nilotica,
Cirrhina mrigala and Clarius batrachus, from the fresh water Dhanmondi Lake
in Bangladesh. Food Chemistry, 93, 439–443.
Bowen, H. J. M. (1966). Trace Elements in Biochemistry. New York: Academic Press.
Bravo, A. G., Loizeau, J. L., Bouchet, S., Richard, A., Rubin, J. F., Ungureanu, V. G., et al.
(2010). Mercury human exposure through fish consumption in reservoir
contaminated by a chlor-alkali plant: Babeni reservoir (Romania).
Environmental Science and Pollution Research International, 17 , 1422–1432.
Bruce, A. F., Rimmon, C. F., Richard, L. W., Robert, D. W., & William, F. G. (1975).
Levels of toxic metals in marine organisms collected from Southern Californiacoastal waters. Environmental Health Perspective, 12, 71–76.
Burger, J., & Gochfeld, M. (2005). Heavy metals in commercial fish in New Jersey.
Environmental Research, 99, 403–412.
Chen, C., Qian, Y., Chen, Q., & Li, C. (2011). Assessment of daily intake of toxic
elements due to consumption of vegetable, fruits, meat, and seafood by
inhabitants of Xiamen, China. Journal of Food Science, 76 , 181–188.
Christensen, F. C., & Olson, E. C. (1957). Cadmium poisoning; report of a fatal case,
with discussion of pathology and clinical aspects. Archives of Industrial Health,16 , 8–13.
Cliton, H. I., Ujagwung, G. U., & Michael, H. (2008). Trace metals in the tissues and
shells of Tympanotonus Fuscatus var. Radula from the Mangrove Swamps of the
Bukuma Oil Field, Niger Delta. European journal of Scientific Research, 24,
468–476.
Copat, C., Bella, F., Castaing, M., Fallico, R., Sciacca, S., & Ferrante, M. (2012). Heavy
metals concentrations in fish from Sicily (Mediterranean Sea) and evaluation of
possible health risks to consumers. Bulletin of Environmental Contamination andToxicology, 88, 78–83.
Cronin, M., Davies, I. M., Newton, A., Pirie, J. M., Topping, G., & Swan, S. (1998). Trace
metal concentrations in deep sea fish from the North Atlantic. MarineEnvironmental Research, 45, 225–238.
Dara, S. S. (1995). Environmental Chemistry and Pollution Control. New Delhi, India: S.
Chand and Company Ltd., pp. 191–1912.
De, T. K., De, M., Das, S., Ray, R., & Ghosh, P. B. (2010). Level of heavy metals in some
edible marine fishes of mangrove dominated tropical estuarine areas of
Hooghly River, north east coast of Bay of Bengal, India. Bulletin of Environmental Contamination and Toxicology, 85, 385–390.
Demirak, A., Yilmaz, F., Tuna, A. L., & Ozdemir, N. (2006). Heavy metals in water,
sediment andtissues of Leciscus cephalus from a streamin southwesternTurkey.
Chemosphere, 63, 1451–1458.
Dural, M., Goksu, M. Z. L., & Ozak, A. A. (2007). Investigation of heavy metal levels in
economically important fish species captured from the Tuzla lagoon. FoodChemistry, 102, 415–421.
Ebrahimpour, M., Pourkhabbaz, A., Baramaki, R., Babaei, H., & Rezaei, M. (2011).
Bioaccumulation of heavy metals in freshwater fish species Anzali, Iran. Bulletinof Environmental Contamination and Toxicology, 87 , 386–392.
Forti, E., Salovaara, S., Cetin, Y., Bulgheroni, A., Pfaller, R. W., & Prieto, P. (2011). In
vitro evaluation of the toxicity induced by nickel soluble and particulate formsin human airway epithelial cells. Toxicology in Vitro, 25, 454–461.
Friberg, L., Piscator, M., & Nordberg, G. (1971). Cadmium in the Environment .Cleveland, Ohio: The Chemical Rubber Co, Press.
Garcia-Leston, J., Mendez, J., Pasaro, E., & Laffon, B. (2010). Genotoxic effects of lead:
an updated review. Environmental International, 36 , 623–636.
Ghosh, B. B., Mukhopandhyay, M. K., & Bagchi, M. M. (1985). Proc. National Seminar on Pollution Control and Environmental Management (pp. 194–199).
Gorell, J. M., Johnson, C. C., Rybicki, B. A., Peterson, E. L., Kortsha, G. X., Brown, G. G.,
et al. (1997). Occupational exposures to metals as risk factors for Parkinson’s
disease. Neurology, 48, 650–658.
Hanson, N. W. (1973). Official Standardized and Recommended Methods of Analysis(2nd ed.). London: The Society for Analytical Chemistry, pp. 270–274.
JECFA (1982). Evaluation of certain food additives and contaminants. Twenty-sixth
report of the joint FAO/WHO Expert Committee on Food Additives. (WHO
technical report series, No 683), World Health Organization, Geneva.
JECFA (1989). Evaluation of certain food additives and contaminants. Thirty-third
report of the joint FAO/WHO Expert Committee on Food Additives. (WHO
technical report series, No. 776), World Health Organization, Geneva.
JECFA (2000). Evaluation of certain food additives and contaminants. Fifty-thirdreport
of the joint FAO/WHO Expert Committee on Food Additives. (WHO technical
report series, No. 896), World Health Organization, Geneva.
Lakshmanan, R., Kesavan, K., Vijayanand, P., Rajaram, V., & Rajagopal, S. (2009).
Heavy metals accumulation in five commercially important fishes of
parangipettai, southeast coast of India. Advanced journal of food science andtechnology, 1, 63–65.
Lee, K., Kweon, H., Yeo, J., Woo, S., Han, S., & Kim, J. (2011). Characterization of
tyrosine-rich Antheraea pernyi silk fibroin hydrolysate. International Journal of Biological Macromolecules, 48, 223–226.
Luckey, T. D., & Venugopal, B. (1977). Metal Toxicity in Mammals. New York: PlenumPress.
NRC (1989). National Research Council Recommended Dietary Allowances (10th ed.,
pp. 241–243). Washington, DC: National Academy of Sciences, PP.
Pintaeva, E. Ts., Bazarsadueva, S. V., Radnaeva, L. D., Pertov, E. A., & Smirnova, O. G.
(2011). Content andcharacter of metal accumulation in fishof the Kichera River
(a tributary of Lake of Baikal). Contemporary Problems of Ecology, 4, 64–68.
Plaskett,D., & Potter, I. C. (1979). Heavy metalconcentrationsin themuscle tissueof
12 species of teleost from Cockburn Sound, Western Australia. Australian Journalof Marine and Freshwater Research, 30, 607–616.
Prasad, A. S. (1983). The role of Zinc in gastrointestinal and liver disease. Clinics inGastroenterology, 12, 713–741.
Rahman, M. S. (2004). Investigation on the Status of Pollution Around the Export
Processing Zone (EPZ), Area with Special Reference to Its Impact on Fisheries in
Bangshi River, Bangladesh, M.Phil Dissertation, Rajshahi University, Bangladesh.
Rahman, A. K. A., & Haque, A. K. (1991). Role of Extension and Support Service in Aquaculture Development . Dhaka, Bangladesh.
Rahman, M. S., & Islam, M. R. (2010). Adsorption of Cd (II) ions from synthetic
wastewater using Maple sawdust. Energy Sources, Part A (Recovery, Utilizationand Environmental Effect), 32, 222–231.
Rahman, M. S., & Islam, M. R. (2009). Effects of pH on isotherms modeling for Cu (II)
ions adsorption using maple wood sawdust. Chemical Engineering Journal, 149,
273–280.
Rahman, M. S., Molla, A. H., & Arafat, S. M. Y. (2010). Status of pollution around
Dhaka export processing zone and its impact on Bangshi River water,
Bangladesh. Journal of Nature Science and Sustainable Technology, 4, 91–110.
Raphael, E. C., Augustina, O. C., & Frank,E. O. (2011). Trace metals distributionin fish
tissues, bottom sediments and water from Okumeshi River in delta state,
Nigeria. Environmental Research Journal, 5, 6–10.
Reddy, M. S., Mehata, B., Dave, S., Joshi, M., Karthikeyan, L., Sharma, V. K. S., et al.
(2007). Bioaccumulation of heavy metals in some commercial fishes and crabs
of the Gulf of Cambay, India. Current Science, 92, 1489–1491.
Saha, N., & Zaman, M. R. (2011). Concentration of selected toxic metals in
groundwater and some cereals grown in Shibganj area of Chapai Nawabganj,
Rajshahi, Bangladesh. Current Science, 101, 427–431.
Sharif, A. K. M., Alamgir, M., Krishnamoorthy, K. R., & Mustafe, A. I. (1993b).
Determination of Arsenic, Mercury, Selenium and Zinc in Tropical Marine Fish
by Neutron Activation. Journal of Radioanalytical and Nuclear Chemistry, 170,299–307.
Sharif, A. K. M., Alamgir, M., Mustafa, A. I., Hossain, M. A., & Amin, M. N. (1993a).
Trace element concentrations in ten species of freshwater fish of Bangladesh.
Science of the Total Environment, 138, 117–126.
Sivaperumal, P., Sankar, T. V., & Nair, P. G. V. (2007). Heavy metal concentrations in
fish, shellfish and fish products from internal markets of India vis-a-vis
international standards. Food Chemistry, 102, 612–620.
Turkmen, M., Turkmen, A., Tepe, Y., Tore, Y., & Ates, A. (2009). Determination of
metals in fishspecies from Aegean andMediterranean seas. Food Chemistry, 113,
233–237.
USFDA (1993). Guidance document for arsenic in shellfish (pp. 25–27). Washington,
DC: US Food and Drug Administration.
WHO (1996). Guidelines for drinking water quality (2nd ed., Vol. 2). World Health
Organization, Geneva.
Xie, W. P., Chen, K. C., Zhu, X. P., Nie, X. P., Zhen, G. M., Pan, D. B., et al. (2010).
Evaluation on heavy metal contents in water and fishes collected from the
waterway in the Pearl River Delta, South China. Journal of Agro-Environment Science, 29, 1917–1923.
1854 M.S. Rahman et al. / Food Chemistry 134 (2012) 1847–1854


