Wilkes-Barre Area Kia Dealer | 2015 Kia Forte5 Near Wilkes-Barre
Upload
ashlynn-danielCategory
view
217download
1
1
Power System Fault: Detection and Prevention
Ryan HabibWilkes University
Huy TranRichland College

Purpose
Construct a simple data acquisition system to mimic the measuring of an arc flash incident
2

Arc Flash
A rapid release of energy in the form of an electrical explosion that results from a low impedance connection between lines of different voltage or phases
3

Arc Flash damage Most burns from
electrical accidents are a result of arc flash
Temperatures can reach up to 20,000⁰C
Most occurrences are in industrial settings due to required power levels
4

Arc Flash Experimentation
5
Analog Devices7B-47-K-04-1(Build-in CJC)
NI cRio: 16 Differential AI16 TTL Compatible DI/O
Fiber Optic Internet Connection
AD210 + MOVSlug calorimeters and Pressure sensors
Experimental DAQ System

Arc Flash Simulation
6

7

SCADA (Supervisory Control And Data Acquisition) Systems
Versatile industrial control system Components
SensorRemote terminal unitCentral computer
8

Sensors
Reads a signal from a physical property and converts it into one usable by a control system
Photoresistor Hall effect sensor
9

Thermocouple
Type K thermocoupleProduces output voltage
dependent on temperature
Made of two metals with different conducting properties
Temperature range of -200⁰C to 1350⁰C
10

Types of Thermocouples
Type Materials Traits
B/R/S Platinum-Rhodium Low Sensitivity, High Cost
E Chromel-Constantan High Sensitivity, Non-metallic
J Iron-Constantan Low Range, High Sensitivity
K Chromel-Alumel Inexpensive, Versatile, Reliable
N Nicrosil-Nisil More stable in high-energy environments
T Copper-Constantan Very Stable, especially at lower temperatures
11

Analog to Digital Conversion
7B47 Signal Conditioning Module Successive Approximation ADC
12

Data Logger
Records digital data from the sensors Easily connected to other machines to
display information in real time
13

GL800
Simultaneously displays and records data from up to 20 inputs
14

LabVIEW Large quantity of functions for data
acquisition, signal conditioning, and data analysis purposes
Extensive support for accessing instrumentation hardware
15

System Setup
Seven thermocouples were each connected to their own 7B47 signal conditioning module
Each module was connected to an input of the GL800
USB/Ethernet cable connected GL800 to computer
16

Test Process
Place thermocouple in water to be measured
Send digital pulse to trigger the GL800 data recording
Connect computer to GL800 to record data on the computer
Convert data from GL800 from voltage to temperature
17

Setup
Internet (Wireless or LAN)
7B47
7B47
7B47
7B47
7B47
7B47
7B47
7B47
+ - + -+ -+ -+ -+ -+ -+ -
CH1 CH4 CH5 CH6 CH7 CH8CH3CH2
Control & Monitor System
Communication System
Data Acquisition & Logger System
A/D Converter Equipment & Protection System
Industrial & Commercial Power Grid
DAQ System Utilized in Power System
18

19

Results: Change from Air to Hot Water
0 0.5 1 1.5 2 2.5 3 3.5 40
10
20
30
40
50
60
70
Air to Hot Water
Thermocouple 1
Thermocouple 2
Thermocouple 3
Thermocouple 4
Thermocouple 5
Thermocouple 6
Thermocouple 7
Time (s)
Tem
per
atu
re (
oC
)
20

Results: Change from Air to Hot Water (Average)
0 0.5 1 1.5 2 2.5 3 3.5 40
10
20
30
40
50
60
70
Air to Hot Water
average
Time (s)
Tem
per
atu
re (
oC
)
21
Results: Change from Air to Cold Water
0 0.5 1 1.5 2 2.5 3 3.5 40
5
10
15
20
25
30
Air to Cold Water
Thermocouple 1
Thermocouple 2
Thermocouple 3
Thermocouple 4
Thermocouple 5
Thermocouple 6
Thermocouple 7
Time (s)
Tem
per
atu
re (
oC
)
22
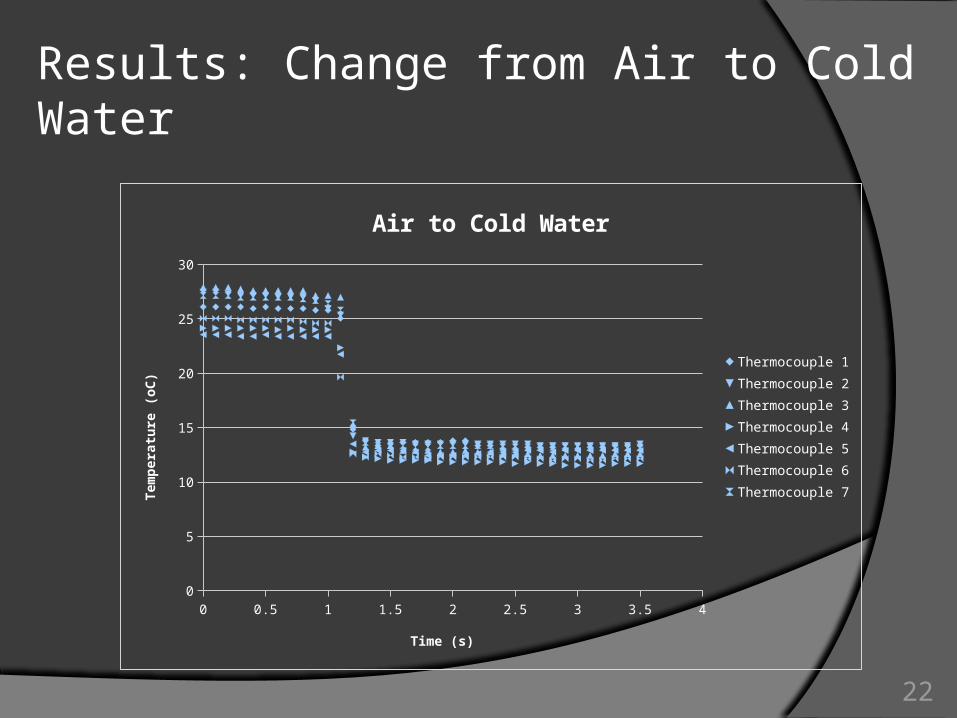
Results: Change from Air to Cold Water (Average)
0 0.5 1 1.5 2 2.5 3 3.5 40
5
10
15
20
25
30
Air to Cold Water
average
Time (s)
Tem
per
atu
re (
oC
)
23

Results: Change from Hot Water to Air
0 1 2 3 4 5 60
10
20
30
40
50
60
Hot Water to Air
Thermocouple 1
Thermocouple 2
Thermocouple 3
Thermocouple 4
Thermocouple 5
Thermocouple 6
Thermocouple 7
Time (s)
Tem
per
atu
re (
oC
)
24

Results: Change from Hot Water to Air (Average)
0 1 2 3 4 5 60
10
20
30
40
50
60
Hot Water to Air
average
Time (s)
Tem
per
atu
re (
oC
)
25

Results: Change from Cold Water to Air
0 0.5 1 1.5 2 2.5 3 3.5 40
2
4
6
8
10
12
14
16
18
Cold Water to Air
Thermocouple 1
Thermocouple 2
Thermocouple 3
Thermocouple 4
Thermocouple 5
Thermocouple 6
Thermocouple 7
Time (s)
Tem
per
atu
re (
oC
)
26
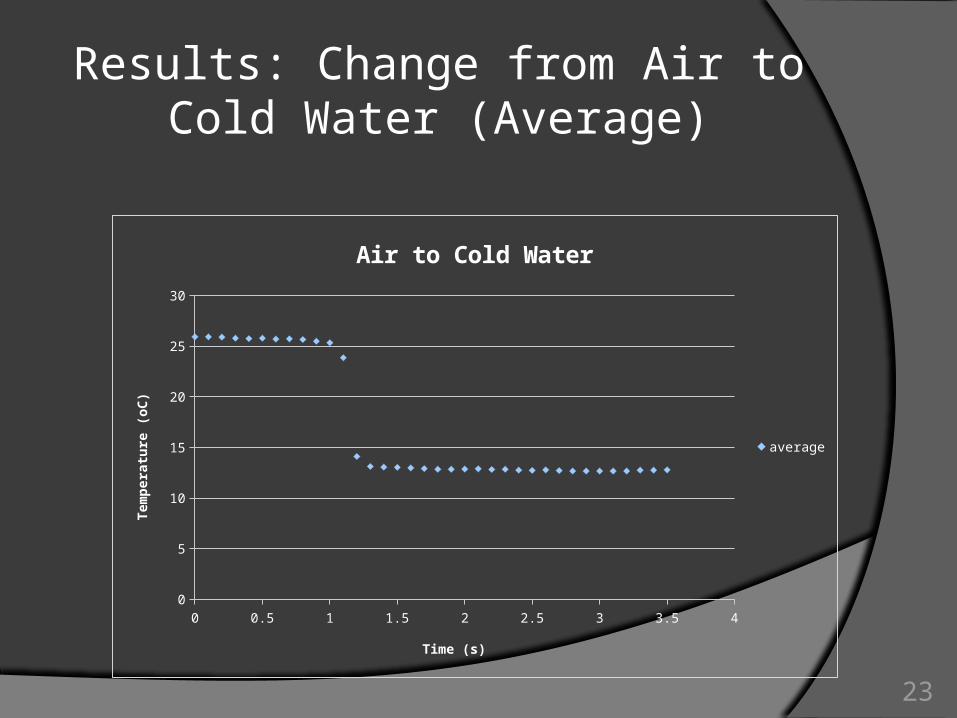
Results: Change from Cold Water to Air (Average)
0 0.5 1 1.5 2 2.5 3 3.5 411.5
12
12.5
13
13.5
14
14.5
15
15.5
Cold Water to Air
Average
Time (s)
Tem
per
atu
re (
oC
)
27

Results: Change from Hot Water to Cold Water
0 0.5 1 1.5 2 2.5 3 3.5 40
5
10
15
20
25
30
35
40
45
50
Hot Water to Cold Water
Thermocouple 1
Thermocouple 2
Thermocouple 3
Thermocouple 4
Thermocouple 5
Thermocouple 6
Thermocouple 7
Time (s)
Tem
per
atu
re (
oC
)
28

Results: Change from Hot Water to Cold Water (Average)
0 0.5 1 1.5 2 2.5 3 3.5 40
5
10
15
20
25
30
35
40
45
Hot Water to Cold Water
average
Time (s)
Tem
per
atu
re (
oC
)
29

Results: Change from Cold Water to Hot Water
0 0.5 1 1.5 2 2.5 3 3.5 40
5
10
15
20
25
30
35
40
45
50
Cold to Hot Water
Thermocouple 1
Thermocouple 2
Thermocouple 3
Thermocouple 4
Thermocouple 5
Thermocouple 6
Thermocouple 7
Time (s)
Tem
per
atu
re (
oC
)
30

Results: Change from Cold Water to Hot Water (Average)
0 0.5 1 1.5 2 2.5 3 3.5 40
5
10
15
20
25
30
35
40
45
50
Cold to Hot Water
average
Time (s)
Tem
per
atu
re (
oC
)
31

Results: Change from Adding Hot Water to Cold Water
0 0.5 1 1.5 2 2.5 3 3.5 40
5
10
15
20
25
30
Adding Hot Water to Cold Water
Thermocouple 1
Thermocouple 2
Thermocouple 3
Thermocouple 4
Thermocouple 5
Thermocouple 6
Thermocouple 7
Time (s)
Tem
per
atu
re (
oC
)
32

Results: Change from Adding Hot Water to Cold Water (Average)
0 0.5 1 1.5 2 2.5 3 3.5 40
5
10
15
20
25
30
Adding Hot Water to Cold Water
average
Time (s)
Tem
per
atu
re (
oC
)
33

Data Analysis
System did a solid, yet unspectacular, job of reading changes in water temperature
Variance in quality of measurements throughout the different tests
Could be attributed to variety of factors, including low sample rate and lack of memory
34

Comparisons with LabVIEW
Using LabVIEW would’ve solved the issues with sample rate and memory
Interface is much less intuitive Weeks/months to master skills
necessary for this type of task
35

Conclusion
The DAQ system was able to measure changes in temperature in a relatively effective manner
The components in the system are versatile enough to be used in a wide array of situations
For these specific tests, a data logger with a higher sampling rate, along with a sensor with a more narrow range, would have been more effective
36

Acknowledgements
Dr. Wei-Jen Lee Zhenyuan Zhang Zhaohao Ding The University of Texas at Arlington National Science Foundation
37