1 Rob Woodruff Battelle Memorial Institute, Health & Analytics Email: [email protected] Cynthia...
20
1 Rob Woodruff Battelle Memorial Institute, Health & Analytics Email: [email protected] Cynthia Ferre Centers for Disease Control and Prevention Conditional Stereotype Logistic Regression A new estimation command
-
Upload
basil-nichols -
Category
Documents
-
view
219 -
download
0
Transcript of 1 Rob Woodruff Battelle Memorial Institute, Health & Analytics Email: [email protected] Cynthia...

1
Rob Woodruff
Battelle Memorial Institute, Health & Analytics
Email: [email protected]
Cynthia Ferre
Centers for Disease Control and Prevention
Conditional Stereotype Logistic RegressionA new estimation command

2
Overview
• What is it?- Stereotype Logistic Regression
- Conditional on what?• What‘s it good for?• Syntax and Examples
3
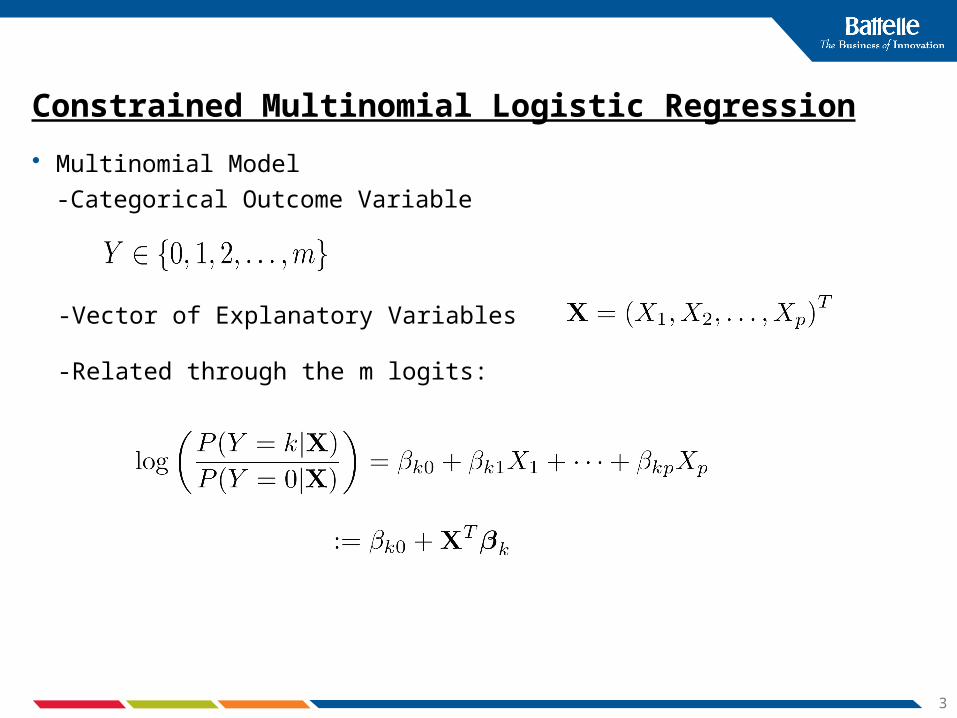
Constrained Multinomial Logistic Regression
• Multinomial Model
-Categorical Outcome Variable
-Vector of Explanatory Variables
-Related through the m logits:

4
Constrained Multinomial (continued)
-The stereotype model imposes the constraints:
Note: The phi’s are scalar quantities

5
It’s all about the phi’s
• Full multinomial has m(p+1) parameters• Stereotype model has m-1 + m + p = 2m-1+p
• The phi parameters give a way to quantify ordinality of the outcome variable. If
Then we have evidence of ordinal effect.
• Also allow tests of distinguishability of outcome categories

6
So what’s the condition?
• The multinomial and stereotype logistic regression models are implemented in Stata by mlogit and slogit
• Assume independence of observations, not true for matched case-control data
• For matched case control study, only independence of matched groups (strata, panels, clusters, etc)
• For 1:M matching, condition on stratum total for outcome variable and focus instead on conditional likelihood
Do I have to?
Why condition on this particular event?

7
Conditional vs. Unconditional Likelihood

8
Conditional vs. Unconditional Likelihood

9
CSTEREO
cstereo commandBasic syntax:
. cstereo depvar indepvars [if] [in], group(varname) [options]
10
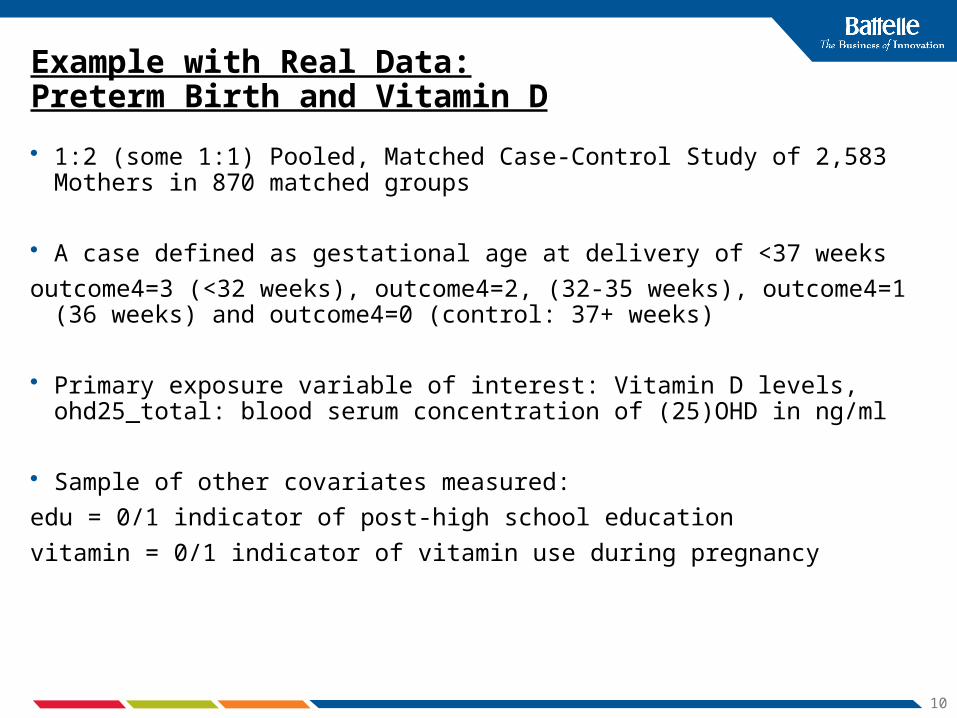
Example with Real Data:Preterm Birth and Vitamin D
• 1:2 (some 1:1) Pooled, Matched Case-Control Study of 2,583 Mothers in 870 matched groups
• A case defined as gestational age at delivery of <37 weeks
outcome4=3 (<32 weeks), outcome4=2, (32-35 weeks), outcome4=1 (36 weeks) and outcome4=0 (control: 37+ weeks)
• Primary exposure variable of interest: Vitamin D levels, ohd25_total: blood serum concentration of (25)OHD in ng/ml
• Sample of other covariates measured:
edu = 0/1 indicator of post-high school education
vitamin = 0/1 indicator of vitamin use during pregnancy
11
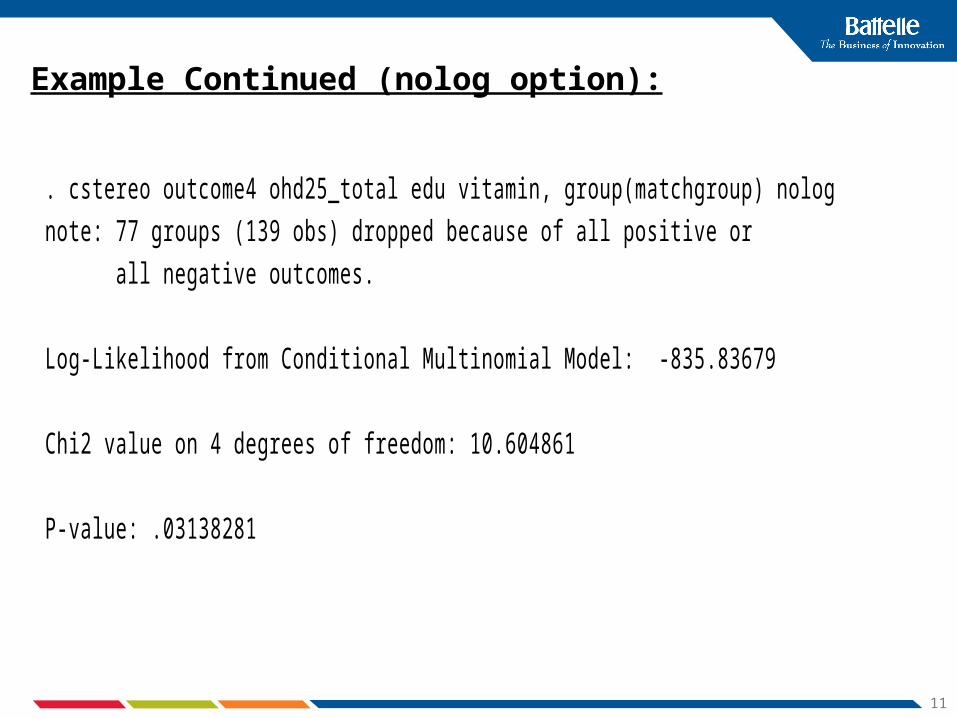
Example Continued (nolog option):
P-value: .03138281
Chi2 value on 4 degrees of freedom: 10.604861
Log-Likelihood from Conditional Multinomial Model: -835.83679
all negative outcomes.
note: 77 groups (139 obs) dropped because of all positive or
. cstereo outcome4 ohd25_total edu vitamin, group(matchgroup) nolog
12
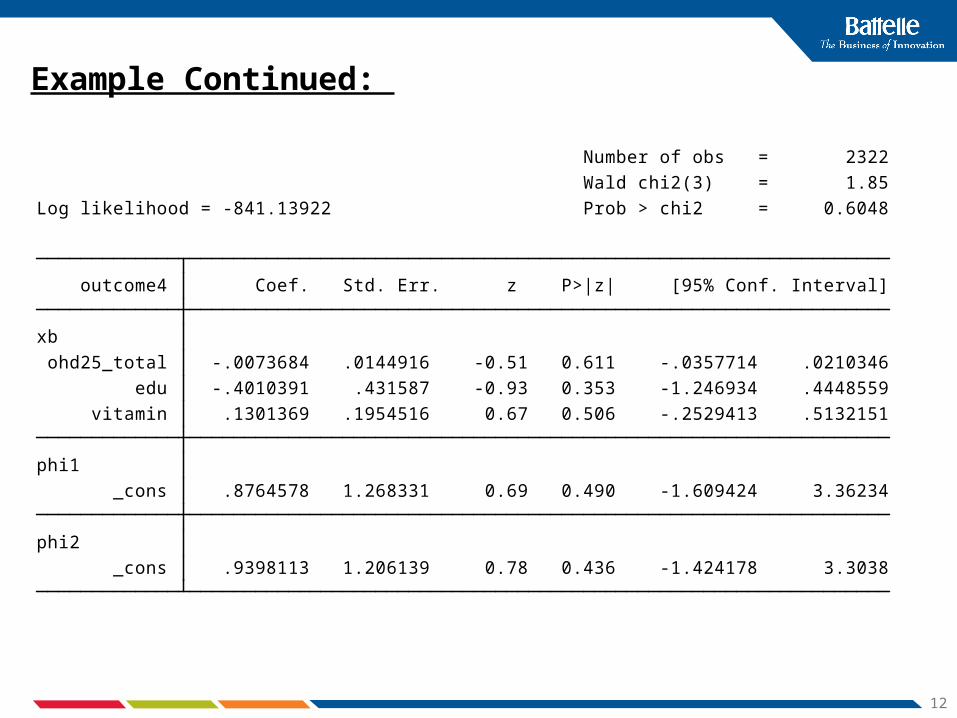
Example Continued:
_cons .9398113 1.206139 0.78 0.436 -1.424178 3.3038
phi2
_cons .8764578 1.268331 0.69 0.490 -1.609424 3.36234
phi1
vitamin .1301369 .1954516 0.67 0.506 -.2529413 .5132151
edu -.4010391 .431587 -0.93 0.353 -1.246934 .4448559
ohd25_total -.0073684 .0144916 -0.51 0.611 -.0357714 .0210346
xb
outcome4 Coef. Std. Err. z P>|z| [95% Conf. Interval]
Log likelihood = -841.13922 Prob > chi2 = 0.6048
Wald chi2(3) = 1.85
Number of obs = 2322

13
Interpretation of cstereo output:
• Estimated beta coefficient of ohd25_total = -0.0074 with 95% confidence interval (-0.0358, 0.0210)
• Odds ratio of being in <32 weeks gestational age compared to control is exp(-0.0074) = 0.993 (0.965, 1.021)
• Now for odds ratios for the 32-35 weeks and 36 week case categories, we need the products of the parameters:
• For standard errors, use Delta Method via nlcom

14
Interpretation continued:
_nl_1 -.0069249 .0072757 -0.95 0.341 -.021185 .0073351
outcome4 Coef. Std. Err. z P>|z| [95% Conf. Interval]
_nl_1: [xb]ohd25_total*[phi2]_cons
. nlcom [xb]ohd25_total*[phi2]_cons
Exponentiating gives the odds ratio of being in the 32-35 weeks case category compare to controls of 0.994 with a 95% C.I. of (0.983, 1.004)

15
Constraints:
• Are the 36 week and 32-35 weeks case categories distinguishable?
all negative outcomes.
note: 77 groups (139 obs) dropped because of all positive or
. cstereo outcome4 ohd25_total edu vitamin, group(matchgroup) nolog constraints(1)
. constraint 1 [phi1]_cons=[phi2]_cons

16
Constraint Output
_cons .9417836 1.24291 0.76 0.449 -1.494276 3.377843
phi2
_cons .9417836 1.24291 0.76 0.449 -1.494276 3.377843
phi1
vitamin .1294806 .1888154 0.69 0.493 -.2405908 .4995519
edu -.3909924 .4289348 -0.91 0.362 -1.231689 .4497043
ohd25_total -.0068382 .013172 -0.52 0.604 -.0326548 .0189784
xb
outcome4 Coef. Std. Err. z P>|z| [95% Conf. Interval]
( 1) [phi1]_cons - [phi2]_cons = 0
Log likelihood = -841.1454 Prob > chi2 = 0.6293
Wald chi2(3) = 1.73
Number of obs = 2322

17
Constraint Output
• The log-likelihood from the constrained model is -841.145 compared to -841.139 for the unconstrained stereotype model
• Difference of 0.006 gives a chi2 value of 0.012 on 1 degree of freedom
• P-value = 0.91
• Unconstrained stereotype model does not fit significantly better than the constrained and the two case categories are indistinguishable

18
Relationship to Other Models for Ordered/Categorical Outcomes
• Constrained Multinomial
• Not as parsimonious as the proportional odds model (ologit) but not valid in outcome dependent sampling
• Adjacent category model is (basically) a constrained stereotype model. Also valid under outcome dependent sampling

19
Limitations
• Convergence Issues
• Currently only a one dimensional stereotype model
• Cannot currently force an ordering on the stereotype parameters
• Additional dependence structure

20
References:• Ferre C, et al; Maternal 25-Hydroxyvitamin D Status and the Risk of Preterm Delivery: A Multi-Center Nested Case Control Study; preprint
• Mukherjee B, Liu I, Sinha S; Analysis of matched case-control data with multiple ordered disease states; Statistics in Medicine 2007
• Ahn J et. al.; Missing Exposure Date in Stereotype Regression Model; Biometrics 2011
• Andersen EB; Asymptotic Properties of Conditional Maximum-Likelihood Estimators; Journal of the Royal Statistical Society 1970
• Liang KY, Stewart WF; Polychotomous Logistic Regression Methods for Matched Case-Control Studies with Multiple Case or Control Groups; American Journal of Epidemiology 1987
• Scott AJ, Wild CJ; Fitting Regression Models to Case-Contro Data by Maximum Likelihood; Biometrika 1997
• Anderson JA; Regression and Ordered Categorical Variable; Journal of the Royal Statistical Society 1984\
• Greenland S; Alternative Models for Ordinal Logistic Regression; Statistics in Medicine 1994