1 RIte Care’s Culture of Continuous Improvement Based on Research & Data Analysis Presentation to...
34
1 RIte Care’s Culture of Continuous RIte Care’s Culture of Continuous Improvement Improvement Based on Research & Data Analysis Based on Research & Data Analysis Presentation to Presentation to Academy Health- State Health Research and Policy Interest Group Academy Health- State Health Research and Policy Interest Group By By Melinda Thomas Melinda Thomas Project Manager, RI Affordable Health Care Project Project Manager, RI Affordable Health Care Project RI Department of Human Services RI Department of Human Services June 25, 2005 June 25, 2005
-
Upload
ronan-daffin -
Category
Documents
-
view
216 -
download
0
Transcript of 1 RIte Care’s Culture of Continuous Improvement Based on Research & Data Analysis Presentation to...

1
RIte Care’s Culture of Continuous RIte Care’s Culture of Continuous Improvement Improvement
Based on Research & Data AnalysisBased on Research & Data Analysis
Presentation to Presentation to Academy Health- State Health Research and Policy Interest GroupAcademy Health- State Health Research and Policy Interest Group
ByByMelinda ThomasMelinda Thomas
Project Manager, RI Affordable Health Care ProjectProject Manager, RI Affordable Health Care ProjectRI Department of Human ServicesRI Department of Human Services
June 25, 2005June 25, 2005

2
OverviewOverview
•Understanding the Culture
•Applying Research and Data Analysis
•Lessons Learned

3
Understanding the Culture

4
Culture of Continuous ImprovementApproach
• Set Goals• Identify measurable
indicators• Establish a baseline• Implement Program
Intervention• Monitor Trends• Evaluate impact• Make midcourse
corrections
5
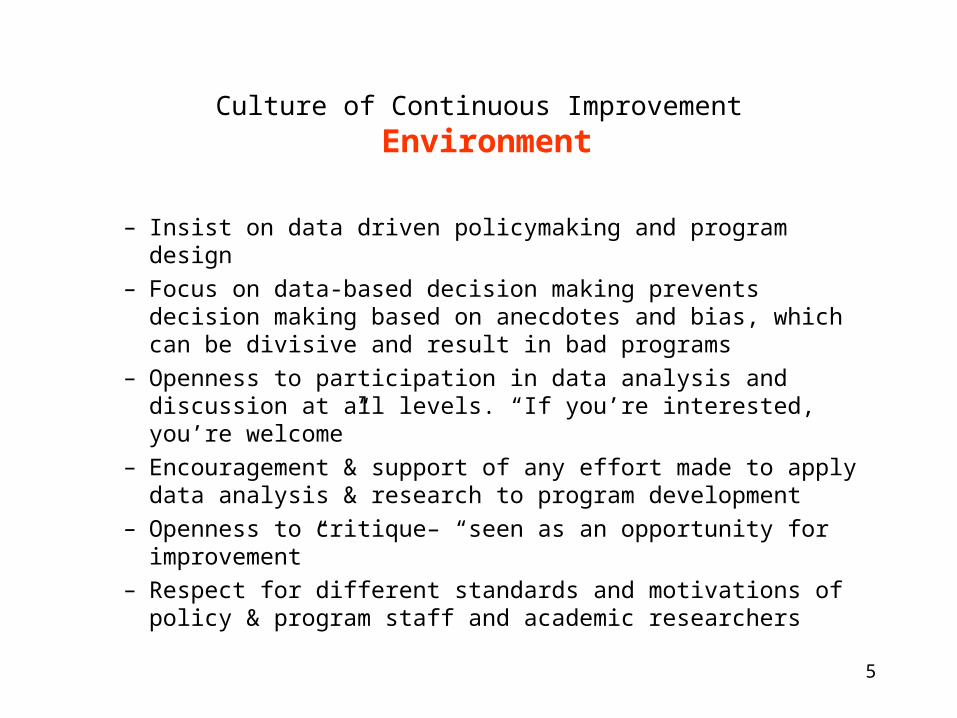
Culture of Continuous Improvement Environment
– Insist on data driven policymaking and program design– Focus on data-based decision making prevents decision
making based on anecdotes and bias, which can be divisive and result in bad programs
– Openness to participation in data analysis and discussion at all levels. “If you’re interested, you’re welcome”
– Encouragement & support of any effort made to apply data analysis & research to program development
– Openness to critique– “seen as an opportunity for improvement”
– Respect for different standards and motivations of policy & program staff and academic researchers

6
Cultural of Continuous Improvement Spanning Boundaries*
Policymakers/Program Staff
– Ease with generalization
– Pragmatic
– “Bias for Action”
* Based on Steve Shortell presentation at 2002 Academy Health Policy Conference
Researchers
– Emphasis on scientific rigor
– Stand- up to scrutiny
– Long timeline

7
Applying Research & Data Analysis

8
RIte CareRIte Care
Created in 1994 under Medicaid R&D waiver with the following goals:
1. Reduce uninsurance for low-income children and families
2. Improve access, service quality and health status for the covered population
3. Control the rate of growth in Medicaid expenditures for the eligible population
9
Goal 1:
Reduce uninsurance for low-income children and families
10
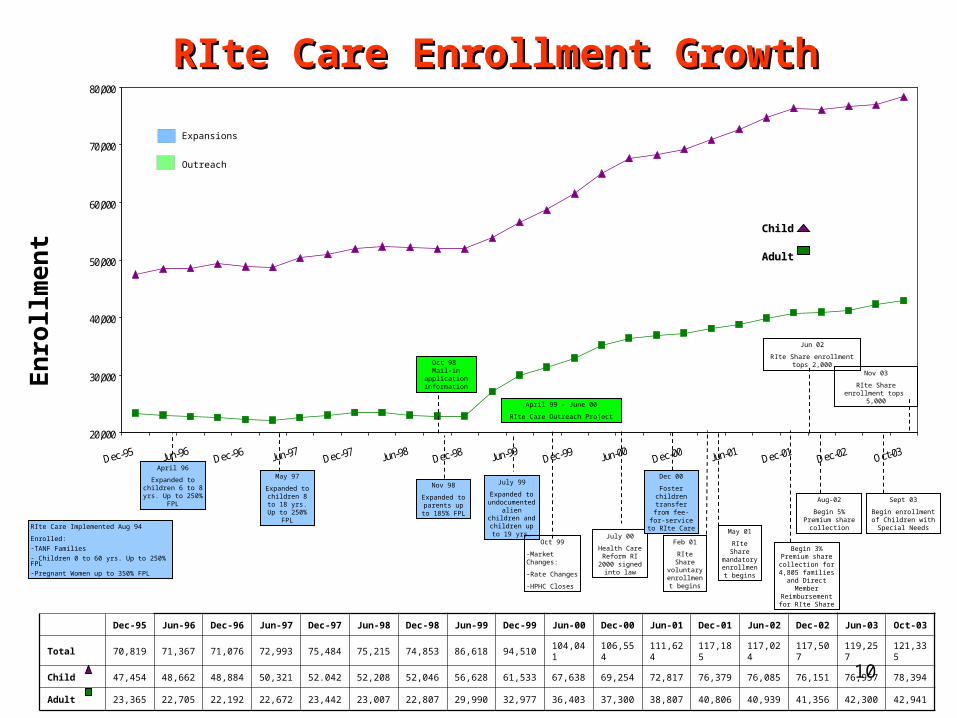
RIte Care Enrollment GrowthRIte Care Enrollment Growth
20,000
30,000
40,000
50,000
60,000
70,000
80,000
RIte Care Implemented Aug 94
Enrolled:
-TANF Families- Children 0 to 60 yrs. Up to 250% FPL-Pregnant Women up to 350% FPL
En
roll
men
t
Expansions
Outreach
May 97
Expanded to children 8 to 18 yrs. Up to 250%
FPL
April 99 – June 00
RIte Care Outreach Project
July 99
Expanded to undocumented
alien children and children up to 19
yrs.
April 96
Expanded to children 6 to 8 yrs. Up to 250%
FPL
Nov 98
Expanded to parents up to 185% FPL
Oct 98 Mail-in application
information
Oct 99
-Market Changes:
-Rate Changes
-HPHC Closes
July 00
Health Care Reform RI 2000 signed into law
Dec 00
Foster children transfer from fee-for-service to RIte
Care
May 01
RIte Share mandatory enrollment
begins
Begin 3% Premium share collection for 4,805 families and
Direct Member Reimbursement for
RIte Share
Feb 01
RIte Share voluntary
enrollment begins
Child Child
AdultAdult
Dec-95 Jun-96 Dec-96 Jun-97 Dec-97 Jun-98 Dec-98 Jun-99 Dec-99 Jun-00 Dec-00 Jun-01 Dec-01 Jun-02 Dec-02 Jun-03 Oct-03
Total 70,819 71,367 71,076 72,993 75,484 75,215 74,853 86,618 94,510 104,041 106,554 111,624 117,185 117,024 117,507 119,257 121,335
Child 47,454 48,662 48,884 50,321 52.042 52,208 52,046 56,628 61,533 67,638 69,254 72,817 76,379 76,085 76,151 76,957 78,394
Adult 23,365 22,705 22,192 22,672 23,442 23,007 22,807 29,990 32,977 36,403 37,300 38,807 40,806 40,939 41,356 42,300 42,941
Sept 03
Begin enrollment of Children with Special
Needs
Aug-02
Begin 5% Premium share collection
Jun 02
RIte Share enrollment tops 2,000
Nov 03
RIte Share enrollment tops 5,000

11
Percent Uninsured Rhode Islanders Percent Uninsured Rhode Islanders All Ages-1994-2003All Ages-1994-2003
10
7.7
10.29.8
5.96.9
10.29.9
11.512.9
0
5
10
15
20
1994 1995 1996 1997 1998 1999 2000 2001 2002 2003
Per
cen
t U
nin
sure
d
Data Source: Medicaid Research and Evaluation Project, RI Access ProjectUS Bureau of the Census, Current Population Surveys 1994-2003 (September estimates)
4th 5th
4th 1st
1st
Tied 1st
National Ranking8th 6th Tied 3rd 2nd

12
Percent Uninsured Rhode Island Percent Uninsured Rhode Island Children Children
< 18 Years Old - 1994-2003< 18 Years Old - 1994-2003
7.6
5.24.74.5
2.4
6.97.9
6.3
9
12.5
0
5
10
15
1994 1995 1996 1997 1998 1999 2000 2001 2002 2003
Per
cent
Uni
nsur
ed
Data Source: Medicaid Research and Evaluation Project, RI Access ProjectUS Bureau of the Census, Current Population Surveys 1994-2002 (September estimates)
2nd 1st
2nd 3rd
1st
3rd
National Ranking8th 25th
2nd 2nd
13
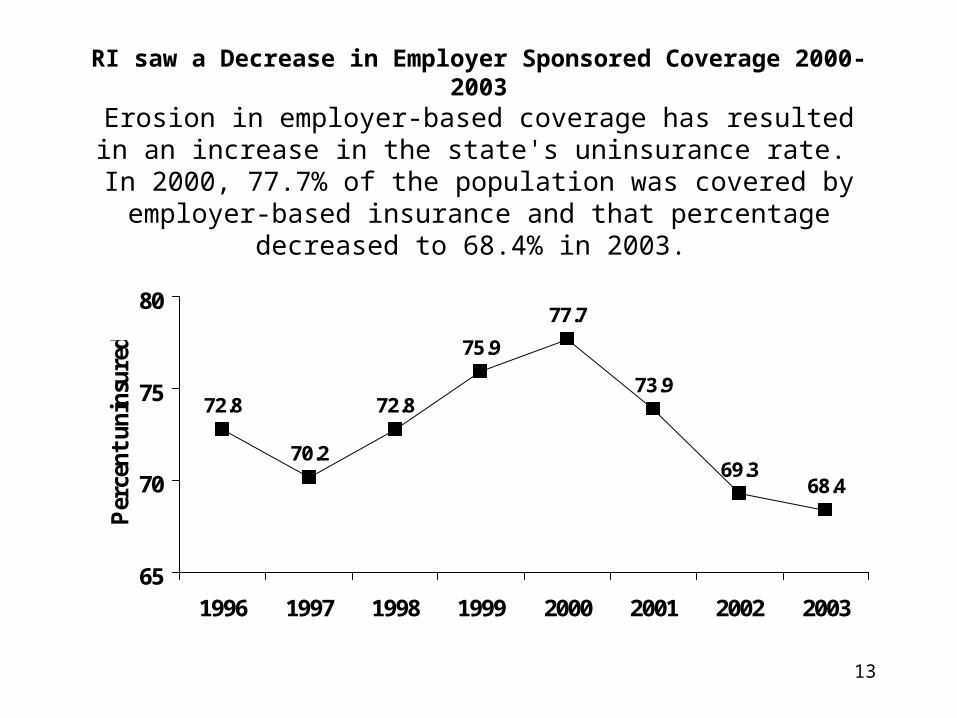
RI saw a Decrease in Employer Sponsored Coverage 2000-2003
Erosion in employer-based coverage has resulted in an increase in the state's uninsurance rate. In 2000, 77.7% of the population was covered by employer-based insurance
and that percentage decreased to 68.4% in 2003.
72.8
70.2
72.8
75.9
77.7
73.9
69.368.4
65
70
75
80
1996 1997 1998 1999 2000 2001 2002 2003
Per
cen
t u
nin
sure
d

14
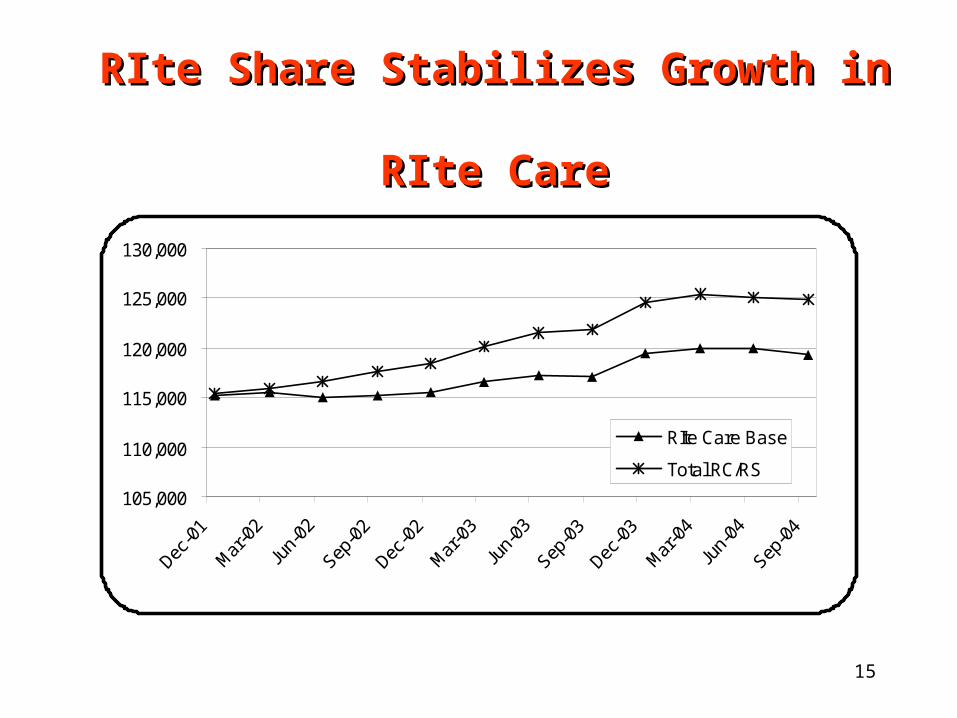
Rhode Island’s RIte Care strategy reduced uninsurance rates significantly through 2000 and helped contain the increase between 2000 and 2003
Since 2000 strategy is focused on stabilizing caseload and preventing erosion in employer sponsored health care
RIte Share – 6000 members, half the cost Access to affordable health care for small
employers and their employees
RIte Care StrategyRIte Care Strategy
15
105,000
110,000
115,000
120,000
125,000
130,000
RIte Care Base
Total RC/RS
RIte Share Stabilizes Growth in RIte Share Stabilizes Growth in RIte CareRIte Care
Goal 2:Improve access, service quality and
health status for the covered population
17
• Oversight and monitoring of Health Plan contracts • site visits • encounter data analysis
• Health Plan Performance incentives
• Trend access, quality and health outcome indicators for all enrollees
Methods
18
Performance Incentive Performance Incentive ProgramProgram
• Three types of performance goals:– Access– Clinical– Administrative
• Performance goals were selected to represent:– key areas of Health Plan performance - age and gender of the RIte Care
population
• Use of HEDIS measures plus other measures specific to the population, such as lead screening

19
Performance Category
1999 2000 2001 2002 2003 2004
Administrative 60.1% 71.5 % 65.9 % 83.7 % 79.8 % 74.8%
Access 65.7 % 61.8 % 44.0 % 73.2 % 75.8 % 81.5%
Clinical 63.1 % 57.8 % 68.2 % 68.6 % 65.8 % 59.5%
Overall 63.3 % 62.0 % 60.6 %
73.2 % 71.6 % 69.2%
Percent of Potential Incentive Payments Percent of Potential Incentive Payments Received by the Health Plans by Years Received by the Health Plans by Years Shows Significant Overall ImprovementShows Significant Overall Improvement

20
40455055606570758085
1999 2000 2001 2002 2003 2004
Year
Administration Access Clinical Overall
Percent of Potential Incentive Percent of Potential Incentive Payments Received by Health Plans Payments Received by Health Plans
Over Six YearsOver Six Years

21
Six-year Trend of Performance Six-year Trend of Performance Incentive Payments Shows Overall Incentive Payments Shows Overall
ImprovementImprovement
50
55
60
65
70
75
80
85
1999 2000 2001 2002 2003 2004
Administration Access Clinical Overall

22
Monitoring Trends
23
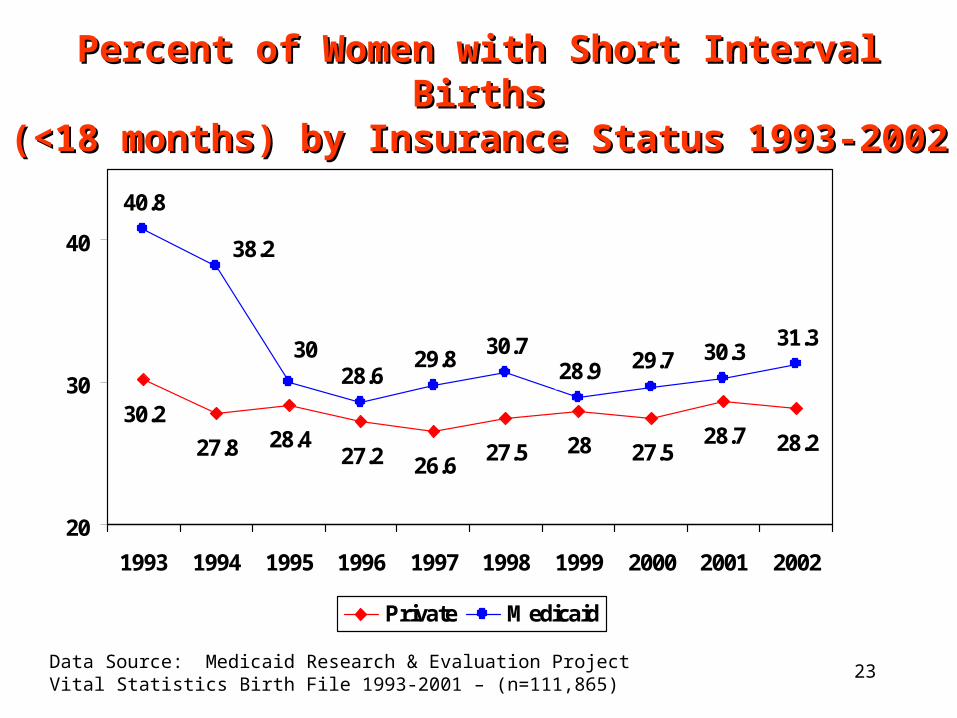
Percent of Women with Short Interval BirthsPercent of Women with Short Interval Births(<18 months) by Insurance Status 1993-(<18 months) by Insurance Status 1993-
20022002
27.8 27.528.7 28.2
40.8
28.629.8
30.728.9 29.7 30.3
31.3
2827.526.6
28.430.2
27.2
38.2
30
20
30
40
1993 1994 1995 1996 1997 1998 1999 2000 2001 2002
Private Medicaid
Data Source: Medicaid Research & Evaluation ProjectVital Statistics Birth File 1993-2001 – (n=111,865)
24
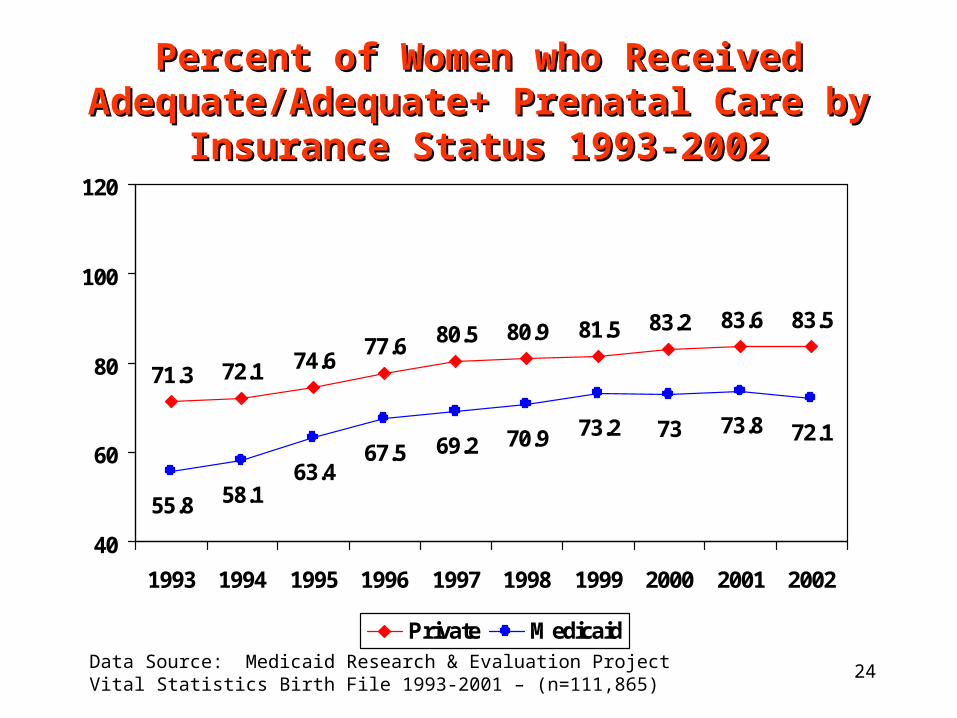
Percent of Women who Received Percent of Women who Received Adequate/Adequate+ Prenatal Care by Adequate/Adequate+ Prenatal Care by
Insurance Status 1993-2002Insurance Status 1993-2002
72.1
83.2 83.6 83.5
55.8 58.163.4
67.5 69.2 70.9 73.2 73 73.8 72.1
81.580.980.574.6
71.377.6
40
60
80
100
120
1993 1994 1995 1996 1997 1998 1999 2000 2001 2002
Private MedicaidData Source: Medicaid Research & Evaluation ProjectVital Statistics Birth File 1993-2001 – (n=111,865)
25
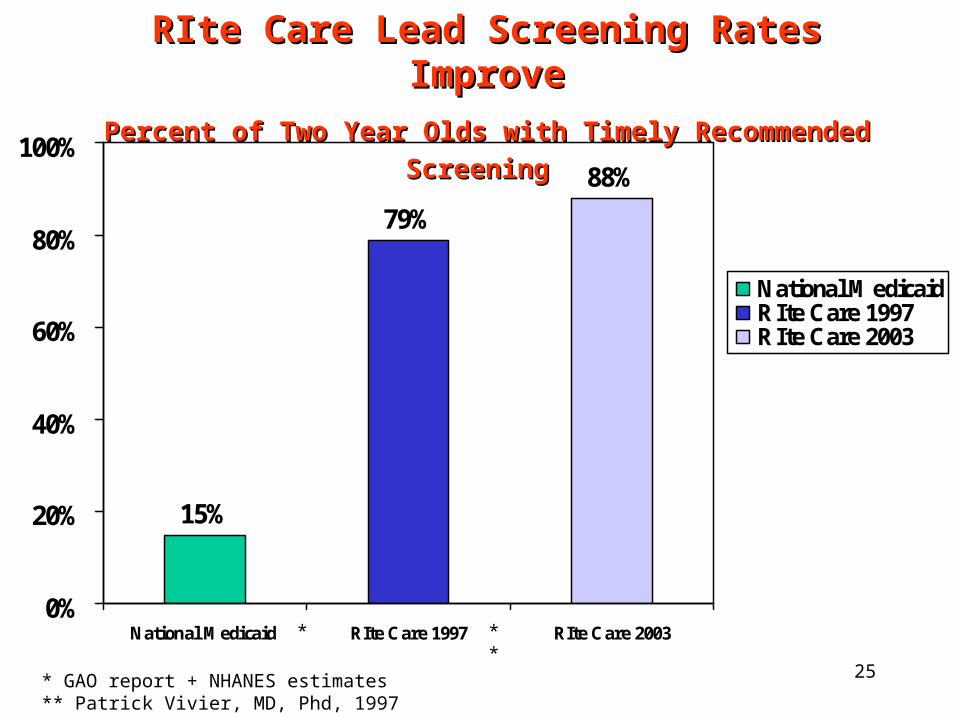
15%
88%
79%
0%
20%
40%
60%
80%
100%
National Medicaid RIte Care 1997 RIte Care 2003
National Medicaid RIte Care 1997RIte Care 2003
RIte Care Lead Screening Rates RIte Care Lead Screening Rates ImproveImprove
Percent of Two Year Olds with Timely Recommended Percent of Two Year Olds with Timely Recommended ScreeningScreening
* **
* GAO report + NHANES estimates** Patrick Vivier, MD, Phd, 1997

26
Comparison of Lead Screening and Lead Poisoning Comparison of Lead Screening and Lead Poisoning Rates for RIte Care and Commercially Insured Rates for RIte Care and Commercially Insured
Children Children Enrolled in the Same Managed Care OrganizationEnrolled in the Same Managed Care Organization
20032003
Measure Commercial RIte Care
Lead Screening
Percent Ever Screened
87 % 88 %
Percent Never Screened
13 % 12 %
Lead Poisoning
Percent ≥ 10 ug/dL 7 % 17 %
Percent < 10 ug.dL 93 % 83 %
Source: O’Hare, C. et. al. Lead Screening and Lead Poisoning in Medicaid and Commercially Insured Children Enrolled in the Same Managed Care Organization, American Public Health Association Poster Session, 2003.

27
Immunization Rates for Children Immunization Rates for Children Enrolled in RIte Care Exceed the Enrolled in RIte Care Exceed the
National AverageNational AverageImmunization Rates for 19- to 35-month-Immunization Rates for 19- to 35-month-
olds: olds: US, RI and to RIte CareUS, RI and to RIte Care Overall* DtaP% Hib% Hepatitis B% MMR% Polio%
National (CDC)
76 81 93 84 91 91
Rhode Island (CDC)
81 89 96 87 95 96
RIte Care 81 87 94 88 91 95
*Overall status includes all vaccines except hepatitis B Source: Vivier P.M. et. al. “An analysis of the immunization status of pre-school children enrolled in a statewide Medicaid Managed Care Program,” The Journal of Pediatrics, 139(5), November 2001, 624-
629.
28
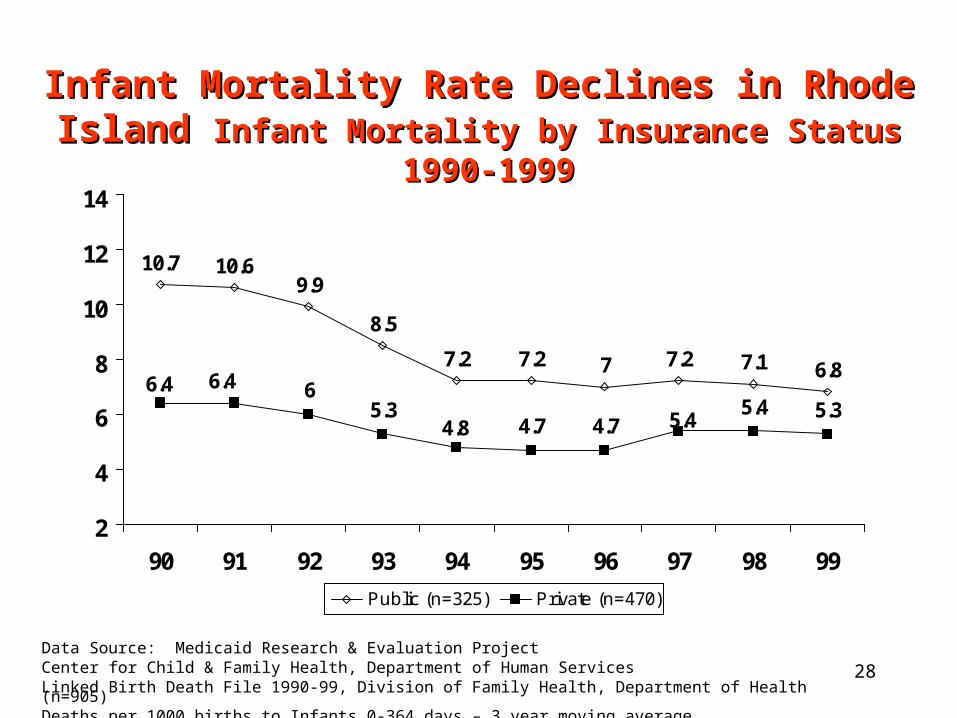
Infant Mortality Rate Declines in Rhode Infant Mortality Rate Declines in Rhode Island Island Infant Mortality by Insurance StatusInfant Mortality by Insurance Status
1990-19991990-1999
10.6
7.2 7.1 6.86
5.34.7 4.7
5.4 5.3
77.27.2
9.910.7
8.5
4.8 5.4
6.4 6.4
2
4
6
8
10
12
14
90 91 92 93 94 95 96 97 98 99
Public (n=325) Private (n=470)
Data Source: Medicaid Research & Evaluation ProjectCenter for Child & Family Health, Department of Human ServicesLinked Birth Death File 1990-99, Division of Family Health, Department of Health (n=905)Deaths per 1000 births to Infants 0-364 days – 3 year moving average

29
Rhode Island’s Neonatal Mortality Rate Rhode Island’s Neonatal Mortality Rate DeclinesDeclines
Neonatal Mortality by Insurance StatusNeonatal Mortality by Insurance Status 1990-19991990-1999
6.2
4.8 4.9 4.84.6
4 3.9 4 4.23.9
4.54.74.5
6.36.2
5.4
3.84.4
5.2 5.1
2
4
6
8
90 91 92 93 94 95 96 97 98 99
Public (n=325) Private (n=470)
Data Source: Medicaid Research & Evaluation ProjectCenter for Child & Family Health, Department of Human ServicesLinked Birth Death File 1990-99, Division of Family Health, Department of Health (n=905)Deaths per 1000 births to Infants 0-364 days – 3 year moving average

30
Rhode Island’s Postneonatal Mortality Rate Rhode Island’s Postneonatal Mortality Rate Declines Declines
for Publicly Funded Birthsfor Publicly Funded BirthsRhode Island Postneonatal Mortality by Insurance StatusRhode Island Postneonatal Mortality by Insurance Status
1990-19991990-1999
4.3
2.4 2.2
1.5 1.4
0.8 0.81.3
1.9
2.52.52.7
3.6
4.5
3.1
1.41 11.2 1.3
0
1
2
3
4
5
6
90 91 92 93 94 95 96 97 98 99
Public (n=325) Private (n=470)
Data Source: Medicaid Research & Evaluation ProjectCenter for Child & Family Health, Department of Human ServicesLinked Birth Death File 1990-99, Division of Family Health, Department of Health (n=905)Deaths per 1000 births to Infants 0-364 days – 3 year moving average
31
Goal 3:Control the rate of growth in Medicaid
expenditures for the eligible population
32
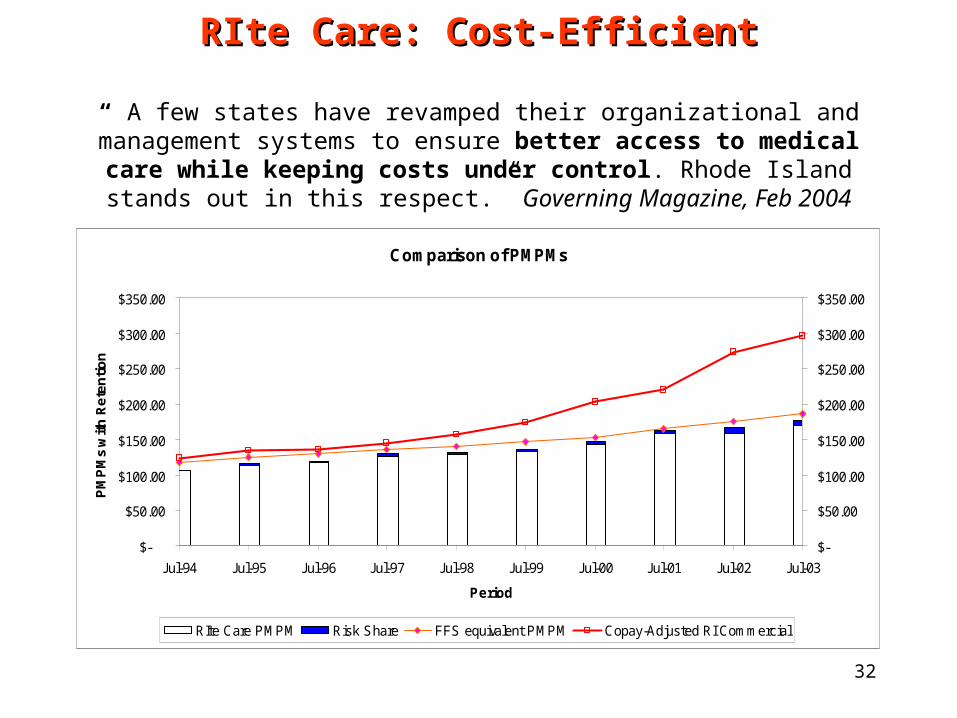
RIte Care: Cost-EfficientRIte Care: Cost-Efficient
“ A few states have revamped their organizational and management systems to ensure better access to medical care while keeping costs under control. Rhode
Island stands out in this respect.” Governing Magazine, Feb 2004
Comparison of PMPMs
$-
$50.00
$100.00
$150.00
$200.00
$250.00
$300.00
$350.00
Jul-94 Jul-95 Jul-96 Jul-97 Jul-98 Jul-99 Jul-00 Jul-01 Jul-02 Jul-03
Period
PM
PM
s w
ith
Re
ten
tio
n
$-
$50.00
$100.00
$150.00
$200.00
$250.00
$300.00
$350.00
RIte Care PMPM Risk Share FFS equivalent PMPM Copay-Adjusted RI Commercial

33
Lessons Learned

34
“Lessons for other States” Building Quality into RIte Care: How RIte Care is Improving
Health Care for Its Low-Income Populationsby Sharon Silow-Carroll*
• Start Early to Establish a Baseline
• Use the Data in a Variety of Ways
• Integrate Research into the Medicaid Program
• Use Interdisciplinary Team
• Ensure Access to Data• Acknowledge Trade-offs
in Subsidizing Private Health Coverage
• Supplement Research and Evaluation with Outside Funding
• Monitor Long Term Goals
*Field Report, The Commonwealth Fund, January 2003