1 References used according to the letters given at the bottom of the slides A: Santer, RM, Walker,...
42
Fish physiology Horst Kaiser Ichthyology II, 2012 2
-
Upload
mary-bradley -
Category
Documents
-
view
224 -
download
1
Transcript of 1 References used according to the letters given at the bottom of the slides A: Santer, RM, Walker,...

2
Fish physiology
Horst Kaiser
Ichthyology II, 2012
3
Respiration

Life in water (1/2)
• Water is 840 times more dense and 60 times more viscous than air.
• Oxygen:– Air: 210 ml/L O2 at 21% partial pressure
– Water: up 15 mg/L O2 (dep. on temperature)
– Sea water holds 18% less O2 than freshwater
• Oxygen consumption in fish– 17 mg/kg/h @10°C– 100-500 mg/kg/h @ 30°C
• More than 40 genera of fishes breath oxygen using other methods than their gills.
4
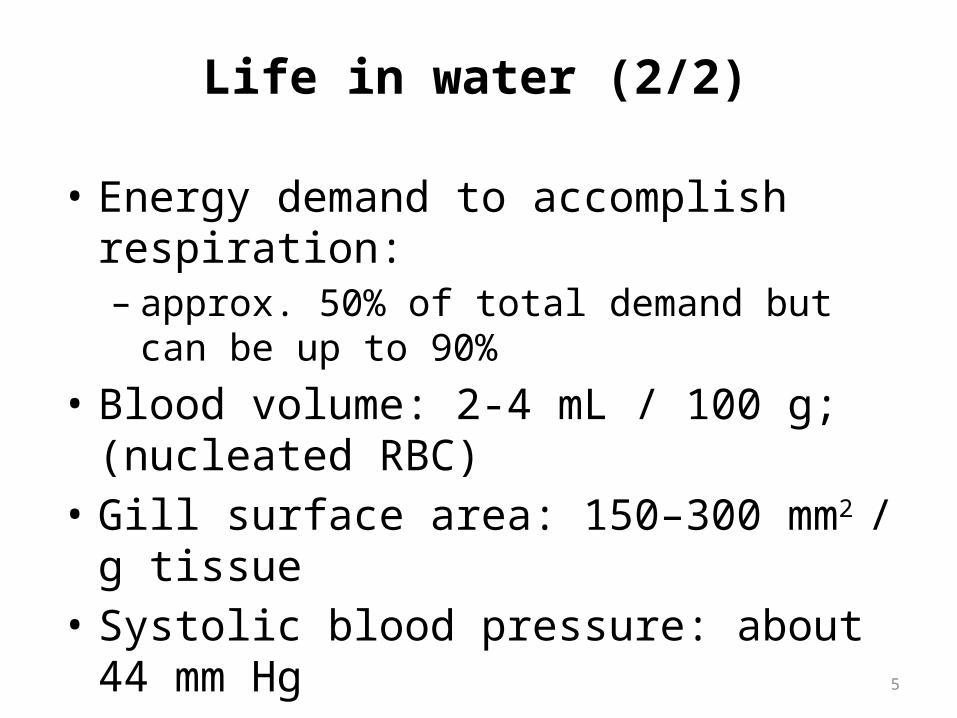
Life in water (2/2)
• Energy demand to accomplish respiration: – approx. 50% of total demand but can be up to
90%• Blood volume: 2-4 mL / 100 g; (nucleated RBC)• Gill surface area: 150–300 mm2 / g tissue• Systolic blood pressure: about 44 mm Hg• Gill irrigation: 5-20 L H2O / kg BM / h• Opercular beat counts: 40-60 / minute
5

6
Henry’s law
VO2 = α PO2
VO2 = O2 concentration in ml/L (or mg/L)
α = solubility coefficient: the volume of O2
dissolved in water: ml O2/L/atm
PO2 = PO2 partial pressure (atm)

Metabolism of trout vs turtleTrout Turtle
Oxygen requirement ~ 5 ml / min / kg ~ 5 ml / min / kg
Ventilation volume 600 ml H2O / min / kg
50 ml air / min / kg
Routine costs for ventilation 10 % 2 %
ref. D

8
Water flow
Blood flow
Blood flow
Water flow
Water flow

9
Gills and kidney: Osmoregulatory organs

10
PAIRED HOLOBRANCHS
Gill rakers
Four paired holobranchs
tongue
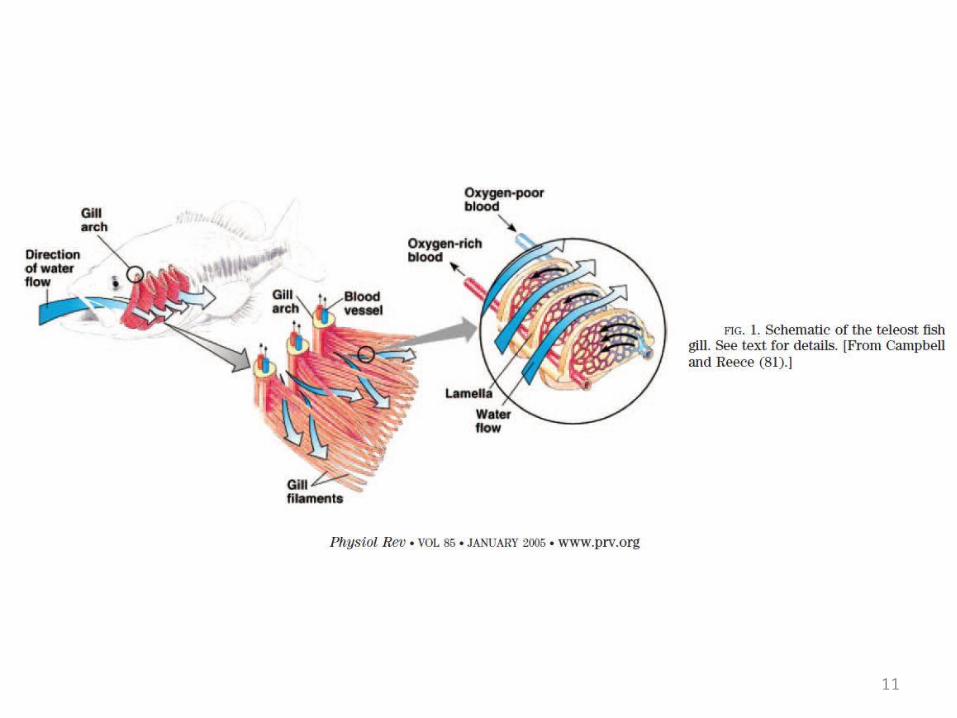
11
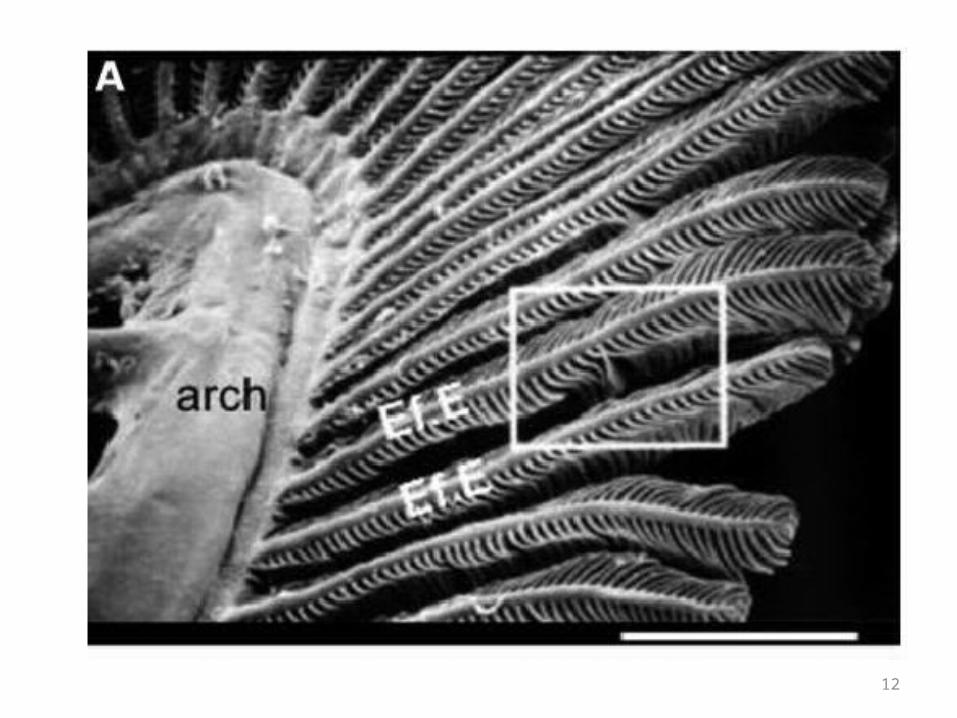
12

13
Decreasing oxygen level
Increasing oxygen level
Water interface at the lamella
Countercurrent exchange
The difference in oxygen partial pressure PO2 between water and plasma strongly influences the uptake of oxygen at the gill lamella / water interface!

14
Hagfish gill pouch

Atlantic mackerelScomber scombrus
Horse mackerelTrachurus trachurus
Oyster toadfishOpsanus tau
Eel, Anguilla japonica
AnglerLophius piscatorius
Skipkack tuna, Katsuwonus pelamis

16
Scomber scombrus
Trachurus trachurus
Katsuwonus pelamis
Anguilla anguilla
Lophius piscatorius
Opsanus tau
Notothenia rossi
Gobionotothen gibberifrons
Patagonotothen tesselata
0 200 400 600 800 1000 1200 1400 1600
Unit gill area: mm2 / g body mass

17
Scomber scombrus
Trachurus trachurus
Katsuwonus pelamis
Anguilla anguilla
Lophius piscatorius
Opsanus tau
Notothenia rossi
Gobionotothen gibberifrons
Patagonotothen tesselata
0 5 10 15 20 25 30 35 40 45
Number of gill lamellae / mm filament length

Model: R=a*W b
R=0.56*W 0.679
0 2 4 6 8 10 12 14 16 18
Weight (g/fish)
0.0
0.5
1.0
1.5
2.0
2.5
3.0
3.5
4.0
4.5
mg
O2
/ h
Oxygen consumption in grunter
Data are from John Radull’s thesis

Model: R=a*W b
R=0.67*W -.042
0 2 4 6 8 10 12 14 16 18
Weight (g/fish)
0.0
0.1
0.2
0.3
0.4
0.5
0.6
0.7
mg
O2
/g/h
Oxygen consumption in grunter
Data are from John Radull’s thesis
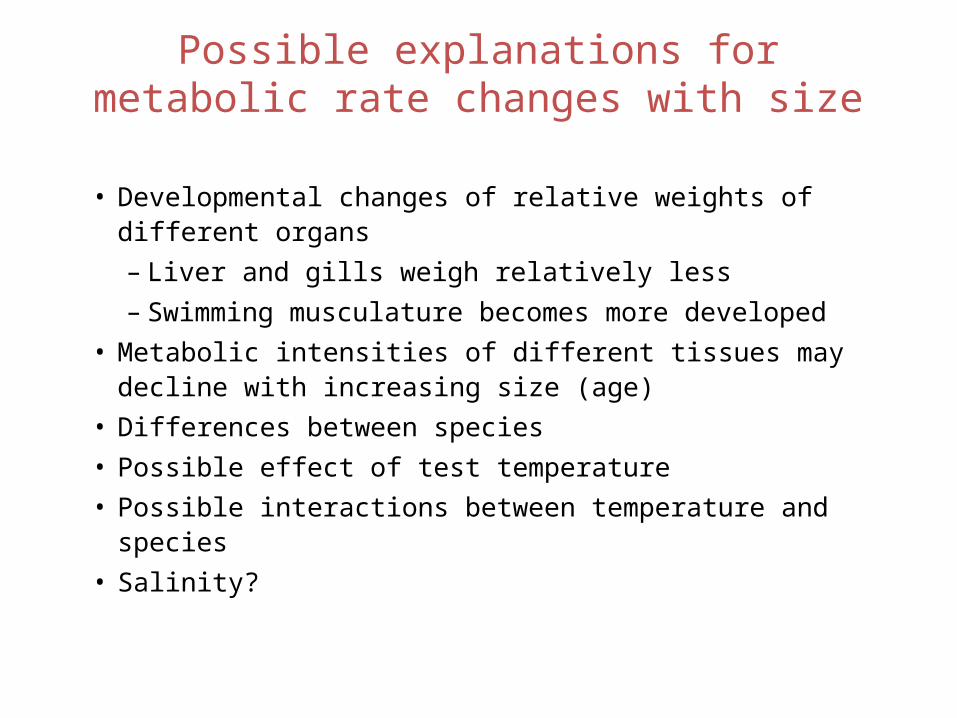
Possible explanations for metabolic rate changes with size
• Developmental changes of relative weights of different organs– Liver and gills weigh relatively less– Swimming musculature becomes more developed
• Metabolic intensities of different tissues may decline with increasing size (age)
• Differences between species• Possible effect of test temperature• Possible interactions between temperature and species• Salinity?

21
Metabolic rate in fish• Standard metabolic rate (SMR)• Routine metabolic rate (RMR)• Active metabolic rate (AMR)• Metabolic scope (MS): MS = SMR – AMR

22
0.00
0.20
0.40
0.60
0.80
12:00 16:00 20:00 0:00 4:00 8:00Hour of day
Oxyg
en co
nsum
ption
(mg.g
-1.h
-1)
AMR
SMR
ref. F

23
MS
POSIS
Oxygen probe
Mechanical stirrer
Syringe
Water flow
Glass flask
Water flow
Intermittent respirometry
ref. G

Intermittent respirometry and its applications
Some research examples and applications

25
0
0.1
0.2
0.3
0.4
0.5
0.6
0.7
0 50 100 150 200 250
Time after stress application (min)
Oxyg
en co
nsum
ption (
mg g
-1h-1
)
Ref.: Radull et al. 2000
The effect of handling stress on metabolic rate changes in spotted grunter
26
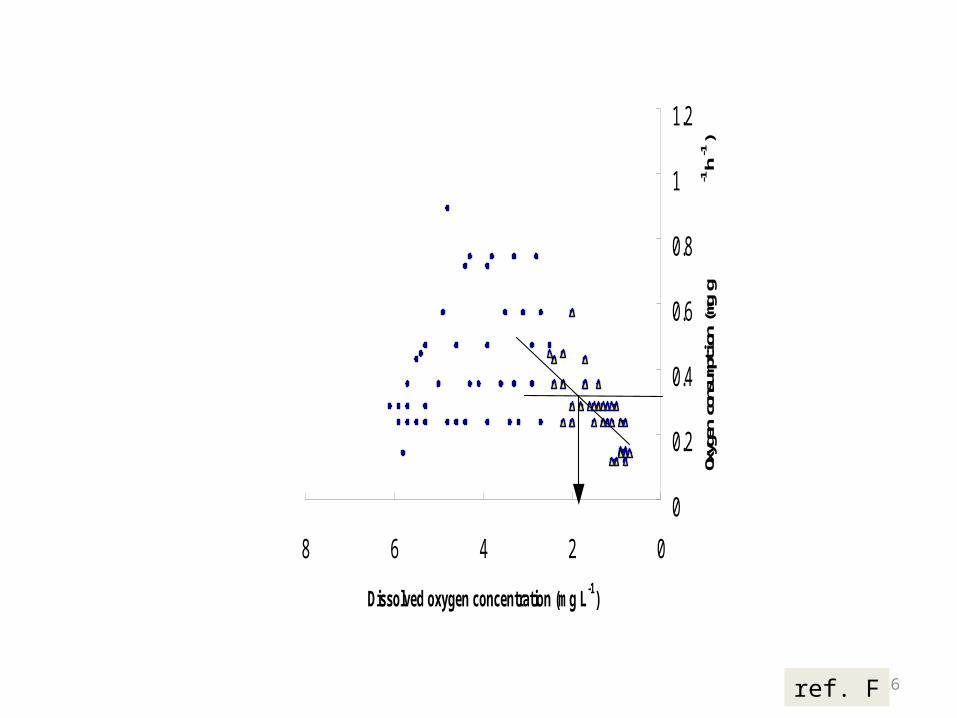
0
0.2
0.4
0.6
0.8
1
1.2
02468
Dissolved oxygen concentration (mg L-1)
Oxyg
en co
nsum
ption
(mg g
-1h
-1)
ref. F
27
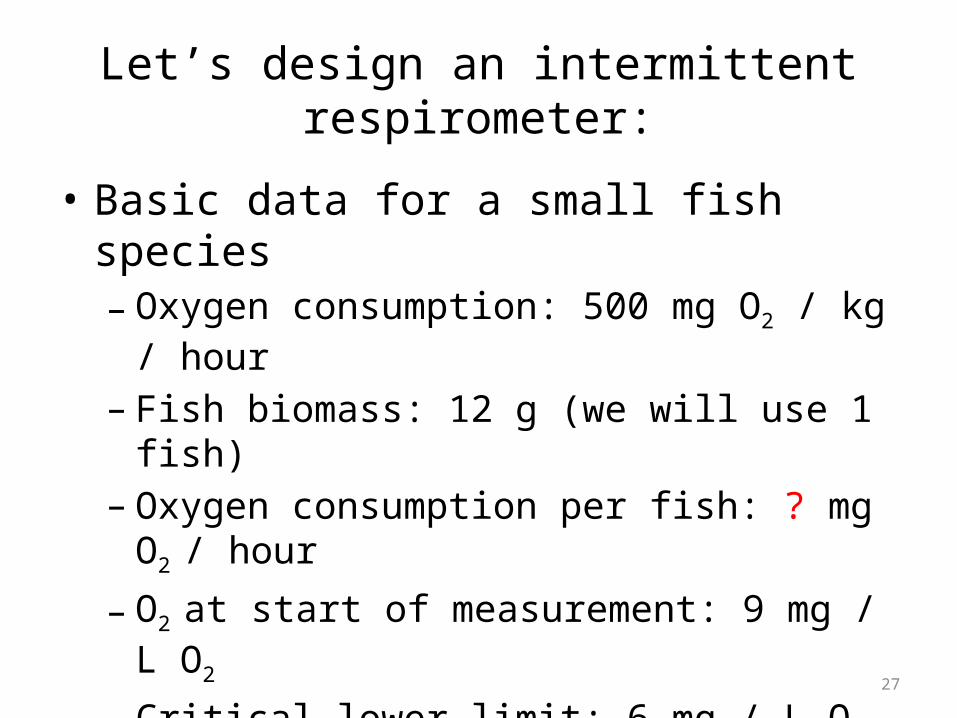
Let’s design an intermittent respirometer:
• Basic data for a small fish species– Oxygen consumption: 500 mg O2 / kg / hour– Fish biomass: 12 g (we will use 1 fish)– Oxygen consumption per fish: ? mg O2 / hour
– O2 at start of measurement: 9 mg / L O2
– Critical lower limit: 6 mg / L O2
– How many minutes should one measurement take assuming the volume of the respirometer is 1000 mL (1 Liter)?

28
Let’s design an intermittent respirometer:
• Basic data for a small fish species– Oxygen consumption: 500 mg O2 / kg / hour– Fish biomass: 12 g– Oxygen consumption: ? mg O2 / hour
• 500 mg O2 / (1000 g / 12 g) / hour = 6 mg / hour
– O2 at start of measurement: 9 mg / L O2
– Critical lower limit: 6 mg / L O2
• Consumption: 9 – 6 mg = 3 mg O2
– How many minutes should one measurement take?• 3 mg O2 / (6 mg O2 / hour) = 0.5 hours = 30 minutes

29
Respiration
Ventilation
O2 diffusion
O2 dissolves into plasma
O2 binds to haemoglobin
in RBCs
O2 diffuses across
capillary walls &
cytoplasm to mitochondria
Once O2 has been
offloaded CO2 diffuses into the RBC
CO2 is transported to gills and excreted

30
Osmo-regulation
Acid-basebalance
Respiration
Nitrogen-excretion
31
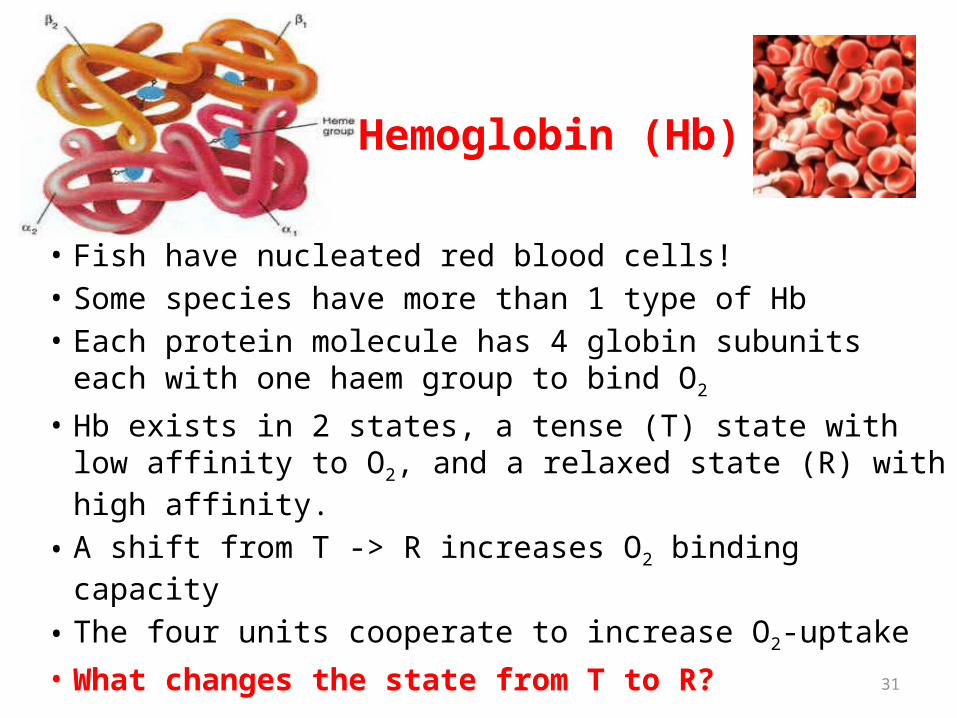
• Fish have nucleated red blood cells!• Some species have more than 1 type of Hb• Each protein molecule has 4 globin subunits each with
one haem group to bind O2
• Hb exists in 2 states, a tense (T) state with low affinity to O2, and a relaxed state (R) with high affinity.
• A shift from T -> R increases O2 binding capacity
• The four units cooperate to increase O2-uptake• What changes the state from T to R?
Hemoglobin (Hb)
32
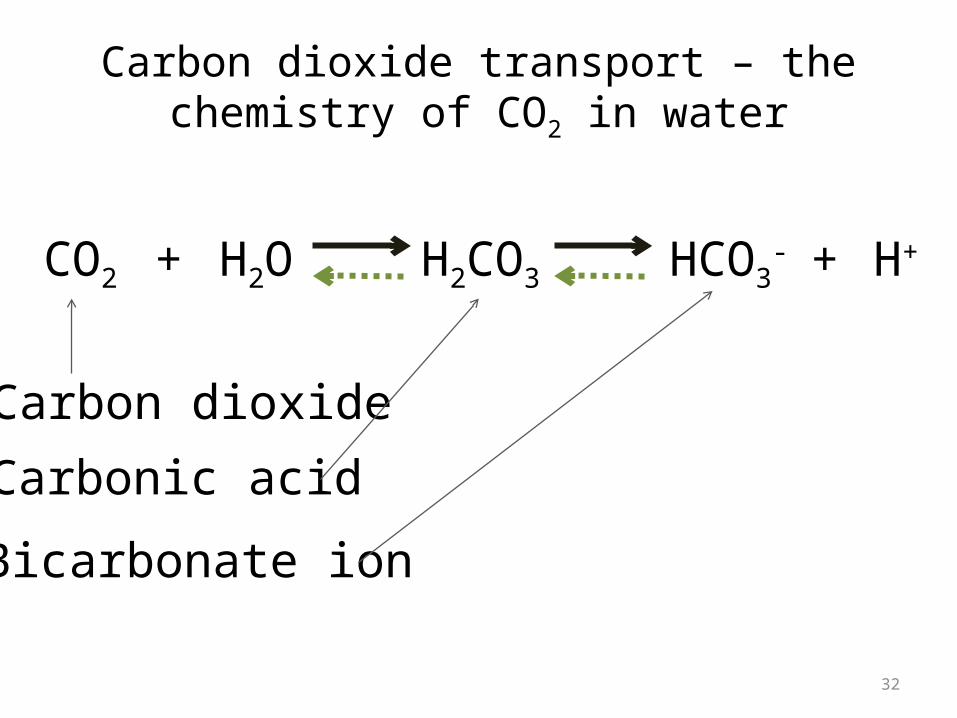
Carbon dioxide transport – the chemistry of CO2 in water
CO2 H2O H2CO3 HCO3- H++ +
Carbon dioxide
Carbonic acid
Bicarbonate ion

33
Extracellular
Carbonic anhydrase speeds up carbon dioxide dissociation in the cell
CO2 H2O H2CO3 HCO3- H++ +
CO2 H2O H2CO3 HCO3- H++ +
Carbonic anhydrase
Red blood cell
Slow reaction
Fast reaction

34
Carbonic anhydrase speeds up carbon dioxide dissociation at the tissues
CO2 H2O H2CO3 HCO3- H++ +
Carbonic anhydraseFast reaction
Drop in pH !
Hemoglobin changes state and releases O2 O2 diffuse to plasma
and tissues
HCO3- transport to plasma
in exchange for Cl-

35
Carbonic anhydrase speeds up carbon dioxide dissociation at the gills
CO2 H2OH2CO3 +
Carbonic anhydraseFast reaction
Release of CO2 increases pH
Hemoglobin changes state and is ready to pick up O2 at the gills.
CO2 diffusion to plasma and water
HCO3- H++
HCO3- transport to blood
cell in exchange for Cl-

Partial pressure of oxygen (PO2)
Perc
ent s
atur
ation
of H
b w
ith O
2higher pH(gills)
lower pH(tissues)
Bohr effect
Exponential increasedue to Hb subunit cooperation Dissociation
curves parallel
Reduced affinity under acidic conditions36ref. B
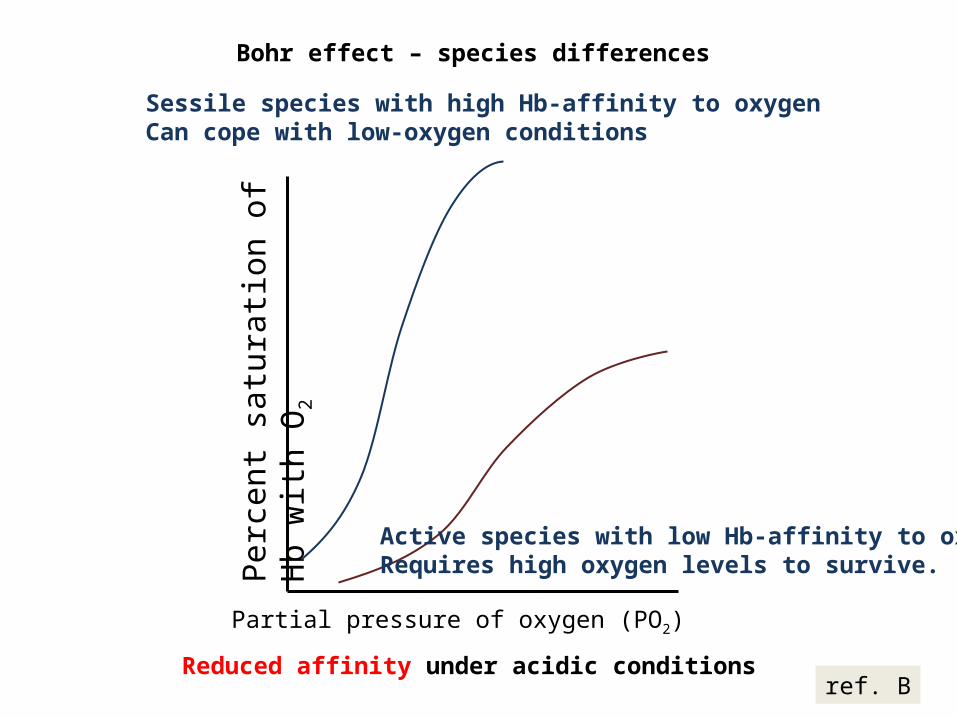
Partial pressure of oxygen (PO2)
Perc
ent s
atur
ation
of H
b w
ith O
2
Bohr effect – species differences
Reduced affinity under acidic conditions37ref. B
Sessile species with high Hb-affinity to oxygenCan cope with low-oxygen conditions
Active species with low Hb-affinity to oxygenRequires high oxygen levels to survive.

38
O2 CO2
Gill interface Blood stream
pH O2to organs
Excess CO2 through respiration, and in water
Drop in blood pH (lactic acid, stress, excessive swimming)
Reduced opercular movement -> impaired CO2 excretion
Hyper-capnia
Hyper-lacticaemia
Increased Bohr and root effect
O2 CO2
CO2
pH
39
Why is the Root effect unique to fish?
• Oxygen supply to the retina• Gas bladder function

40
Release of gas from the gas bladder
• Physostomous fishes– Pneumatic duct to the gut in most but not all species
• Physoclistous fishes– Closed gas bladder– Release gas into the blood (specialised oval area)– Excess gas is carried to the gills

41
The rete counter-current systemExample: gas bladder rete in eel• Cross section: 5 mm2
• Volume: 21 mm3
• Surface area: 30 cm2
• Capillaries: 20.000 to 40.000• Artery diameter: 9 - 10 µm• Venous capillary: 11 – 13 µm• Diffusion distance (capillaries): 1 µm• Capillary length: 4 mm• Holes in capillary: 20 – 80 nm• Hole diaphragm: 5 nm
Eye
Gas bladder
ref. B
42
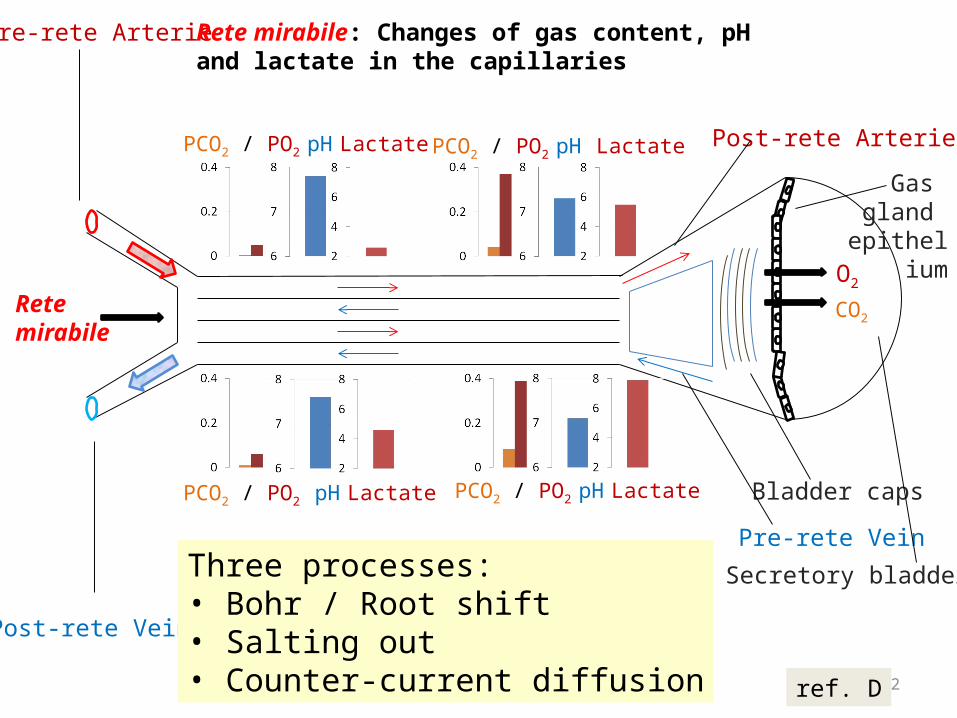
PCO2 / PO2 LactatepH LactatepH
LactatepHLactatepH
PCO2 / PO2
PCO2 / PO2PCO2 / PO2
Pre-rete Arterie
Post-rete Vein
Gas gland
epithelium
Secretory bladder
Bladder caps
Post-rete Arterie
Pre-rete Vein
Rete mirabile: Changes of gas content, pH and lactate in the capillaries
Rete mirabile
Three processes:• Bohr / Root shift• Salting out• Counter-current diffusion
O2
CO2
ref. D

43
Partial pressure of oxygen (PO2)
Perc
ent s
atur
ation
of H
b w
ith O
2
higher pH(gills)
much lower pH(retina / swimbladder)
Root effect
Subunit cooperation Some
subunits fail to load O2
O2 Saturation is not reachedeven if sufficient O2 available!
Decreased capacity under acidic conditions