1 Psychoacoustics - Thieme
11
1 1 Psychoacoustics What Is the Difference between dB HL and dB SPL? The decibel ( dB) is a logarithmic unit of measurement used to express the magnitude of a sound relative to some reference level. Decibels in hearing level, or dB HL, is com- monly used in audiology because it refers to the decibel level on the audiometer. The reference level for dB HL is “0,” which is related to the average threshold in decibels sound pressure level (dB SPL) for the average, normal-hearing listener. In Fig. 1.1, the solid black line represents the average auditory threshold in dB SPL at each audio- metric frequency. Each threshold in dB SPL, which is noted in the table at the bottom of Fig. 1.1, is equal to 0 dB HL on the audiometer for the corresponding frequency. Decibels in sound pressure level, or dB SPL, refers to the magnitude of the dis- placement of molecules in the air. The reference for dB SPL is 20 micropascals (20 μPa) or 0.0002 dynes/cm 2 . Because it is easy to measure dB SPL with a condenser or free-field microphone coupled to a sound level meter, sound measurements are often expressed in dB SPL. What Is the Difference between dB IL and dB SPL? As stated in the previous section, a common method to express the magnitude of a sound is in decibels sound pressure level or dB SPL, for which the reference is 0.0002 dynes/cm 2 . A less common method to express sound intensity is in acous- tic power by using decibels intensity level, or dB IL. The reference for dB IL is 10 −16 W/cm 2 . According to Gulick, Gescheider, and Frisina (1989), “a dangerously intense sound would represent a power of only about 0.0024 watt” (p. 46). As a result, it is cumbersome to measure the incredibly small amounts of power associated with ◆ ◆ Fig. 1.1 Average thresh- olds across frequency in dB SPL, corresponding to 0 dB HL. For example, at 125 Hz: 0 dB HL = 45 dB SPL, and at 1000 Hz: 0 dB HL = 7 dB SPL. (From: Roeser, R. J., & Clark, J. L. (2007). Pure-tone tests. In R. J. Roeser, M. Valente, & H. Hosford-Dunn (Eds.). Audiology: Diag- nosis . 2nd ed. (pp. 238–260). New York: Thieme Medical Publishers, Inc.)
Transcript of 1 Psychoacoustics - Thieme
1
1 Psychoacoustics
What Is the Difference between dB HL and dB SPL?
The decibel ( dB ) is a logarithmic unit of measurement used to express the magnitude of a sound relative to some reference level. Decibels in hearing level, or dB HL , is com-monly used in audiology because it refers to the decibel level on the audiometer. The reference level for dB HL is “0,” which is related to the average threshold in decibels sound pressure level (dB SPL) for the average, normal-hearing listener. In Fig. 1.1 , the solid black line represents the average auditory threshold in dB SPL at each audio-metric frequency. Each threshold in dB SPL, which is noted in the table at the bottom of Fig. 1.1 , is equal to 0 dB HL on the audiometer for the corresponding frequency.
Decibels in sound pressure level, or dB SPL , refers to the magnitude of the dis-placement of molecules in the air. The reference for dB SPL is 20 micropascals (20 μPa) or 0.0002 dynes/cm 2 . Because it is easy to measure dB SPL with a condenser or free-fi eld microphone coupled to a sound level meter, sound measurements are often expressed in dB SPL.
What Is the Difference between dB IL and dB SPL?
As stated in the previous section, a common method to express the magnitude of a sound is in decibels sound pressure level or dB SPL, for which the reference is 0.0002 dynes/cm 2 . A less common method to express sound intensity is in acous-tic power by using decibels intensity level, or dB IL . The reference for dB IL is 10 −16 W/cm 2 . According to Gulick, Gescheider, and Frisina (1989) , “a dangerously intense sound would represent a power of only about 0.0024 watt” (p. 46). As a result, it is cumbersome to measure the incredibly small amounts of power associated with
◆
◆
Fig. 1.1 Average thresh-olds across frequency in dB SPL, corresponding to 0 dB HL. For example, at 125 Hz: 0 dB HL = 45 dB SPL, and at 1000 Hz: 0 dB HL = 7 dB SPL. (From: Roeser, R. J., & Clark, J. L. (2007). Pure-tone tests. In R. J. Roeser, M. Valente, & H. Hosford-Dunn (Eds.). Audiology: Diag-nosis . 2nd ed. (pp. 238–260). New York: Thieme Medical Publishers, Inc.)
7050027C01.indd 17050027C01.indd 1 7/19/10 10:20:19 AM7/19/10 10:20:19 AM
2 Audiology Answers for Otolaryngologists
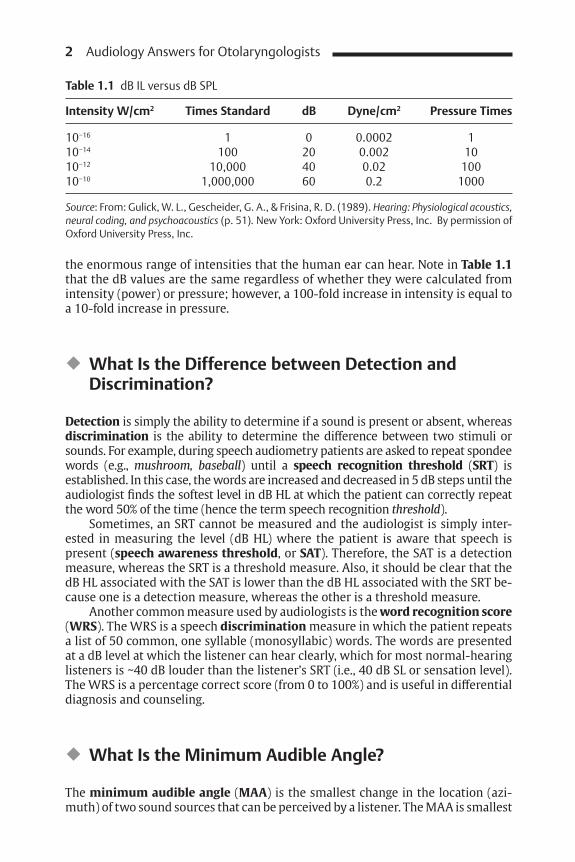
Table 1.1 dB IL versus dB SPL
Intensity W/cm 2 Times Standard dB Dyne/cm 2 Pressure Times
10 −16 1 0 0.0002 110 −14 100 20 0.002 1010 −12 10,000 40 0.02 10010 −10 1,000,000 60 0.2 1000
Source: From: Gulick, W. L., Gescheider, G. A., & Frisina, R. D. (1989). Hearing: Physiological acoustics, neural coding, and psychoacoustics (p. 51). New York: Oxford University Press, Inc. By permission of Oxford University Press, Inc.
the enormous range of intensities that the human ear can hear. Note in Table 1.1 that the dB values are the same regardless of whether they were calculated from intensity (power) or pressure; however, a 100-fold increase in intensity is equal to a 10-fold increase in pressure.
What Is the Difference between Detection and Discrimination?
Detection is simply the ability to determine if a sound is present or absent, whereas discrimination is the ability to determine the diff erence between two stimuli or sounds. For example, during speech audiometry patients are asked to repeat spondeewords (e.g., mushroom , baseball ) until a speech recognition threshold ( SRT ) is established. In this case, the words are increased and decreased in 5 dB steps until the audiologist fi nds the softest level in dB HL at which the patient can correctly repeat the word 50% of the time (hence the term speech recognition threshold ) .
Sometimes, an SRT cannot be measured and the audiologist is simply inter-ested in measuring the level (dB HL) where the patient is aware that speech is present ( speech awareness threshold , or SAT ). Therefore, the SAT is a detection measure, whereas the SRT is a threshold measure. Also, it should be clear that the dB HL associated with the SAT is lower than the dB HL associated with the SRT be-cause one is a detection measure, whereas the other is a threshold measure.
Another common measure used by audiologists is the word recognition score ( WRS ). The WRS is a speech discrimination measure in which the patient repeats a list of 50 common, one syllable (monosyllabic) words. The words are presented at a dB level at which the listener can hear clearly, which for most normal-hearing listeners is ~40 dB louder than the listener’s SRT (i.e., 40 dB SL or sensation level). The WRS is a percentage correct score (from 0 to 100%) and is useful in diff erential diagnosis and counseling.
What Is the Minimum Audible Angle?
The minimum audible angle ( MAA ) is the smallest change in the location (azi-muth) of two sound sources that can be perceived by a listener. The MAA is smallest
◆
◆
7050027C01.indd 27050027C01.indd 2 7/19/10 10:20:23 AM7/19/10 10:20:23 AM
1 Psychoacoustics 3
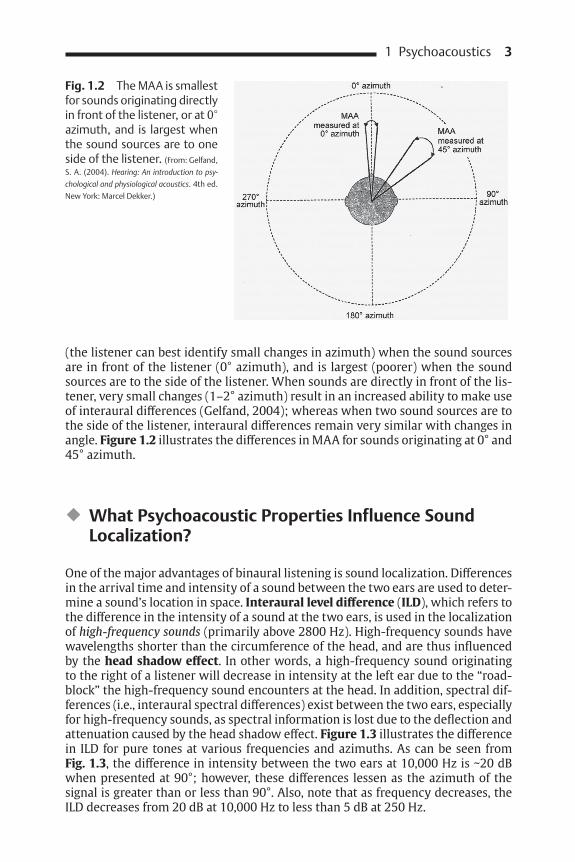
Fig. 1.2 The MAA is smallest for sounds originating directly in front of the listener, or at 0° azimuth, and is largest when the sound sources are to one side of the listener. (From: Gelfand, S. A. (2004). Hearing: An introduction to psy-chological and physiological acoustics. 4th ed. New York: Marcel Dekker.)
(the listener can best identify small changes in azimuth) when the sound sources are in front of the listener (0° azimuth), and is largest (poorer) when the sound sources are to the side of the listener. When sounds are directly in front of the lis-tener, very small changes (1–2° azimuth) result in an increased ability to make use of interaural diff erences ( Gelfand, 2004 ); whereas when two sound sources are to the side of the listener, interaural diff erences remain very similar with changes in angle. Figure 1.2 illustrates the diff erences in MAA for sounds originating at 0° and 45° azimuth.
What Psychoacoustic Properties Influence Sound Localization?
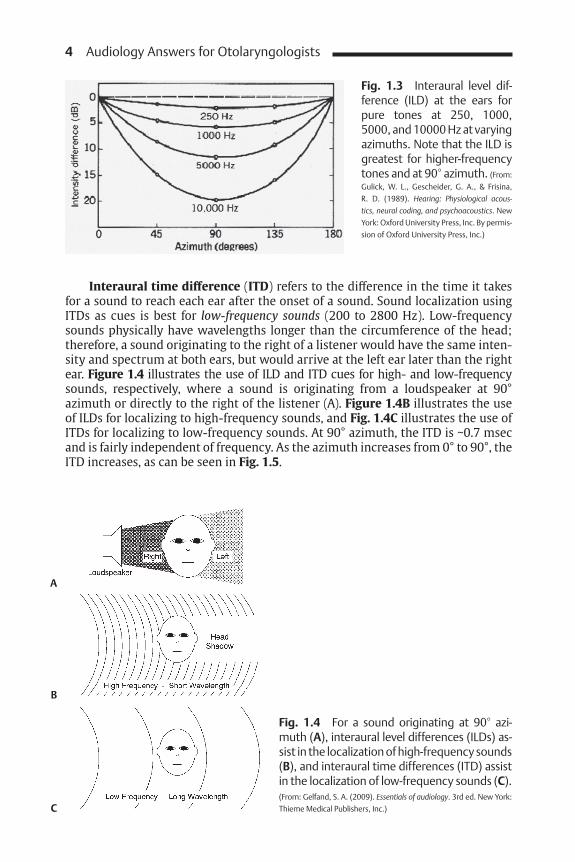
One of the major advantages of binaural listening is sound localization. Diff erences in the arrival time and intensity of a sound between the two ears are used to deter-mine a sound’s location in space. Interaural level diff erence ( ILD ), which refers to the diff erence in the intensity of a sound at the two ears, is used in the localization of high-frequency sounds (primarily above 2800 Hz). High-frequency sounds have wavelengths shorter than the circumference of the head, and are thus infl uenced by the head shadow eff ect . In other words, a high-frequency sound originating to the right of a listener will decrease in intensity at the left ear due to the “road-block” the high-frequency sound encounters at the head. In addition, spectral dif-ferences (i.e., interaural spectral diff erences) exist between the two ears, especially for high-frequency sounds, as spectral information is lost due to the defl ection and attenuation caused by the head shadow eff ect. Figure 1.3 illustrates the diff erence in ILD for pure tones at various frequencies and azimuths. As can be seen from Fig. 1.3 , the diff erence in intensity between the two ears at 10,000 Hz is ~20 dB when presented at 90°; however, these diff erences lessen as the azimuth of the signal is greater than or less than 90°. Also, note that as frequency decreases, the ILD decreases from 20 dB at 10,000 Hz to less than 5 dB at 250 Hz.
◆
7050027C01.indd 37050027C01.indd 3 7/19/10 10:20:23 AM7/19/10 10:20:23 AM
4 Audiology Answers for Otolaryngologists
Interaural time diff erence ( ITD ) refers to the diff erence in the time it takes for a sound to reach each ear after the onset of a sound. Sound localization using ITDs as cues is best for low-frequency sounds (200 to 2800 Hz). Low-frequency sounds physically have wavelengths longer than the circumference of the head; therefore, a sound originating to the right of a listener would have the same inten-sity and spectrum at both ears, but would arrive at the left ear later than the right ear. Figure 1.4 illustrates the use of ILD and ITD cues for high- and low-frequency sounds, respectively, where a sound is originating from a loudspeaker at 90° azimuth or directly to the right of the listener (A). Figure 1.4B illustrates the use of ILDs for localizing to high-frequency sounds, and Fig. 1.4C illustrates the use of ITDs for localizing to low-frequency sounds. At 90° azimuth, the ITD is ~0.7 msec and is fairly independent of frequency. As the azimuth increases from 0° to 90°, the ITD increases, as can be seen in Fig. 1.5 .
Fig. 1.3 Interaural level dif-ference (ILD) at the ears for pure tones at 250, 1000, 5000, and 10000 Hz at varying azimuths. Note that the ILD is greatest for higher- frequency tones and at 90° azimuth. (From: Gulick, W. L., Gescheider, G. A., & Frisina, R. D. (1989). Hearing: Physiological acous-tics, neural coding, and psychoacoustics. New York: Oxford University Press, Inc. By permis-sion of Oxford University Press, Inc.)
Fig. 1.4 For a sound originating at 90° azi-muth (A) , interaural level differences (ILDs) as-sist in the localization of high-frequency sounds (B) , and interaural time differences (ITD) assist in the localization of low-frequency sounds (C) . (From: Gelfand, S. A. (2009). Essentials of audiology. 3rd ed. New York: Thieme Medical Pub lishers, Inc.)
A
B
C
7050027C01.indd 47050027C01.indd 4 7/19/10 10:20:23 AM7/19/10 10:20:23 AM

1 Psychoacoustics 5
What Is Loudness Recruitment?
Individuals with sensorineural hearing loss may by hypersensitive to sounds that are perceived as comfortably loud to normal-hearing listeners. This “ rapid growth of loudness ” in an ear with sensorineural hearing loss is known as recruitment and is typically considered to be an indicator for cochlear hearing loss ( Roeser, Valente, & Hosford-Dunn, 2007 , p. 4). Figure 1.6 illustrates one test, called Loud-ness Growth in Octave Bands (LGOB), which had been used to measure loudness growth. As can be seen in Fig. 1.6 , there is a dashed and solid line in each box rep-resenting loudness growth for narrowband noise centered at 500, 1000, 2000, and 4000 Hz. The dashed line represents loudness growth in the normal ear at the test frequency and the solid line represents the loudness growth at the same frequency
◆
Fig. 1.5 Interaural time difference (ITD) for near and far sources at various azimuths. The ITD in-creases as the sound source increases from 0° to 90° azimuth. (From: Gulick, W. L., Gescheider, G. A., & Frisina, R. D. (1989). Hearing: Physiological acoustics, neural coding, and psychoacoustics . New York: Oxford University Press, Inc. By permission of Oxford University Press, Inc.)
Fig. 1.6 Illustration of recruitment using the Loudness Growth in Oc-tave Bands (LGOB) test.
7050027C01.indd 57050027C01.indd 5 7/19/10 10:20:23 AM7/19/10 10:20:23 AM
6 Audiology Answers for Otolaryngologists
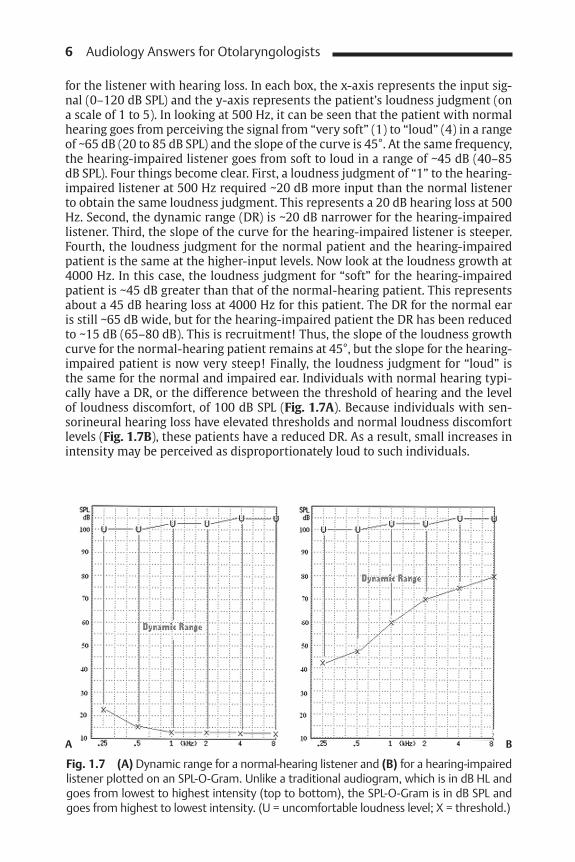
for the listener with hearing loss. In each box, the x-axis represents the input sig-nal (0–120 dB SPL) and the y-axis represents the patient’s loudness judgment (on a scale of 1 to 5). In looking at 500 Hz, it can be seen that the patient with normal hearing goes from perceiving the signal from “very soft” (1) to “loud” (4) in a range of ~65 dB (20 to 85 dB SPL) and the slope of the curve is 45°. At the same frequency, the hearing-impaired listener goes from soft to loud in a range of ~45 dB (40–85 dB SPL). Four things become clear. First, a loudness judgment of “1” to the hearing-impaired listener at 500 Hz required ~20 dB more input than the normal listener to obtain the same loudness judgment. This represents a 20 dB hearing loss at 500 Hz. Second, the dynamic range (DR) is ~20 dB narrower for the hearing-impaired listener. Third, the slope of the curve for the hearing-impaired listener is steeper. Fourth, the loudness judgment for the normal patient and the hearing-impaired patient is the same at the higher-input levels. Now look at the loudness growth at 4000 Hz. In this case, the loudness judgment for “soft” for the hearing-impaired patient is ~45 dB greater than that of the normal-hearing patient. This represents about a 45 dB hearing loss at 4000 Hz for this patient. The DR for the normal ear is still ~65 dB wide, but for the hearing-impaired patient the DR has been reduced to ~15 dB (65–80 dB). This is recruitment! Thus, the slope of the loudness growth curve for the normal-hearing patient remains at 45°, but the slope for the hearing-impaired patient is now very steep! Finally, the loudness judgment for “loud” is the same for the normal and impaired ear. Individuals with normal hearing typi-cally have a DR, or the diff erence between the threshold of hearing and the level of loudness discomfort, of 100 dB SPL ( Fig. 1.7A ). Because individuals with sen-sorineural hearing loss have elevated thresholds and normal loudness discomfort levels ( Fig. 1.7B ), these patients have a reduced DR. As a result, small increases in intensity may be perceived as disproportionately loud to such individuals.
Fig. 1.7 (A) Dynamic range for a normal-hearing listener and (B) for a hearing-impaired listener plotted on an SPL-O-Gram. Unlike a traditional audiogram, which is in dB HL and goes from lowest to highest intensity (top to bottom), the SPL-O-Gram is in dB SPL and goes from highest to lowest intensity. (U = uncomfortable loudness level; X = threshold.)
A B
7050027C01.indd 67050027C01.indd 6 7/19/10 10:20:24 AM7/19/10 10:20:24 AM
1 Psychoacoustics 7
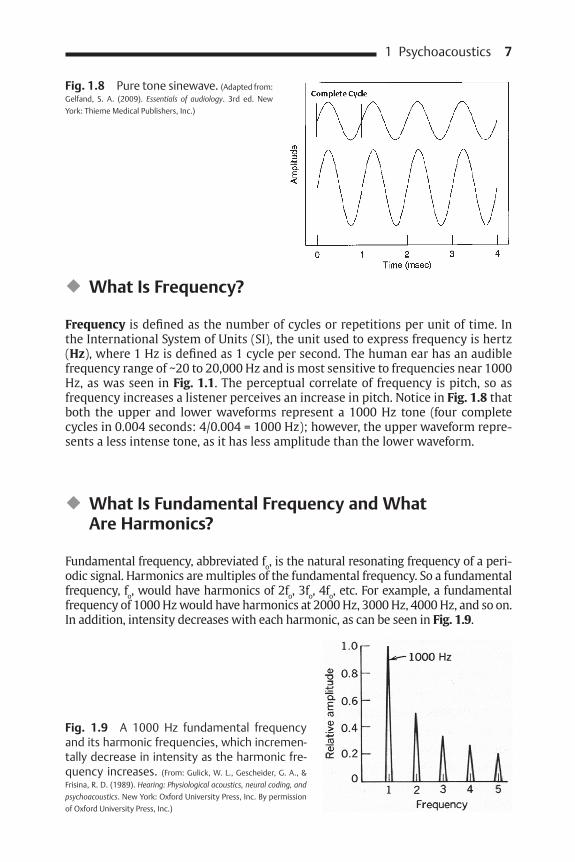
Fig. 1.8 Pure tone sinewave. (Adapted from: Gelfand, S. A. (2009). Essentials of audiology. 3rd ed. New York: Thieme Medical Publishers, Inc.)
What Is Frequency?
Frequency is defi ned as the number of cycles or repetitions per unit of time. In the International System of Units (SI), the unit used to express frequency is hertz ( Hz ), where 1 Hz is defi ned as 1 cycle per second. The human ear has an audible frequency range of ~20 to 20,000 Hz and is most sensitive to frequencies near 1000 Hz, as was seen in Fig. 1.1 . The perceptual correlate of frequency is pitch, so as frequency increases a listener perceives an increase in pitch. Notice in Fig. 1.8 that both the upper and lower waveforms represent a 1000 Hz tone (four complete cycles in 0.004 seconds: 4/0.004 = 1000 Hz); however, the upper waveform repre-sents a less intense tone, as it has less amplitude than the lower waveform.
What Is Fundamental Frequency and What Are Harmonics?
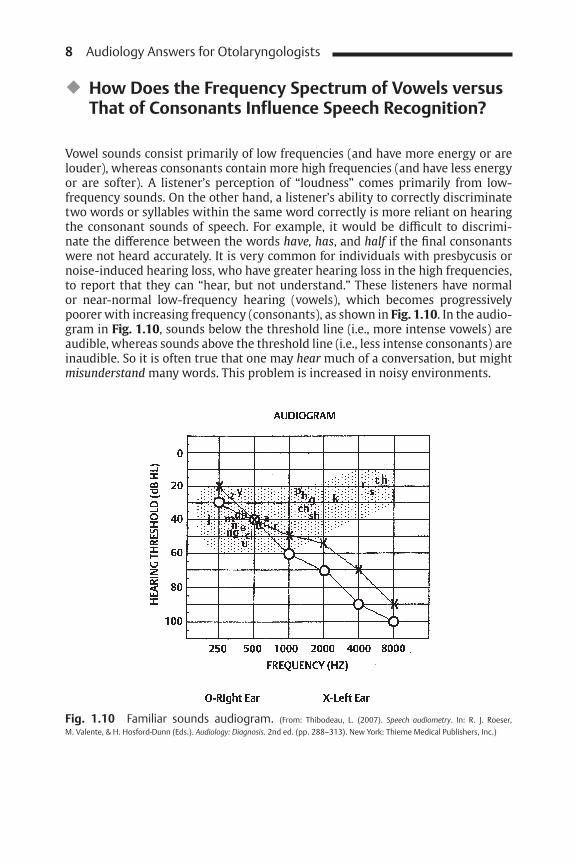
Fundamental frequency, abbreviated f o , is the natural resonating frequency of a peri-odic signal. Harmonics are multiples of the fundamental frequency. So a fundamental frequency, f o , would have harmonics of 2fo, 3fo, 4fo, etc. For example, a fundamental frequency of 1000 Hz would have harmonics at 2000 Hz, 3000 Hz, 4000 Hz, and so on. In addition, intensity decreases with each harmonic, as can be seen in Fig. 1.9 .
◆
◆
Fig. 1.9 A 1000 Hz fundamental frequency and its harmonic frequencies, which incremen-tally decrease in inten sity as the harmonic fre-quency increases. (From: Gulick, W. L., Gescheider, G. A., & Frisina, R. D. (1989). Hearing: Physiological acoustics, neural coding, and psychoacoustics. New York: Oxford University Press, Inc. By permission of Oxford University Press, Inc.)
7050027C01.indd 77050027C01.indd 7 7/19/10 10:20:24 AM7/19/10 10:20:24 AM
8 Audiology Answers for Otolaryngologists
How Does the Frequency Spectrum of Vowels versus That of Consonants Influence Speech Recognition?
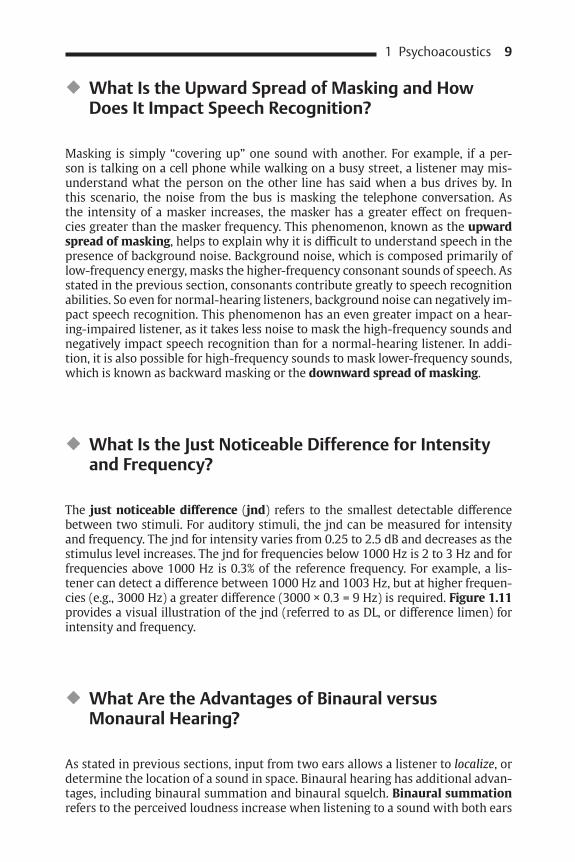
Vowel sounds consist primarily of low frequencies (and have more energy or are louder), whereas consonants contain more high frequencies (and have less energy or are softer). A listener’s perception of “loudness” comes primarily from low- frequency sounds. On the other hand, a listener’s ability to correctly discriminate two words or syllables within the same word correctly is more reliant on hearing the consonant sounds of speech. For example, it would be diffi cult to discrimi-nate the diff erence between the words have, has , and half if the fi nal consonants were not heard accurately. It is very common for individuals with presbycusis or noise-induced hearing loss, who have greater hearing loss in the high frequencies, to report that they can “hear, but not understand.” These listeners have normal or near-normal low-frequency hearing (vowels), which becomes progressively poorer with increasing frequency (consonants), as shown in Fig. 1.10 . In the audio-gram in Fig. 1.10 , sounds below the threshold line (i.e., more intense vowels) are audible, whereas sounds above the threshold line (i.e., less intense consonants) are inaudible. So it is often true that one may hear much of a conversation, but might misunderstand many words. This problem is increased in noisy environments.
◆
Fig. 1.10 Familiar sounds audiogram. (From: Thibodeau, L. (2007). Speech audiometry. In: R. J. Roeser, M. Valente, & H. Hosford-Dunn (Eds.). Audiology: Diagnosis . 2nd ed. (pp. 288–313). New York: Thieme Medical Publishers, Inc.)
7050027C01.indd 87050027C01.indd 8 7/19/10 10:20:24 AM7/19/10 10:20:24 AM
1 Psychoacoustics 9
What Is the Upward Spread of Masking and How Does It Impact Speech Recognition?
Masking is simply “covering up” one sound with another. For example, if a per-son is talking on a cell phone while walking on a busy street, a listener may mis-understand what the person on the other line has said when a bus drives by. In this scenario, the noise from the bus is masking the telephone conversation. As the intensity of a masker increases, the masker has a greater eff ect on frequen-cies greater than the masker frequency. This phenomenon, known as the upward spread of masking , helps to explain why it is diffi cult to understand speech in the presence of background noise. Background noise, which is composed primarily of low- frequency energy, masks the higher-frequency consonant sounds of speech. As stated in the previous section, consonants contribute greatly to speech recognition abilities. So even for normal-hearing listeners, background noise can negatively im-pact speech recognition. This phenomenon has an even greater impact on a hear-ing-impaired listener, as it takes less noise to mask the high-frequency sounds and negatively impact speech recognition than for a normal-hearing listener. In addi-tion, it is also possible for high-frequency sounds to mask lower-frequency sounds, which is known as backward masking or the downward spread of masking .
What Is the Just Noticeable Difference for Intensity and Frequency?
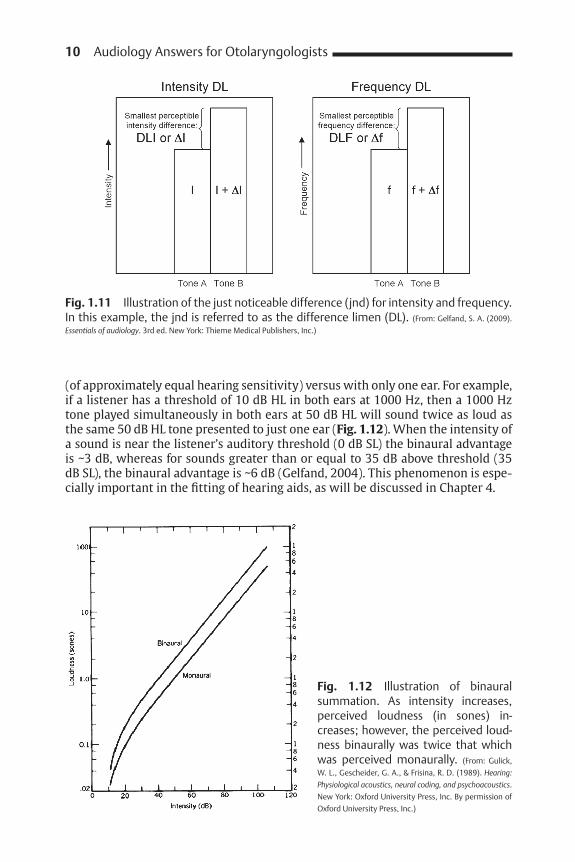
The just noticeable diff erence ( jnd ) refers to the smallest detectable diff erence between two stimuli. For auditory stimuli, the jnd can be measured for intensity and frequency. The jnd for intensity varies from 0.25 to 2.5 dB and decreases as the stimulus level increases. The jnd for frequencies below 1000 Hz is 2 to 3 Hz and for frequencies above 1000 Hz is 0.3% of the reference frequency. For example, a lis-tener can detect a diff erence between 1000 Hz and 1003 Hz, but at higher frequen-cies (e.g., 3000 Hz) a greater diff erence (3000 × 0.3 = 9 Hz) is required. Figure 1.11 provides a visual illustration of the jnd (referred to as DL, or diff erence limen) for intensity and frequency.
What Are the Advantages of Binaural versus Monaural Hearing?
As stated in previous sections, input from two ears allows a listener to localize , or determine the location of a sound in space. Binaural hearing has additional advan-tages, including binaural summation and binaural squelch. Binaural summation refers to the perceived loudness increase when listening to a sound with both ears
◆
◆
◆
7050027C01.indd 97050027C01.indd 9 7/19/10 10:20:24 AM7/19/10 10:20:24 AM
10 Audiology Answers for Otolaryngologists
(of approximately equal hearing sensitivity) versus with only one ear. For example, if a listener has a threshold of 10 dB HL in both ears at 1000 Hz, then a 1000 Hz tone played simultaneously in both ears at 50 dB HL will sound twice as loud as the same 50 dB HL tone presented to just one ear ( Fig. 1.12 ). When the intensity of a sound is near the listener’s auditory threshold (0 dB SL) the binaural advantage is ~3 dB, whereas for sounds greater than or equal to 35 dB above threshold (35 dB SL), the binaural advantage is ~6 dB ( Gelfand, 2004 ). This phenomenon is espe-cially important in the fi tting of hearing aids, as will be discussed in Chapter 4.
Fig. 1.11 Illustration of the just noticeable difference (jnd) for intensity and frequency. In this example, the jnd is referred to as the difference limen (DL). (From: Gelfand, S. A. (2009). Essentials of audiology . 3rd ed. New York: Thieme Medical Publishers, Inc.)
Fig. 1.12 Illustration of binaural summation. As intensity increases, perceived loudness (in sones) in-creases; however, the perceived loud-ness binaurally was twice that which was perceived monaurally. (From: Gulick, W. L., Gescheider, G. A., & Frisina, R. D. (1989). Hearing: Physiological acoustics, neural coding, and psychoacoustics. New York: Oxford University Press, Inc. By permission of Oxford University Press, Inc.)
7050027C01.indd 107050027C01.indd 10 7/19/10 10:20:25 AM7/19/10 10:20:25 AM

Binaural squelch refers to a listener’s ability to listen only to the sound source of interest when additional sound sources are present. This phenomenon is com-monly referred to as the cocktail party eff ect . For example, most people can recall a time at a party when several conversations were going on at once and at which time they were able to follow only the conversation of interest while tuning out all of the background noise.
When a listener has the use of only one ear or when one ear is signifi cantly better than the other, the listener’s ability to make use of localization cues is sig-nifi cantly reduced. In addition, monaural listening requires a greater signal-to-noise ratio (SNR = the level of the signal to the level of the noise) to communi-cate eff ectively because the advantages of binaural summation and squelch are unavailable. Figure 1.13 illustrates the necessary SNR improvement required for a hearing-impaired listener to perform equally as well as a normal-hearing listener in background noise. For example, if a patient has a hearing loss of 50 dB HL, he or she would have to improve the SNR by 6 dB to achieve a level of performance equal to that of a normal-hearing listener. Further, a patient with a hearing loss of 80 dB would have to improve the signal-to-noise ratio by 12 dB to hear equally as well as a patient with normal hearing. There are several ways in which a hear-ing- impaired listener can improve his or her SNR, including the use of hearing aids with directional microphones and hearing assistance technology, such as an FM system. These devices are discussed in detail in Chapter 4.
References Gelfand, S. A. (2004). Hearing: An introduction to psychological and physiological
acoustics . 4th ed. New York: Marcel Dekker. Gulick, W. L., Gescheider, G. A., & Frisina, R. D. (1989). Hearing: Physiological acous-
tics, neural coding, and psychoacoustics. New York: Oxford University Press, Inc. Roeser, R. J., Valente, M., & Hosford-Dunn, H (Eds.). (2007). Audiology: Diagnosis.
2nd ed. New York Thieme Medical Publishers, Inc.
Fig. 1.13 The required signal-to-noise ratio (SNR) improvement required for a hearing-impaired listener to perform as well as a normal-hearing listener. As the de-gree of hearing loss increases, the SNR required to maintain performance also increases. (Based on data collected by Killion. From: Killion, M. (1997). SNR loss: “I can hear what people say, but I can’t understand them.” The Hearing Review 4 (12), 8–14.)
1 Psychoacoustics 11
7050027C01.indd 117050027C01.indd 11 7/19/10 10:20:25 AM7/19/10 10:20:25 AM