1 Project Management Mission Oriented, Customer Focused.
48
1 Project Management Mission Mission Oriented, Oriented, Customer Focused Customer Focused
-
Upload
christian-perez -
Category
Documents
-
view
220 -
download
2
Transcript of 1 Project Management Mission Oriented, Customer Focused.

1
Project Management
MissionMission Oriented, Oriented,
Customer FocusedCustomer Focused

2
Corporate Mission
Information Security and Training maintains a mission oriented team of talented professionals providing world class, customer focused support to the U.S. Government Interagency Team.

3
What is a PM
1. The Manager of a Program or Project2. Responsible for Project Performance3. Primary Customer Interface for effort4. Leader of personnel5. Accountable for ultimate success6. Responsible for Resources, Risks, Schedule,
cost, process and quality7. Establishes and achieves performance metric 8. Owner of the business

4
Roles and Responsibilities
Project ManagersProject Managers– Maintain Burn Plans– Stay Abreast of Growth Ops– Coordinate New Business– Manages Contract Performance
Business Area ManagersBusiness Area Managers– Bid Opportunities Properly– Manage O/H effectively– Audit Burn Plans– Monitors/Audits Contract Performance
Business DevelopersBusiness Developers– Maintain valid strategic BD Plans– Identifies and Captures New Business– Coordinates directly with all Managers– Maintain Corporate Growth Plans
Business ManagementBusiness Management– Actively Participate in Bids– Compile and Maintains Data – Status Plan– Advise/Counsel Managers on O/H– Provides independent Contract Review
Executive ManagementExecutive Management– Manages to established Division/Group Metrics– Directs overall strategy for growth– Maintains Profit and Loss– Ultimate Responsible for overall Performance
Manage To MetricsAccurate Burn PlansKeep Contracts Sold
Labor RatesGrowth #’s - Existing Clients Provide O/H Inputs
New Customer NumbersOpportunity ROICombined B&P Estimates
Organize/Validate All Budgets Prepare then Status Plans O/H, Profit, Revenue History
Validate Approve Budgets Application of Strategic HiresOverall Accountability
AnnualBudget
Plan
AnnualBudget
Plan
Responsibility
Quality

5
Business Area MgrBusiness Area Mgr
ResourcesResources
Acquisition Life Cycle
Market Develop RFP
ROM BudgetROM BOE
Refined BudgetTentative BOEInitial Burn PlanEPR Package
Execution CloseAward
BudgetFinalize WBSVerify BOEValidate BaselineFinal Burn PlanCreate IWA
Monitor BudgetMonitor WBS Validate BOEStatus BaselineMaintain BurnUpdate IWA
BudgetBOEBaselineBurn PlanEPR Pckg
Operations Manager
Administration
Business Developer
Contracts Subcontracts
Finance
Marketing Mgr BD Mgr Capture Mgr Project Manager
SelectionSelection
FeedbackLessons Learned

6
Typical Company Organization
Business ManagementBusiness Operations
Business Development
Program Management
CEO/President
Human ResourcesAdministrationRecruitingBenefitsCompensationEmployee RelationsPublic RelationsCorporate LegalPerformance Reviews
Finance/CPACost AccountingAccounts ReceivableAccounts PayableTime CollectionReport GenerationContractsSubcontracts

7
Company Resource Associations
Program Manager
ContractsFinance
ProgramControl
Business AreaManager
Primary Contract InterfaceLegal representativeMonitors ComplianceAdministers Contract
Processes Time CardsProvides ActualsMonitors the moneyProduces independent data
Monitors BaselinesTracks Earned ValueProvides objective statusModels alternatives
Provides Qualified ResourcesEnforces Metrics AchievementReceives and reviews timelyEnsures compliance to policies
Represents Company to Customer Plans and Executes ProjectIdentifies Resource NeedsManages RequirementsGathers and provides true statusDocuments and Manages RiskCommunicates progress and status
HumanResources
ComplianceCompensation/BenefitsPerformance ReviewsRecruiting/SourcingRelations

8
Contracts/PM Interaction
• • Everything associated with / affecting contractual instrumentEverything associated with / affecting contractual instrument is worked by Contracts Dept.is worked by Contracts Dept.
• • Contracts Dept. supports Contracts Dept. supports formalformal procurement contracts procurement contracts
• • Contracts Dept. responsible for subcontract issuance and modsContracts Dept. responsible for subcontract issuance and mods
• • PM is responsible for execution & subcontract management.PM is responsible for execution & subcontract management.
• PM must support the Contracts Department PM must support the Contracts Department
* Program Managers cannotcannot contractually obligate the company

9
Company<–>GovernmentInterfaces
ACO(Administrating Contract Officer)
PCO(Procuring Contract Officer)
COTR(Contracting Officers’ Technical Representative)
Company accounting / contracts Company PM
• Post award administration• Administer changes• Compliance
• Negotiates• Obligates the Government (signs)
• Technical direction• Technical directives - Inspection - Acceptance
Delegatesduties after award

10
Typical Product Project Relationships
ID
Programmers
Graphics CORECORE
Production
Quality
Editing
ID
Programmers
GraphicsCORECORE
Project Manager
SMESME
TechnicalManager
Delivery Order 1 Delivery Order 2
“To succeed we must view contracts from the world of the Project Manager”
11
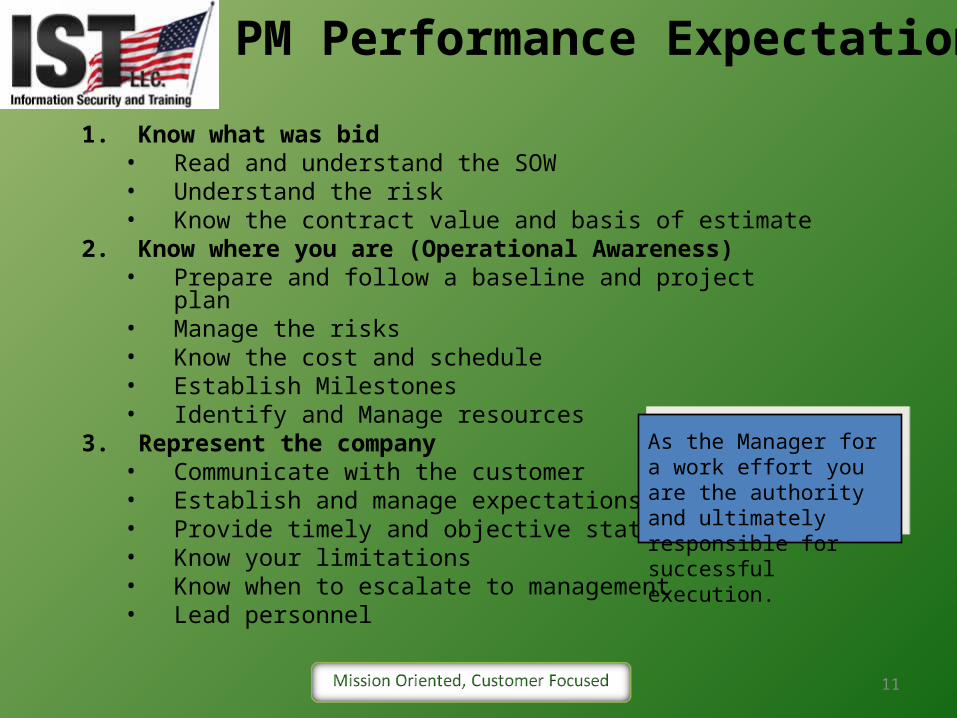
PM Performance Expectations
1. Know what was bid• Read and understand the SOW• Understand the risk• Know the contract value and basis of estimate
2. Know where you are (Operational Awareness)• Prepare and follow a baseline and project plan• Manage the risks• Know the cost and schedule• Establish Milestones• Identify and Manage resources
3. Represent the company• Communicate with the customer• Establish and manage expectations• Provide timely and objective status• Know your limitations• Know when to escalate to management• Lead personnel
As the Manager for a work effort you are the authority and ultimately responsible for successful execution.

12
How to ”fail””fail” as a PM
1. Do not plan the work before you start or allow charges2. Fail to record & communicate performance milestones3. Do not read and understand SOW/Requirements4. Believe your customer knows what’s right5. Do not document your concerns early --“risk”6. Do not establish status meetings and PMRs7. Believe the problem will go away with time 8. Do not manage and communicate metrics9. Neglect to provide regimented status10. Do not properly document acceptance11. Do not track action items and closure12. Make excuses for productivity

13
ProfitProfit– After G&A Tax– After Costs Removed
OverheadOverhead– Cost of Labor– Fringe Benefits– Lease– Other: Travel, Materials
RevenueRevenue– Growth– Stability– Backlog
Financial Performance Measures
10% Minimum10% Minimum
80% Site*80% Site*50% Customer*50% Customer*
20% Growth 20% Growth
MetricsMetrics
* O/H Rates are Examples Only

14
Typical PM Profitability
• Project <10% Profit on notice– Project Mgr documents return to green plan– Weekly meetings with key personnel to status– Public presentation to executive management– Team placed under close observation
• Projects <7% Profit on probation– Project Mgr documents “crash plan” to recover– Project Mgr presents critical path, risks & mitigations – Weekly meetings with ALL team personnel– Mandatory Overtime Instituted
• Projects <5% Profit unacceptable– Program Manager provides accountable leadership to project– Executive Mgmt/Program Management rebaselines project– Critical path documented and options analyzed for efficiency– R-examination of all Team Resources, Utilization, Metrics, Progress– Mandatory Overtime

15
Functional Philosophy
Planning-Bids-Planning-WBS-BOEs-Budgeting-Forecasting-Lessons Learned
Execution Mgmt-Requirements Mgmt-Customer Mgmt-Earned Value Mgmt-Resource Planning-Schedule Mgmt-Subcontracts-Status and reporting
Production-Process Control-Adherence to Schedules-Quality Assurance-Systems Approach to Mgmt-Configuration Management-Adherence to budgets-Forecasting of resources-Productivity/Utilization
Business Development-Strategic Plans - Customer Liaison-Past Performance - Capture Mgmt-Market Approach - Teaming/Partners-Technology Trends - Strategic Hires
Operations Mgmt-Pricing/Bids - Financial Status-Budgets - Profit Realization -Planning - Financial Baselines-Maintaining annual and strategic plans-Subcontracts
CompleteComplete
Working NowWorking Now
16
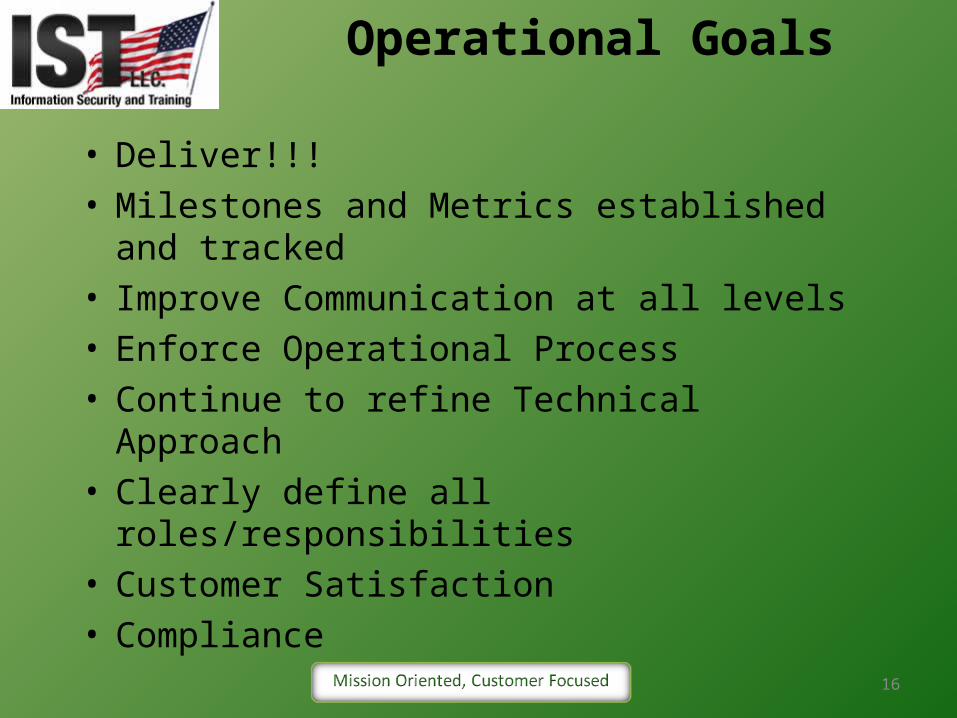
Operational Goals
• Deliver!!!• Milestones and Metrics established and tracked• Improve Communication at all levels• Enforce Operational Process• Continue to refine Technical Approach• Clearly define all roles/responsibilities• Customer Satisfaction• Compliance
17
Earned Value Earned Value MeasurementMeasurement
The BasicsThe Basics

18
Managing Cost 101
• Plan and Propose Work Effectively• Establish Productive Work Plan• Document and Manage Risk• Manage requirements early in the project• Manage performance with Earned Value• Enhance Hiring Practices – Productive People• Outsource where Sensible (CLOCs)• Leverage full depth IST Resources• Perform Make-Buy to reduce risk• Monitor and Manage Dept. Resource Plans• “No-Bid” High Risk Opportunities• Overhead Conscious – Quality FY Budget Inputs

19
Establishing Labor Pools
Quality, Production, Technical Management
New New BusinessBusiness
Program Program ManagementManagement
AdministrativeAdministrativeRecruitingRecruitingIT SupportIT Support
DO 01
DO 02DO 03
DO 04
DO 05DO 06
DO 07
Project Mgr Project Mgr
80%80%
5%5%
3%3%
Corporate LevelCorporate LevelBid & Proposals
R&D
BD
Investments
Project Mgr
Dept. Dept. FocusFocus
BUBUFocusFocus
20
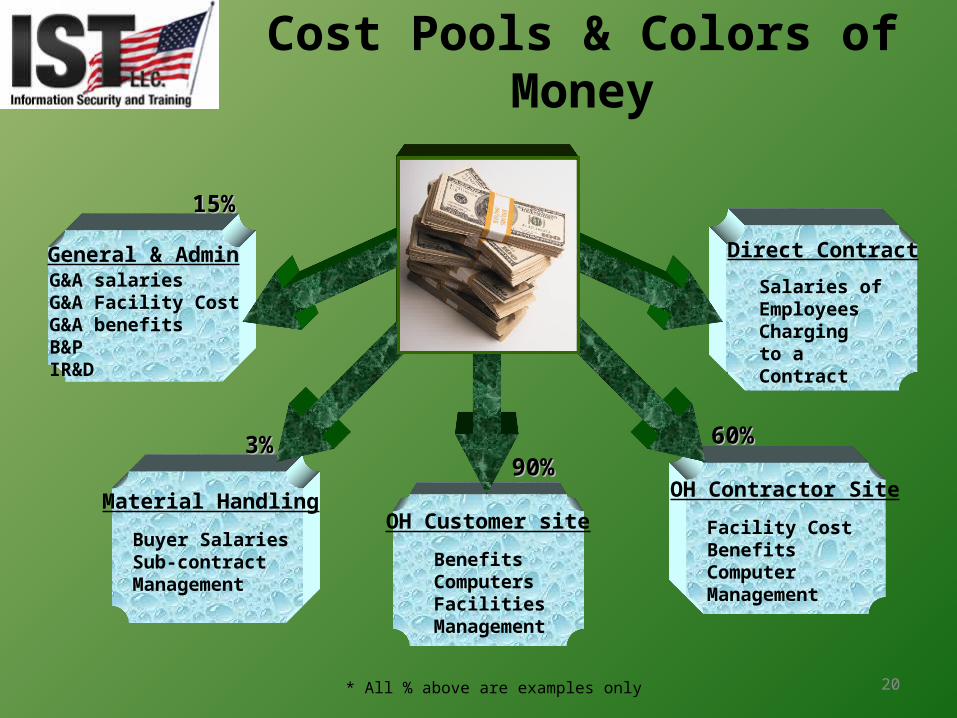
Cost Pools & Colors of Money
G&A salariesG&A Facility CostG&A benefitsB&PIR&D
General & Admin
Buyer SalariesSub-contractManagement
Material HandlingOH Customer site
BenefitsComputersFacilitiesManagement
Direct Contract
Salaries ofEmployees Chargingto aContract
OH Contractor Site
Facility CostBenefitsComputerManagement
90%90%60%60%
15%15%
3%3%
* All % above are examples only

21
Contract Performers
Subcontractor• Subcontract
Consultant• Treated as subcontractor• Consultant Agreement
Contract Labor (On-Call)• No Benefits
Full TimeEmployee• Full BenefitsMust be 32 hoursPer week or more
Paid through accounts payable[No Burdenable Labor]
Paid through payroll system[Burdenable Labor]

22
36.5%
Example Company Site RateExample Company Site Rate 80%80%
Fringe Benefits 34.0%
Bonus 2.5%
Overhead Managerial Labor 8.5%
Benefits on OH Labor 1.5%
Rent 12.0%
Depreciation 4.8%
Travel 2.6%
Communications/Telecom 3.6%
Computer Expense 2.9%
Other (misc) 7.6%
80.0%
Typical Site O/H Cost Pool
* O/H % rates are examples only

23
36.5%
Example Customer Site RateExample Customer Site Rate 50%50%
Fringe Benefits 34.0%
Bonus 2.5%
Overhead Managerial Labor 8.5%
Benefits on OH Labor 1.5%
Travel 1.0%
Other 2.5%
50.0%
Typical Customer O/H Cost Pool

24
EVM Terminology
Contract Value (C/V) – Total Contract Worth (Labor+Travel+Material)
Estimate to Complete (ETC) – Cost to complete the work effort
Inception to Date (ITD) – How much is spent to date on the effort
Estimate At Complete (EAC) – Total cost of effort when done
Budget at Complete (BAC) – Funding left when finished (profitprofit)
Variance – How much you are aheadahead or behindbehind the budgeted plan or baseline
Burn Rate – The monthly amount that the project is accumulating cost

25
How a Basic Labor Rate is Built
Employee Salary = $50,000Hourly Equivalent = $24.04Contractor O/H (80%) = $19.23 G&A (15% of Cum) = $ 6.49 Total Burdened = $49.76
Profit (10%) = $4.97Total Customer HR Sell = $54.73
$43.27

26
Creating Productive Labor Bids
Scenario 1: Full Time Employee has 2 Weeks Vacation is 5 days sickAnnual Hours 2080Holiday Hours 80Vacation Hours 80Sick Time 40Productive Hours 1880
Scenario 2: Full Time Employee has 3 Weeks Vacation takes no sickAnnual Hours 2080Holiday Hours 80Vacation Hours 120Sick Time 20Productive Hours 1860
Work Effort Value:$54.73 x 1880 = $102,892.40
Work Effort Value:$54.73 x 1860 = $101,797.80$101,797.80
Paid Time Off (PTO)
Paid Time Off (PTO)

27
Overhead Components
Contract Revenue• Direct Labor On Contractor Site
Overhead Labor• Indirect Labor• Fringe Benefits on Indirect Labor
Non-Labor Costs• Rent• Fringe on Direct Labor• Company Allocation • Telecom• Recruiting• Computers• Relocation• Sign on Bonus
Combined OH / Direct Labor = Overhead RateCombined OH / Direct Labor = Overhead Rate
80% is an Example O/H Target80% is an Example O/H Target

28
Profit and Contract Type
Cost PlusT&MFFP Labor Hours
FixedPrice
Goal = 10% on Contract
Decisions:• Hire to maximize profit?
• Hire to maximize customer satisfaction?
• Hire a key employee at a loss?
• Lose money on small T.O. to get foot in the door?
• Bid some labor categories at a loss?
Goal = 15%
Decisions:• Minimize execution risk• Management reserve• Use Divisions OH rate• Plan for follow on
Yes, if necessary to win but must obtain overall profit.
Can’t affect profit much!
Yes, but must stay profitable!
Yes, Sometimes!
Yes, Sometimes!
Not Typical Culture!

29
Project ControlsProject Controls

30
Project Planning Phase
Define theProject
Plan theProject
Schedule theProject
IntegrateCost/Schedule
W ork B reak dow n Stru ctu re
S u b sy stem S u b sy stem
Fi rst S y stem
S u b sy stem S u b sy stem
S econ d S y stem
S u b sy stem S u b sy stem
T h i rd S y stem
P ro j ect T i tle
O rgan ization B reak dow n Structure
S ecti on S ecti on
D i v i si on
S ecti on S ecti on
D i v i si on
S ecti on S ecti on
D i v i si on
P ro j ect O ffi ce
System Subsystem Subsystem Subsystem Subsystem Subsystem
System Subsystem Subsystem Subsystem Subsystem Subsystem
System Subsystem Subsystem Subsystem Subsystem Subsystem
$$ LOAD
Labor = O/H+G&A+FeeTravel = G&A + FeeMaterial = MH + FeeSubcontracts = MH + Fee
LOAD
Labor = O/H+G&A+FeeTravel = G&A + FeeMaterial = MH + FeeSubcontracts = MH + Fee
PMPMSubcontractorSubcontractor
ConsultantConsultant
PersonnelofficePersonneloffice

31
Know What We Bid
• Break Work Down (WBS) into logical segments• Validate IMI Hours against analysis• Enforce Technical Personnel Involvement• If Sub Work, Request Plans and Basis• Burn Plans created w/ “Like” Resources• Unique resources clearly identified• Risks Documented with Mitigations• Formal Bid Sign-Off Accomplished• Maintain artifacts in a project folder

32
Work Breakdown Structures
• Segmented & severable items of work when linked together create steps to completing a project.
• Each work section has a measurable item and artifact that proves the effort has been performed and completed.
• When associating a budget to an item of work within a WBS you can determine performance against the plan.
• WBS elements are loaded into the cost system and become the financial baseline for the project. Separate Work Packages are established for each segment of work to accumulate costs and understand progress.
Project XLabor
Planning
Front EndAnalysis
Design
Production
Artifacts
ScheduleWABurn PlanMgmt Plan
Subcontract PlansRisk PlanDeliverablesCommunication
Resources Scope
PM = 80 HoursTM = 80 HoursQA = 20 HoursLead = 20 Hours
2 Weeks200 Hours$13,000 Max.Complexity = 3
SubordinateWork Package 1
SubordinateWork Package 2
SubordinateWork Package 3
SubordinateWork Package 4
(Example)

33
Cost Accounting
• We Won! - REQUIRING approved budget baselines prior to opening work package:– Final Burn Plan w/ staffing & accurate rates– Work Authorization updated/complete– WBS and BOE’s validated & archived– Financial Baseline reviewed & approved
• Project Mgr• Program Mgr• Operations Mgr• Contracting• Finance
* This process provides a control by requiring completed planning documentation.
PreparePackage
PMApprovals
OpsValidation
OpenBudgets
Budget Turn-on ProcessBudget Turn-on Process

34
What’s a Work Authorization (WA)
• Authorization for someone to work your project.• Must be Maintained by the Project Manager.• Is communicated to the Time Card System • Is auditable and MANDATORY.• Utilized for every cost account whether direct or
indirect to identify personnel authorized to work the project.
• Feeds the Burn Plans and is used by Program Administration to validate resources on projects.

35
Project Burn Plans
• What they are:– A baseline resource plan with hours and rates– An estimate and projection of work in financial view– A model to understand “what ifs?”– A tool for understanding profitability vs. cost– A way to assist business area managers with staffing
• What they are not:– A system for performance measurement (no metrics)– A guarantee of success– An event driven view of your project

36
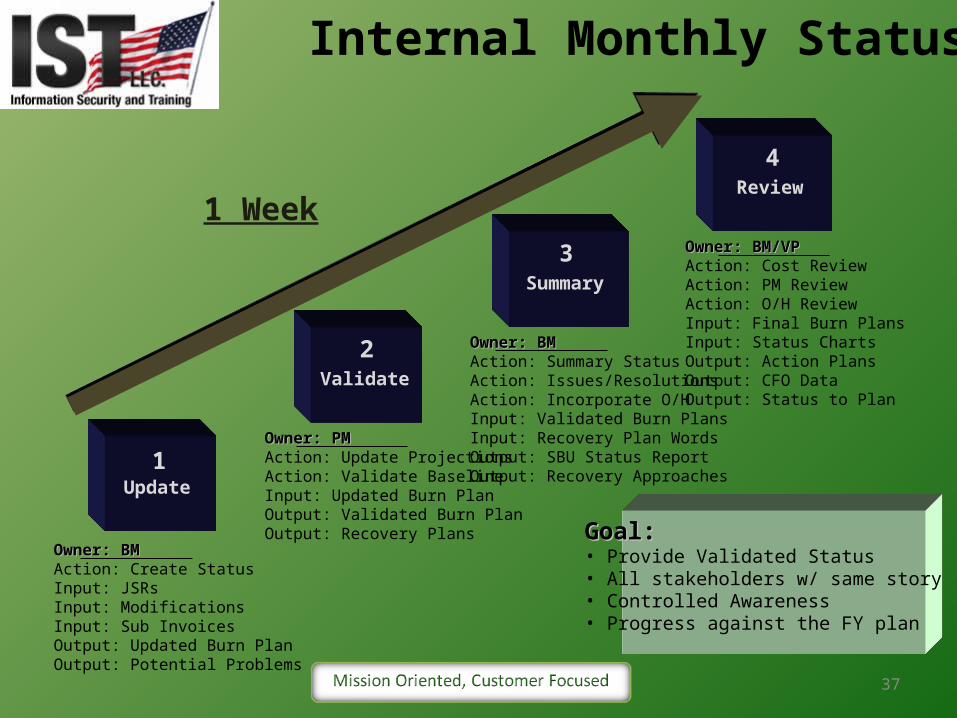
Project/Job Status Reports (JSR)
• What they are:– Generated by Corporate Finance Monthly– Actuals generated on each cost account– Used to validate burn plans and verify costs– Provides objective evidence of financial position– Doesn’t currently articulate “performance”
37
Internal Monthly Status
Owner: BMOwner: BMAction: Create StatusInput: JSRsInput: ModificationsInput: Sub InvoicesOutput: Updated Burn PlanOutput: Potential Problems
Owner: PMOwner: PMAction: Update ProjectionsAction: Validate BaselineInput: Updated Burn PlanOutput: Validated Burn PlanOutput: Recovery Plans
Owner: BMOwner: BMAction: Summary StatusAction: Issues/ResolutionsAction: Incorporate O/HInput: Validated Burn PlansInput: Recovery Plan WordsOutput: SBU Status ReportOutput: Recovery Approaches
Update
Validate
Summary
Review
Owner: BM/VPOwner: BM/VPAction: Cost ReviewAction: PM ReviewAction: O/H ReviewInput: Final Burn PlansInput: Status ChartsOutput: Action PlansOutput: CFO DataOutput: Status to Plan
Goal:Goal: • Provide Validated Status• All stakeholders w/ same story• Controlled Awareness• Progress against the FY plan
1
2
3
4
1 Week

38
Example Business Unit Summary
J A S O N D J F M A M J JD001$1,345,592
D001$639,046
D004$848,044
D005$826,607
D006$1,386,000
D003$1,892,223$267K Subs
A S O
2010 2011
28 Feb
31 Dec
behind sched70% Spent95% Complete
Revised Plan10% Spent10% Complete
% Complete45% Spent60% Complete
Slow Start15% Spent 10% Complete
New Project0% CompleteJust Started
New Sub Added50% SpentCAI/TMI
23 Feb
19 Nov
19 May
N D
30 May
Jul 10/06
CAICAI
TMITMI
11 Feb 22 Jun 17 Aug 12 Oct

39
Maintaining PlanMaintaining Plan
• Required enforcement measures:– Planning Documents use to measure progress– New Hires must be qualified for positions– H/R Reqs must include cost accounts– Subcontract rates will be continuously validated– Baseline Changes require contract modifications– Work Authorizations Maintained– Changes impacting Corporate established targets require
approval by management

40
Example: 4 Part Chart Example: 4 Part Chart Contract 80000 (Example)Contract 80000 (Example)
Cost PerformanceCost Performance
CV $802K CV% 53%Schedule% 36%CPI Future FutureSPI Future FutureTCPI(EAC) Future
ITD (spent) 428KETC (remaining) 98KEAC (total) 526K526KVAC (variance) 277KMonthly Burn Rate 33KGoal: Deliver within budget
Major Schedule Variances:
Issues:Contract Performance – Slow start may push delivery
slips.Effort not local Requires local Lead and oversight.Task Lead/Management Changes have diluted history and
financial information from past not clear.
Action Plans:Aggressive r Mgmt involvement shifting some personnel
to optimize performance.Continuous customer communication and involvement
on site in Ft. Sill OK. Jan 20
Major Cost Variances:
Top Risks:Contract Performance and delivery of courseware within current schedule.Cost Control for delivery without unanticipated cost growthCustomer expectations managed to avoid schedule/cost growth.
Action Plan:PM, TM and BM Involvement on site and with customer to establish new schedules, cost baseline and monitor major milestones on critical path. Jan 31
Period of performance extension implemented need toComplete Remaining Efforts quickly. May 05
Period of Performance: 6/19/10 – 8/18/11Owner: Frank Luster
STATUSSTATUS
0200,000400,000600,000800,000
1,000,000
Contract Value Baseline Plan Estimate to Complete Actual Cost

41
A word on budget planningA word on budget planning

42
Successful Companies:• Create a Legitimate Plan• Maintain/Status the Plan• Adapt/Evolve the Plan• Project the Plan Forward
Why do we need a budget
* Without input from the bottom up, the plan becomes a corporate level vision only.
RaisesThe Value
of theCompany
Provides Provides Stability &Stability &
FocusFocus
Key InputsVision and GoalsHistorical DataWork BacklogBD PipelinesMarketplace InfoCompetitionInvestment/Resources

43
What’s a Profit Center
• Measured Business Area/Unit– Has Own Overhead Pool– Possesses Direct Bill Contracts– Has Revenue and Profit– Contributes M/H and G&A– May have leases– Has Prescribed Corporate Metrics
*Generally a business unit is aligned to customer, geographic area, or business line.
Revenue
Overhead G&AM/H
Profit
Profit CenterProfit Center

44
Composite Overhead ExampleComposite Overhead Example
01.100
01.02.100 – Virginia Beach
01.02.110 - Arlington
01.01.120 - Chesapeake
01.01.140 – Tampa
Direct = 263KCosts = 212.22KIDSI Rate 80.69%
YTD Avg= 80.7%
01.01.130 – Indiana
Direct = 226.88KCosts = 121.07KCust Rate 53.36%
YTD Avg = 54.1%
Direct 9.96KCosts 9.41K
Direct 99.1KCosts 85.72K
Direct 4.54KCosts 3.57K
Direct 95.2KCosts 74.08K
Direct 54.2KCosts 39.44K
Total Company (1M)
94.50%
86.50%
78.60%
77.82%
72.76%
01.01.100 – Virginia Beach
01.01.110 - Arlington
01.01.120- Chesapeake
01.01.140 – Tampa
01.01.130 – Indiana
Direct 8.27KCosts 5.13K
Direct 10.52KCosts 5.83K
Direct 179.53KCosts 95.60K
Direct 16.32KCosts 7.92K
Direct 12.24KCosts 6.59K
62.0%
55.4%
53.25%
48.54%
53.86%
110 Personnel 489.88K DL 333.29K O/H823.17M Total823.17M Total123.47K G&A123.47K G&A
946.64K Burdened946.64K Burdened
Monthly Revenue: $1.02MMonthly Profit (9%): $76.2K
FY Projected: $12.3MFY Project Profit: 914K
Profit down due to O/H
ContractorContractor Site SiteCustomerCustomer Site Site
45
ID/IQ Team Formation
AssessmentPhase
DetermineCapability
Gaps
ExploreOutside Sources
AssessOur Team Capability
EstablishTeam
DetermineApproach
AssembleFinal Team
OrganizationPhase
Technical Response
SubmitResponse
BestPrice
ResponsePhase

46
Risk
M M H H H
L M M H H
L L M M H
L L L M M
L L L L M
RISK RATING
High Certainty5
Highly Likely4
Unlikely2
Remote1
Likely3
Consequence
Minimala
Minorb
ModerateModeratec
Significantd
Severee

47
The Way AheadAt IST we pride ourselves on customer satisfaction the first time, every time. When you partner with IST, we mesh your vision and supporting concepts with our innovative approaches to provide world class products and services. You communicate directly with our management team which translates to more customer satisfaction and value returned for your investment. We are ready to team with you now to provide leading edge solutions to your 21st Century challenges.

48
Mission OrientedMission Oriented
Customer FocusedCustomer Focused