
1 Presenter Disclosure Information FINANCIAL DISCLOSURE: Nothing to Disclose Stacey Stoeckle-Roberts...
60
1 Presenter Disclosure Information FINANCIAL DISCLOSURE: Nothing to Disclose Stacey Stoeckle-Roberts Goals and Conceptual Framework for the MASCOTS Quality Improvement Project UNLABELED/UNAPPROVED USES DISCLOSURE: Nothing to Disclose
-
date post
21-Dec-2015 -
Category
Documents
-
view
215 -
download
0
Transcript of 1 Presenter Disclosure Information FINANCIAL DISCLOSURE: Nothing to Disclose Stacey Stoeckle-Roberts...

11
Presenter Disclosure Information
FINANCIAL DISCLOSURE:Nothing to Disclose
Stacey Stoeckle-RobertsGoals and Conceptual Framework for the MASCOTS Quality Improvement Project
UNLABELED/UNAPPROVED USES DISCLOSURE:Nothing to Disclose

22
MASCOTS – QIP MASCOTS – QIP Phase IIIPhase III
Using data to improve Using data to improve acute stroke care in acute stroke care in
Michigan Michigan
M ASC O T S
33
The Paul Coverdell National The Paul Coverdell National Acute Stroke RegistryAcute Stroke Registry
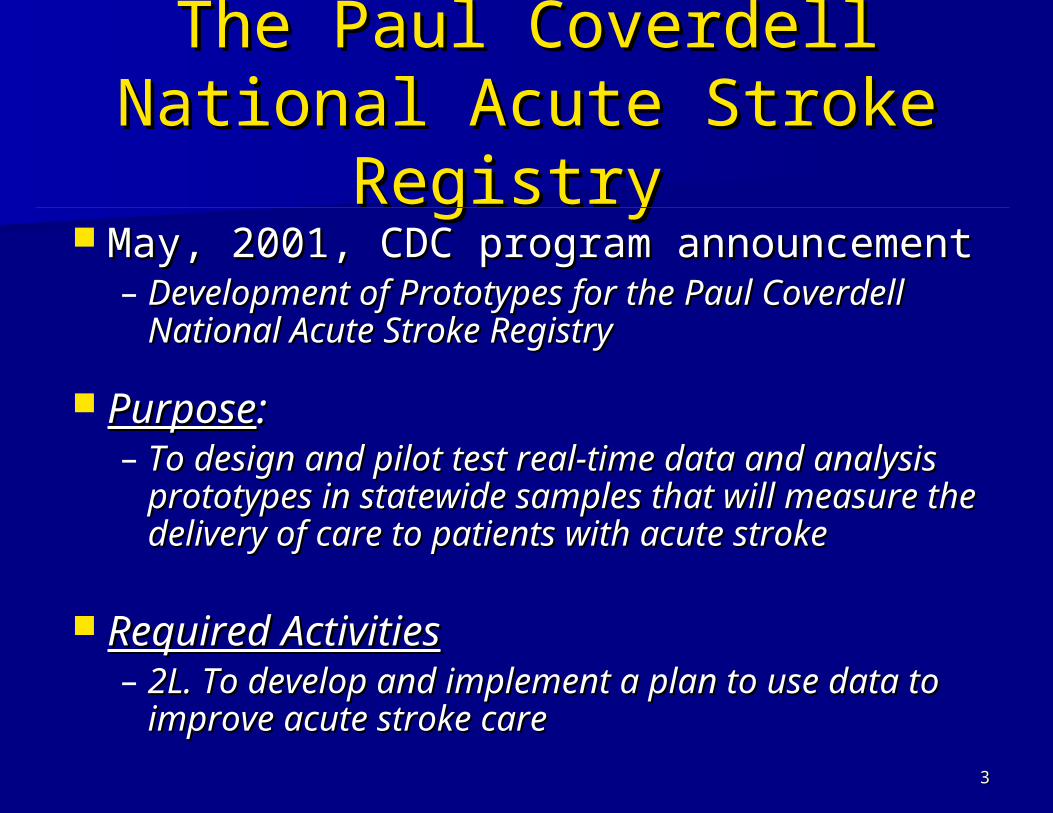
May, 2001, CDC program announcement May, 2001, CDC program announcement – Development of Prototypes for the Paul Coverdell Development of Prototypes for the Paul Coverdell
National Acute Stroke RegistryNational Acute Stroke Registry
PurposePurpose::– To design and pilot test real-time data and To design and pilot test real-time data and
analysis prototypes in statewide samples that analysis prototypes in statewide samples that will measure the delivery of care to patients with will measure the delivery of care to patients with acute strokeacute stroke
Required ActivitiesRequired Activities– 2L. To develop and implement a plan to use data 2L. To develop and implement a plan to use data
to improve acute stroke careto improve acute stroke care

44
Why a Registry?Why a Registry?
To monitor the adherence to To monitor the adherence to evidence based guidelines in careevidence based guidelines in care
To identify those areas where To identify those areas where
quality improvement initiatives are quality improvement initiatives are most necessarymost necessary
To develop a tracking system to To develop a tracking system to monitor improvements in the monitor improvements in the delivery of acute stroke caredelivery of acute stroke care

55
Mascots:
Oversight Team Data Management Coverdell Grant
Michigan Department
of Community Health
Quality Improvement ExpertiseStroke/CVD Network
Oversight Team
AmericanStroke Association
Clinical Content- GWTG
Measurement PackageOversight Team
Quality Improvement Support
Quality ImprovementProject
Participating Hospitals
MASCOTS Quality Improvement Partnership
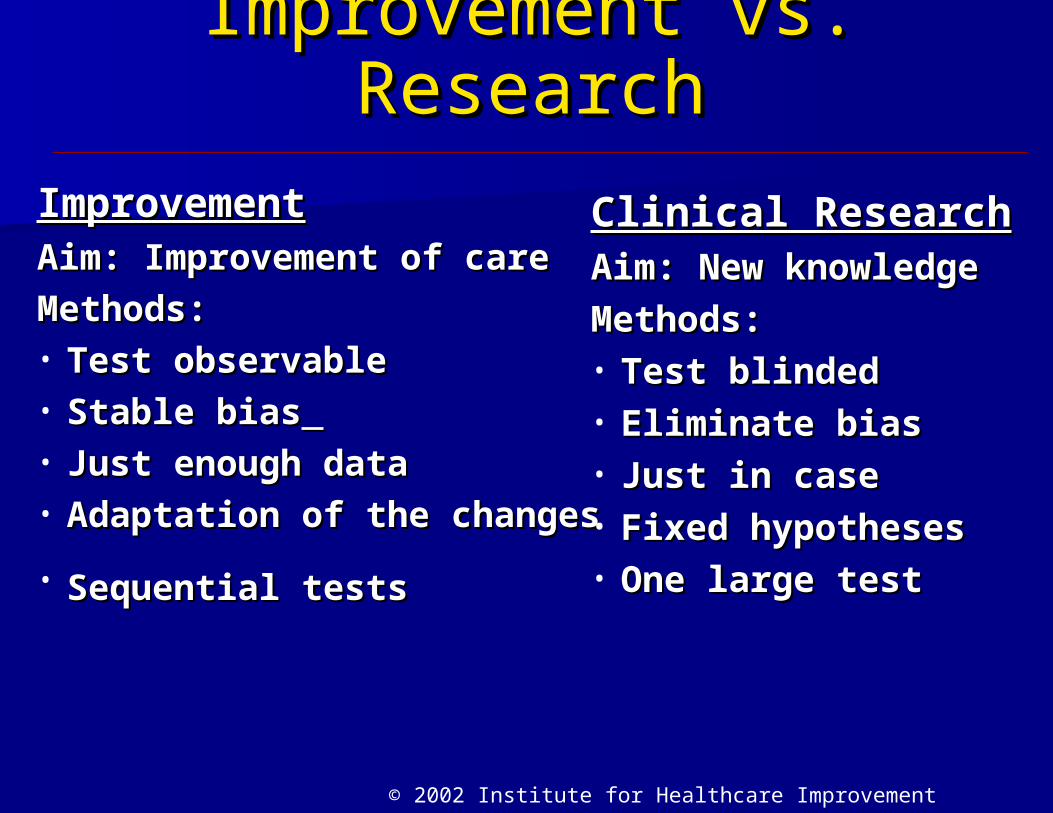
Improvement vs. Improvement vs. ResearchResearch
ImprovementImprovementAim: Improvement of careAim: Improvement of care
Methods:Methods:• Test observableTest observable• Stable biasStable bias • Just enough dataJust enough data• Adaptation of the Adaptation of the
changeschanges
• Sequential testsSequential tests
Clinical ResearchClinical ResearchAim: New knowledgeAim: New knowledge
Methods:Methods:• Test blindedTest blinded• Eliminate biasEliminate bias• Just in caseJust in case• Fixed hypothesesFixed hypotheses• One large testOne large test
© 2002 Institute for Healthcare Improvement

77
AgendaAgenda Review of MASCOTS and Burden of stroke Review of MASCOTS and Burden of stroke Define goals of the quality improvement Define goals of the quality improvement
projectproject Conceptual framework for the quality Conceptual framework for the quality
improvement planimprovement plan Description of Description of Get With The Guidelines – Get With The Guidelines –
StrokeStroke (GWTG) (GWTG) Demonstration of the Patient Management Demonstration of the Patient Management
ToolTool Breakout SessionsBreakout Sessions
– Refine the aim statement of each hospitalRefine the aim statement of each hospital– Assess current status of each hospitalAssess current status of each hospital– Determine and plan for steps to be taken before Determine and plan for steps to be taken before
next learning sessionnext learning session

88
MASCOTS Update MASCOTS Update &&
Quality ImprovementQuality Improvement GoalsGoals
99
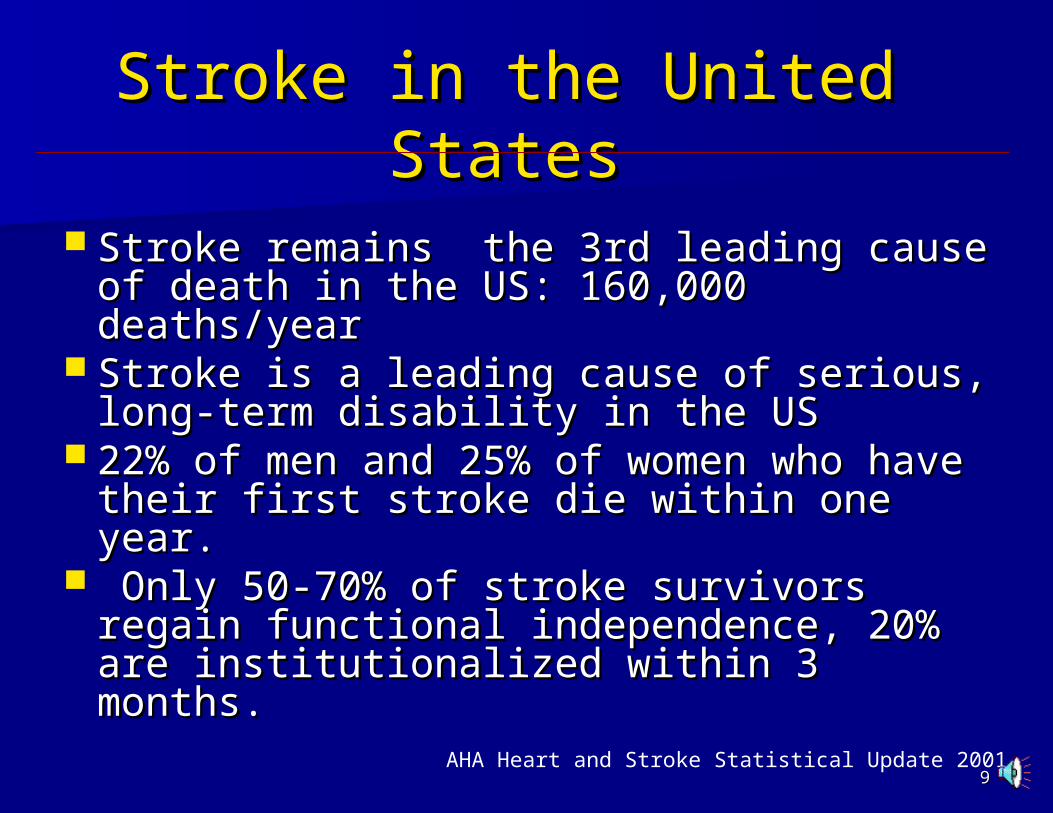
Stroke in the United StatesStroke in the United States
Stroke remains the 3rd leading cause Stroke remains the 3rd leading cause of death in the US: 160,000 of death in the US: 160,000 deaths/yeardeaths/year
Stroke is a leading cause of serious, Stroke is a leading cause of serious, long-term disability in the USlong-term disability in the US
22% of men and 25% of women who 22% of men and 25% of women who have their first stroke die within one have their first stroke die within one year. year.
Only 50-70% of stroke survivors Only 50-70% of stroke survivors regain functional independence, 20% regain functional independence, 20% are institutionalized within 3 months.are institutionalized within 3 months.
AHA Heart and Stroke Statistical Update 2001

1010
Estimated Direct and Estimated Direct and Indirect Costs of Indirect Costs of
StrokeStroke
American Heart Association. 2002 Heart and Stroke Statistical Update. 2001.
United States: 2002Hospital/Nursing Home $24.5 billion
Physicians/Other Professionals $2.4 billion
Home Health Care $3.1 billionDrugs/Other Medical Durables $0.8 billion
Indirect Costs $18.6 billion
Direct Costs
$30.8 billion
Total Cost = $49.4 billion

1111
Paul Coverdell National Acute Stroke Registry
September, 2001 Four awards were given to:
– Univ. of Cincinnati, OH.– Emory University/GA PRO, GA.– Mass General/MA PRO, MA.– MSU/MASCOTS, MI
May 2002, 1 year extension granted
Funding extended in 2002 for IL, OR, CA, NC to
develop registries
Each of the original 4 states have begun Each of the original 4 states have begun
implementation of a quality implementation of a quality improvement
project

1212
Purpose of MASCOTS QI ProjectPurpose of MASCOTS QI Project
To utilize the information To utilize the information obtained from MASCOTS to obtained from MASCOTS to develop and implement a develop and implement a plan that will positively plan that will positively impact acute stroke impact acute stroke treatment, care and treatment, care and outcomes in Michigan.outcomes in Michigan.

1313
Quality Improvement Project Quality Improvement Project TargetsTargets
Performance MeasuresPerformance Measures– Timing of assessments/interventionsTiming of assessments/interventions– Use of NIH stroke scaleUse of NIH stroke scale– Dysphagia screeningDysphagia screening– Use of antithrombotics and Use of antithrombotics and
anticoagulantsanticoagulants Medical record documentation of Medical record documentation of
items critical in the delivery of items critical in the delivery of optimal stroke careoptimal stroke care– Reason for non use of tPAReason for non use of tPA– Medical history elements: A-fib, previous Medical history elements: A-fib, previous
stroke/TIA, smoking, dyslipidemia, stroke/TIA, smoking, dyslipidemia, diabetes mellitus, HTN, previous CAD/AMIdiabetes mellitus, HTN, previous CAD/AMI

1414
Goal Setting and Goal Setting and Benchmarking for the Benchmarking for the Quality Improvement Quality Improvement
ProjectProject

1515
BenchmarkingBenchmarking
Has been used widely in the Has been used widely in the industrial quality arena industrial quality arena
Incorporates four basic comparisonsIncorporates four basic comparisons– With selfWith self– With othersWith others– With standardsWith standards– With best practicesWith best practices

1616
Determining the Benchmark for Determining the Benchmark for the MASCOTS QIPthe MASCOTS QIP
MethodsMethods– MASCOTS benchmark measures of top MASCOTS benchmark measures of top
performance were generated using a performance were generated using a modified Achievable Benchmark of Care modified Achievable Benchmark of Care (ABC(ABCTMTM) methodology. This modified ) methodology. This modified methodology used a pared-mean of the methodology used a pared-mean of the top three performing hospitals with the top three performing hospitals with the qualification that at least 10 valid qualification that at least 10 valid observations were available from a observations were available from a candidate hospital for the indicator candidate hospital for the indicator under consideration. under consideration.

1717
Increase to 100% the proportion of Increase to 100% the proportion of cases seen by an ED physician within 10 cases seen by an ED physician within 10
minutes of arrivalminutes of arrival
Mean=Mean=
19.91%19.91%

1818
Increase to 100% the proportion of cases Increase to 100% the proportion of cases having an acute stroke team consult within 15 having an acute stroke team consult within 15
minutes of arrival minutes of arrival **if arrival is if arrival is << 180 minutes from stroke symptom onset 180 minutes from stroke symptom onset
Mean=Mean=
24.32%24.32%
1919
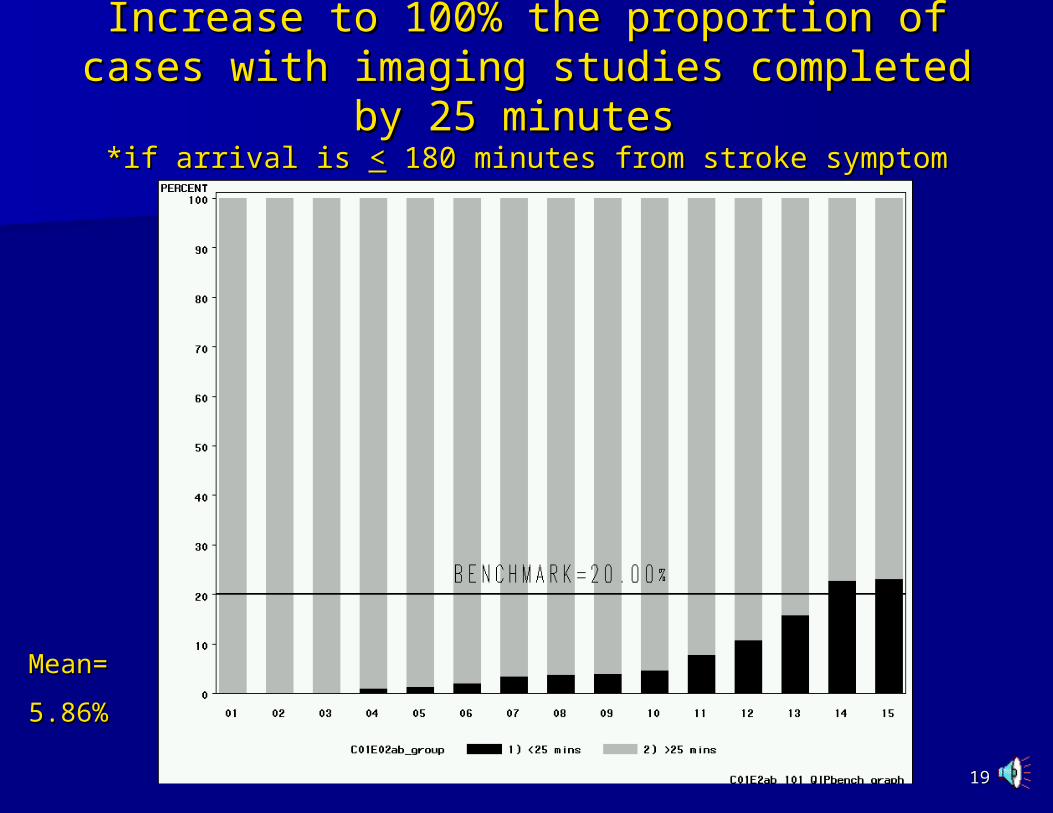
Increase to 100% the proportion of cases Increase to 100% the proportion of cases with imaging studies completed by 25 with imaging studies completed by 25
minutes minutes *if arrival is *if arrival is << 180 minutes from stroke symptom onset 180 minutes from stroke symptom onset
Mean=Mean=
5.86%5.86%

2020
Increase to 100% the proportion of Increase to 100% the proportion of cases with a documented NIH stroke cases with a documented NIH stroke
scalescale* * if arrival is if arrival is << 180 minutes from stroke symptom onset 180 minutes from stroke symptom onset
Mean=Mean=
22.05%22.05%
2121
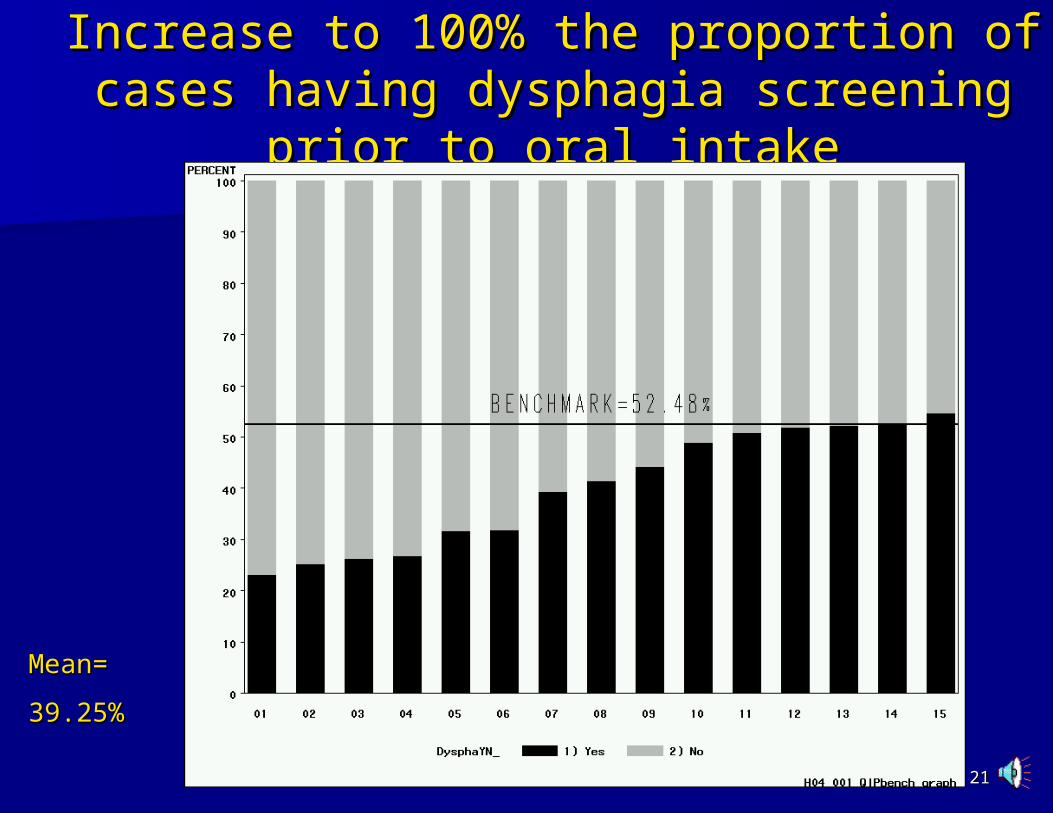
Increase to 100% the proportion of Increase to 100% the proportion of cases having dysphagia screening prior cases having dysphagia screening prior
to oral intaketo oral intake
Mean=Mean=
39.25%39.25%

2222
Increase to 100% the proportion of Increase to 100% the proportion of cases discharged on antithrombotics cases discharged on antithrombotics
without documented contraindications without documented contraindications
Mean=Mean=
97.80%97.80%

2323
Increase to 100% the proportion of Increase to 100% the proportion of cases with A-fib discharged on cases with A-fib discharged on
anticoagulants anticoagulants
Mean=Mean=
82.69%82.69%
2424
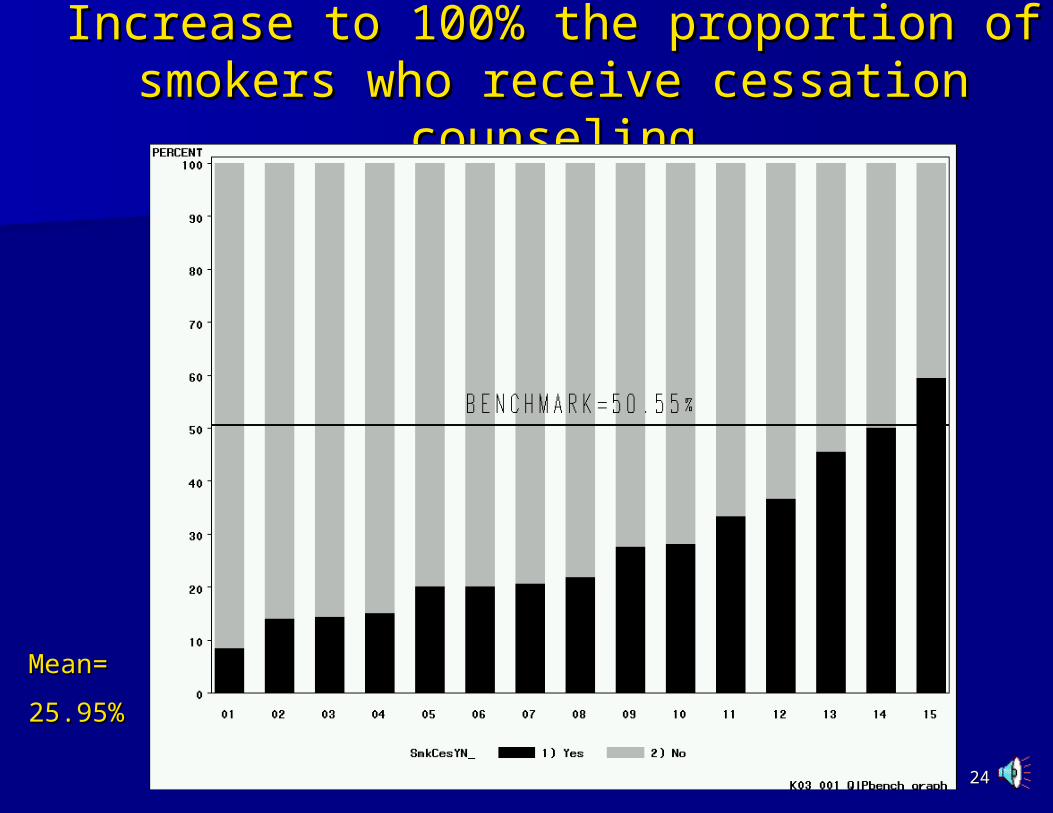
Increase to 100% the proportion of Increase to 100% the proportion of smokers who receive cessation smokers who receive cessation
counselingcounseling
Mean=Mean=
25.95%25.95%

2525
DocumentationDocumentation
2626
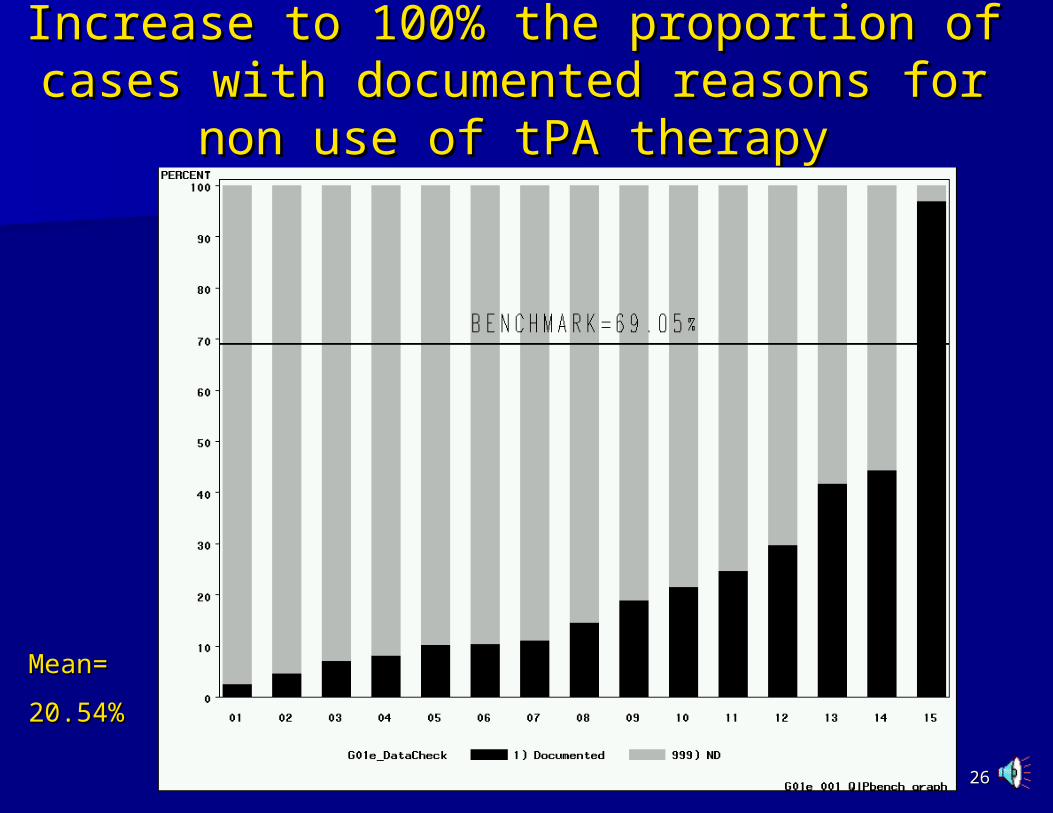
Increase to 100% the proportion of cases Increase to 100% the proportion of cases with documented reasons for non use of with documented reasons for non use of
tPA therapytPA therapy
Mean=Mean=
20.54%20.54%

2727
Decrease to 0% the proportion of cases Decrease to 0% the proportion of cases with ND recorded for previous stroke/TIA with ND recorded for previous stroke/TIA
Mean=Mean=
38.98%38.98%

2828
Decrease to 0% the proportion of cases Decrease to 0% the proportion of cases where ND is listed for antithrombotic tx. where ND is listed for antithrombotic tx.
At D/C At D/C
Mean=Mean=
2.19%2.19%

2929
Decrease to 0% the proportion of cases Decrease to 0% the proportion of cases with ND recorded for A-fib with ND recorded for A-fib
Mean=Mean=
70.84%70.84%

3030
Decrease to 0% the proportion of cases Decrease to 0% the proportion of cases with ND recorded for smoking with ND recorded for smoking
Mean=Mean=
6.45%6.45%
3131
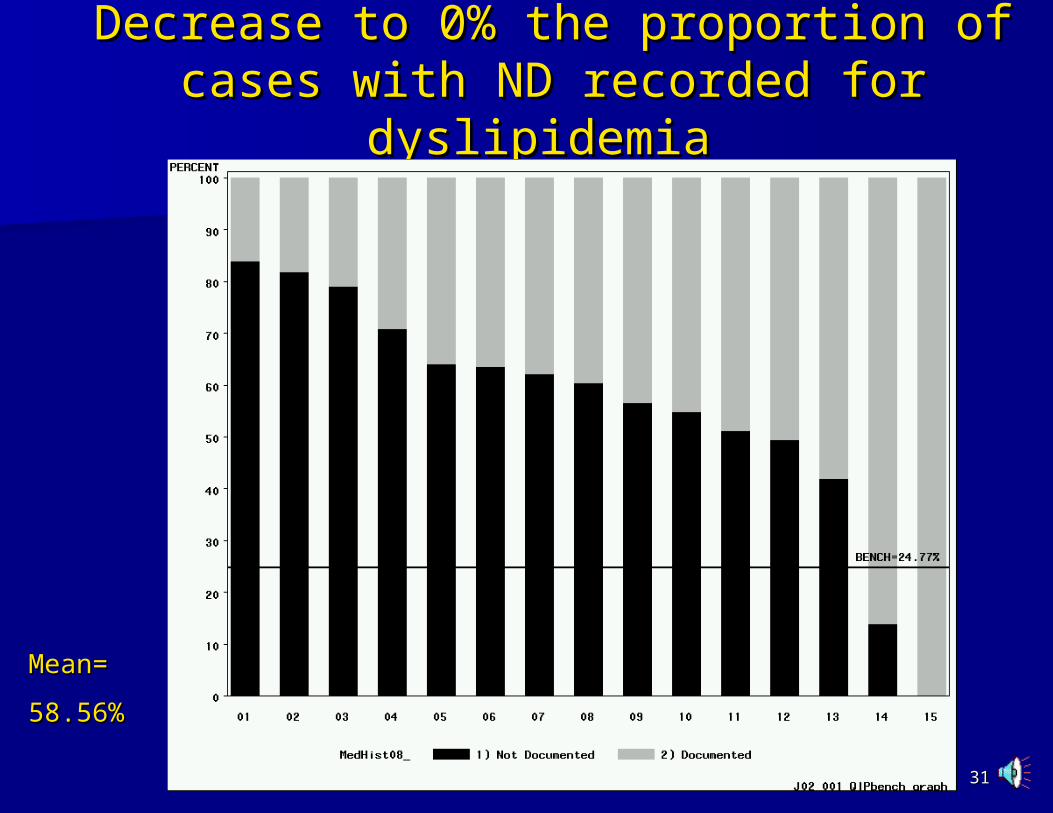
Decrease to 0% the proportion of cases Decrease to 0% the proportion of cases with ND recorded for dyslipidemia with ND recorded for dyslipidemia
Mean=Mean=
58.56%58.56%

3232
Decrease to 0% the proportion of cases Decrease to 0% the proportion of cases with ND recorded for diabetes mellitus with ND recorded for diabetes mellitus
Mean=Mean=
49.18%49.18%

3333
Decrease to 0% the proportion of cases Decrease to 0% the proportion of cases with ND recorded for HTN with ND recorded for HTN
Mean=Mean=
19.78%19.78%
3434
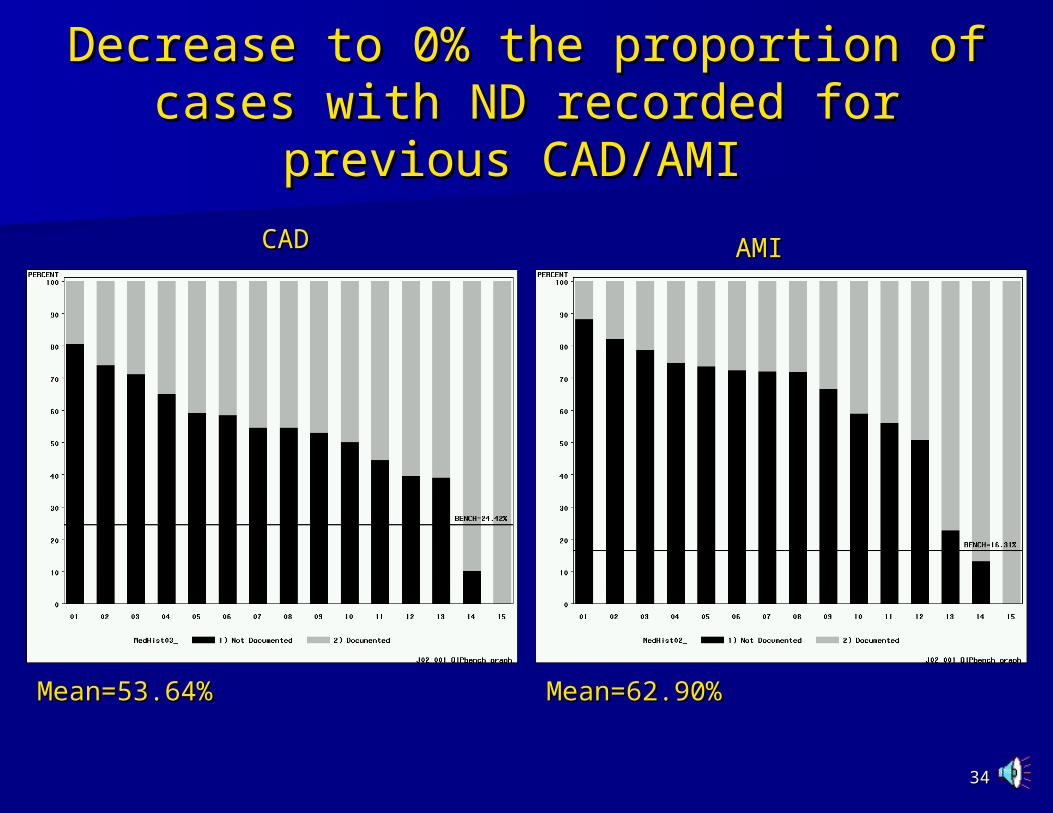
Decrease to 0% the proportion of Decrease to 0% the proportion of cases with ND recorded for previous cases with ND recorded for previous
CAD/AMI CAD/AMI
Mean=53.64%Mean=53.64% Mean=62.90%Mean=62.90%
CADCAD AMIAMI

3535
How Do We Get How Do We Get There From Here?There From Here?

3636
Performance Improvement Performance Improvement Model SelectionModel Selection
Systematic ApproachSystematic Approach Allow for Collaborative NatureAllow for Collaborative Nature Proven Track RecordProven Track Record FlexibleFlexible
3737
Institute for Healthcare Institute for Healthcare Improvement Breakthrough Improvement Breakthrough
SeriesSeries
Collaborative model for improvementCollaborative model for improvement Have completed 26 Collaborative Have completed 26 Collaborative
projects in the USprojects in the US Model can be adapted to fit the needs Model can be adapted to fit the needs
of this projectof this project
The IHI Breakthrough The IHI Breakthrough SeriesSeries
An improvement method that An improvement method that relies on relies on spreadspread and adaptation and adaptation of of existing knowledgeexisting knowledge to to multiple multiple settingssettings to accomplish a common to accomplish a common aimaim..
© 2002 Institute for Healthcare Improvement

3939
Introduction to Introduction to Collaborative LearningCollaborative Learning
4040
What Is Collaboration?What Is Collaboration?
Joint effort among multiple Joint effort among multiple organizations that share organizations that share resources and informationresources and information
Each organization benefits Each organization benefits individually, even though the individually, even though the organizations are working organizations are working togethertogether
© 2002 Institute for Healthcare Improvement
4141
What Does Collaboration What Does Collaboration Accomplish?Accomplish?
Achieves goals that would not Achieves goals that would not have been attainable for an have been attainable for an organization working on its organization working on its own (both scope and pace)own (both scope and pace)
© 2002 Institute for Healthcare Improvement
4242
Key Elements of Key Elements of Breakthrough Breakthrough ImprovementImprovement
Will to do what it takes to change to Will to do what it takes to change to a new systema new system
Ideas on which to base the design of Ideas on which to base the design of the new systemthe new system
Execution of the ideas Execution of the ideas
© 2002 Institute for Healthcare Improvement

IHI Breakthrough IHI Breakthrough SeriesSeries
(6 to 13 months time frame)(6 to 13 months time frame)Select Topic (develop mission)
Planning Group
Develop Framework & Changes
Participants
Prework
LS 1
P
S
A D
P
S
A D
LS 3LS 2
Supports
Email Visits
Phone Assessments
Monthly Team Reports
Congress,
Guides,
Publications
etc.
A D
P
SExpert Meeting
© 2002 Institute for Healthcare Improvement

4444
Learning SessionsLearning Sessions
Everyone learns – everyone Everyone learns – everyone teaches!teaches!
Followed by PDSA cycleFollowed by PDSA cycle Topic of Sessions:Topic of Sessions:
– Sept 8 – Planning for Implementation Sept 8 – Planning for Implementation – January – Implementation, pilot testing January – Implementation, pilot testing
and dealing with barriersand dealing with barriers– April – Monitoring progress, April – Monitoring progress,
refinements and spreadrefinements and spread– July – Results and debriefingJuly – Results and debriefing
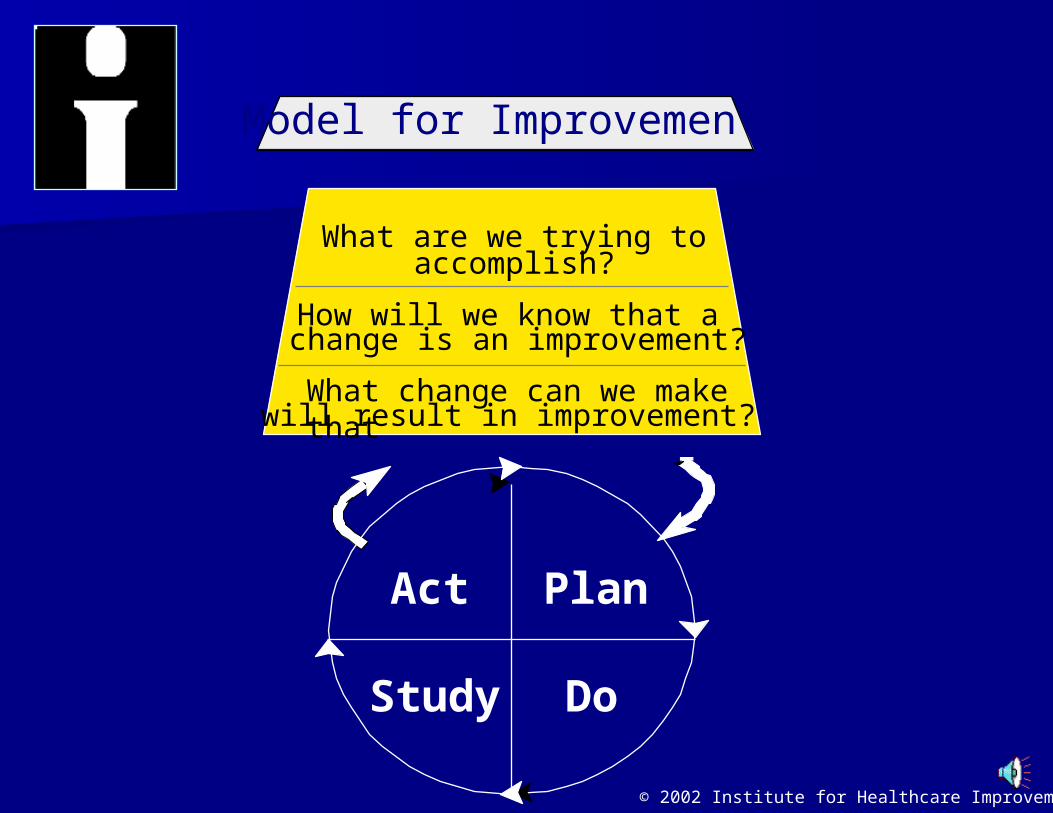
What are we trying toaccomplish?
How will we know that achange is an improvement?
What change can we make thatwill result in improvement?
Model for Improvement
PlanAct
DoStudy
© 2002 Institute for Healthcare Improvement

What is the PDSA Cycle?
Act
• What changes are to be made? (implement or adapt the change)• Next cycle?
Plan• Objective• Questions and predictions (why)• Plan to carry out the cycle (who, what, where, when)
Study• Complete the analysis of the data
•Compare data to predictions
•Summarize what was learned
Do• Carry out the plan• Document problems and unexpected observations• Begin analysis of the data
© 2002 Institute for Healthcare Improvement

4747
Learning Session #1Learning Session #1Planning for ImplementationPlanning for Implementation
Begin to assess current statusBegin to assess current status– Do we have standard tools?Do we have standard tools?– Do they reflect the most current standards?Do they reflect the most current standards?– Are they easy to use?Are they easy to use?– Breakout sessionBreakout session
Methods to determine what changes are Methods to determine what changes are necessary necessary – Breakout sessionBreakout session
Begin development of action plan Begin development of action plan – Breakout sessionBreakout session
4848
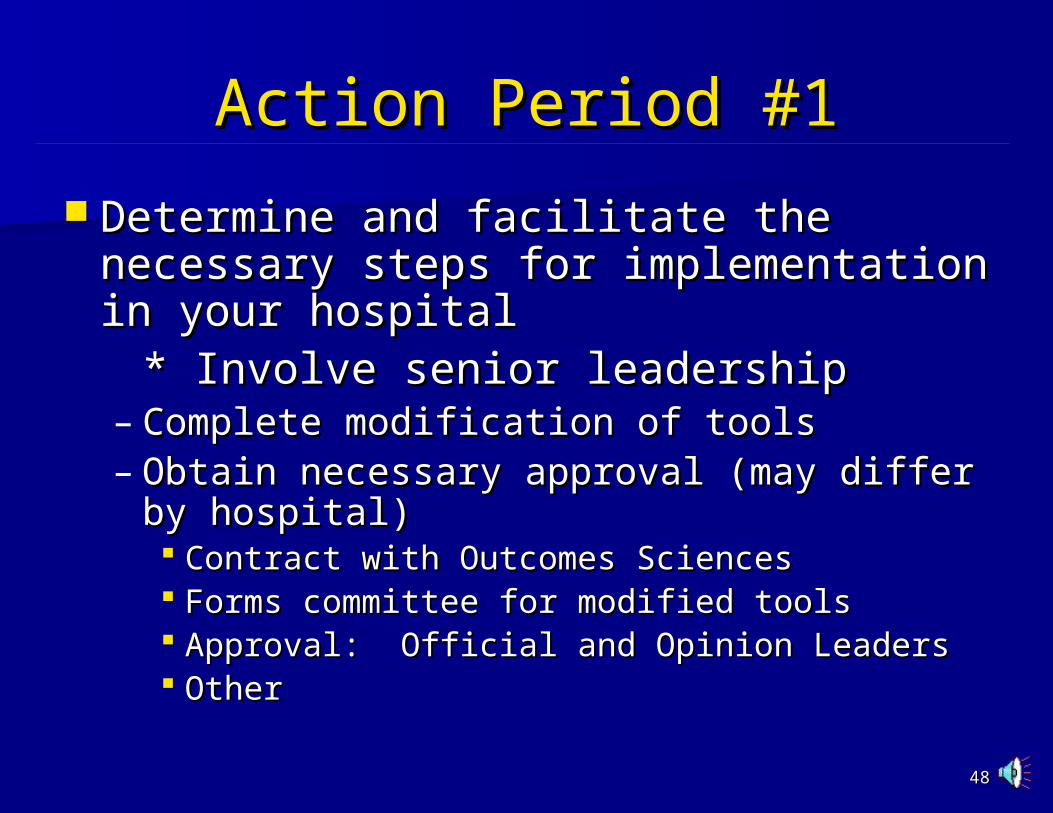
Action Period #1Action Period #1
Determine and facilitate the Determine and facilitate the necessary steps for implementation in necessary steps for implementation in your hospital your hospital
* Involve senior leadership * Involve senior leadership – Complete modification of toolsComplete modification of tools– Obtain necessary approval (may differ by Obtain necessary approval (may differ by
hospital)hospital) Contract with Outcomes SciencesContract with Outcomes Sciences Forms committee for modified toolsForms committee for modified tools Approval: Official and Opinion LeadersApproval: Official and Opinion Leaders Other Other
4949
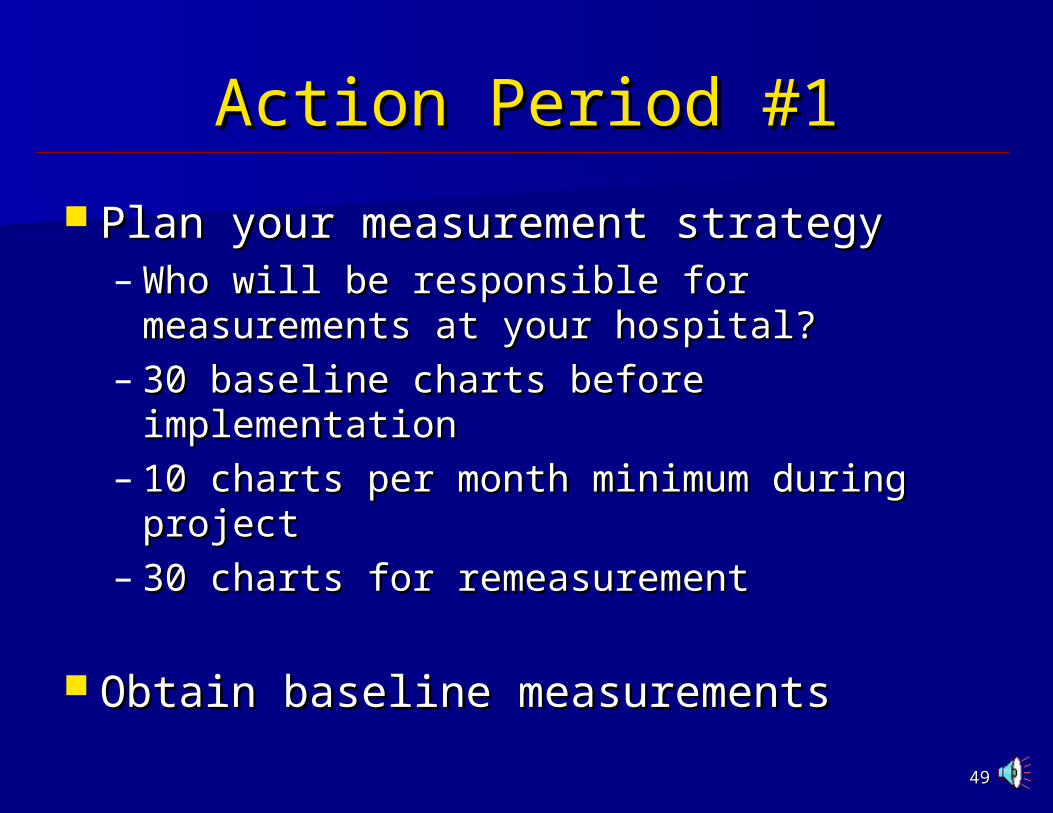
Action Period #1Action Period #1
Plan your measurement strategyPlan your measurement strategy– Who will be responsible for Who will be responsible for
measurements at your hospital?measurements at your hospital?– 30 baseline charts before implementation30 baseline charts before implementation– 10 charts per month minimum during 10 charts per month minimum during
projectproject– 30 charts for remeasurement30 charts for remeasurement
Obtain baseline measurementsObtain baseline measurements

5050
Action Period #1Action Period #1
Coordinate a multidisciplinary Coordinate a multidisciplinary hospital team. hospital team. – Enlist the team in review, revision or Enlist the team in review, revision or
development of documents development of documents – Revise the protocols to close the gaps Revise the protocols to close the gaps
and reflect compliance with current and reflect compliance with current guidelines (templates are in hospital guidelines (templates are in hospital tool kit)tool kit)

5151
Technology Adoption ProcessTechnology Adoption Process
LaggardsLate
MajorityEarly
MajorityEarly AdoptersInnovators
"The Chasm"
Developed by Everett Rogers - expert in rural sociology
Model can be used to interpret almost any form of innovation
Theory suggests that critical mass typically occurs when about 15 or 20
percent of a target population adopts a new innovation from: "The Coming Ubiquity of Information Technology" in Change, Vol. 28, 3/13/96
5252
Technology Adoption ProcessTechnology Adoption Process
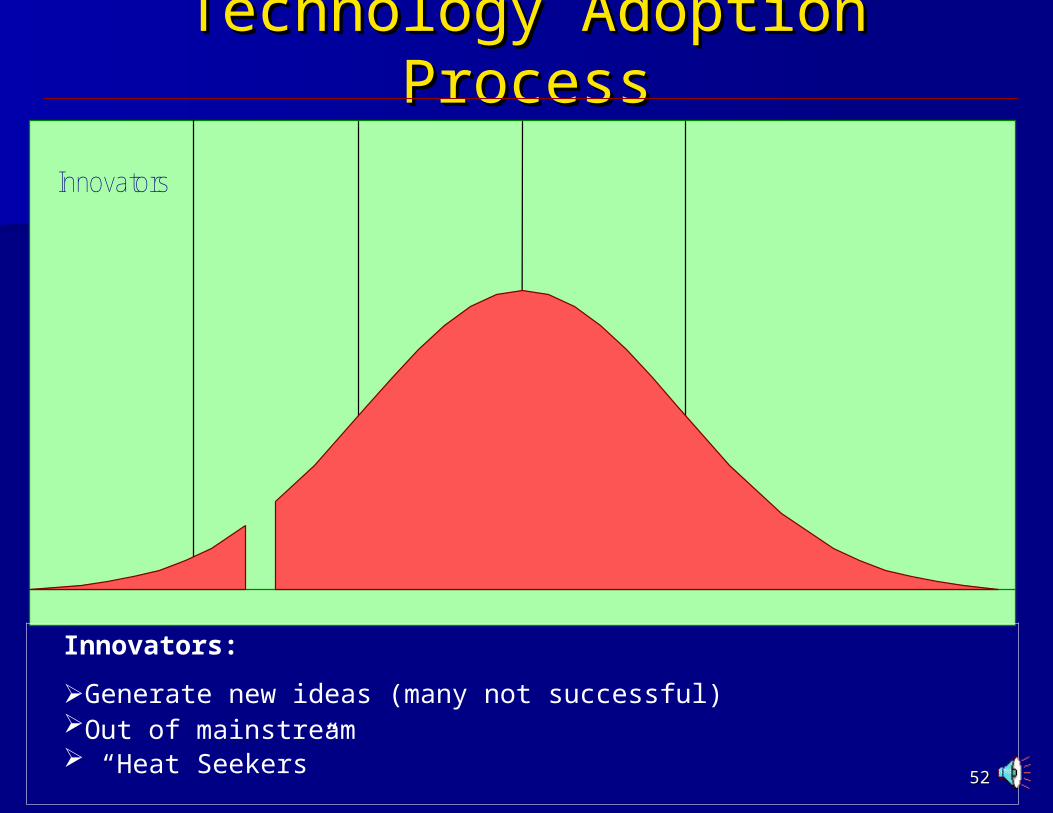
Innovators
Innovators:
Generate new ideas (many not successful)Out of mainstream “Heat Seekers”

5353
Technology Adoption ProcessTechnology Adoption Process
Early AdoptersInnovators
"The Chasm"
Early Adopters:
Key to successful change Links to Innovators and Majority Opinion leaders Take the idea from the innovator and makes the change happen

5454
Technology Adoption ProcessTechnology Adoption Process
EarlyMajority
Early AdoptersInnovators
"The Chasm"
Early Majority:
High degree of interaction with peers Not generally opinion leaders Cautions about change

5555
Technology Adoption ProcessTechnology Adoption Process
LateMajority
EarlyMajority
Early AdoptersInnovators
"The Chasm"
Late Majority: Need early majority to demonstrate change is an improvement Peer pressure to change

5656
Technology Adoption ProcessTechnology Adoption Process
LaggardsLate
MajorityEarly
MajorityEarly AdoptersInnovators
"The Chasm"
Laggards:
Traditionalists Passionate about viewpoint Focus more on Early Adopters
5757
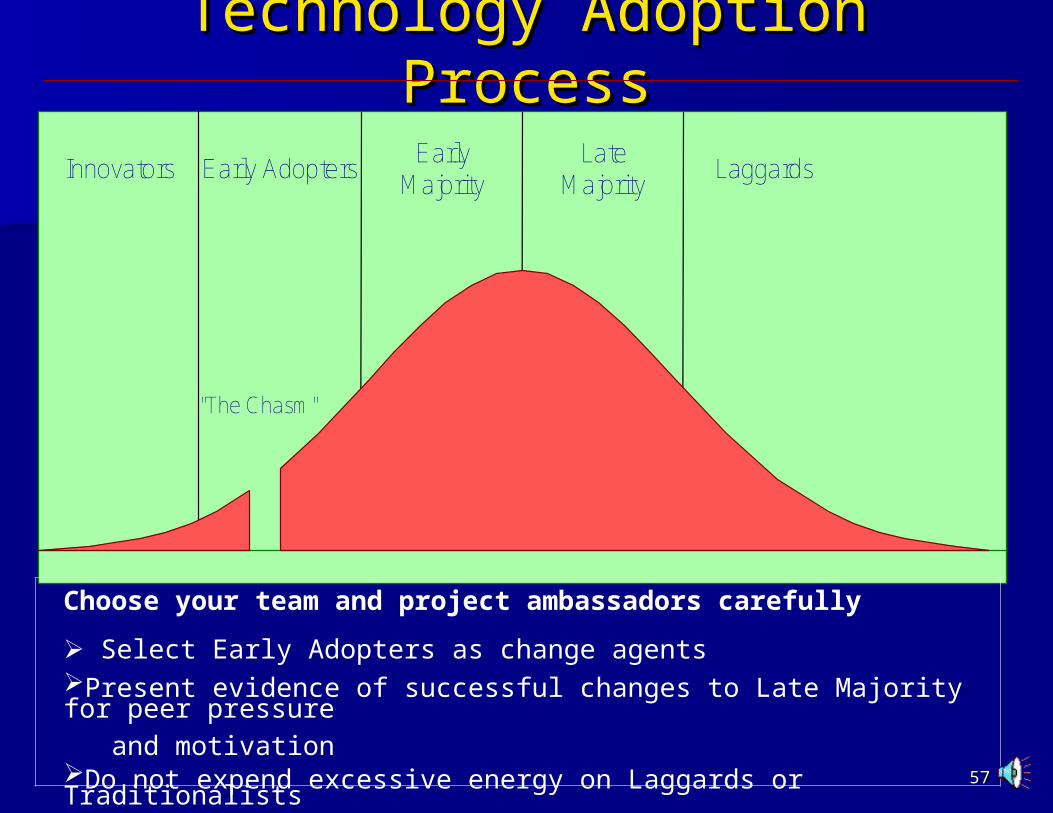
Technology Adoption ProcessTechnology Adoption Process
LaggardsLate
MajorityEarly
MajorityEarly AdoptersInnovators
"The Chasm"
Choose your team and project ambassadors carefully
Select Early Adopters as change agentsPresent evidence of successful changes to Late Majority for peer pressure
and motivationDo not expend excessive energy on Laggards or Traditionalists

5858
Collaborative Action Period Collaborative Action Period ActivitiesActivities
Monthly Conference CallsMonthly Conference Calls
Project Leader Monthly ReportsProject Leader Monthly Reports– Generated from monthly data Generated from monthly data
abstraction and feedback abstraction and feedback
E-mail communication to E-mail communication to communicate questions and communicate questions and share experiencesshare experiences

Participating HospitalsParticipating Hospitals
University of University of Michigan Medical Michigan Medical CenterCenter
Ingham Regional Ingham Regional Borgess HospitalBorgess Hospital Bronson Methodist Bronson Methodist
HospitalHospital Saint Mary’s Mercy Saint Mary’s Mercy
Medical Center, Medical Center, Grand RapidsGrand Rapids
St. Joseph TawasSt. Joseph Tawas Metropolitan Metropolitan
Hospital Hospital Detroit Receiving Detroit Receiving
HospitalHospital Sparrow HospitalSparrow Hospital St. Mary’s SaginawSt. Mary’s Saginaw St. John Health St. John Health
System DetroitSystem Detroit Northern Michigan Northern Michigan
HospitalHospital

6060
Thank YouThank You