1 Prentice Hall, 2002 (for lecture 21.01.03) Information Rules - Shapiro & Varian Chapter 1: The...
55
Prentice Hall, 2002 1 (for lecture 21.01.03) Information Rules - Shapiro & Varian Chapter 1: The Information Economy Chapter 7: Network Economics modifications by J.Molka-Danielsen
-
date post
20-Dec-2015 -
Category
Documents
-
view
214 -
download
0
Transcript of 1 Prentice Hall, 2002 (for lecture 21.01.03) Information Rules - Shapiro & Varian Chapter 1: The...

Prentice Hall, 2002 1
(for lecture 21.01.03) Information Rules
- Shapiro & VarianChapter 1: The Information Economy
Chapter 7: Network Economics
modifications by J.Molka-Danielsen
Prentice Hall, 2002 2
The Information Economy
Carl ShapiroHal R. Varian

Prentice Hall, 2002 3
Systems of Products
Complementary productsHardware/softwareClient/serverViewer/content
Product linesHigh fixed cost, low incremental costLeads to value based pricing

Prentice Hall, 2002 4
Unique Features
ComplementsDifferent manufacturersStrategy for complementors as well as competitorsCompatibility as strategic choiceStandards and interconnection
Product linesLower quality may be more expensive

Prentice Hall, 2002 5
Information
Anything that can be digitizedText, images, videos, music, etc.a.k.a. content, digital goods
Unique cost characteristicsUnique demand characteristics

Prentice Hall, 2002 6
Cost structure
Expensive to produce, cheap to reproduceHigh fixed cost, low marginal cost
Not only fixed, but sunkNo significant capacity constraints Particular market structures
MonopolyCost leadershipProduct differentiation (versioning)
Prentice Hall, 2002 7
Rights Management
Low reproduction cost is two-edged sword
Cheap for owners (high profit margin)But also cheap for copiers
Maximize value of IP, not protectionExamples
Library industryVideo industry

Prentice Hall, 2002 8
Consumption CharacteristicsExperience good
BrowsingAlways newReputation and brand identity
Overload Economics of attention Hotmail example Broadcast, point-to-point, hybrid
Prentice Hall, 2002 9
Technology
Infrastructure to store, retrieve, filter, manipulate, view, transmit, and receive informationAdds value to information
Web = 1 terabyte of text = 1 million booksIf 10% useful = 1 Borders BookstoreValue of Web is in ease of access
Front end to databases, etc.Currency

Prentice Hall, 2002 10
Systems Competition
Microsoft-Intel: WintelIntel
Commoditize complementory chips
MicrosoftCommoditize PCs
AppleIntegrated solutionWorked better, but lack of competition and scale led to current problems

Prentice Hall, 2002 11
Lock-In and Switching Costs
Example: Stereos and LPsCostly switch to CDs
Systems lock-in: durable complements
Hardware, software, and wetwareIndividual, organizational, and societal
Prentice Hall, 2002 12
Network Effects
Value depends on number of usersPositive feedback
Fax (patented in 1843)Internet (1980s)
Indirect network effects Software
Expectations managementCompetitive pre-announcements

Prentice Hall, 2002 13
Compatibility
ExamplesBeta v. VHSSony v. Philips for DVD
Role of 3rd partiesRead v. write standards
Backwards compatibility?Windows 95Windows NT
Prentice Hall, 2002 14
Basic Strategies
Go it alonePartnerships (Java)Formal standard setting
Widespread use Licensing requirements
Competition in a market or for a market?

Prentice Hall, 2002 15
Policy
Understand environmentIP policyCompetition policy
Regulation Antitrust
Electronic commerce Contracts Privacy
Prentice Hall, 2002 16
Information is Different…but not so different
Key conceptsVersioningLock-inSystems competition, Network effects

Network Economics – for Lo205
Judith [email protected]://home.himolde.no/~molka
Reference: “Information Rules”, Carl Shapiro and Hal R. Varian, Havard Business Sch. Press, chapter 07, 1999.
March 01, 2002

Overview Describe the New Information Economy Discuss the factors in the Economics of
Networks Define the terms: network effects and
network externaltities Discuss the concept of Lock-in
The old industrial economy Dominated by Oligopolies a few large firms market share rose and fell slowly lifetime employment Industries that exhibited this:
– automobile– steel– aluminum– petrolium– chemical markets
economies of scale
The new information economy Dominated by temporary monopolies dominate player based on the days leading
technology short time on top 7 years average at one job Industries: hardware and software economies of networks

Types of Networks Physical networks
– telephone, electrical,– railroad, – airlines
High Technology (real)– computer, fax machine, compatible modems, – email, ATMs, Internet
High Technology (virtual)– Macintosh users, CD readers-writers users, – Nintendo 64 users, minidisc users

Important Concepts It is better to be connected to a bigger
network than to a smaller one. Network effects Positive Network Externalities Companies compete by expanding their
networks, they increase the value by interconnecting with other networks.
Positive Feedback Positive feedback - the strong get stronger
and the weak get weaker. Speaking into a microphone, when the
amplified signals go back into the system, you have repeated amplification. It gets loud.
Negative feedback - when the strong get weaker and the weak get stronger. Go to a middle point. Industrial oligopolies exhibit.
In the industrial markets, attempts for greater market share would trigger responses by others towards efficiency, also too large firms were too complex to manage. The norm were oligopolies.
Positive feedback (cont.) Postitive feedback can contribute to
growth, but it is not the same thing. Ie. Internet.
Virtuous cycle - success feeds itself. Vicious cycle - product seen as failing,
the perception feeds the cycle, death spiral, the weak get weaker. Ie. Apple Macintosh.
Tippy market - two players compete, one wins. (Video recorders - VHS v. Beta) Winner take all.
Positive Feedback - example Nintendo - enters home video games in 1985 Other dominant player at the time (Atari,
Texas Instruments) Christmas 1986, Nintendo Entertainment
System (NES) was hot. More game developers begin to write games for them.
Game developers pay royalties to Nintendo and agree to not share the game with other systems for 2 years after release.

Sources of Positive Feedback (V&S)
Supply side economies of scale– Declining average cost– Marginal cost less than average cost– Example: information goods
Demand side economies of scale– Network effects– In general: fax, email, Web– In particular: Sony v. Beta, Wintel v. Apple

Chicken & Eggs (V&S)
Fax and fax machines VCRs and tapes Internet browsers and Java

S-shaped curve Adoption of new technologies follow an S-
shaped curve in three phases:– flat during launch,– steep rise during takeoff, positive feedback at
work,– leveling off, saturation is reached.
Seen in the adoption of: fax machine, CD, color TV, video games, e-mail, and the Internet.

Economies of Scale Economies of scale - is a source of positive
feedback. Larger firms tend to have lower unit costs of productions. This is supply-side economies of scale.
In manufacturing the benefits of scale are usually exhausted before total market dominance.
Demand side economies of scale - Microsoft Windows 95 in 1998, widely used, de facto industry standard. Some technologies go head-to-head for years before a winner emerges. Telephone netwk also showed this.

Network externalities Sponsor - of a net builds and hopes to profit from the
net. – Apple controls interfaces, clone license terms, architecture
improvements, for the Mac. And influence supply of complementary products. (Partners)
Recall externalities are positive and negative (pollution)
Positive network externalities lead to positive feedback
Metcalfe’s law: The value of the network goes up as the square of the number of users. Total value of the network to all users = n x (n-1) = n2 -n where n is the number of users. If value=$1 for a single user, and n=10, then network size 10 has 102-10=90 = $90.

Collective switching costs Switching costs - come from complementary
assets, hardware with software, IT systems with training. If I learn to program in Access db language other Access software and the language becomes more valuable to those who are already users.
But it is hard to get people to switch, collective switching costs. It is hard to coordinate users to switch all at the same time, and they will not do so by themselves. Therefore, the existing providers have the advantage.
1870 QWERTY keyboard wins over the 1932 Dvorak layout with home row AOEUIDHTNS that was proven to be faster. We would collectively be better to switch but the individual switching costs are too high. (Also called technological Lock-in.)
Summary on Lock-In and Switching Costs (V&S)
Network effects lead to substantial collective switching costs
Collective lock-in is even worse than individual lock-in
Due to coordination costs Example: QWERTY

Don’t Get Carried Away (V&S)
Network externalities don’t always apply– ISPs (but watch out for QoS)– PC production (easy to produce)

Industry and positive feedback Not every market tips (Ford had a best-selling-car,
but who cares, you do not buy a car because others have it. But you may avoid a car because no one has it.)
There are no demand side economies of scale within the IBM compatible PC market because standards allow interoperability. Another example, Internet service providers. (America Online, CompuServe, Delphi, had separate discussion groups before Internet. Now access can be from anyone, AOL, IBM, ATT, etc.)
ISPs could differentiate access through QoS offers, video conferencing, etc. Large ISPs have advantage because it is easier to control QoS on a single network.
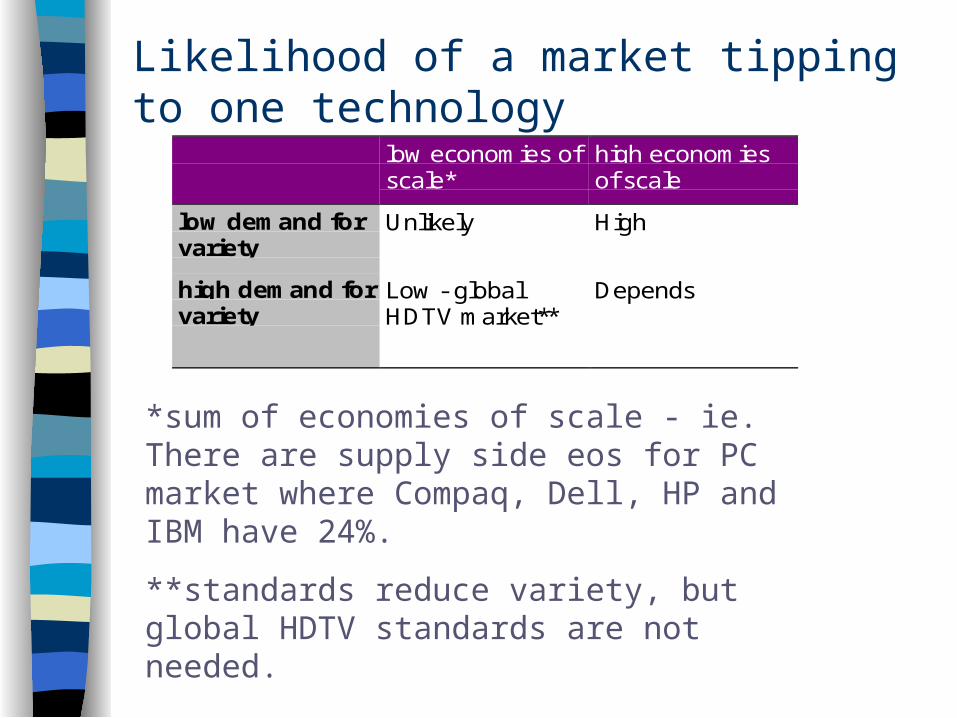
Likelihood of a market tipping to one technology
low economies ofscale*
high economiesof scale
low demand forvariety
Unlikely High
high demand forvariety
Low - globalHDTV market**
Depends
*sum of economies of scale - ie. There are supply side eos for PC market where Compaq, Dell, HP and IBM have 24%.
**standards reduce variety, but global HDTV standards are not needed.
Performance v. compatibility How do you start the virtuous cycle? Philips and
Sony introduced the CD in the 1980s. Philips offers digital compact cassette (DCC) in 1992
where DCC players can play regular cassettes, backward compatible. But it didn’t catch on.
Consumer inertia approaches: the evolution strategy of compatibility, and the revolution strategy of performance.
Revolution - best performance to start over with a new product, but high switching costs.
Evolution - give up some performance to allow compatibility (lower switching costs).

Igniting Positive Feedback (V&S)
(First fundamental tradeoff)
Evolution– Give up some performance to ensure
compatibility, thus easing consumer adoption
Revolution– Wipe the slate clean and come up with the
best product possible

Evolution (V&S)
Offer a migration path Examples
– Microsoft– Intel– Borland v Lotus
Build new network by links to old one Problems: technical and legal

Technical Obstacles to Evolution (V&S)
Use Creative design Think in terms of system Converters and bridge technologies
– One-way compatibility
Legal Obstacles (V&S)
Need IP licensing Example: Sony and Philips CDs

Openness v. Control Is the second fundamental tradeoff. Open - make interfaces and specifications available
to others. Consumers can fear lock-in, open raises chances of success, attracks allies.
Control - keep your system proprietary. (This is valuable if your system takes off.) Installed base is more valuable if rivals cannot offer products to lock-in customers. Control interconnection.
Existing market position, technical capabilities and control of intellectual property rights are 3 dimensions of critical market strength.
Intel controls MMX multimedia specs for its Pentium chips, but promote an open interface spec for graphic controllers, the accelerated graphics port (AGP) to increase demand for their microprocessors.
Openness v. Control (V&S) Your reward (total value to you) = Total value
added to industry x your share (in the market). Total Value added to Industry (VI)
– Depends on product and– Size of network– VI= the value the technology adds to the existing
product value + how widely the technology is adopted (network size).
Your share (YS) of industry value– Depends on how open– YS= your market share + your profits + your
royalties + how the technology effects your sale of other products (add to sales or take away).

Openness (V&S)
Full openness– Anybody can make the product– Problem: no champion
Alliance– Only members of alliance can use– Problem: holding alliance together

Control (V&S)
Control standard and go it alone If several try this strategy, may lead to
standards wars

Openness v. Control Best Strategies:
– Have a large share of a small market (small pie), – Have a small share of a large market (Sun and
Java). The optimal point is where you maximize Total Value
to you. Systems - are a cooperation of compoenets To caputre value from one component requires
cooperation with those providing the other components.
Suppliers will want a share of the rewards in retrurn for cooperation.
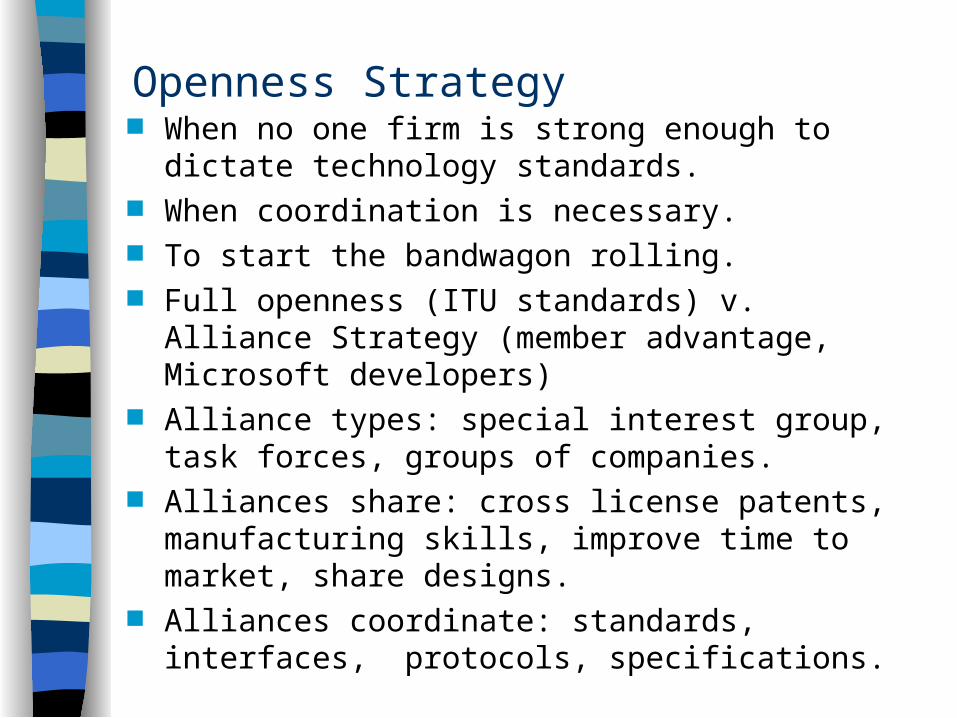
Openness Strategy When no one firm is strong enough to dictate
technology standards. When coordination is necessary. To start the bandwagon rolling. Full openness (ITU standards) v. Alliance Strategy
(member advantage, Microsoft developers) Alliance types: special interest group, task forces,
groups of companies. Alliances share: cross license patents,
manufacturing skills, improve time to market, share designs.
Alliances coordinate: standards, interfaces, protocols, specifications.
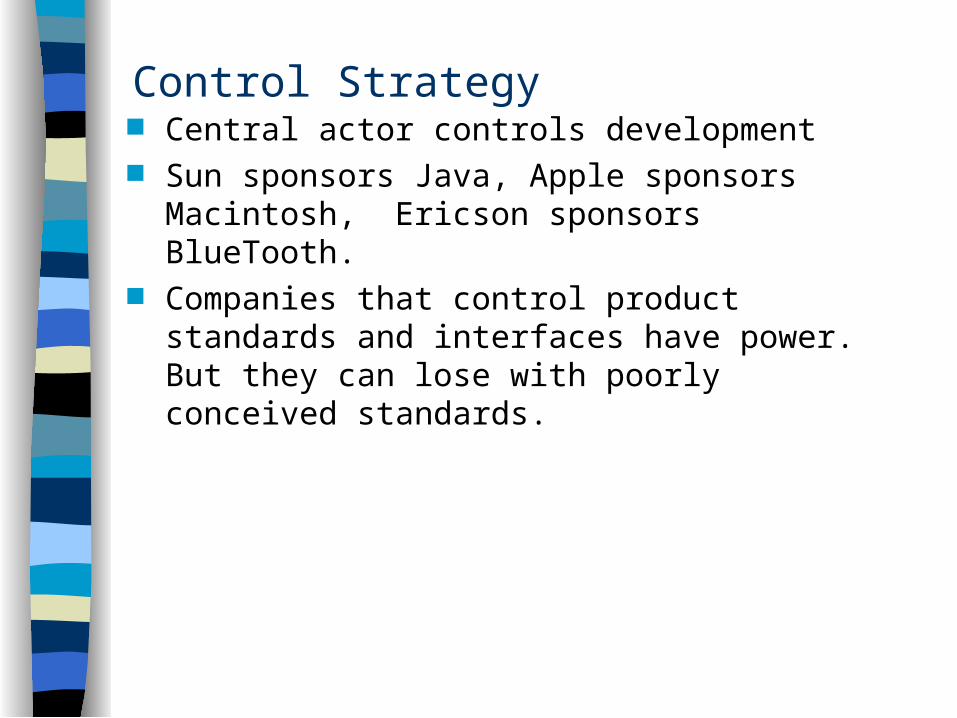
Control Strategy Central actor controls development Sun sponsors Java, Apple sponsors Macintosh,
Ericson sponsors BlueTooth. Companies that control product standards and
interfaces have power. But they can lose with poorly conceived standards.
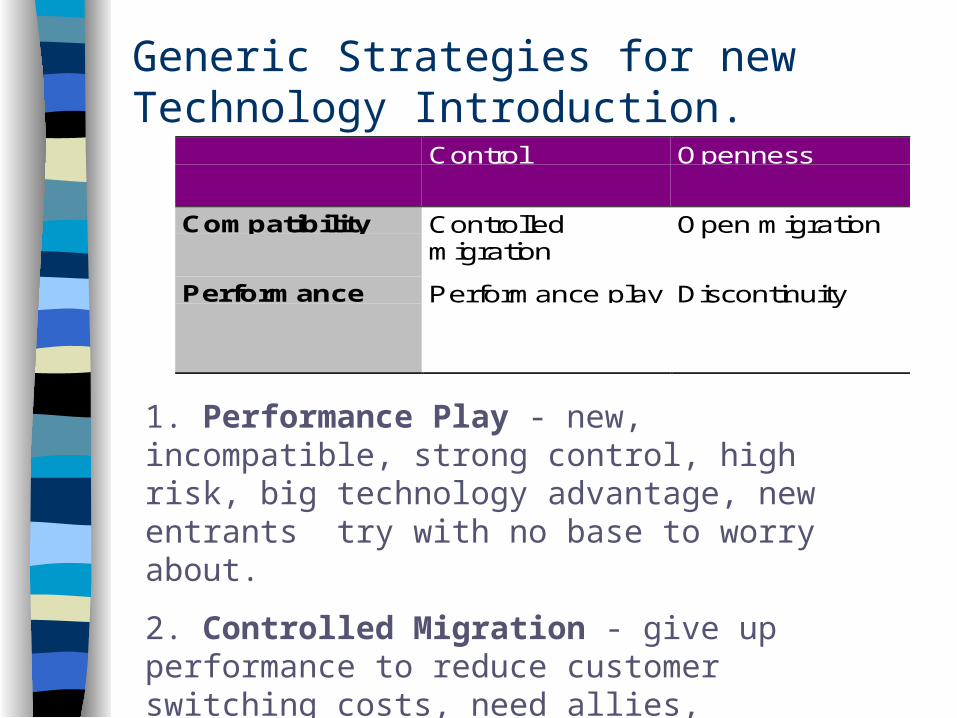
Generic Strategies for new Technology Introduction.
Control Openness
Compatibility Controlledmigration
Open migration
Performance Performance play Discontinuity
1. Performance Play - new, incompatible, strong control, high risk, big technology advantage, new entrants try with no base to worry about.
2. Controlled Migration - give up performance to reduce customer switching costs, need allies, backward compatible, but proprietary.
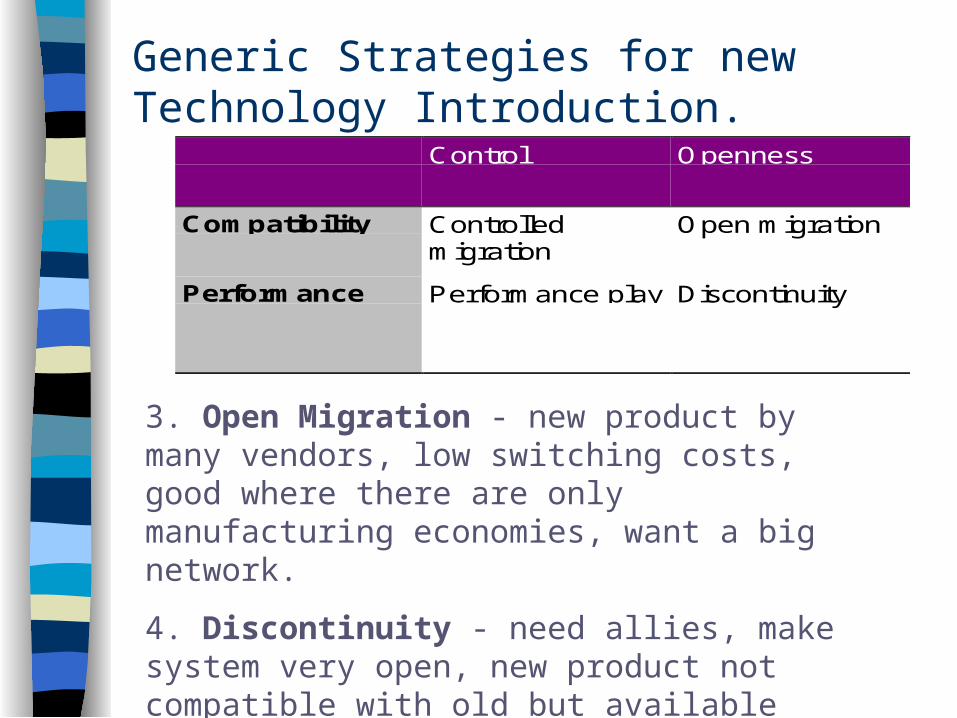
Generic Strategies for new Technology Introduction.
Control Openness
Compatibility Controlledmigration
Open migration
Performance Performance play Discontinuity
3. Open Migration - new product by many vendors, low switching costs, good where there are only manufacturing economies, want a big network.
4. Discontinuity - need allies, make system very open, new product not compatible with old but available from many suppliers, favor efficient manufacturers.
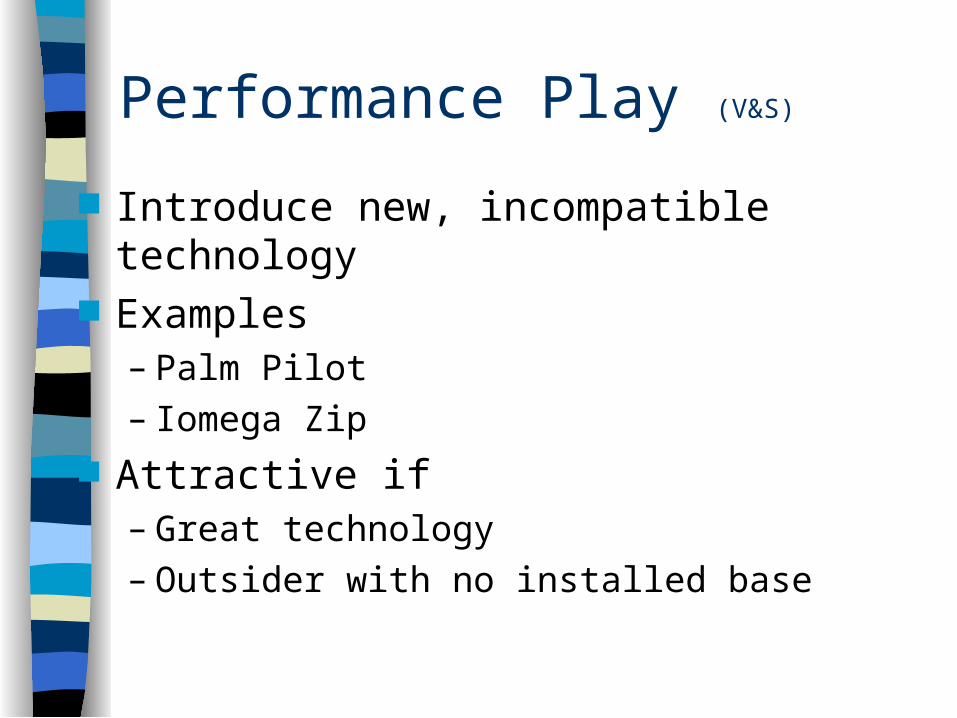
Performance Play (V&S)
Introduce new, incompatible technology Examples
– Palm Pilot– Iomega Zip
Attractive if– Great technology– Outsider with no installed base
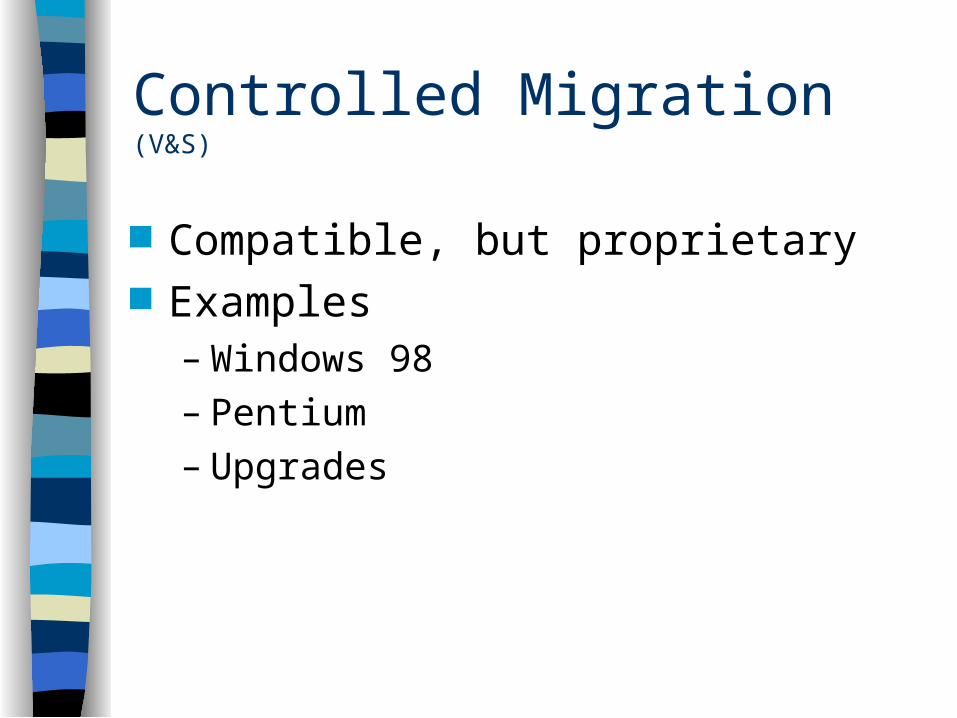
Controlled Migration (V&S)
Compatible, but proprietary Examples
– Windows 98– Pentium– Upgrades
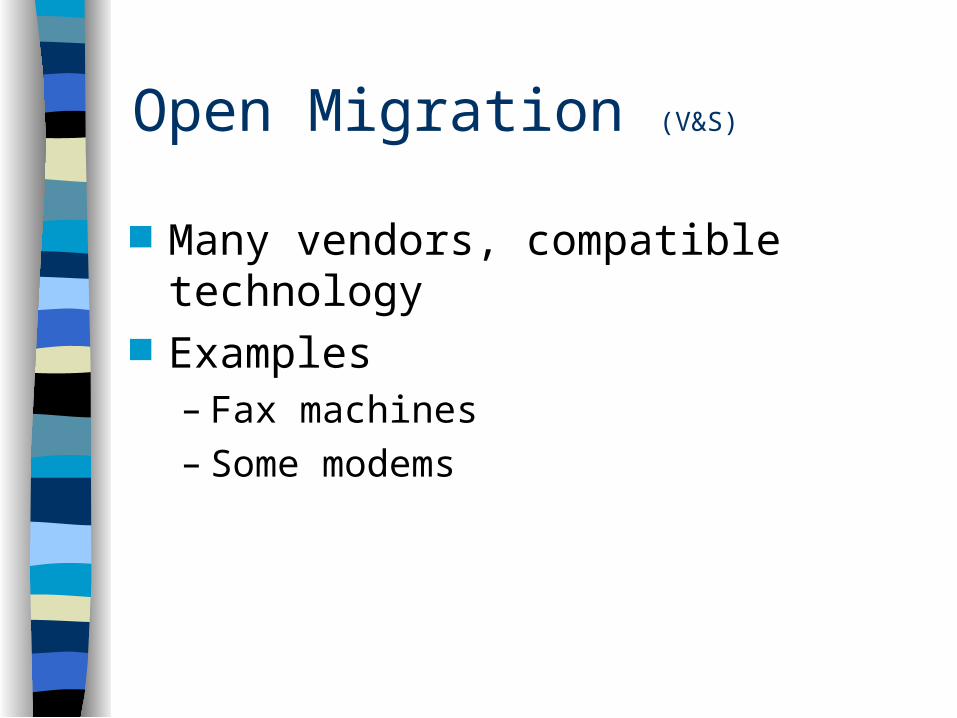
Open Migration (V&S)
Many vendors, compatible technology Examples
– Fax machines– Some modems

Discontinuity (V&S)
Many vendors, new technology Examples
– CD audio– 3 1/2” disks
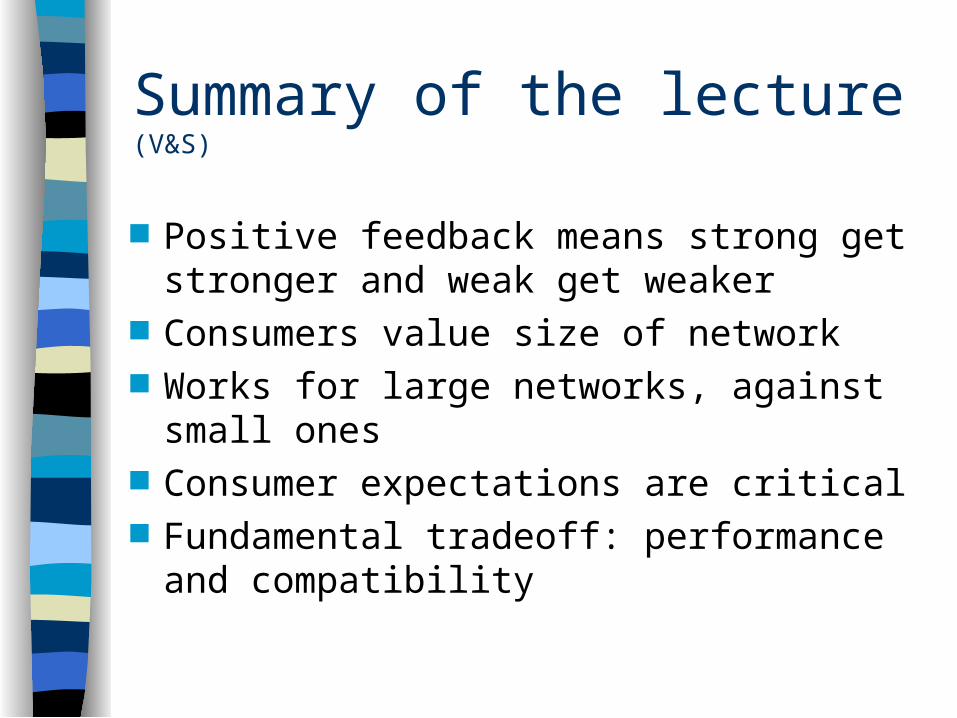
Summary of the lecture (V&S)
Positive feedback means strong get stronger and weak get weaker
Consumers value size of network Works for large networks, against small
ones Consumer expectations are critical Fundamental tradeoff: performance and
compatibility
Summary on introducing services and products into markets (V&S)
Fundamental tradeoff: openness and control
Generic strategies– Performance play– Controlled Migration– Open Migration– Discontinuity
Look at lessons of history


![Quel impact pour les taxis si la loi supprimait toute différence … · 2020-03-05 · Marc Deschamps March 2020. ... ticulier mis en évidence par Varian et Shapiro [1999] il y](https://static.fdocuments.us/doc/165x107/5f7b0664a325f81af8187ab1/quel-impact-pour-les-taxis-si-la-loi-supprimait-toute-diirence-2020-03-05.jpg)