1 Photogrammetry of TT7. 2 Front view Distribution of all targets All the plots are in the magnet...
34
1 Photogrammetry of TT7
-
Upload
myles-mckenzie -
Category
Documents
-
view
214 -
download
0
Transcript of 1 Photogrammetry of TT7. 2 Front view Distribution of all targets All the plots are in the magnet...

1
Photogrammetry of TT7

2
Front view Distribution of all targets
All the plots are in the magnet reference system
3
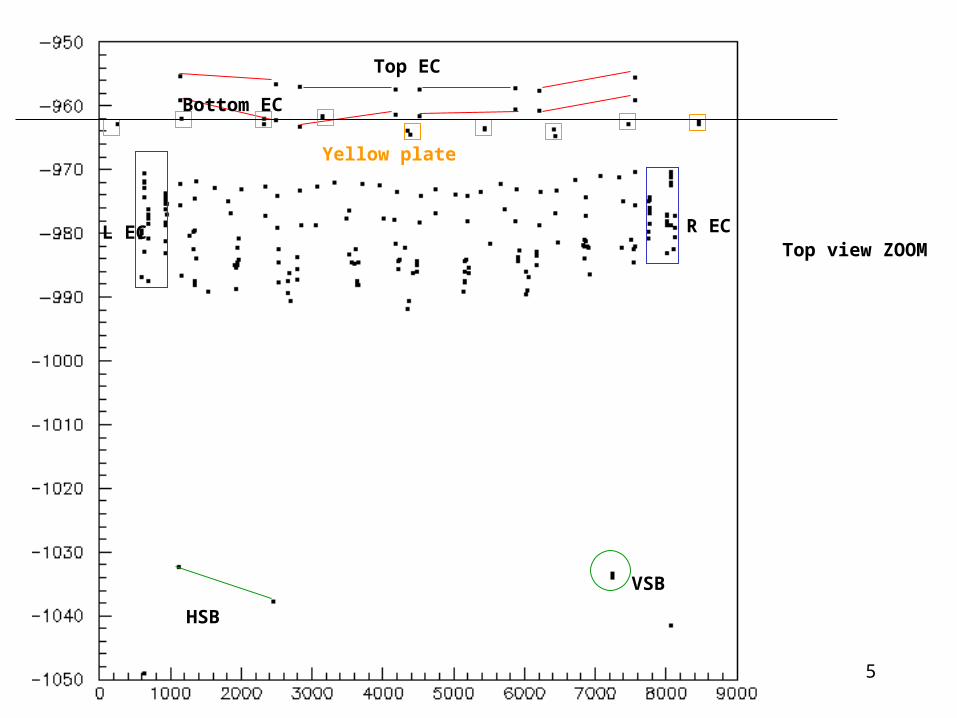
Top view Distribution of all targets
Magnet
TT7, zoom in nextpage

4
Yellow plate
2.6 mmYellow plate
Endcaps Surface
Endcaps holes
Endcaps holes
Endcaps Surface
2 mm
Planarity of yellow plate and top endcaps improved with respect to TT10
5
HSB
VSB
Top EC
Bottom EC
Yellow plate
L EC R ECTop view ZOOM

6
General side view
VSB
HSB
Bottom EC Top EC
Yellow plateRigth EC
Left EC
7
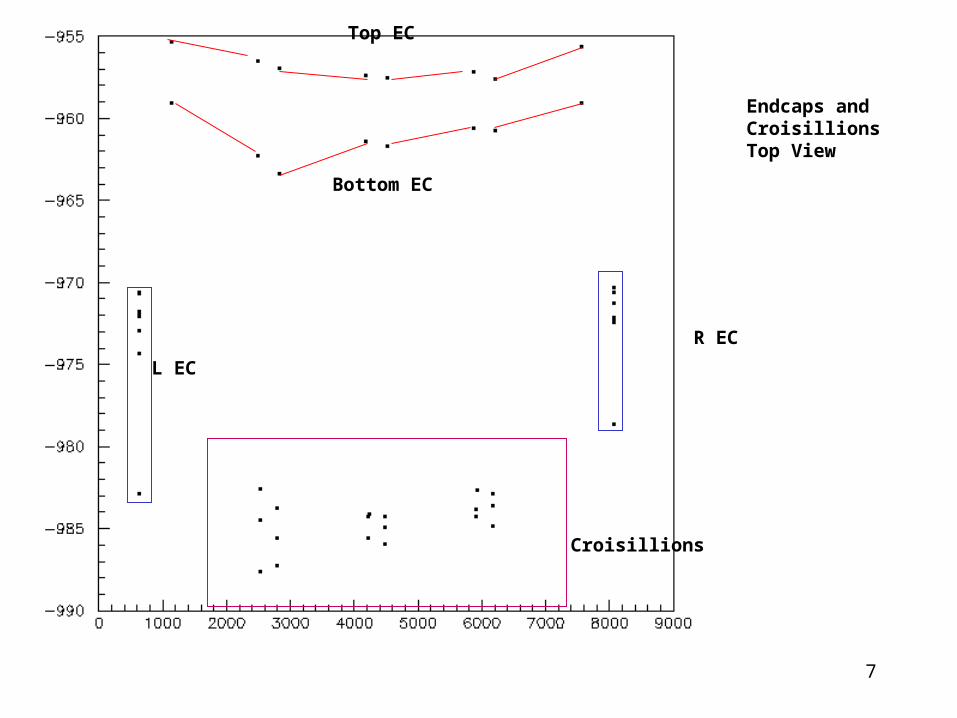
Endcaps andCroisillionsTop View
Croisillions
R EC
L EC
Top EC
Bottom EC
8
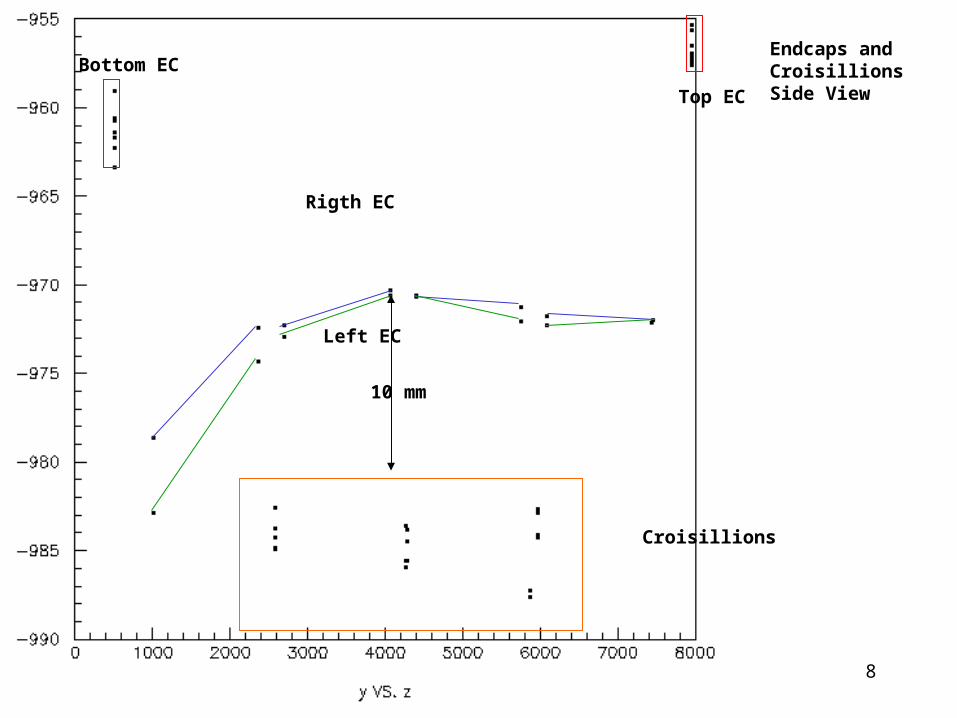
Endcaps andCroisillionsSide View
Bottom EC
Top EC
Croisillions
Rigth EC
Left EC
10 mm

9
1
2
3
4
5
6
7
8
9
10
11
12
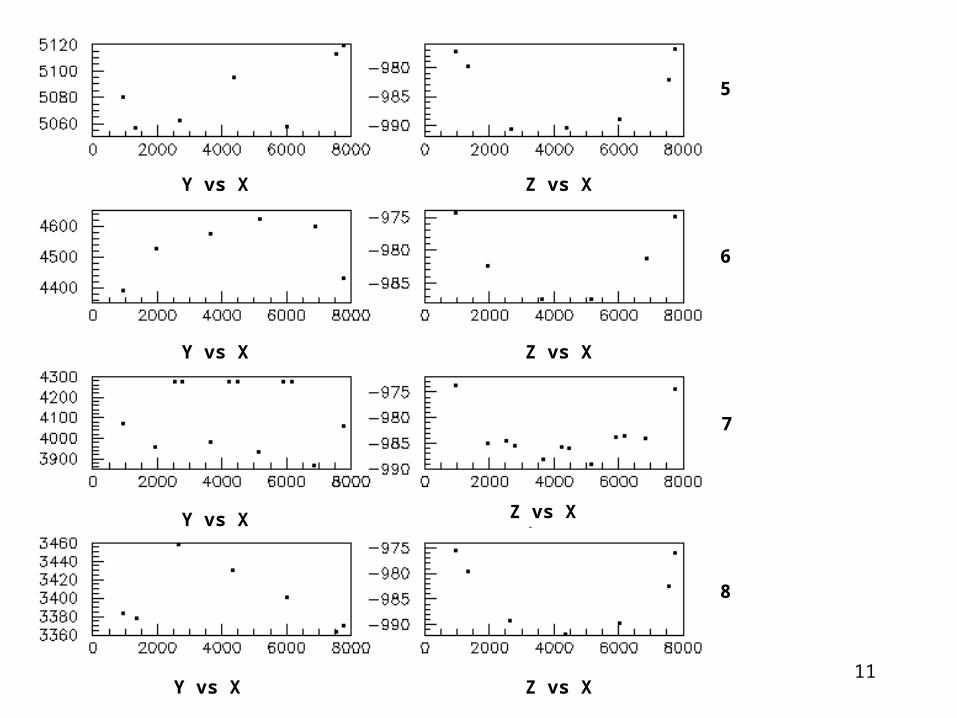
The points just at the borders of the horizontal end-caps (green boxes) have been included and corrected by 3 mm along the beam coordinate to take into account the thickness of the end-cap
Definition of the horizontal slices, front viewTop
Bottom
Y
Left RigthX
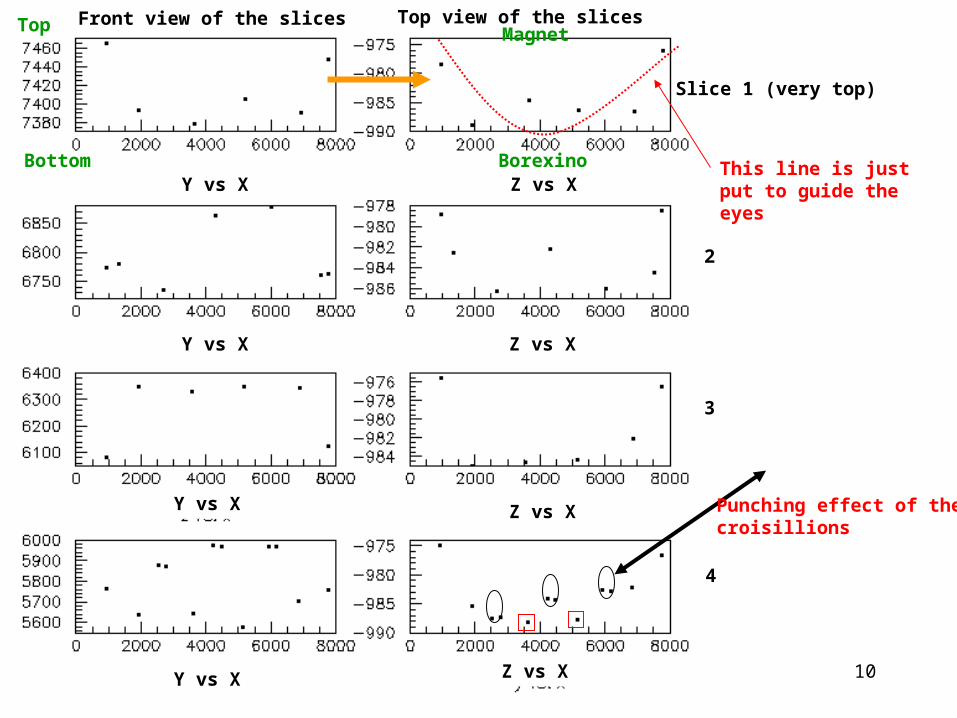
10
Slice 1 (very top)
2
3
4
Y vs X
Y vs X
Y vs X
Y vs X
Z vs X
Z vs X
Z vs X
Z vs X
Magnet
BorexinoBottom
Top
This line is just put to guide the eyes
Front view of the slices Top view of the slices
Punching effect of thecroisillions
11
5
6
7
8
Z vs X
Z vs X
Z vs X
Z vs XY vs X
Y vs X
Y vs X
Y vs X
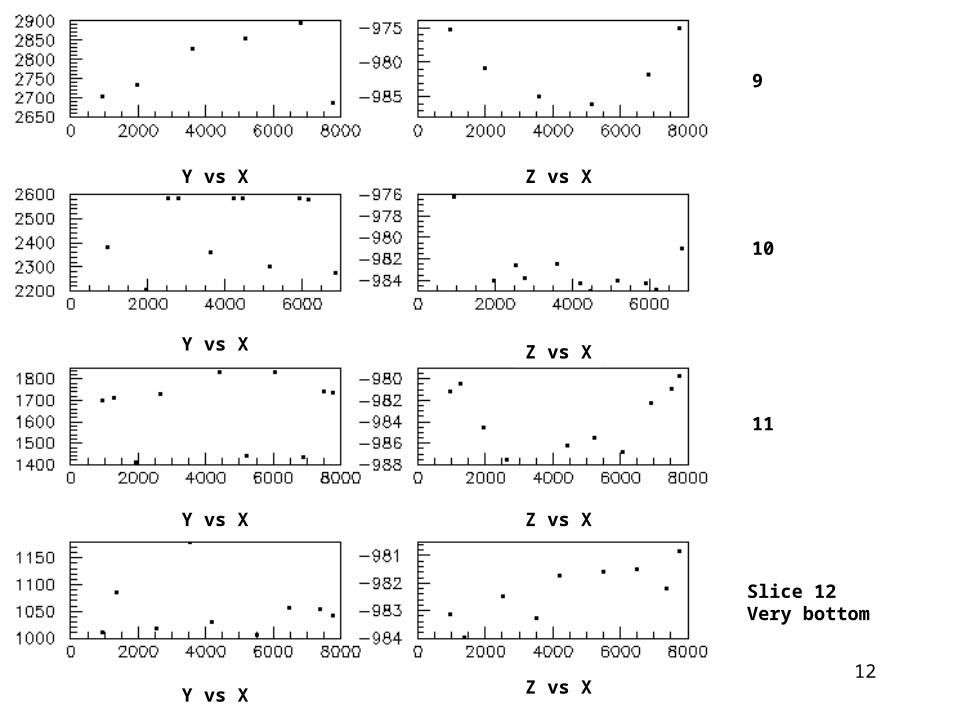
12
9
10
11
Slice 12Very bottom
Y vs X
Y vs X
Y vs X
Y vs X
Z vs X
Z vs X
Z vs X
Z vs X

13
Left Rigth
Bottom
TopMagnet
Borexino
X
YZ
Point of maximal deformation at the center, where there is the max of the bending both along the short and the long side. These points are corresponding to the red bands in the table of the previous slides
Bending along the long side
Bending along the short side
Typical deformation of one horizontal module
NB: the axis system is left handed, this comes from the fact that is just a redefinition of the one from the photogrammetry which is rigth-handed but with different axis naming
X(photo) -> XY(photo) -> ZZ(photo) -> Y

14
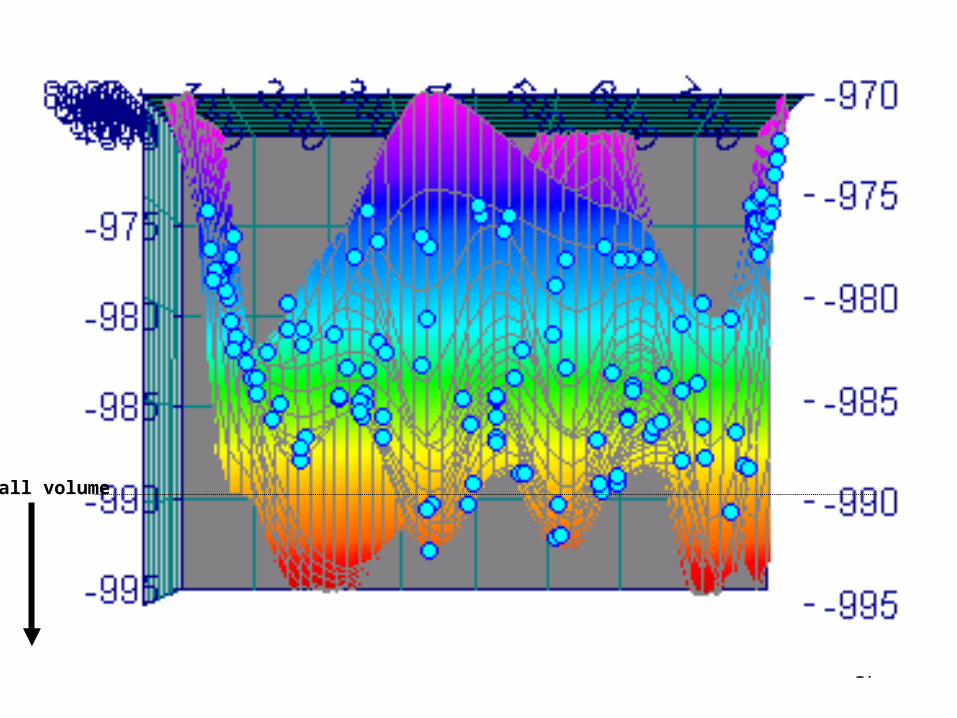
-975
-980
-985
-990
-995
Surface representation of the measured points, system corrected for the non verticality of the magnet
Max spread in the beamCoordinate of the measured points, 20.4 mm

15
Top Bottom
Rock
Gallery
Rock
Bottom
Top
Gallery Gallery Rock
Top
Bottom
Bottom Top
GalleryRock
1
1
2
2
3
3

16
Rock Gallery
Top
Bottom
3
Bottom
Top
GalleryRock3
Top
Bottom
Top
Bottom
TT7
TT10
TT7 has non planarity effects different than TT10
17
Wall volume

18
Conclusions on TT7:
1) Yellow plate flatness and alignment of top EC improved with respect to TT10
2) Non planarity effects at the level (or slightly worse than TT10) with a different shape
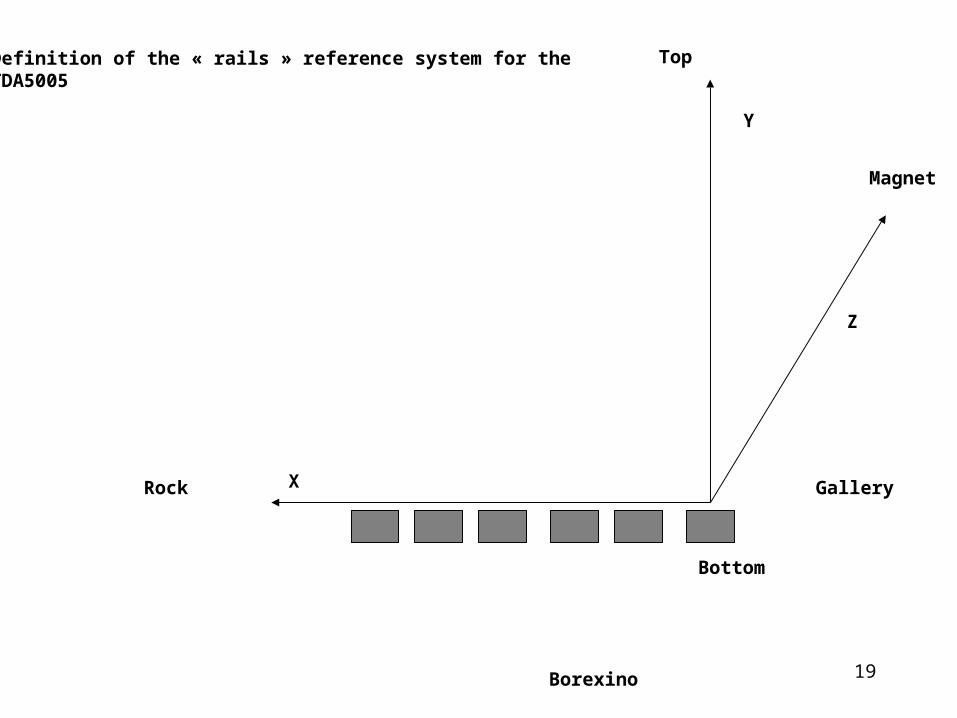
19
X
Y
Z
Magnet
Borexino
GalleryRock
Top
Bottom
Definition of the « rails » reference system for theTDA5005
20
Wires NO Wires
Turnbuckles Turnbuckles
TurnbucklesTurnbuckles
Yellow plateYellow plate
Yellow plateYellow plate
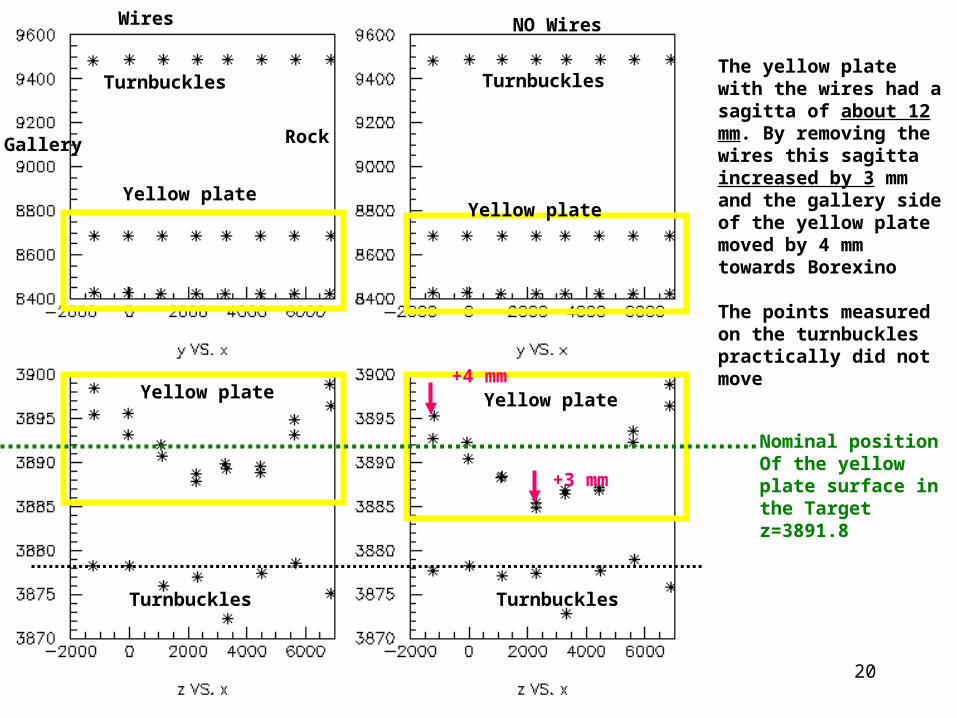
The yellow plate with the wires had a sagitta of about 12 mm. By removing the wires this sagitta increased by 3 mm and the gallery side of the yellow plate moved by 4 mm towards Borexino
The points measured on the turnbuckles practically did not move
+3 mm
+4 mm
Gallery Rock
Nominal positionOf the yellow plate surface in the Target z=3891.8
21
Wires Wires
z z
Turnbuckles
Turnbuckles (very small movements)
Turnbuckles
Turnbuckles
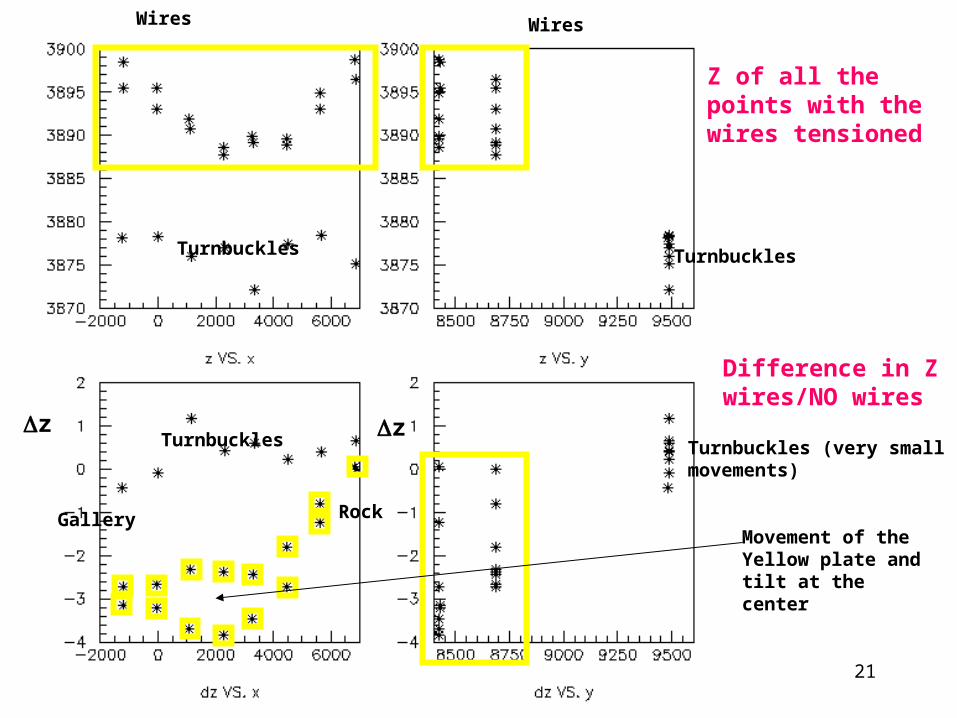
Gallery RockMovement of the Yellow plate and tilt at the center
Difference in Z wires/NO wires
Z of all the points with the wires tensioned

22
Wires NO WiresENDCAPS
Gallery Rock Gallery Rock
3 points (at the middle, left and right were adjusted on the bottom endcaps in order to have the same Z as the top endcaps.
The adjustment for the point at the gallery side was lost by accident (link not tigthened enough) due to an internal tension, this worsened after releasing the wires
The top EC had a sagitta of 6 mm which became 9 mm after releasing the wires
+3 mm
Gallery Rock Gallery Rock

23
Wires NO Wires
Gallery Rock Gallery Rock The horizontal modules endcaps have as usual a sagitta oriented in the direction of the magnet, when the tension of the wires is released the sagitta is sligthly reduced for the endcaps of the gallery side (the side where the top and bottom were not aligned) while they moved by 5 mm at the bottom and 2 mm at the top in the direction of Borexino
Bottom BottomTop Top
+4.5 mm
+2 mm

24
Gallery Rock
Difference in Z wires/NO wires
Z of all the points with the wires tensioned
+5 mm
+2 mm
Gallery
Rock
Rock
Gallery
Top
Top
Bottom
Bottom
Bottom Top
Bottom Top
25
Wires NO Wires
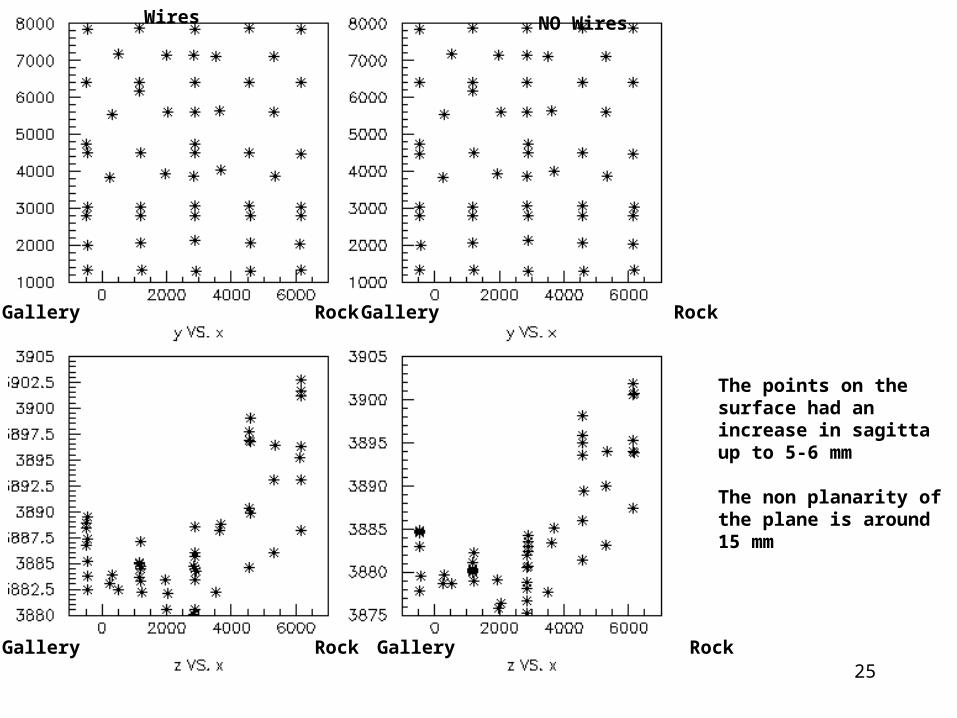
The points on the surface had an increase in sagitta up to 5-6 mm
The non planarity of the plane is around 15 mm
Gallery RockGallery Rock
Gallery Rock Gallery Rock

26
Difference in Z vs X wires/NO wires
Z vs X of all the points with the wires tensioned
The maximal increase of sagitta takes place at the middle of the detector the minimum at the rock side
Gallery Rock Gallery Rock
Gallery Rock
27
Wires NO Wires
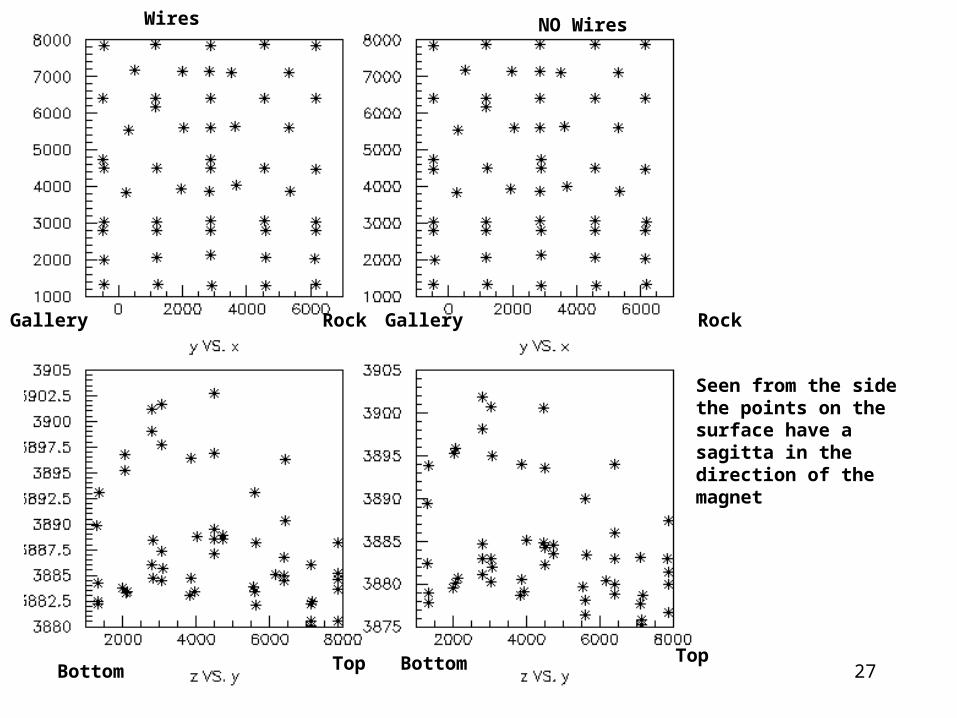
Seen from the side the points on the surface have a sagitta in the direction of the magnet
Bottom TopBottom Top
Gallery Rock Gallery Rock

28
Wires Wires
Difference in Z vs X and Y wires/NO wires
The maximal increase of sagitta takes place in correspondence to the second horizontal module from the top
Bottom Top
Bottom Top
Gallery Rock
Gallery Rock
Z vs Y of all the points with the wires tensioned

29
Top
Bottom
Rock Gallery
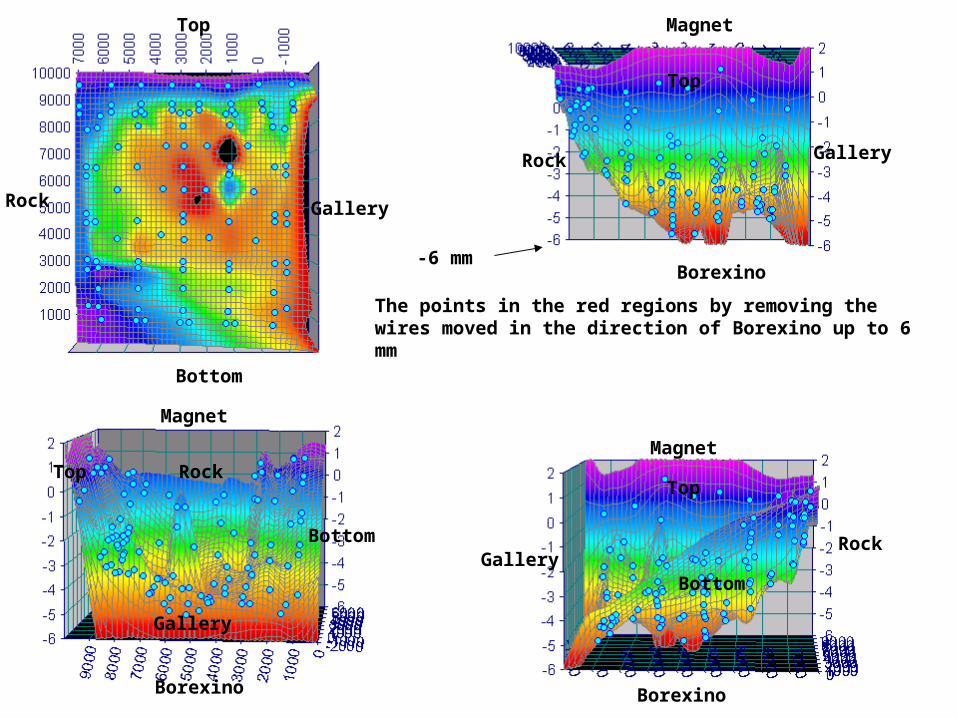
The points in the red regions by removing the wires moved in the direction of Borexino by 5-6 mm, the points in the blue regions practically did not move
Endcaps
Turnbukles
Yellow plate
Difference in Z wires/nowires
3D ANALYSIS OF THE DIFFERENCES WIRES/NO WIRES
30
Top
Bottom
Rock Gallery
Top
Top Rock
Gallery
Rock Gallery
Borexino
Magnet
Top
Gallery
Magnet
Borexino
Bottom
Magnet
Borexino
Rock
Bottom
The points in the red regions by removing the wires moved in the direction of Borexino up to 6 mm
-6 mm

31
Pillars
Top EC
Bottom EC after alignment and clamping
Yellow plate surface
Side EC
Side EC
Points on the surface
Wires at 0 tension,Base clamped for verticality
10 mm
RockGallery

32
Pillars (bottom)Pillars top
Bottom ECTOP EC
Lateral EC
Yellow plate
Surface points(12 per module)
Wires at 0 tension,Base clamped for verticalitySide view
Bottom TOP
33
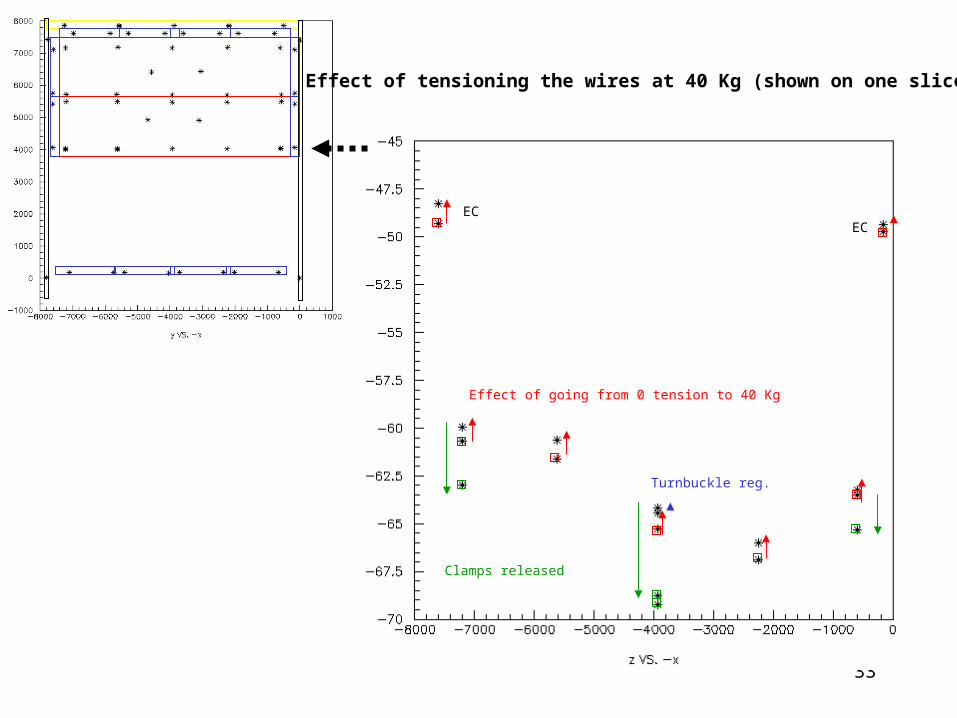
ECEC
Turnbuckle reg.
Effect of going from 0 tension to 40 Kg
Clamps released
Effect of tensioning the wires at 40 Kg (shown on one slice)

34
Conclusions TT12 wires/nowires
1) A little effect is seen on the yellow plate deformation due to the wires (already with the wires tensioned the sagitta was 12 mm and it increased by 3 mm by releasing the wires)
2) We aligned the top and bottom endcaps in 3 points at the same Z but the point at the rigth moved by 8 mm due to some internal forces of the plane which likes to go in a skew position. This effect further increased when releasing the wires
3) On the surface points the effect of removing the wires increased the bump by about 6 mm on the contrary of what we observed on the mounting arch !