The Pesticide Label Montana Pesticide Education & Safety Program.
date post
20-Dec-2015Category
view
215download
1
1
Occupational Pesticide Incident Project
Pesticide Program Dialogue Committee
June 2006

2
OUTLINE
NEED
PLANS
STAKEHOLDER INPUT

3
How many occupational pesticide incidents are there each year in the United States?
A. 1300
B. 1500 – 6000
C. 10,000 – 40,000
D. 20,000 – 40,000
E. 300,000
F. All of the Above
G. None of the Above

4
How many occupational pesticide incidents are there each year in the United States?
A. 1300
B. 1500 – 6000
C. 10,000 – 40,000
D. 20,000 – 40,000
E. 300,000
F. All of the Above
G. None of the Above
A. Poison Control Center (handlers and agricultural workers)
B. SENSOR, extrapolated to the US: (handlers and agricultural workers)
C. Agricultural worker poisonings based on an EPA estimate in 1992 WPS RIA
D. Council of State and Territorial Epidemiologists, (quoting an uncited EPA reference
E. NEETF’s National Pesticide Practice Skills Guidelines for Medical and Nursing Practice, unattributed reference to EPA’s estimate of 300,000 acute poisonings (agricultural workers)

5
Why is there so much difference among these counts?
Multiple data sources - There is no comprehensive database or program that aggregates information for pesticide health incidents. Among the multiple databases that collect data there are a number of variables.
Contents Designed for different purpose, Lack of detail (Ex., exposure cause).
Definitions of occupational incident vary, for example: Perception and concern for exposure, Exposure with no symptoms, Exposure with health impacts, Pesticide related health impacts confirmed by a medical
practitioner or government employee, Confirmed health effect reported correctly to tracking
system.

6
Why is there so much difference among these counts? Calculation Differences:
Variability in who is included: Applicators, handlers, agricultural field workers.
No standard methodology for national extrapolation of estimates based on limited geographical data.
Sources were developed for a variety of uses, primarily as surveillance to observe trends in health concerns, not for arriving at point estimates for poisonings
Under-reporting: No universal, mandatory duty to test/report, Common symptoms may mask correct diagnosis, Difficulty in identifying and tracking chronic effects, Reluctance or impaired capacity to report, Incomplete tracking systems – geographical, Inadequate resources to operate & maintain costly data
collection, recording, confirmation and reporting systems.
7
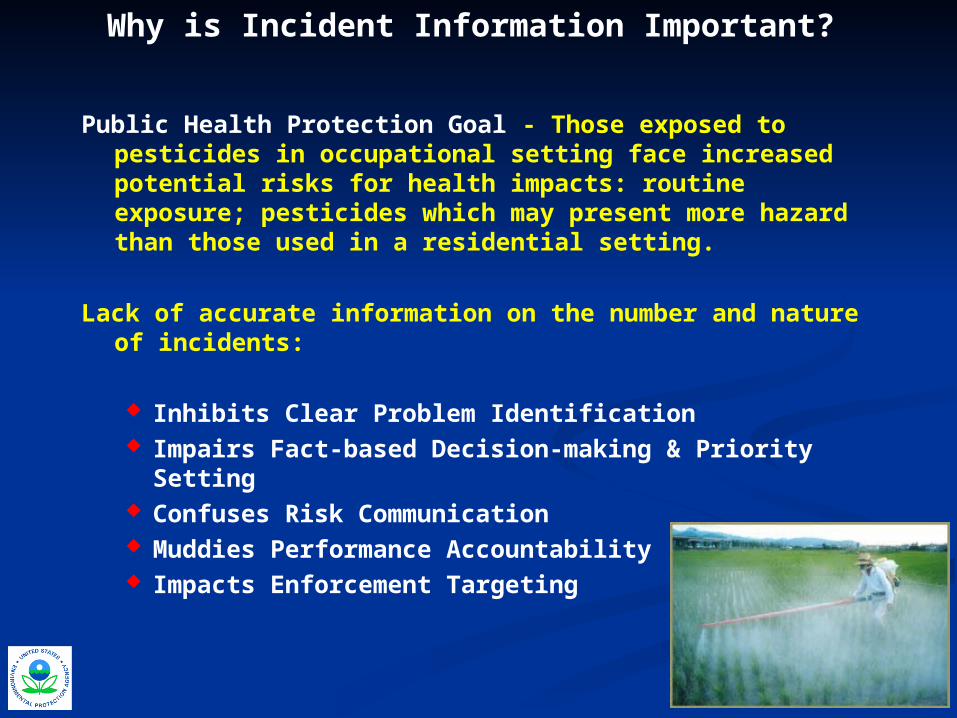
Why is Incident Information Important?
Public Health Protection Goal - Those exposed to pesticides in occupational setting face increased potential risks for health impacts: routine exposure; pesticides which may present more hazard than those used in a residential setting.
Lack of accurate information on the number and nature of incidents:
Inhibits Clear Problem Identification Impairs Fact-based Decision-making & Priority Setting Confuses Risk Communication Muddies Performance Accountability Impacts Enforcement Targeting

8
Why is Incident Information Important?
Primary Uses of Occupational Incident Information:
Programmatic Risk Reduction Risk assessments & risk management decisions Enhancing incident avoidance & response Establishing program & resource priorities ID’g strengths/weaknesses to develop new and modify
existing programs to better protect workers
Risk Communication – Nature, extent & severity of incidents. Decision makers – Congress, OMB, Federal managers Active Stakeholders and the general public
Performance Accountability
Enforcement

9
Occupational Pesticide Incident Project
Goals Make better use of incident data Improve meaningful and consistent communication
of occupational pesticide incident information Improve quality of data
Means Improve analysis and ease of use Integrate with Performance Accountability Systems Strengthen incident data sources Prepare a Report on Occupational Incidents

10
Activities to Date
Linked to Upgrade of Strategic Plan Accountability Measures & Targets.
Comparative Analysis of Strengths and Limitations of Occupational Incident Databases.
Calculation of National Potential Pesticide Risk Events
Worker Safety Strategic Goal: Through 2011, protect those occupationally exposed
to pesticides by improving or sustaining the extremely low rate of 3.5 or less incidents per 100,000 potential risk events. (Comparison of Potential Risk Events to poison Control Centers’ Toxic Exposure Surveillance System)
Sharpened appreciation of incident deficiencies.

11
Approximately how many people are at risk? How many potential risk events are there?
How many are at risk? 1.8 million agricultural workers
Occupational Users 1.1 million certified applicators 4 million Restricted Use Pesticides (RUP) applicators
under the supervision of certified applicators 2.5 million other occupational users (not using RUPs)
How many potential risk events are there? Using low-end estimates for the annual number of
exposures, Ex. 5 potential risk events per farm worker/year Ex. 4 applications/year/occupational user
Estimates approximately 39,850,000 potential risk events per year.

How are these people protected?
Incident Prevention: Training Hazard Communication Outreach Campaigns
Effective Response: Hotline Health Care Education
Sound Data to Drive Sound Decisions
Useful Communication
Reduce Risk by changingworker knowledge
& practices
Reduce Risk by changingpesticide risks, uses,
requirements
Incident Prevention:
Use Restrictions
Reduced Risk Pesticides
Re-entry Intervals
Worker Safety Standard
Personal Protective Equipment
PROTECTIVEWEB

Program
Need
Type of Information
Measurement
Target
Data Source
1. Programmatic
Risk Reduction
Incident Causes
Trends
SENSOR
Enforcement Actions
2. Risk Communication
Program Progress All
3. Performance Accountability
Strategic Outcomes
Occupational Incident Numbers
CDC/TESS
4. Enforcement Compliance Status
Reduced Violations
Enforcement Tracking
Need/Data Source Crosswalk

14
Qualities of an Ideal Incident Database
Data Quality Representative Credible Adequate detail and appropriate information
Functionality Ease of use Clearly understandable
Availability Reasonable cost Sustainable

15
Potential Data Sources - Health Incidents
I. Sentinel Event Notification System for Occupational Risk (SENSOR-Pesticides)
II. California DPR’s Pesticide Illness Surveillance Program (PISP)
III. Poison Control Centers - Toxic Exposure Surveillance System (PCC/TESS)
IV. FIFRA 6(a)2
V. National Pesticide Information Center (NPIC) hotline
VI. National Pesticide Medical Monitoring Program (NPMMP)
VII. State Workers’ Compensation reports
VIII. State Cholinesterase monitoring (WA and CA)
IX. National Hospital Ambulatory Medical Care Survey (NHAMCS) Emergency Room data base
X. Agricultural Health Study

16
Potential Data Sources - Enforcement
I. National Compliance Data Base [FIFRA/TSCA Tracking System}
II. State and EPA’s National Pesticide Field Database (NPFD)
III. California DPR’s Pesticide Illness Surveillance Program (PISP)
IV. States’ Compliance Action Tracking Systems (CATS)

17
Potential Data Sources - Supporting Data
Data are important in understanding the context of agricultural worker and pesticide issues: pesticide use patterns, migrant worker demographics.
NAWS – Department of Labor’s National Agricultural Workers Survey collects demographic information for agricultural field workers
BLS – Bureau of Labor Statistics collects information about wages, salaries, and numbers of employed workers.
Pesticide Usage Data – amount of pesticide used on crops; by state. Includes USDA/NASS, Doane, and California’s Pesticide Use Reporting data sets
Certified Applicator numbers – Applicators who are certified to use Restricted Use Products

18
Summary of Worker Health Incident Databases
All have different strengths and limitations:
Granularity Causality Severity
Geographic representativeness
Cost
Under-reporting
Variety of case definitions

19
Potential Improvements in Databases
PCC (Poison Control Centers) Promote Poison Control Centers toll free number (1-888-222-
1222) as the national hotline to report poisonings
FIFRA 6(a)2 reporting Update reporting requirements Make database more user-friendly Facilitate electronic reporting
SENSOR (CDC’s Sentinel Event Notification System for Occupational Risk – Pesticides)
Support expanded coverage to key agricultural states (NC…) & types of details requested.
NPFD (National Pesticide Field Database) Expand database fields to collect data necessary for measures
development Increase number of states reporting

20
Occupational Incident Report
Contents Compilation of incident data & trends, Demographics of the worker populations, Context of value and use of incident data, Narrative discussion: strengths/weaknesses of the data
and steps to address, Overview of enforcement, Analysis and interpretation.
Format Graphics heavy, Brief – 20 pages
Logistics Frequency of report – 3 to 5 years Paper and web availability

21
Issues & Questions
How should we define “Incident” for different purposes?
Relative value/use of data sources? Potential extrapolations from data. Essential caveats.
Other potential data sources?
Where to focus efforts on improving data sources?
Incident Data Report Contents/Coverage Format Logistics

22
Next Steps & Stakeholder Input
Seek input on Report approach, sources and logistics.
Begin using new Strategic Plan Targets in FY 2007 and modify/refine internal commitment process for supporting output activities and reporting procedures.
Seek opportunities for greater analysis and use of incident data in registration review.
Work with others to strength data sources.
Prepare initial draft report.
FY 2007- 2008 Issue initial Occupational Incident Report.