1 NAEP 2006 12 th Grade Economics Assessment. 2 ► First NAEP assessment of economics ► Content...
20
NAEP 2006 12 th Grade Economics Assessment
-
date post
19-Dec-2015 -
Category
Documents
-
view
214 -
download
1
Transcript of 1 NAEP 2006 12 th Grade Economics Assessment. 2 ► First NAEP assessment of economics ► Content...

1
NAEP 2006 12th Grade Economics Assessment

2
► First NAEP assessment of economics
► Content areas: market economy, national economy, and international economy
► Administered to a national sample of 11,500 twelfth-graders from 590 schools
National Assessment of Educational Progress 2006 Economics Assessment
3
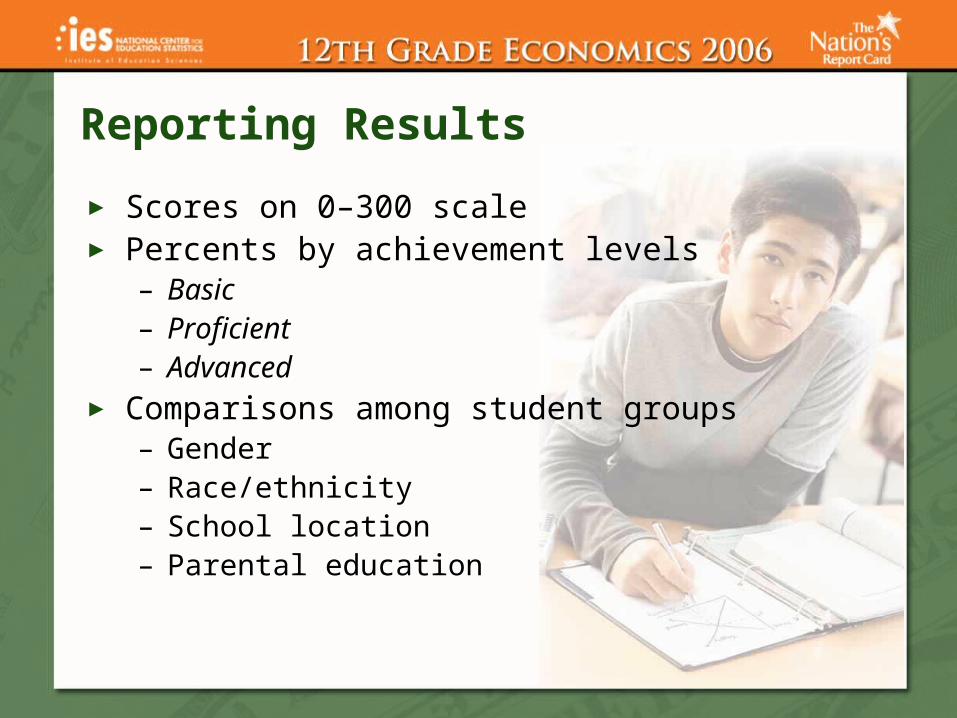
► Scores on 0–300 scale► Percents by achievement levels
– Basic– Proficient– Advanced
► Comparisons among student groups– Gender– Race/ethnicity– School location – Parental education
Reporting Results

4
► Average score in the Basic range
► Lowest-performing students below Basic
► Highest-performing students in the Proficient range
SOURCE: U.S. Department of Education, Institute of Education Sciences, National Center for Education Statistics, National Assessment of Educational Progress (NAEP), 2006 Economics Assessment.
Scale Score Results

5
► 79 percent at or above Basic► 42 percent at or above Proficient► 3 percent at Advanced
SOURCE: U.S. Department of Education, Institute of Education Sciences, National Center for Education Statistics, National Assessment of Educational Progress (NAEP), 2006 Economics Assessment.
Achievement-Level Results
6
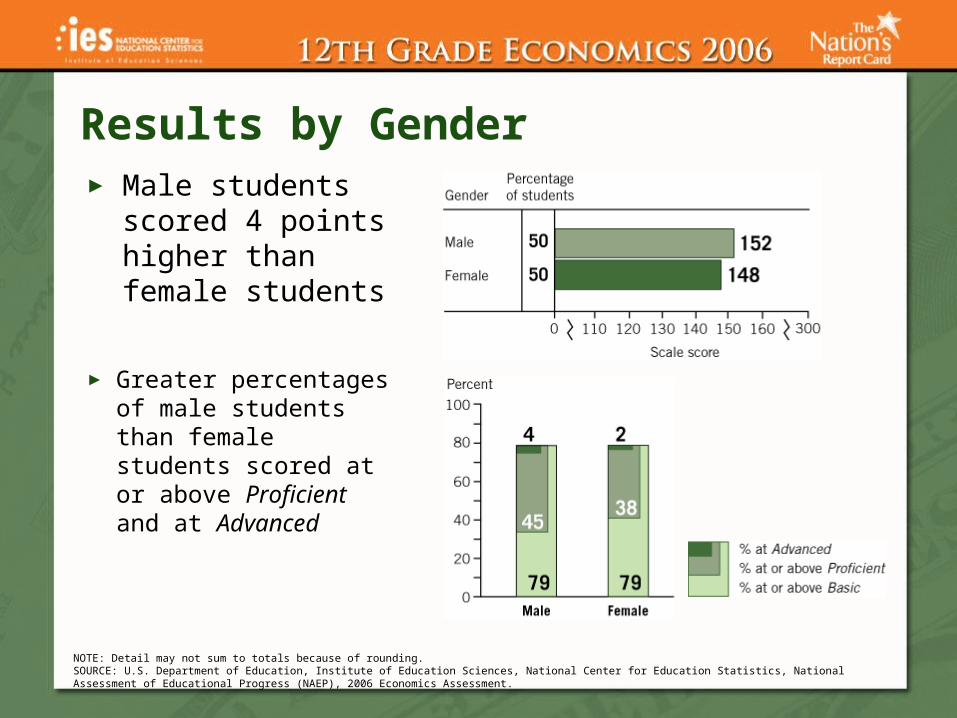
► Male students scored 4 points higher than female students
NOTE: Detail may not sum to totals because of rounding. SOURCE: U.S. Department of Education, Institute of Education Sciences, National Center for Education Statistics, National Assessment of Educational Progress (NAEP), 2006 Economics Assessment.
► Greater percentages of male students than female students scored at or above Proficient and at Advanced
Results by Gender
7
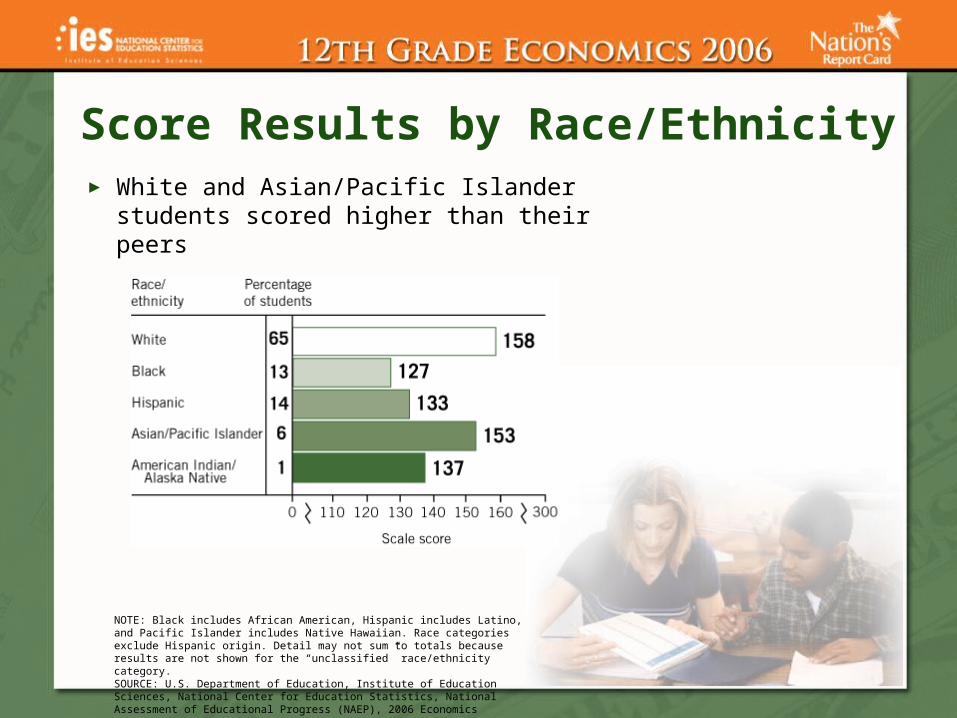
► White and Asian/Pacific Islander students scored higher than their peers
NOTE: Black includes African American, Hispanic includes Latino, and Pacific Islander includes Native Hawaiian. Race categories exclude Hispanic origin. Detail may not sum to totals because results are not shown for the “unclassified” race/ethnicity category.SOURCE: U.S. Department of Education, Institute of Education Sciences, National Center for Education Statistics, National Assessment of Educational Progress (NAEP), 2006 Economics Assessment.
Score Results by Race/Ethnicity
8
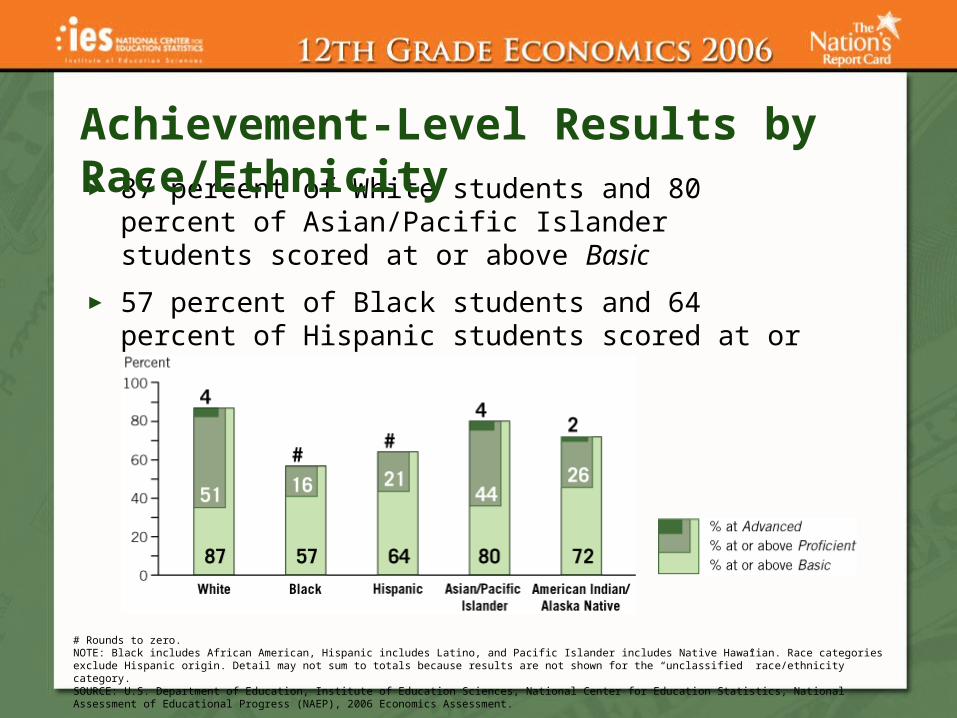
► 87 percent of White students and 80 percent of Asian/Pacific Islander students scored at or above Basic
► 57 percent of Black students and 64 percent of Hispanic students scored at or above Basic
# Rounds to zero.NOTE: Black includes African American, Hispanic includes Latino, and Pacific Islander includes Native Hawaiian. Race categories exclude Hispanic origin. Detail may not sum to totals because results are not shown for the “unclassified” race/ethnicity category.SOURCE: U.S. Department of Education, Institute of Education Sciences, National Center for Education Statistics, National Assessment of Educational Progress (NAEP), 2006 Economics Assessment.
Achievement-Level Results by Race/Ethnicity
9
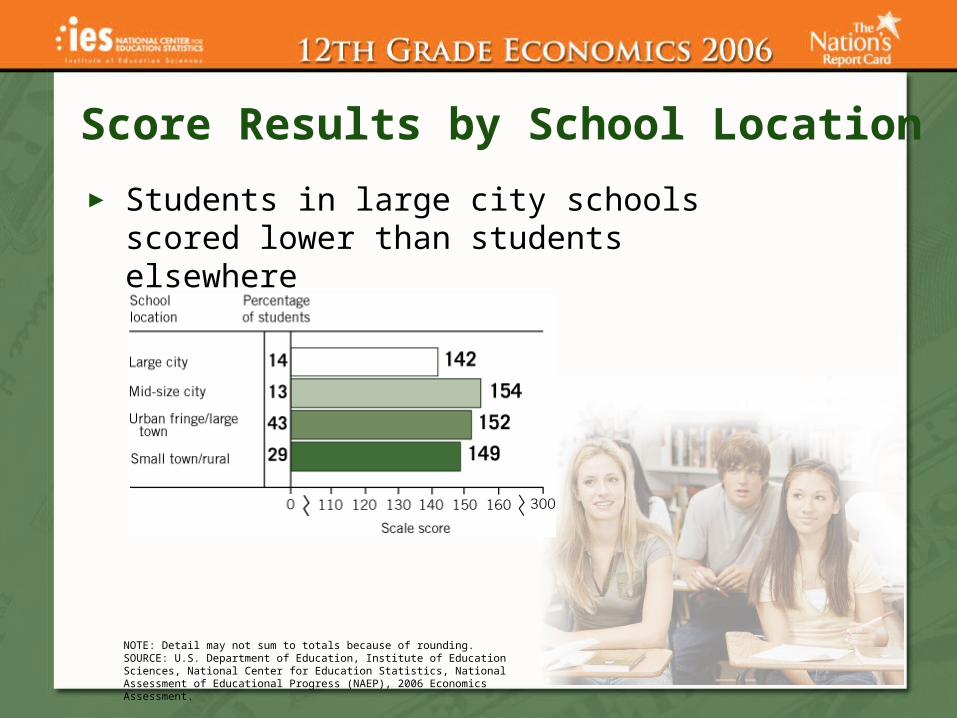
► Students in large city schools scored lower than students elsewhere
Score Results by School Location
NOTE: Detail may not sum to totals because of rounding.SOURCE: U.S. Department of Education, Institute of Education Sciences, National Center for Education Statistics, National Assessment of Educational Progress (NAEP), 2006 Economics Assessment.

10
► Students whose parents had higher levels of education scored higher
Score Results by Level of Parental Education
NOTE: Detail may not sum to totals because results are not shown for students who reported that they did not know the highest education level for either of their parents.SOURCE: U.S. Department of Education, Institute of Education Sciences, National Center for Education Statistics, National Assessment of Educational Progress (NAEP), 2006 Economics Assessment.

11
► Traditionally described as microeconomics
► Covers how individuals, businesses, and institutions make decisions about allocating resources in the marketplace
Market Economy

12
► 72 percent described a benefit and a risk of leaving a full-time job to further one’s education
► 46 percent interpreted a supply and demand graph to determine the effect of establishing a price control
► 36 percent used marginal analysis to determine how a business could maximize its profits
What Students Know About Market Economy

13
► 52 percent knew how banks use customers’ deposits in checking accounts
Sample Market Economy Question
14
► Traditionally described as macroeconomics
► Encompasses the sum of economic decisions made by individuals, businesses, and government
National Economy
15
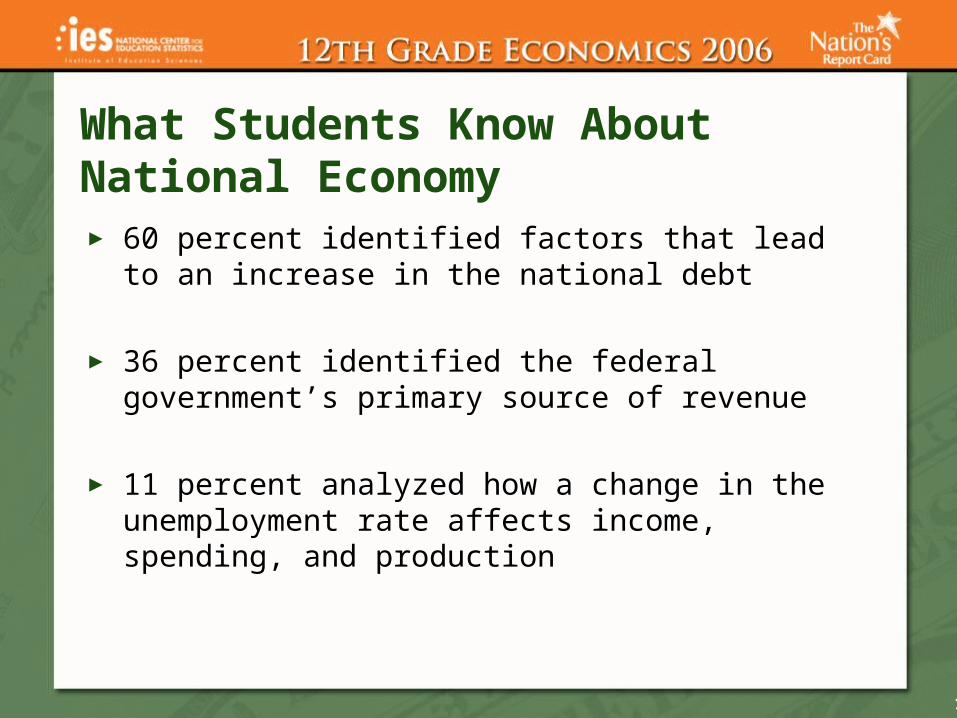
► 60 percent identified factors that lead to an increase in the national debt
► 36 percent identified the federal government’s primary source of revenue
► 11 percent analyzed how a change in the unemployment rate affects income, spending, and production
What Students Know About National Economy

16
► 33 percent gave correct answers, and 24 percent gave partially correct answers to this question about real interest rates
Sample National Economy Question
17
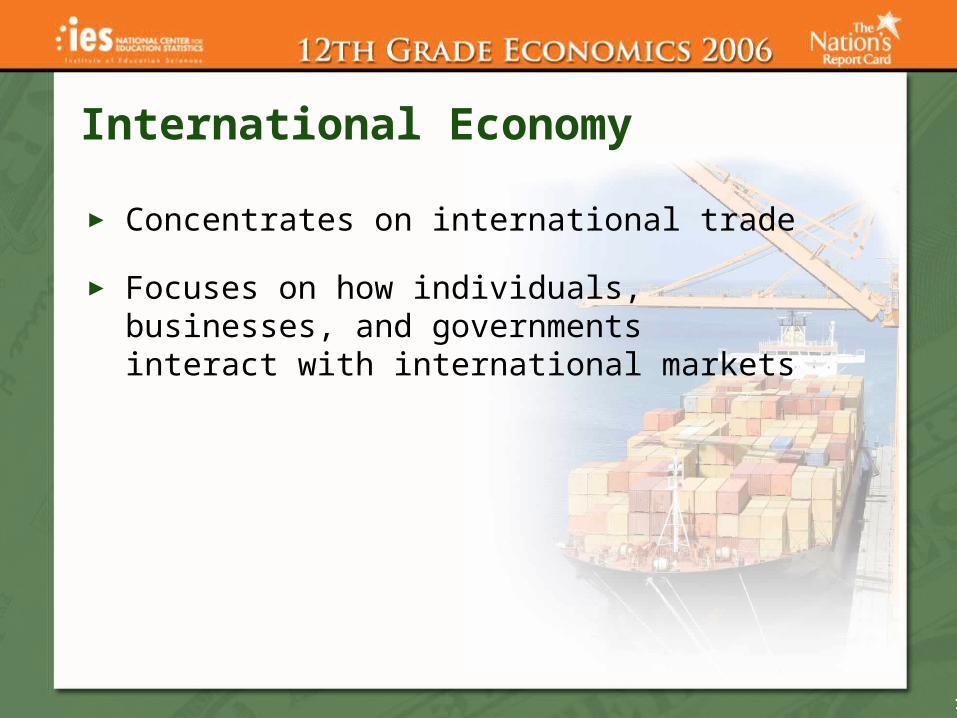
► Concentrates on international trade
► Focuses on how individuals, businesses, and governments interact with international markets
International Economy

18
► 63 percent determined the impact of a decrease in oil production on oil-importing countries
► 40 percent determined why industries can successfully lobby for tariff protection
► 32 percent identified how investment in education can impact economic growth
What Students Know About International Economy
19
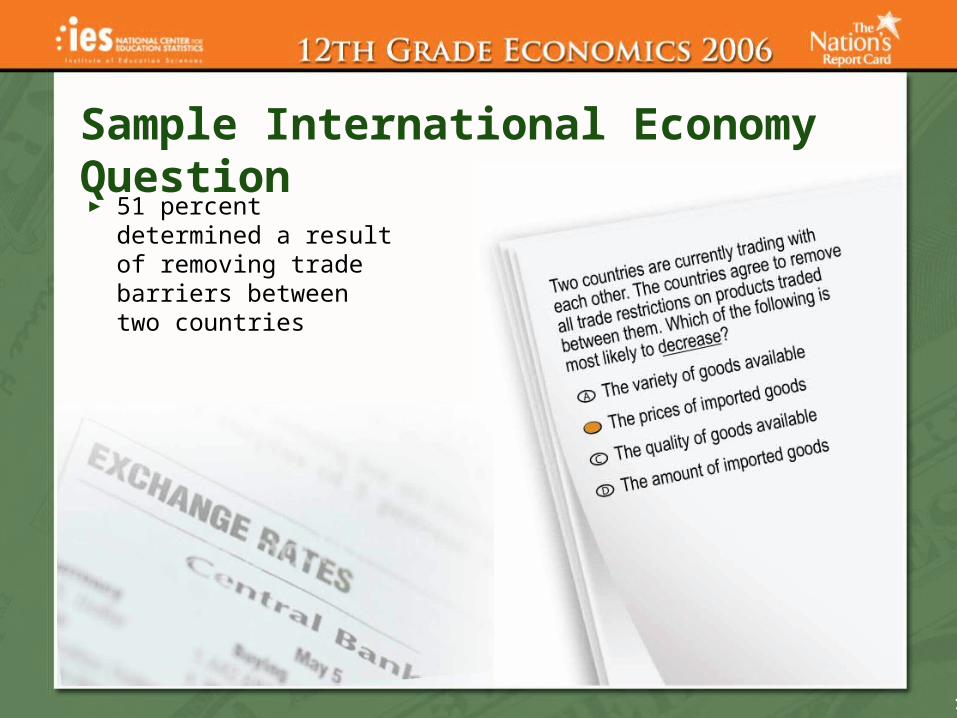
► 51 percent determined a result of removing trade barriers between two countries
Sample International Economy Question

20
More Information:http://nces.ed.gov/nationsreportcard/