1 N ational S urvey & F aculty S urvey of S tudent E ngagement (NSSE) & (FSSE) 2006 Wayne State...
37
1 N ational S urvey & F aculty S urvey of S tudent E ngagement (NSSE) & (FSSE) 2006 Wayne State University
-
Upload
barnaby-collins -
Category
Documents
-
view
215 -
download
0
Transcript of 1 N ational S urvey & F aculty S urvey of S tudent E ngagement (NSSE) & (FSSE) 2006 Wayne State...
1
National Survey & Faculty Survey of
Student Engagement
(NSSE) & (FSSE) 2006
Wayne State University
2
Presentation Overview
What is NSSE and its FSSE Component?
Why is student engagement important?
What do you know about college student engagement?
NSSE Results
Wayne State University comparative peer and trend data
Statistical Analysis
Questions and discussion
3
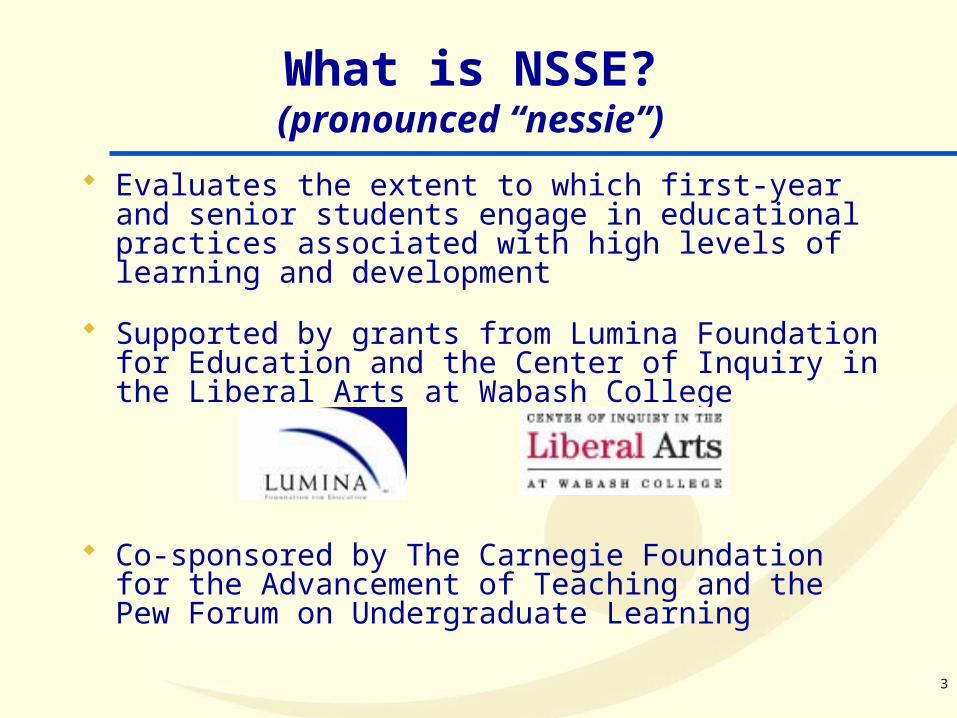
What is NSSE?(pronounced “nessie”)
Evaluates the extent to which first-year and senior students engage in educational practices associated with high levels of learning and development
Supported by grants from Lumina Foundation for Education and the Center of Inquiry in the Liberal Arts at Wabash College
Co-sponsored by The Carnegie Foundation for the Advancement of Teaching and the Pew Forum on Undergraduate Learning
4
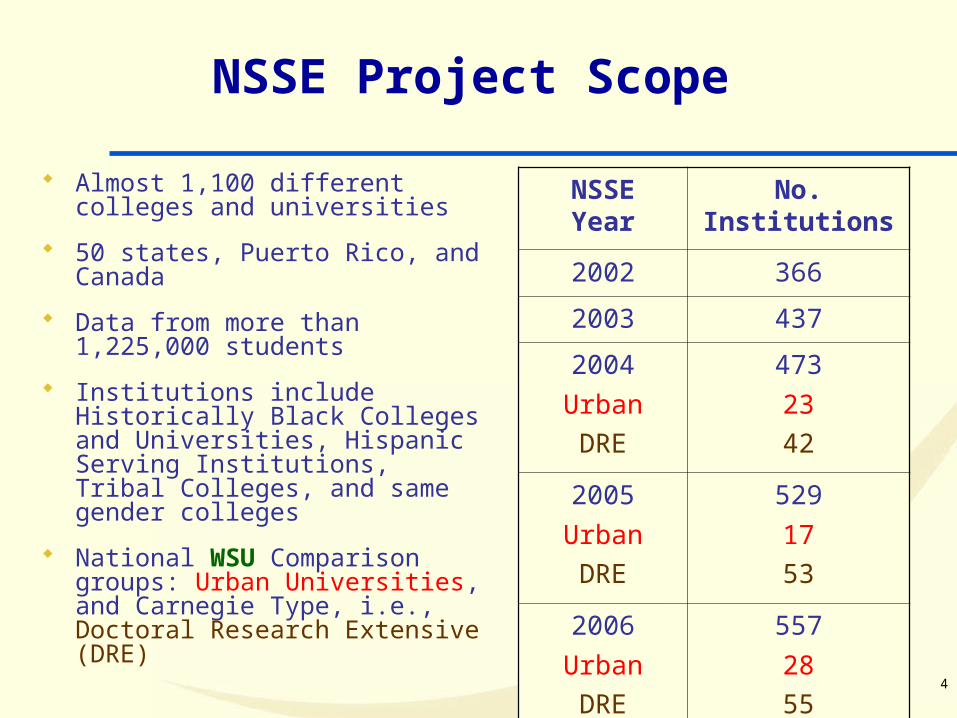
NSSE Project Scope
Almost 1,100 different colleges and universities
50 states, Puerto Rico, and Canada
Data from more than 1,225,000 students
Institutions include Historically Black Colleges and Universities, Hispanic Serving Institutions, Tribal Colleges, and same gender colleges
National WSU Comparison groups: Urban Universities, and Carnegie Type, i.e., Doctoral Research Extensive (DRE)
NSSEYear
No. Institutions
2002 366
2003 437
2004
Urban
DRE
473
23
42
2005
Urban
DRE
529
17
53
2006
Urban
DRE
557
28
55
5
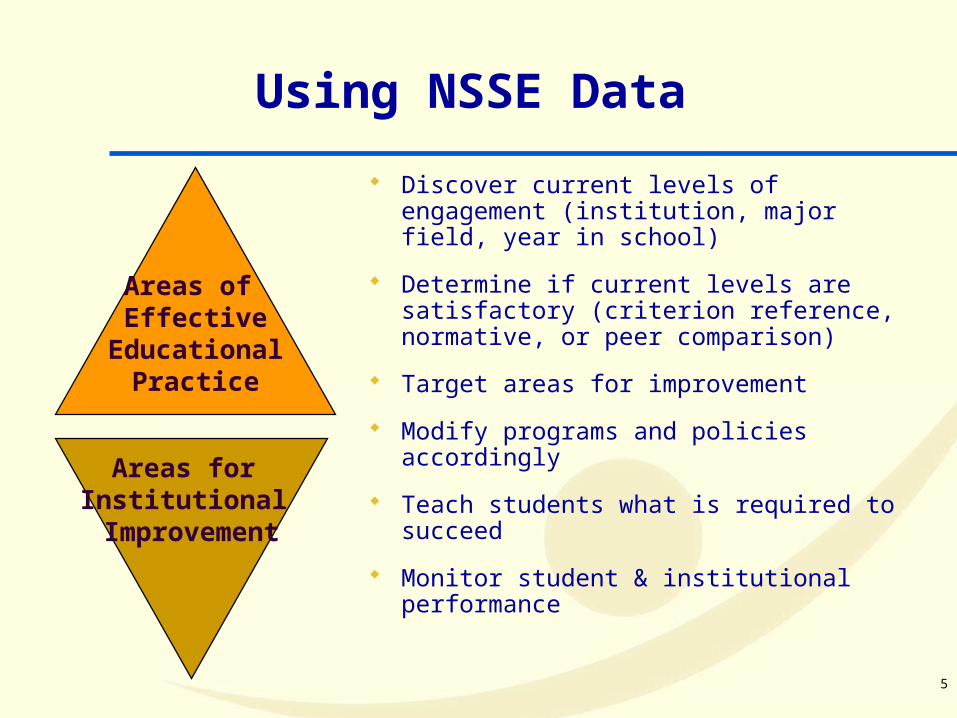
Using NSSE Data
Discover current levels of engagement (institution, major field, year in school)
Determine if current levels are satisfactory (criterion reference, normative, or peer comparison)
Target areas for improvement
Modify programs and policies accordingly
Teach students what is required to succeed
Monitor student & institutional performance
Areas of Effective
EducationalPractice
Areas for Institutional Improvement
6
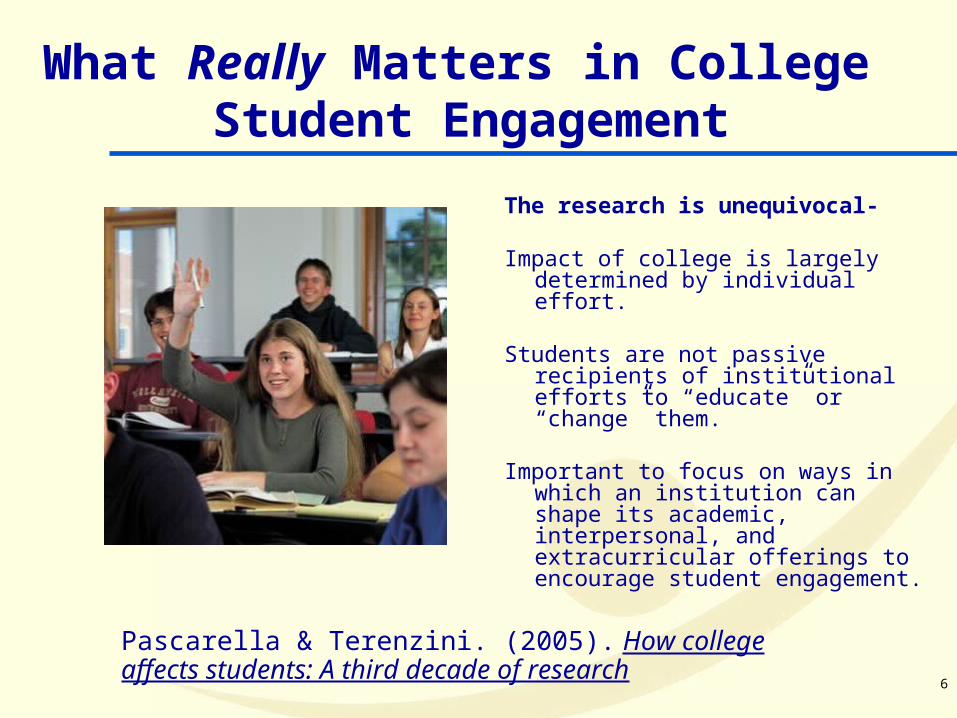
What Really Matters in College Student Engagement
The research is unequivocal-
Impact of college is largely determined by individual effort.
Students are not passive recipients of institutional efforts to “educate” or “change” them.
Important to focus on ways in which an institution can shape its academic, interpersonal, and extracurricular offerings to encourage student engagement.
Pascarella & Terenzini. (2005). How college affects students: A third decade of research
7
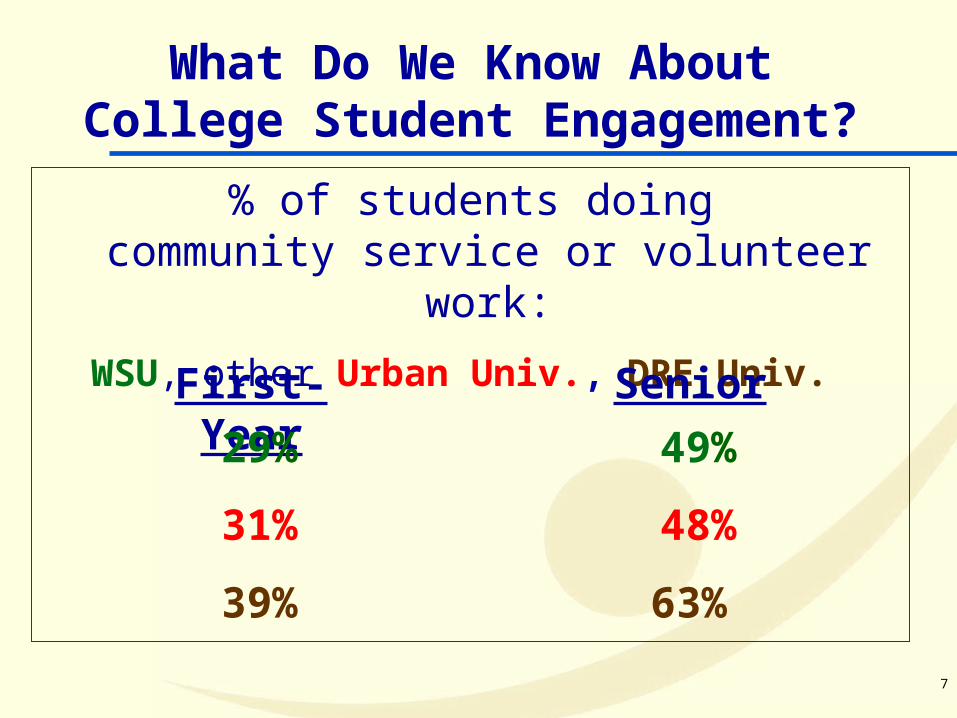
What Do We Know AboutCollege Student Engagement?
% of students doingcommunity service or volunteer work:
WSU, other Urban Univ., DRE Univ.
First-Year
29%
31%
39%
Senior
49%
48%
63%
8
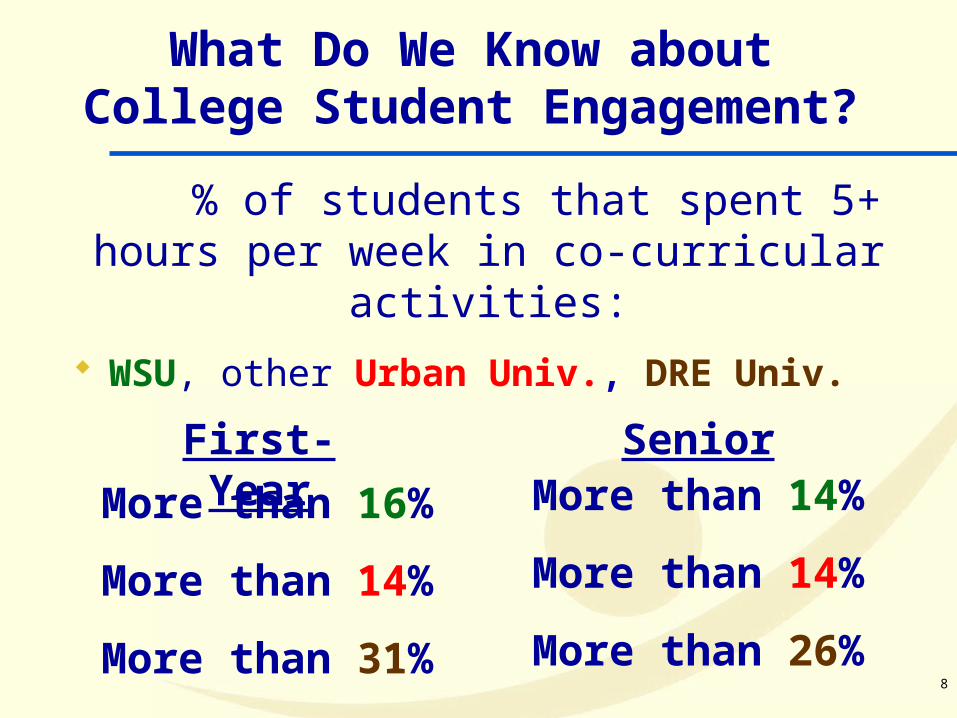
What Do We Know aboutCollege Student Engagement?
% of students that spent 5+ hours per week in co-curricular
activities:
WSU, other Urban Univ., DRE Univ.
First-Year
More than 16%
More than 14%
More than 31%
SeniorMore than 14%
More than 14%
More than 26%

9
Faculty Survey of Student Engagement (FSSE) 2006
To date more than 75,000 faculty respondents from 382 four-year institutions have participated
Faculty perceptions of how often their students engage in different activities
The importance faculty place on various areas of learning and development
The nature and frequency of interactions faculty have with students
How faculty members organize class time. Results intended as catalyst for discussions
about quality of students' educational experience
FSSE parallels NSSE's survey of undergraduate students and focuses on:
10
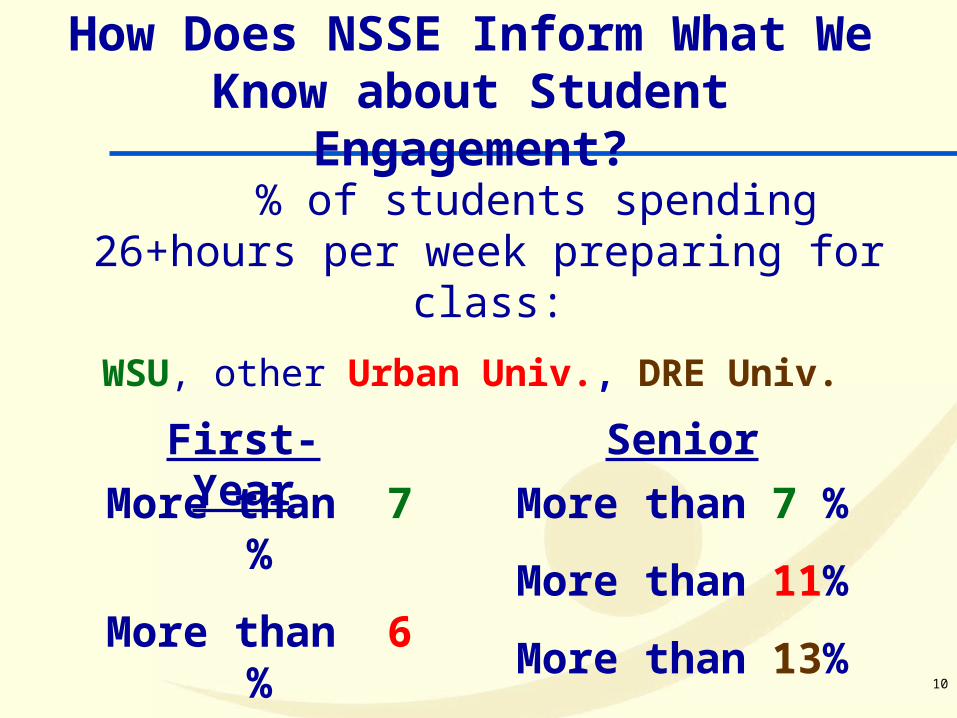
How Does NSSE Inform What We Know about Student
Engagement?% of students spending 26+hours per week preparing for class:
WSU, other Urban Univ., DRE Univ.
First-Year Senior
More than 7 %
More than 6 %
More than 11 %
More than 7 %
More than 11%
More than 13%
11
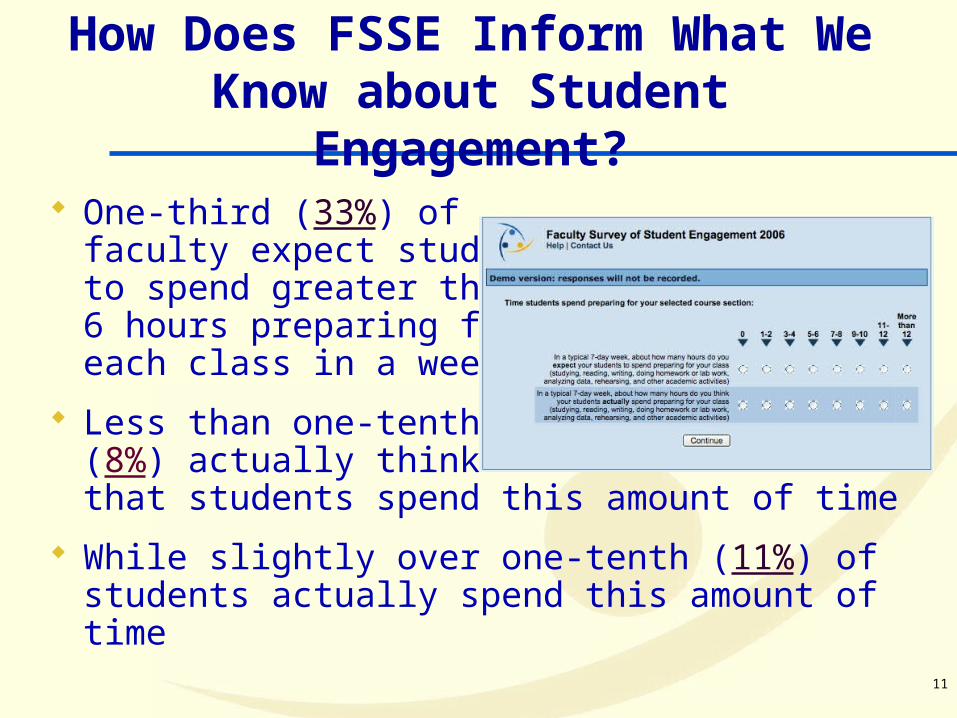
How Does FSSE Inform What We Know about Student
Engagement? One-third (33%) of
faculty expect students to spend greater than 6 hours preparing for each class in a week
Less than one-tenth (8%) actually think that students spend this amount of time
While slightly over one-tenth (11%) of students actually spend this amount of time
12
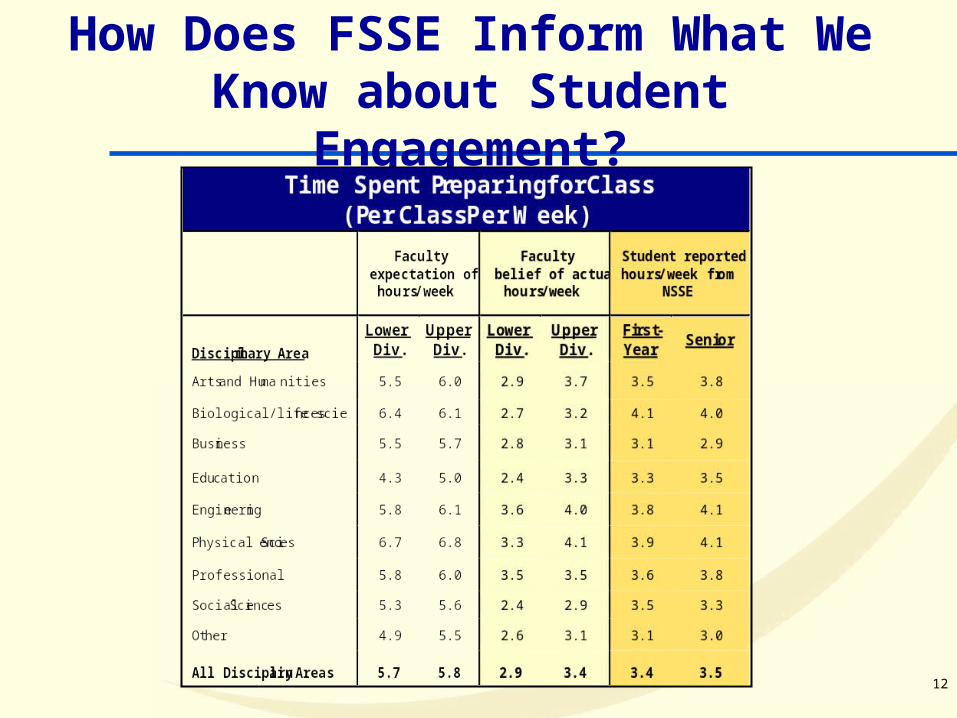
How Does FSSE Inform What We Know about Student
Engagement?
13
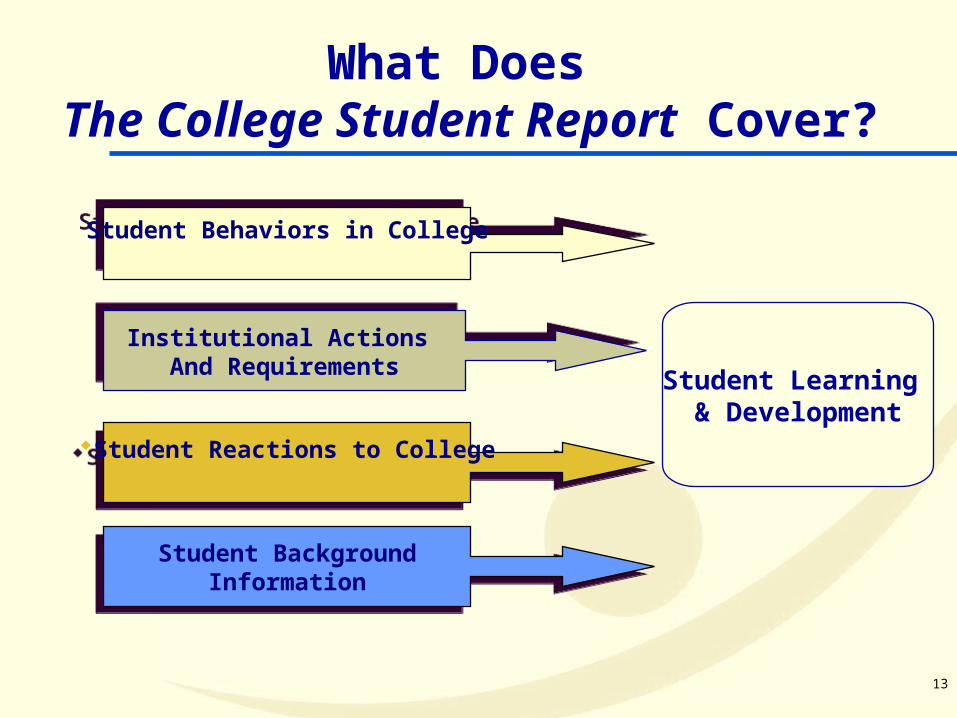
What Does The College Student Report
Cover?Student Behaviors in CollegeStudent Behaviors in College
Institutional Actions And RequirementsInstitutional Actions And Requirements
Student Reactions to CollegeStudent Reactions to College
Student BackgroundInformation
Student BackgroundInformation
Student Learning & Development
14
NSSE 2006 Results
Wayne State University
15
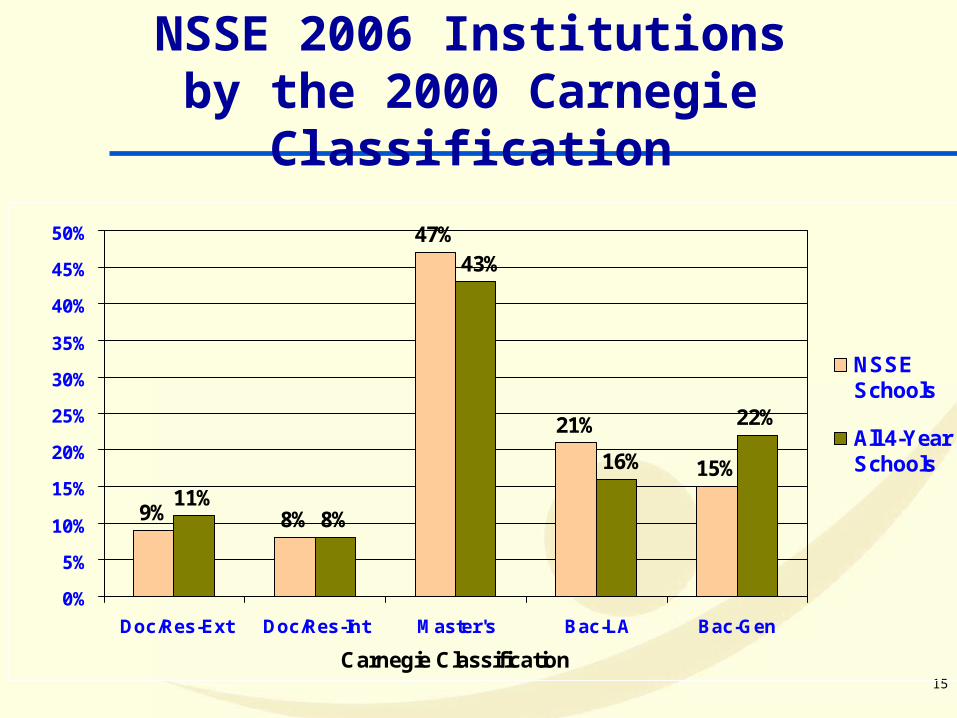
NSSE 2006 Institutionsby the 2000 Carnegie
Classification
9% 8%
47%
21%
15%11%
8%
22%
16%
43%
0%
5%
10%
15%
20%
25%
30%
35%
40%
45%
50%
Doc/Res-Ext Doc/Res-Int Master's Bac-LA Bac-Gen
Carnegie Classification
NSSESchools
All 4-YearSchools

16
WSU, Urban, DRE, NSSE 2004Race and Ethnicity – 1st Yr.
0
10
20
30
40
50
60
70
80
AfricanAmerican,
Black
AmericanIndian
AsianAmerican,
PacificIslander
White,Caucasian
Latino
WSUUrban UniversitiesDoc. Res. Ext.NSSE Repondents
Percentage of Respondents
17
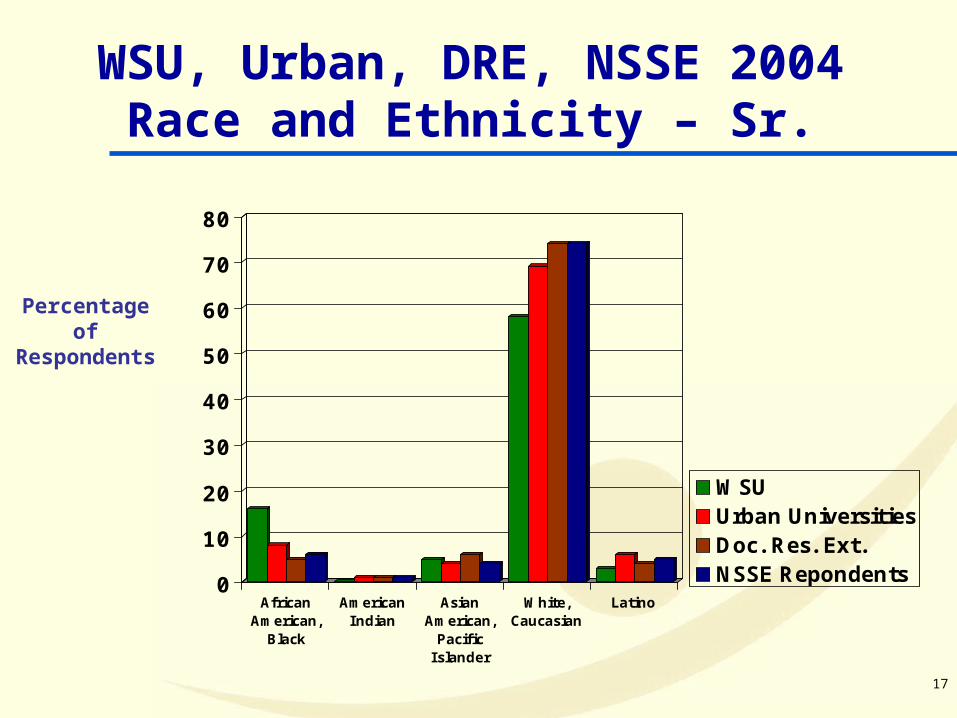
WSU, Urban, DRE, NSSE 2004Race and Ethnicity – Sr.
0
10
20
30
40
50
60
70
80
AfricanAmerican,
Black
AmericanIndian
AsianAmerican,
PacificIslander
White,Caucasian
Latino
WSUUrban UniversitiesDoc. Res. Ext.NSSE Repondents
Percentage of Respondents

18
NSSE 2006 Response Rates
WSU’s = 26%
NSSE overall = 35%
Urban Universities = 27%
DRE Universities = 31%
Response rates ranged from 10% to 81%
19
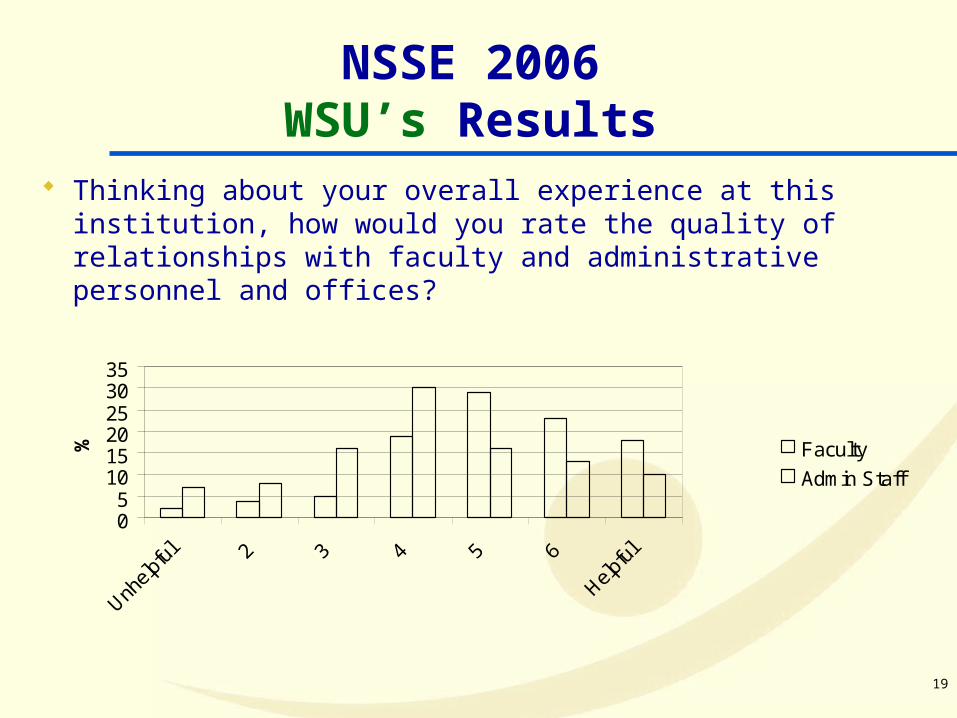
NSSE 2006WSU’s Results
Thinking about your overall experience at this institution, how would you rate the quality of relationships with faculty and administrative personnel and offices?
05
101520253035
Unhelp
ful 2 3 4 5 6
Helpfu
l
% Faculty
Admin Staff
20
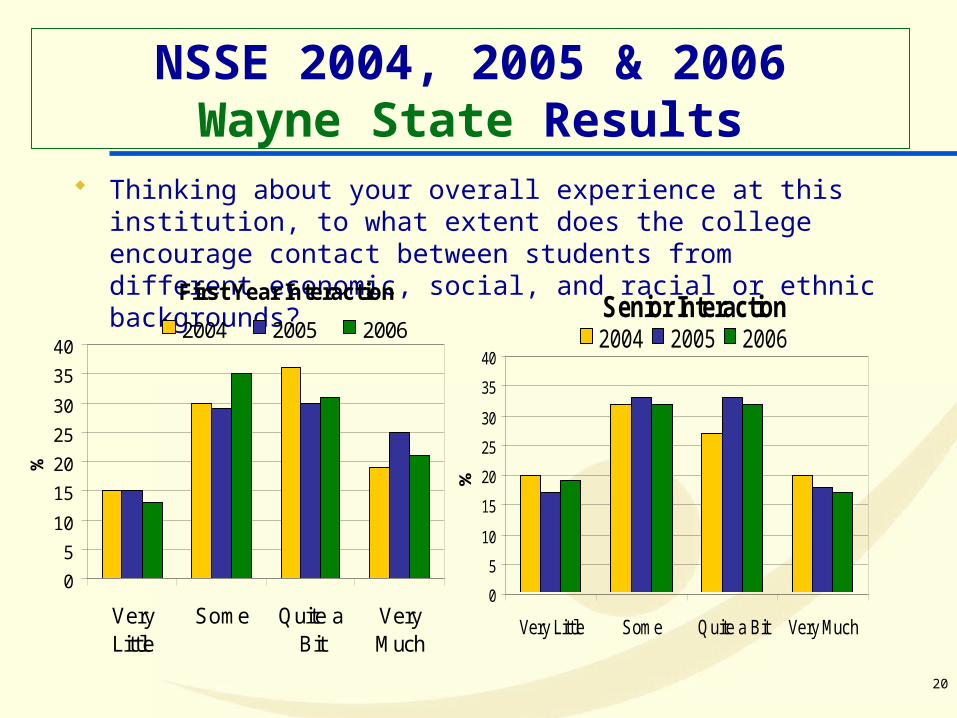
NSSE 2004, 2005 & 2006Wayne State Results
Thinking about your overall experience at this institution, to what extent does the college encourage contact between students from different economic, social, and racial or ethnic backgrounds?First Year Interaction
0
5
10
15
20
25
30
35
40
VeryLittle
Some Quite aBit
VeryMuch
%
2004 2005 2006Senior Interaction
0
5
10
15
20
25
30
35
40
Very Little Some Quite a Bit Very Much
%
2004 2005 2006
21
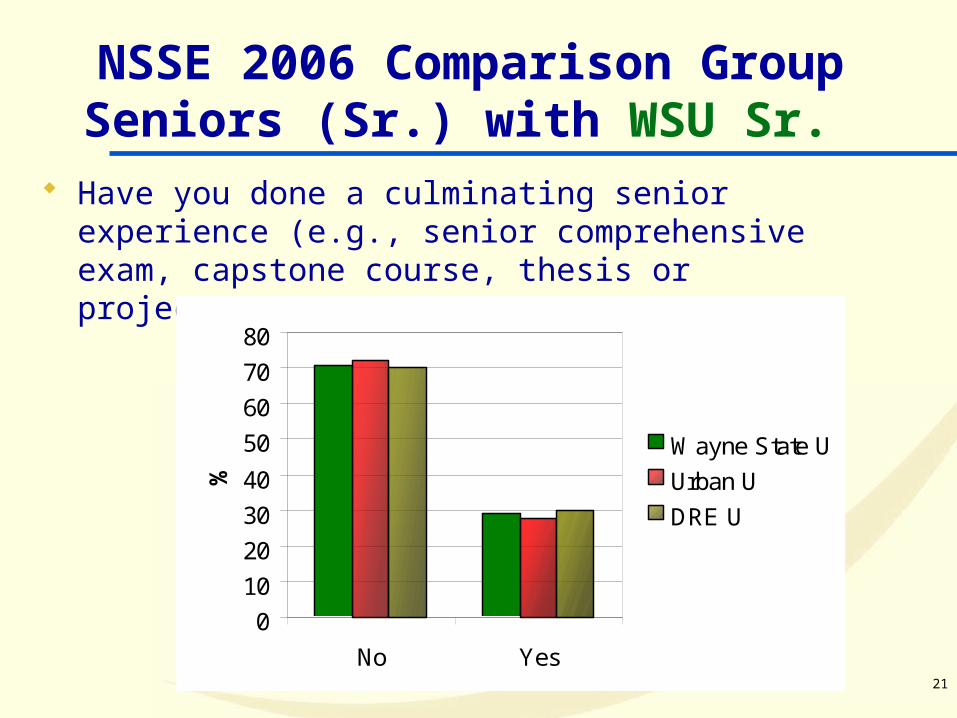
NSSE 2006 Comparison GroupSeniors (Sr.) with WSU Sr.
Have you done a culminating senior experience (e.g., senior comprehensive exam, capstone course, thesis or project)?
0
10
20
30
40
50
60
70
80
No Yes
%
Wayne State U
Urban U
DRE U
22
NSSE 2006 Promising FindingsSenior Students
Most seniors (74%) would attend WSU if they could start over again and (75%) say they had a good or excellent educational experience
23
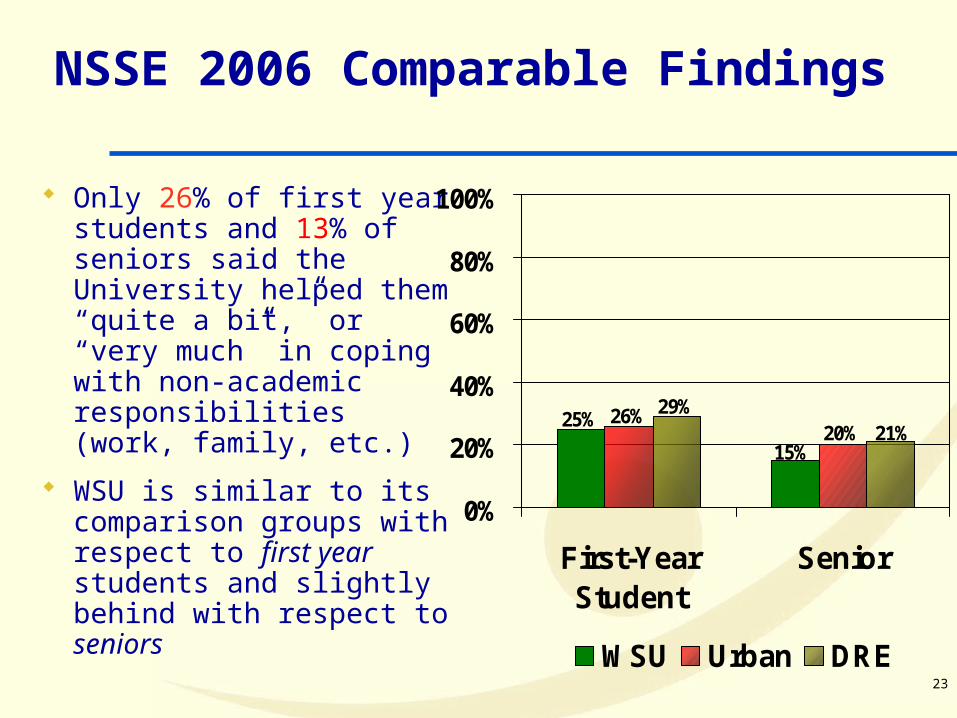
NSSE 2006 Comparable Findings
Only 26% of first year students and 13% of seniors said the University helped them “quite a bit,” or “very much” in coping with non-academic responsibilities (work, family, etc.)
WSU is similar to its comparison groups with respect to first year students and slightly behind with respect to seniors
15%
25%20%
26%21%
29%
0%
20%
40%
60%
80%
100%
First-YearStudent
Senior
WSU Urban DRE
24
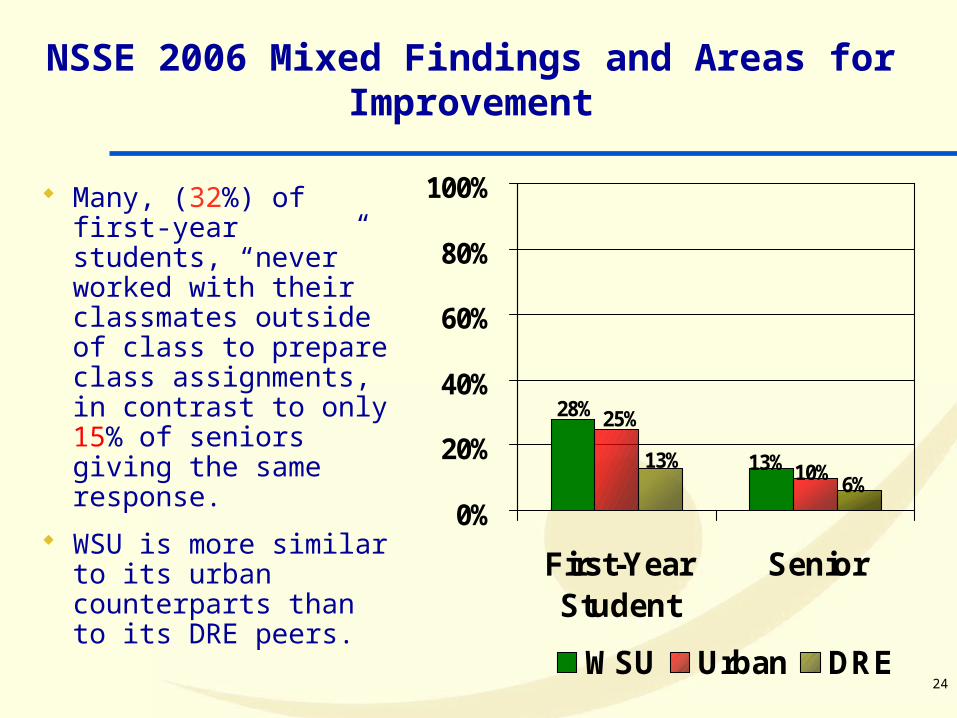
NSSE 2006 Mixed Findings and Areas for Improvement
Many, (32%) of first-year students, “never” worked with their classmates outside of class to prepare class assignments, in contrast to only 15% of seniors giving the same response.
WSU is more similar to its urban counterparts than to its DRE peers.
13%
28%
10%
25%
6%13%
0%
20%
40%
60%
80%
100%
First-YearStudent
Senior
WSU Urban DRE
25
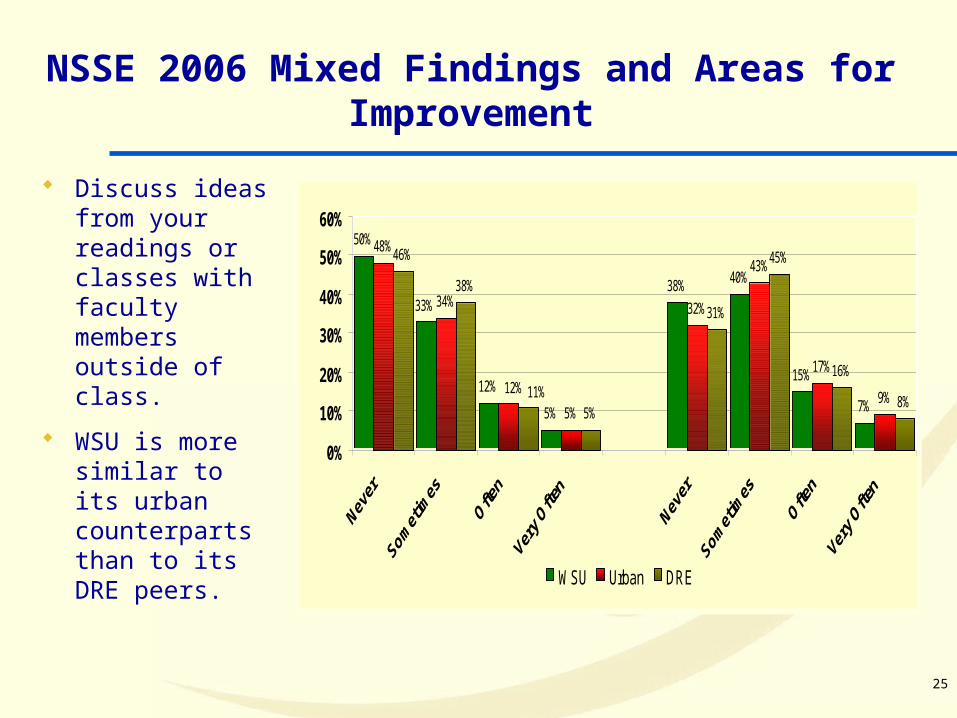
NSSE 2006 Mixed Findings and Areas for Improvement
Discuss ideas from your readings or classes with faculty members outside of class.
WSU is more similar to its urban counterparts than to its DRE peers.
50%
12%
5%
38% 40%
15%
7%
48%
34%
5%
32%
43%
17%
9%
46%
38%
5%
31%
45%
16%
8%
33%
12% 11%
0%
10%
20%
30%
40%
50%
60%
WSU Urban DRE
First-Year Students Seniors
26
NSSE 2004 – 2006 WSU Comparative Data
Wayne State University
27
Level of Academic Challenge Cluster Description
Challenging intellectual and creative work is central to student learning and collegiate quality.
Colleges and universities promote high levels of student achievement by emphasizing the importance of academic effort and setting high expectations for student performance.
28
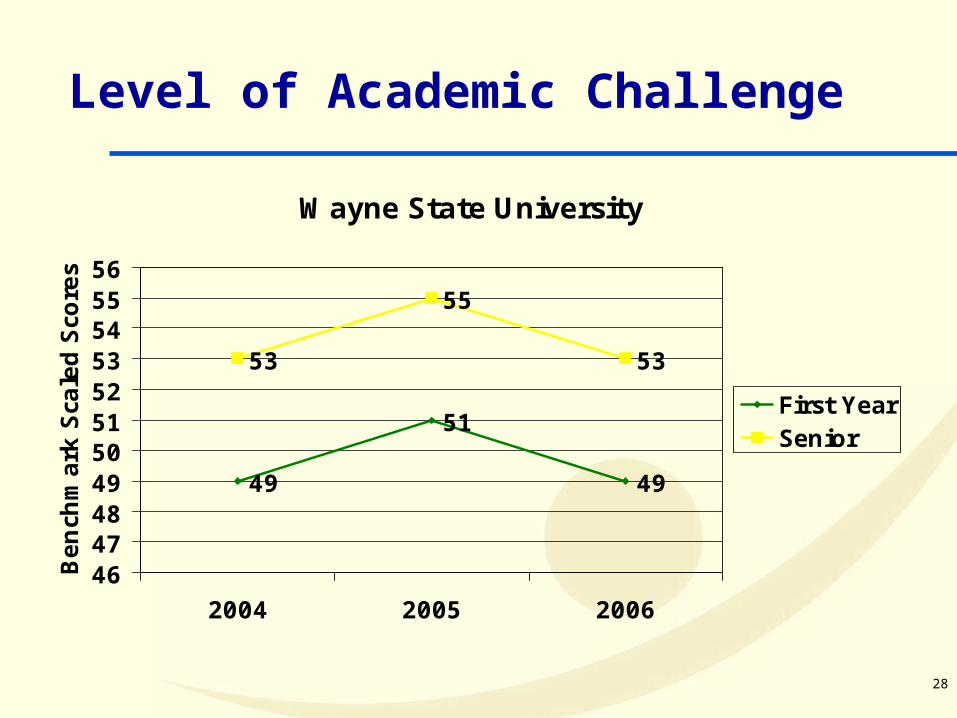
Level of Academic Challenge
Wayne State University
49
51
49
53
55
53
4647484950515253545556
2004 2005 2006
Bench
mark
Sca
led S
core
s
First YearSenior
29
Active and Collaborative Learning Cluster Description
Students learn more when they are intensely involved in their education and asked to think about what they are learning in different settings.
Collaborating with others in solving problems or mastering difficult material prepares students for the messy, unscripted problems they will encounter daily during and after college.
30
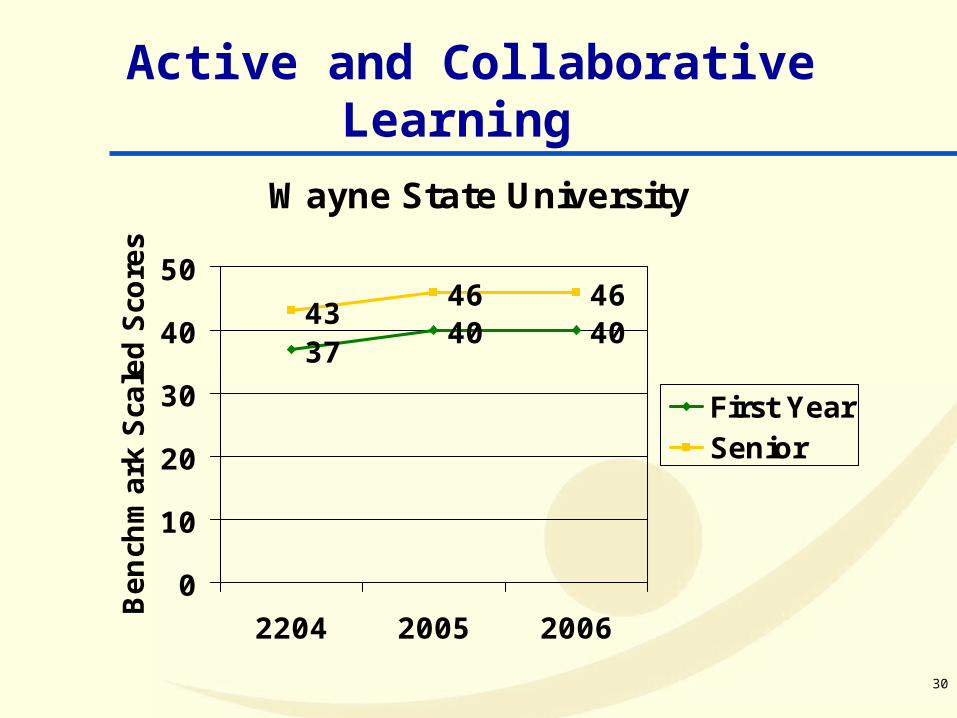
Active and Collaborative Learning
Wayne State University
3740 40
4346 46
0
10
20
30
40
50
2204 2005 2006
Bench
mark
Sca
led S
core
s
First YearSenior
31
Student - Faculty Interaction Cluster Description
Students learn firsthand how experts think about and solve practical problems by interacting with faculty members inside and outside the classroom.
As a result, their teachers become role models, mentors, and guides for continuous, life-long learning
32
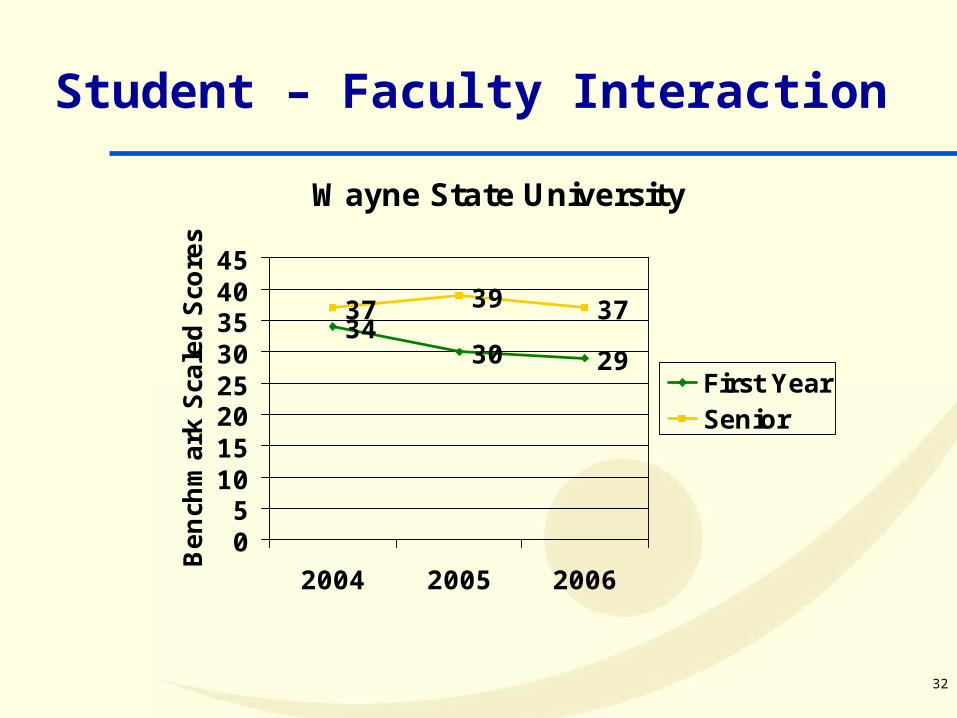
Student – Faculty Interaction
Wayne State University
3430 29
37 39 37
05
1015202530354045
2004 2005 2006
Bench
mark
Sca
led S
core
s
First YearSenior
33
Enriching Educational Experiences Cluster
Description
Complementary learning opportunities in and out of class augment academic programs.
Diversity experiences teach students valuable things about themselves and others.
Technology facilitates collaboration between peers and instructors.
Internships, community service, and senior capstone courses provide opportunities to integrate and apply knowledge.
34
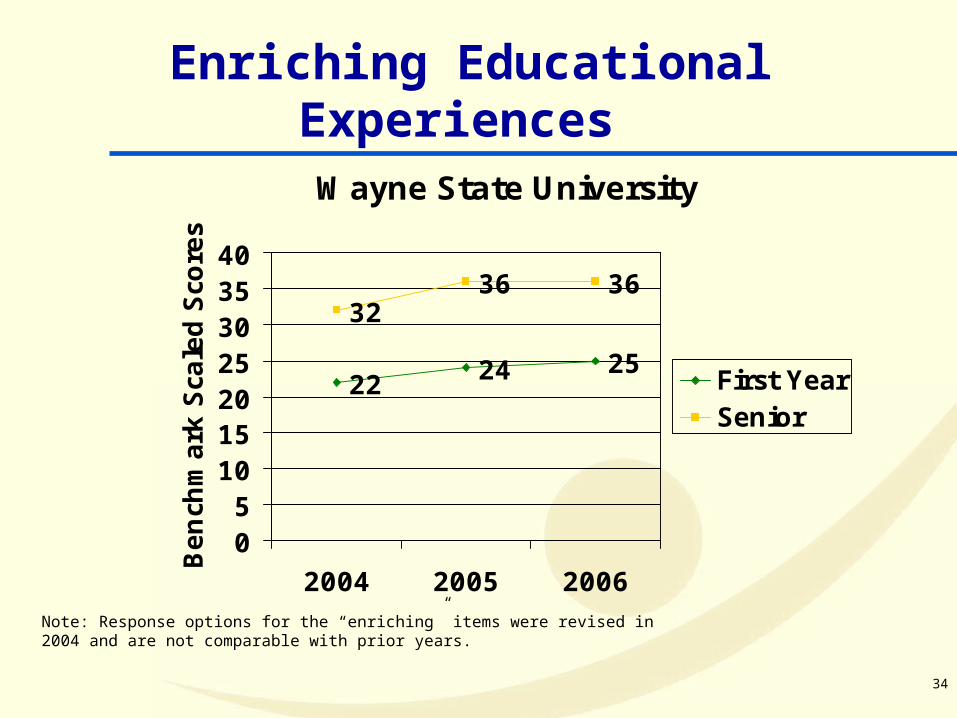
Enriching Educational Experiences Wayne State University
22 24 25
3236 36
05
10152025303540
2004 2005 2006
Bench
mark
Sca
led S
core
s
First YearSenior
Note: Response options for the “enriching” items were revised in 2004 and are not comparable with prior years.
35
Supportive Campus Environment Cluster
Description
Students perform better and are more satisfied at colleges that are committed to their success and cultivate positive the working and social relations among different groups on campus.
36
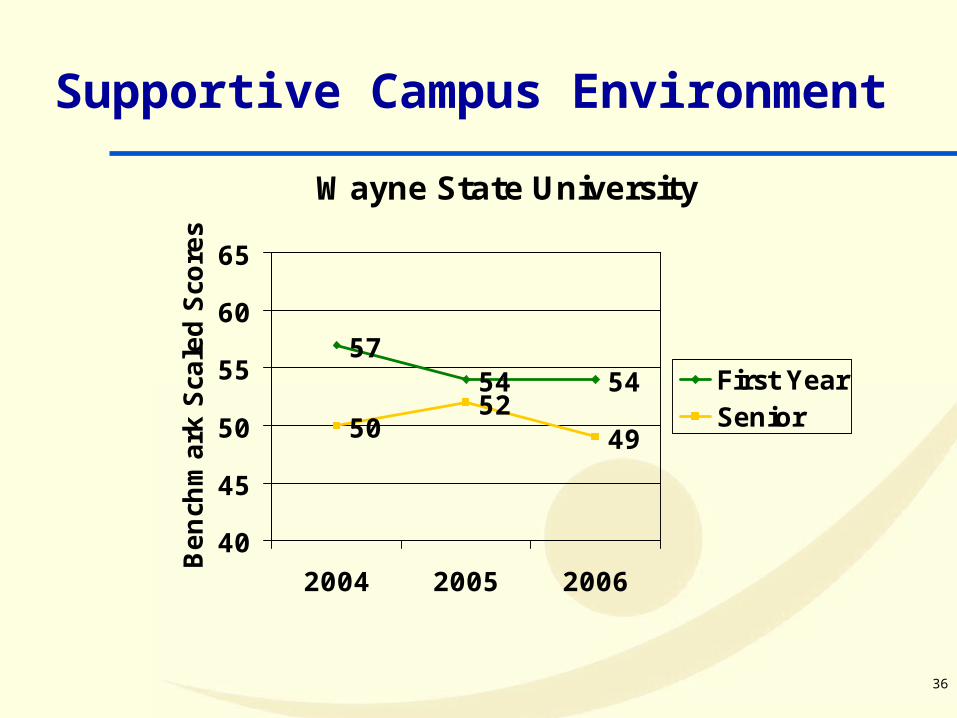
Supportive Campus Environment
Wayne State University
5754 54
5052
49
40
45
50
55
60
65
2004 2005 2006
Bench
mark
Sca
led S
core
s
First YearSenior
37
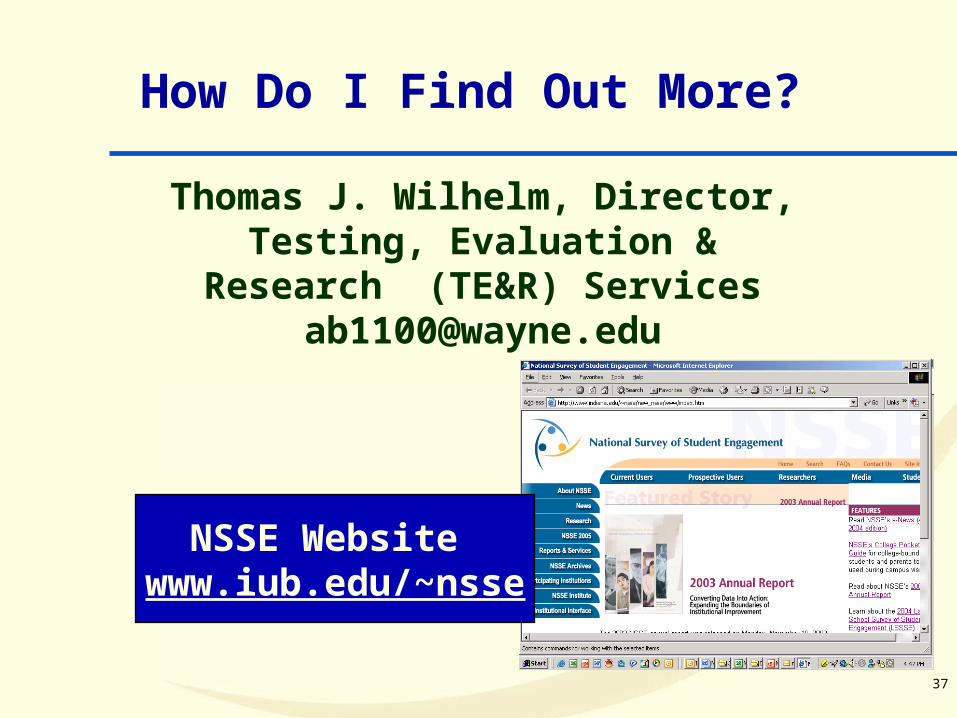
How Do I Find Out More?
NSSE Website www.iub.edu/~nsse
Thomas J. Wilhelm, Director, Testing, Evaluation & Research
(TE&R) [email protected]