1. Most mountainous state in the USA? · 1. Most mountainous state in the USA? 2. Most-mountainous...
83
GBLCC: Sept 2015 POP QUIZ: 1. Most mountainous state in the USA?
Transcript of 1. Most mountainous state in the USA? · 1. Most mountainous state in the USA? 2. Most-mountainous...

GBLCC: Sept 2015
POP QUIZ:
1. Most mountainous state in the USA?

POP QUIZ:
1. Most mountainous state in the USA? NV
GBLCC: Sept 2015

POP QUIZ:
1. Most mountainous state in the USA?
2. Most-mountainous ecoregion in N. America?
GBLCC: Sept 2015

POP QUIZ:
1. Most mountainous state in the USA?
2. Most-mountainous ecoregion in N. America?
hydrographic Great Basin
GBLCC: Sept 2015

POP QUIZ:
1. Most mountainous state in the USA?
2. Most-mountainous ecoregion in N. America?
3. # of mtn. ranges in Nevada?
GBLCC: Sept 2015

POP QUIZ:
1. Most mountainous state in the USA?
2. Most-mountainous ecoregion in N. America?
3. # of mtn. ranges in Nevada?
186 314
Fiero 1986 McLane 1978
GBLCC: Sept 2015
POP QUIZ:
1. Most mountainous state in the USA?
2. Most-mountainous ecoregion in N. America?
3. # of mtn. ranges in Nevada?
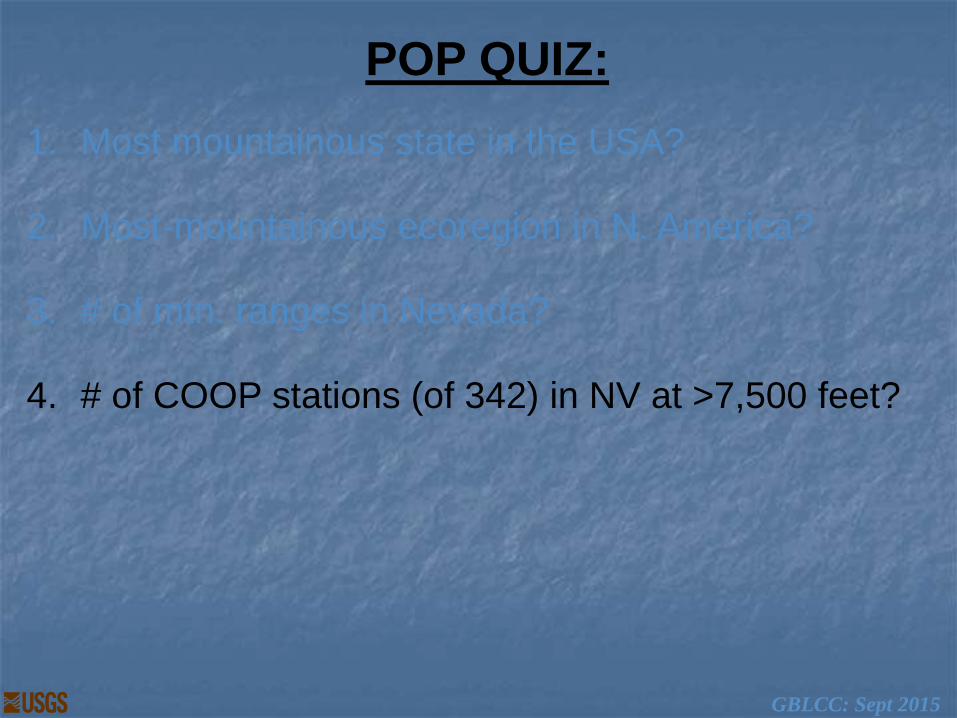
4. # of COOP stations (of 342) in NV at >7,500 feet?
GBLCC: Sept 2015

POP QUIZ:
1. Most mountainous state in the USA?
2. Most-mountainous ecoregion in N. America?
3. # of mtn. ranges in Nevada?
4. # of COOP stations (of 342) in NV at >7,500 feet?
4
GBLCC: Sept 2015

POP QUIZ:
1. Most mountainous state in the USA?
2. Most-mountainous ecoregion in N. America?
3. # of mtn. ranges in Nevada?
4. # of COOP stations (of 342) in NV at >7,500 feet?
4 0
GBLCC: Sept 2015

POP QUIZ:
1. Most mountainous state in the USA?
2. Most-mountainous ecoregion in N. America?
3. # of mtn. ranges in Nevada?
4. # of COOP stations (of 342) in NV at >7,500 feet?
5. # of mtn. ranges in GB w/ high-elev weather station?
GBLCC: Sept 2015

POP QUIZ:
1. Most mountainous state in the USA?
2. Most-mountainous ecoregion in N. America?
3. # of mtn. ranges in Nevada?
4. # of COOP stations (of 342) in NV at >7,500 feet?
5. # of GB mtn. ranges w/ any high-elev weather station?
~13? White Mtns., Snake, Toiyabe, Ruby Mtns., Schell Creek,
other SNOTEL locations (many <5-10 yrs old)
GBLCC: Sept 2015

POP QUIZ:
1. Most mountainous state in the USA?
2. Most-mountainous ecoregion in N. America?
3. # of mtn. ranges in Nevada?
4. # of COOP stations (of 342) in NV at >7,500 feet?
5. # of mtn. ranges in GB w/ high-elev weather station?
6. ~% of USA in most-strictly-protected status that
occurs in mountains?
>90 GBLCC: Sept 2015

Beever
et
al. 2
011
Basin weather stations are usually NOT in mountains
Problematic, because:
Rain shadows
Varying lapse rates **
Cold-air pooling
Inversion layers
This affects:
Microrefugia
Climate adaptation
Restoration options
Conservation portfolio
GBLCC: Sept 2015

Minder et al. (2010): Lapse rate in WA Cascades
High: Spring Tmax (7.4 Cº/km)
Low: Summer Tmin (2.7 Cº/km)
Windward: 4-5 Cº/km vs. leeward: 3-8 Cº/km
GBLCC: Sept 2015
So what … ?!?
6.5 Cº/km J. Geophys. Research 115(D14)

Mountain ecosystems: Cauldrons of dispersal,
endemism, & climate adaptation
Beever
et
al. 2
011
Sharp gradients in abiotic, biotic
conditions => high diversity,
corridors for re-distributing
Water for ~2/3 of world’s people
Aesthetic, recreational values
Constitute >90% of current
strict-conservation portfolio
GBLCC: Sept 2015

What other questions might you be
interested in, to inform mgmt &
conservation efforts?
314 sensors now in place, in 21 mountain ranges
30 sensors paired with sensors at typical weather-station
height (2 m)
Data on:
GPS locations of all animals (+abundance)
ID & local %cover of top 5 most dominant plant spp.
T & RH, 6x/day, to 2005
In situ dates of snow cover, frequency of T exceedances
GBLCC: Sept 2015

Species
vulnerability
to climate
change GBLCC: Sept 2015
Sensitivity

# of microclimate sensors, Basin-wide
Testing effects of microclimate
J. Wilkening
30
14
8
35
227
314
2 m
old, current
N =
GBLCC: Sept 2015
S. Weber

Practical considerations
Pikas to understand climate-species interactions
Locally abundant, unlike most mammals
Relatively stable population sizes
Highly detectable (HPs, calls)
Obligate to easily defined habitat, NOT changing over time
losses not confused by habitat change
Central-place forager
Simultaneous present & past survey
GBLCC: Sept 2015
S. Weber
S. Weber

Call
Active haypile, sighting
Sighting
eep-eep
S. Weber
S. Weber
S. Weber
Ochotona princeps evidences

Ochotona princeps old evidence Old haypiles
Feces: dry
Feces:
moist
S. Weber
S. Weber S. Weber
S. Weber

GBLCC: Sept 2015
5%
In
‘mainland’
regions:
Stewart et al. 2015
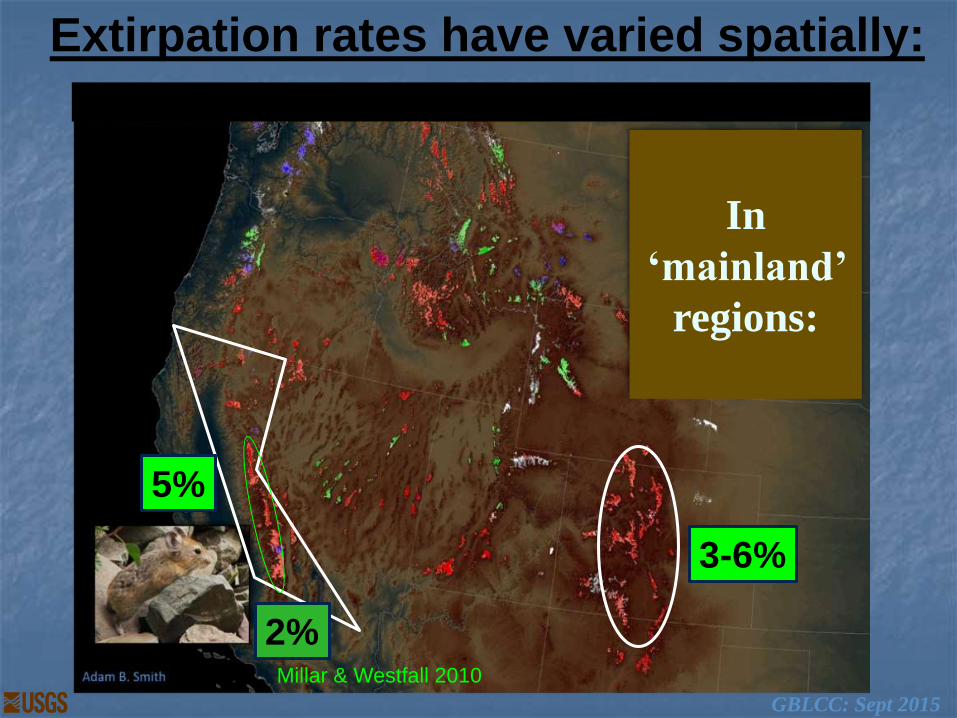
Extirpation rates have varied spatially:

GBLCC: Sept 2015
3-6%
5%
In
‘mainland’
regions:
Erb et al. 2011
Extirpation rates have varied spatially:
GBLCC: Sept 2015
3-6%
5%
In
‘mainland’
regions:
2% Millar & Westfall 2010
Extirpation rates have varied spatially:

GBLCC: Sept 2015
44%
In more-
isolated
areas
(Great
Basin):
Beever et al., in review
Extirpation rates have varied spatially:

Extirpation rates have varied spatially:
GBLCC: Sept 2015
44%
In more-
isolated
areas
(Great
Basin): >33%
50%
Erb et al. 2011
Millar & Westfall 2010
Collins &
Bauman 2012

Anatomy of a decline: persistence
6 local extinctions (once every
10.7 yrs)
4 add’l local extinctions (once
every 2.2 yrs)
0 add’l extirpations among
original 25 sites, but 5 of 9
‘new’ sites extirpated
(radioC dating)
4 periods of sampling
Historic 1898-1956
Recent_1 1994-1999
Recent_2 2003-2008
Recent_3 2012-2015
{ { {
Beever et al. 2011
S. Weber
GBLCC: Sept 2015

Minimum elevation of detections, Historic to
my first (1990s) sampling: 13.2 m/decade
Minimum elev. of detections, 1st to 2nd
sampling: 145.1 m/decade
Minimum elev. of detections, 2nd to 3rd
sampling: 54.1 m/decade
Parmesan & Yohe (2003): 6.1 m / decade
Chen et al. (2011): 11.0 m / decade
No ∆ in max, mean, or median elev, at most sites
Historic min: 2,366 m
1999 min: 2,461 m
2008 min: 2,588 m
Beever et al. 2011
S. Weber
Anatomy of a decline: upslope migrations
Basin-wide avg. (>40M ha)
GBLCC: Sept 2015

What is exposure?
Acute heat stress not most important (behavior)
Unrecognized stresses appear most important
Recent > modeled long-term >> climate change
Beever et al. 2010
GBLCC: Sept 2015

Essential for
adaptation, mitigation,
management, and
conservation strategies
Mechanisms are very important !
Why and how …
GBLCC: Sept 2015

Extinctions and declines rarely
effected through direct stress
Instead, indirectly, via species
interactions, food supplies,
habitat loss, pathogens

Evidence of climatic influence on pikas
Comparison of microclimates at sites where
pikas remained vs. became extirpated
iButton field data, 2005-2006
# Days > 28˚C
Avg summer
temperature (˚C) # Days < 0˚C # Days < -5˚C
Pika-extant sites (N = 15 sites) 2.8 + 1.0 12.05 + 1.01 204.4 + 13.2 15.0 + 4.6
Pika-extirpated sites (N = 10) 10.9 + 4.0 17.02 + 0.72 159.6 + 9.7 28.7 + 7.8
Beever et al. 2010, Ecol. Appl.
GBLCC: Sept 2015 J. Wilkening

Evidence of climatic influence on pikas
Comparison of microclimates at sites where
pikas remained vs. became extirpated
iButton field data, 2005-2006
# Days > 28˚C
Avg summer
temperature (˚C) # Days < 0˚C # Days < -5˚C
Pika-extant sites (N = 15 sites) 2.8 + 1.0 12.05 + 1.01 204.4 + 13.2 15.0 + 4.6
Pika-extirpated sites (N = 10) 10.9 + 4.0 17.02 + 0.72 159.6 + 9.7 28.7 + 7.8
Beever et al. 2010, Ecol. Appl.
GBLCC: Sept 2015

Three Lks. (Lamoille Cnyn), Ruby Mtns., ne NV
(classic pika habitat)
GBLCC: Sept 2015
S. Weber

Swager Cnyn, Sweetwater Mtns., Sierra NV
(pikas extant at site)
GBLCC: Sept 2015
S. Weber

Location: Smith Lk., E. Humboldt Range, ne NV
GBLCC: Sept 2015
S. Weber

Long Cnyn, Ruby Mtns., ne NV
(pikas remain at site, but lowest taluses unoccupied)
GBLCC: Sept 2015
S. Weber

Peterson Crk., Shoshone Range, central NV
(recent local extinction; multi-scale patchiness of talus habitat)
GBLCC: Sept 2015
S. Weber

Pinchot Crk., White Mtns.
GBLCC: Sept 2015
S. Weber
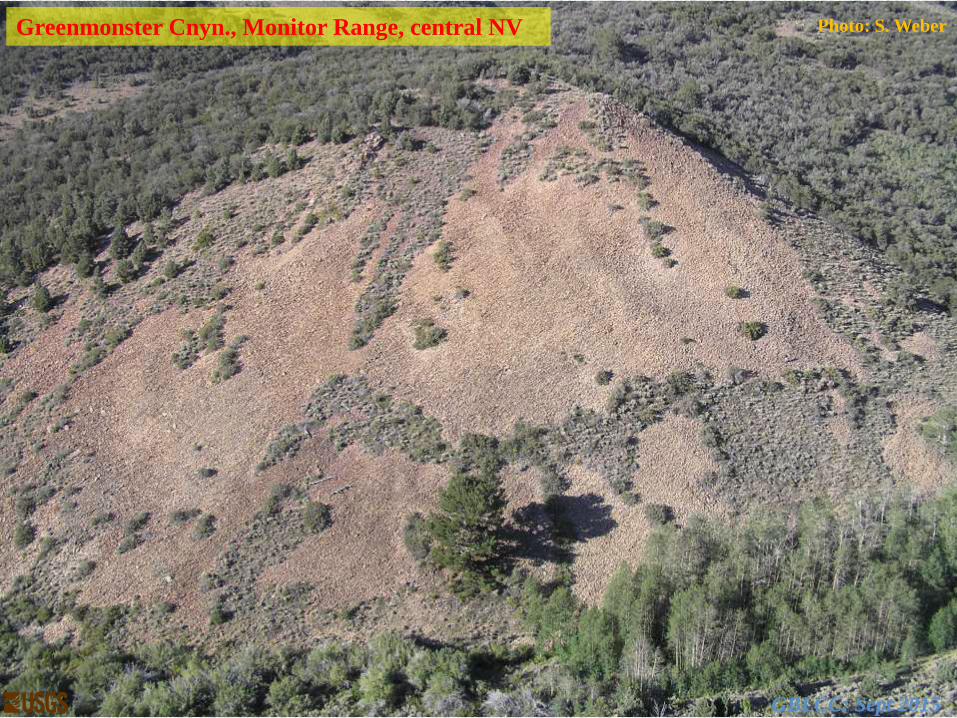
Greenmonster Cnyn., Monitor Range, central NV Photo: S. Weber
GBLCC: Sept 2015
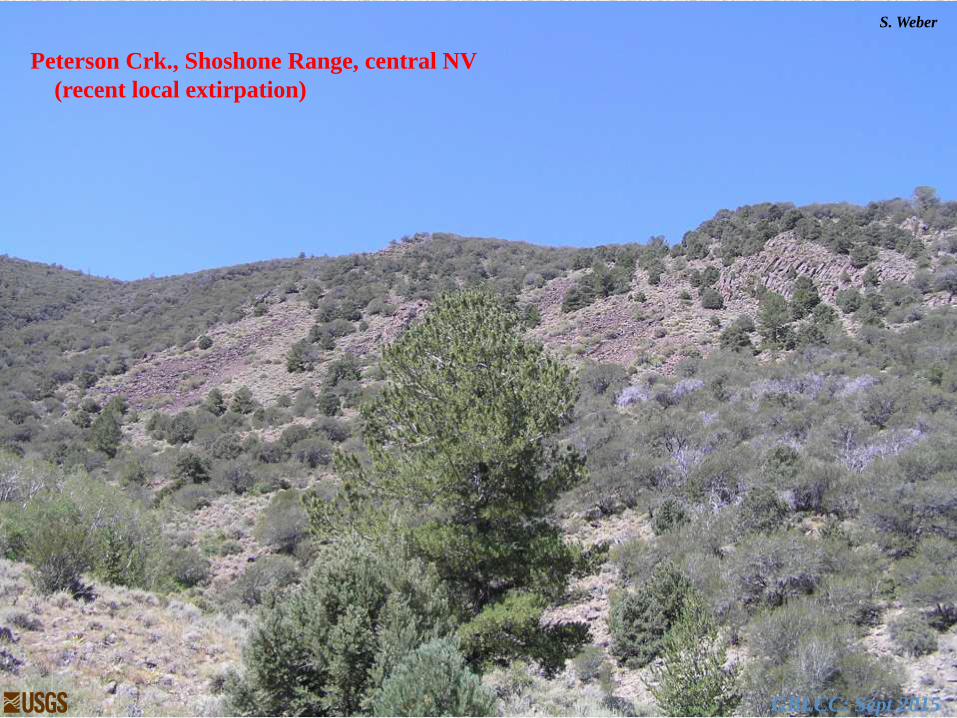
Peterson Crk., Shoshone Range, central NV
(recent local extirpation)
GBLCC: Sept 2015
S. Weber

Insights from density … NDVI strongly predicted pika density in 2000s surveys
P = 0.0003
GBLCC: Sept 2015

Insights from density …
Water-balance metrics predicted pika density in
2000s surveys better than did temperature
Beever et al. 2013, Ecology
GBLCC: Sept 2015

The rules are
changing…
Multiple working hypotheses (Chamberlin 1965)
Biogeography
Climate
Proximate anthropogenic AICc
GBLCC: Sept 2015

The rules are
changing…
1990s abundance
Grazed?
Pika-equivalent elev.
Precipitation
Grazing intensity
Amount of habitat
Precipitation
Grazing intensity
Pika-equivalent elev.
Amount of habitat
Grazed?
2000s abundance
GBLCC: Sept 2015
Multiple working hypotheses (Chamberlin 1965)

The rules are
changing…
1990s abundance
Grazed?
Pika-equivalent elev.
Precipitation
Grazing intensity
Amount of habitat
Precipitation
Grazing intensity
Pika-equivalent elev.
Amount of habitat
Grazed?
2000s abundance
GBLCC: Sept 2015
Multiple working hypotheses (Chamberlin 1965)

Are assumptions of IBT likely to be true for all wildlife spp.?
Not all island area can be habitat, due to strong effects of climate
GBLCC: Sept 2015

NV is the driest state, and the GB is a
water-limited ecoregion…
Does RH, vapor pressure deficit, or dew point better
predict pika persistence than temp measures?
GBLCC: Sept 2015
Research in progress …
p = 0.0006

NV is the driest state, and the GB is a
water-limited ecoregion…
Does RH, vapor pressure deficit, or dew point better
predict pika persistence than temp measures?
Avg., year-round RH
GBLCC: Sept 2015
Research in progress …
p = 0.0006

NV is the driest state, and the GB is a
water-limited ecoregion…
Does RH, vapor pressure deficit, or dew point better
predict pika persistence than temp measures?
Avg., year-round RH
Avg. winter RH
GBLCC: Sept 2015
Research in progress …
p = 0.0006

NV is the driest state, and the GB is a
water-limited ecoregion…
Does RH, vapor pressure deficit, or dew point better
predict pika persistence than temp measures?
Avg., year-round RH
Avg. winter RH
Avg. summer RH
GBLCC: Sept 2015
Research in progress …
p = 0.0006

NV is the driest state, and the GB is a
water-limited ecoregion…
Does RH, vapor pressure deficit, or dew point better
predict pika persistence than temp measures?
Avg., year-round RH
Avg. winter RH
Avg. summer RH
Avg. daily low (& high & spread) RH, in summer
GBLCC: Sept 2015
Research in progress …
p = 0.0006
NV is the driest state, and the GB is a
water-limited ecoregion…
Does RH, vapor pressure deficit, or dew point better
predict pika persistence than temp measures?
Avg., year-round RH
Avg. winter RH
Avg. summer RH
Avg. daily low (& high & spread) RH, in summer
Frequency of RH < 15%, > 85%, > 70%
GBLCC: Sept 2015
Research in progress …
p = 0.0006

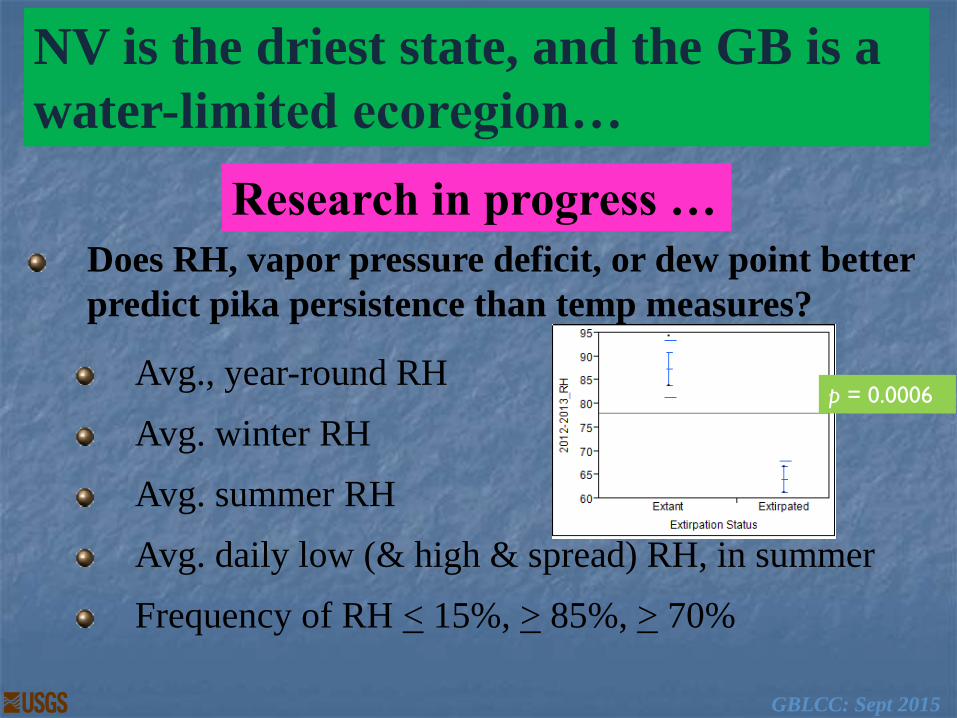
NV is the driest state, and the GB is a
water-limited ecoregion…
Does RH, vapor pressure deficit, or dew point better
predict pika persistence than temp measures?
Avg., year-round RH
Avg. winter RH
Avg. summer RH
Avg. daily low (& high & spread) RH, in summer
Frequency of RH < 15%, > 85%, > 70%
Variability in RH GBLCC: Sept 2015
Research in progress …
p = 0.0006

Research in progress …
Very-fine-
resolution aerial-
photo imagery, to
create a predictive
model of pika
occupancy
True color
Thermal infrared
Color-infrared
T. Millette, Mt. Holyoke College
A. Johnston, USGS
All images: T. Millette

Research in progress …
Assessing whether plant chemistry is
mediating pika distributional changes
% water
% N
% fiber
Phenolics
Limiting micronutrients … ?
Extant vs. extirpated sites
“preferred” vs. non-pref. plant spp.
GBLCC: Sept 2015 S. Weber
Denise Dearing, Jo Varner
Univ. of UT

Research in progress …
Assessing whether limitation of surface
activity constrains pika distribution > Temp
sensu Sinervo
et al., but for an
endothermic
mammal
GBLCC: Sept 2015
Paul Mathewson, Univ. WI
Warren Porter, Univ. WI
Lucas Moyer-Horner, U. UT
Mike Kearney, U. Melbourne
Unpublished results; do not cite

How management and conservation actions may
affect adaptive capacity
Fundamental
(intrinsic)
adaptive
capacity:
Realized
adaptive
capacity
Management (e.g., climate-adaptation actions)
Climate-
change
stressors
Managed relocation, genetic engineering
Extrinsic factors: • e.g., pollution
Beever et al. in press,
Conservation Letters
GBLCC: Sept 2015

Adaptive capacity: when, where, and how do
species have the ability to accommodate CC?
vs.
Great Basin
Greater Yellowstone Ecoregion
Beever et al. in press,
Conservation Letters
GBLCC: Sept 2015
A. Loosen
A. Loosen A. Loosen
E. Beever
Importance of
microrefugia
Shorter generation time
Higher mutation rate
Ecological generalists: diet, space use,
activity budgets, broad physiological tolerances
Greater dispersal capacity
Greater ability to learn behavior
Which species likely to have
higher adaptive capacity?
E. Beever
J. Smith
Nicotra et al.,
in press, Cons.
Biology
GBLCC: Sept 2015
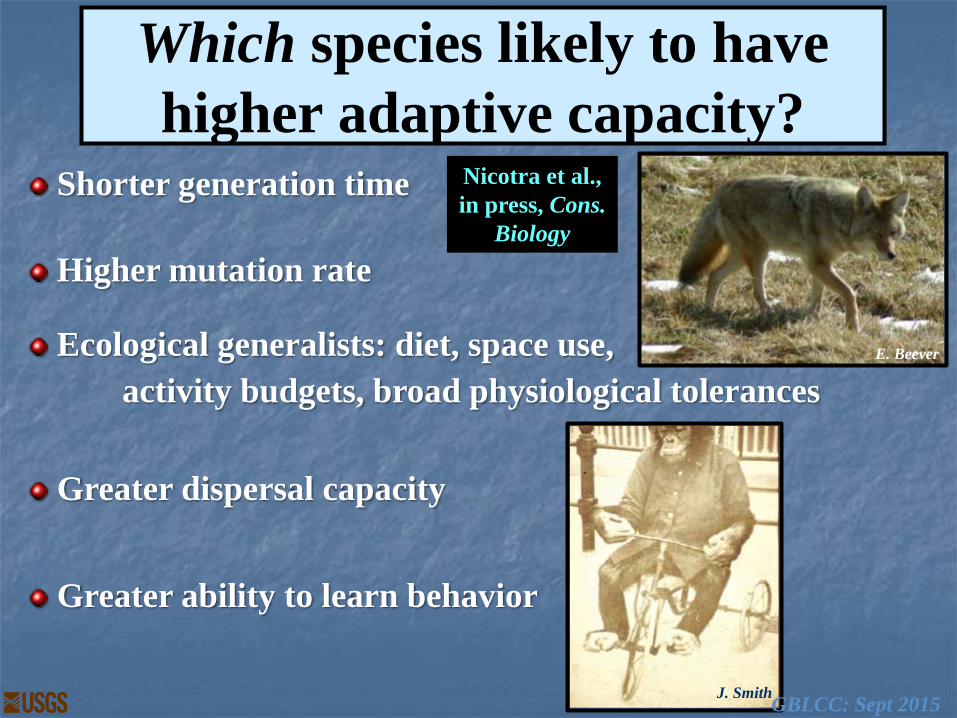
Where might spp. have higher AC…?

Does climate act differently on wildlife in the
GB, for widely-distributed spp.?
elevation
precip driest quarter
precip seasonality
mean annual temp
temp of hottest month
elevation
temp of warmest quarter
mean annual temp
temp of wettest quarter
fig. courtesy of Adam Smith GBLCC: Sept 2015
Unpublished results; do not cite

Ecotypic and genotypic climate vulnerability Fu
ture d
irection
s
Summer Temperature
Winter Temperature
Annual Precipitation
Summer Precipitation
Winter Precipitation
low high Importance
Non-stationary distribution modeling
GBLCC: Sept 2015 fig. courtesy of Adam Smith
Hypothesized mechanisms driving dynamics reflect our understanding of life history

Resiliency: assisted re-introductions
0
0.2
0.4
0.6
0.8
1
-4 -2 0 2 4 6 8
pik
a p
ers
iste
nce
linear predictor: 9.696 - 0.584 * r(JJAave) - 0.035 * r(ND<-5)
observed
predicted
Adj. r2 = 0.62
GBLCC: Sept 2015
Beever et al. in press,
Conservation Letters

Drought FX: Results of 2012-2014 sampling
Compared to 2000s, low-elevation boundary of
pika occupancy in 2010s:
Retracted
upslope
Expanded
downslope
Stayed same
(changed <15 m)
Mean change,
yellow cells
Basin-wide avg.,
n = 8 sites
2012 1 4 3 -191 m -75 m
2013 5 0 3 +223 m +140 m
Totals 6 4 6 +33 m
GBLCC: Sept 2015
Unpublished results; do not cite

Results of 2012-2014 sampling
Compared to 2000s, abundance in 2010s was:
2012: 55% of earlier (geometric mean)
2013: 137% of earlier (geometric mean)
GBLCC: Sept 2015
Unpublished results; do not cite

Core strengths of our research program
focus on an otherwise largely un-sampled part of the Basin
addressing all kinds of Qs @ microclimate, and multi-scale
patterns about climate and wildlife responses to it
21 yrs of data collection (plus, informed by a historical data set
that spanned 1898-1956)
Up to10 years of contin-
fine-scale resolution, spatially (meters) and temporally (T & RH
measured 6x/day, year-round)
uous microclimatic data
GBLCC: Sept 2015

Take-homes: The Big Picture
Illustrate heterogeneity, nuance of GCC effects
GBLCC: Sept 2015
Take-homes: The Big Picture
Illustrate heterogeneity, nuance of GCC effects
Iteratively refining mechanistic understanding
GBLCC: Sept 2015

Take-homes: The Big Picture
Illustrate heterogeneity, nuance of GCC effects
Iteratively refining mechanistic understanding
Often, re-introductions would not be helpful
GBLCC: Sept 2015

Take-homes: The Big Picture
Illustrate heterogeneity, nuance of GCC effects
Iteratively refining mechanistic understanding
Often, re-introductions would not be helpful
Manipulative climate-adaptation expts. needed
GBLCC: Sept 2015

Take-homes: The Big Picture
Illustrate heterogeneity, nuance of GCC effects
Iteratively refining mechanistic understanding
Often, re-introductions would not be helpful
Manipulative climate-adaptation expts. needed
Much more is coming, esp. on microclimate data
GBLCC: Sept 2015

Take-homes: The Big Picture
Illustrate heterogeneity, nuance of GCC effects
Iteratively refining mechanistic understanding
Often, re-introductions would not be helpful
Manipulative climate-adaptation expts. needed
Much more is coming, esp. on microclimate data
Need to complement these data with non-talus spp.
GBLCC: Sept 2015
Thanks !
S. Weber
M. Russello
Great Basin LCC
Co-authors & colleagues G. Collins T. Millette
K. Goehring A. Johnston
M. Flores Adam Smith
J.P. Clark D. Thoma
C. Waters T. Rickman
B. Yardley T. Chesley-Preston
S. Weber M. Manguson
J. Perrine N. Nordensten
J. Varner M. Nelson
M. Jeffress C. Ray
A. Nicotra A. Robertson
S. Dobrowski
GBLCC: Sept 2015
Colleagues and collaborators
Thomas Albright, Univ. of NV-Reno (UNR)
Gail Collins, USFWS Sheldon-Hart NWR
Rachel Mazur, U.S. Forest Service
John Axtell, BLM Carson City office
Thomas Rodhouse, NPS Upper Columbia Basin
Inventory & Monitoring Network
Thomas Millette, Mt. Holyoke College
GeoProcessing Lab
Solomon Dobrowski, Univ. of MT College of
Forestry and Conservation
Mackenzie Jeffress, NDOW
GBLCC: Sept 2015

An old story: climate shapes mammal distribution
Joseph Grinnell, ca. 1922
Field notes,
Charles C.,
Yosemite NP,
1915
E, Raymond Hall, 1960s
C. Hart
Merriam,
1960s Merriam 1892, 1894
Grinnell 1917
Hall 1946
GBLCC: Sept 2015

An old story: climate shapes mammal distribution
GBLCC: Sept 2015

Adaptive capacity: when, where, and how do
species have the ability to accommodate CC?
Optimal body shape for conserving heat, when cold
vs.
J. Jacobson J. Jacobson
Beever et al. in review,
Frontiers in Ecology
and the Environment
GBLCC: Sept 2015

Adaptive capacity: when, where, and how do
species have the ability to accommodate CC?
Optimal body shape for conserving heat, when cold
vs.
J. Jacobson J. Jacobson
Beever et al. in review,
Frontiers in Ecology
and the Environment
When cold : 70.6% 29.4%
GBLCC: Sept 2015

Adaptive capacity: when, where, and how do
species have the ability to accommodate CC?
Optimal body shape for conserving heat, when cold
vs.
J. Jacobson J. Jacobson
Beever et al. in review,
Frontiers in Ecology
and the Environment
When cold : 73.7% 26.3%
When warm: 12.0% 88.0%
Pearson’s χ2 = 44.104 , p < 0.0001
Fisher’s exact test: P < 0.0001 that Prob BodyShape = Sphere-like is greater for Cold than Warm
Fisher’s exact test: P < 0.0001 that Prob BodyShape is different across Temps
GBLCC: Sept 2015

Hypothesized mechanisms Potential mechanism of climate
effect Possible measures
Acute heat stress Existence, frequency, or duration of temps above a certain threshold (e.g., 25 or 28 deg C)
Acute cold stress Existence, frequency, or duration of temps below a certain threshold
Chronic cold stress
1]modeled temp only, and 2] if we can get a reasonably reliable snow-cover layer, modeled temp + low
snow cover
Melt/re-freeze cycles or events Existence or frequency of modeled warm temperatures, during the cold season(s)
Plant-mediated NDVI, MODIS, or otherwise -- iff available everywhere
Growing-season PPT this variable is an output of water-balance modeling
Duration of snowpack [iff we can get this for all points]; modeled maximum SWE; 1-km-resolution snow depth
Water stress AET, water deficit, some other measure -- either annual, or summer only
Chronic heat stress Average summer temperature, growing degree-days
Relative humidity Chris Daly's new Vapor Pressure Deficit layer (available early 2015, EAB thinks)
Cumulative effects Additive effects of time exceeding high and low temperature thresholds within a season or year
Synergistic effects Muplicative or interacting effects of different stressors, within the same season or year.
Variability of weather, through time CV, 95% CI, or another measure of unpredictability of weather, inconsistent climate
shoulder-season-cold-stress
in lieu of snow cover data (if unavailable), data identifying the probable snow-free period (including
annual variation), intersected with temperature data
amount of suitable habitat and where Presence of talus, elevation, slope, and vegetation
Cascading (indirect) effects Changed conditions in matrix (non-talus) habitat, which diminishes dispersal capacity
Abundance of predator(s)
Will not be used as a predictor (impossible to get fine-scale data on distribution and esp. on abundance; just list
as caveat in Discussion
GBLCC: Sept 2015

Potential mechanisms of CC on montane spp.
Food abundance or quality
Habitat fragmentation
Disease, pests, parasites
Competitors, predators
Physical conditions (snow cover, streamflow, RH, precip)
Exceeding (narrow) physiological tolerances
J. Jacobson J. Jacobson
S. Weber
GBLCC: Sept 2015