1 Mobilizing Talent for Global Development Andrés Solimano Chairman,International Center for...
28
1 Mobilizing Talent Mobilizing Talent for for Global Development Global Development Andrés Solimano Chairman ,International Center for Globalization and Development, CIGLOB September , 2009
-
date post
18-Dec-2015 -
Category
Documents
-
view
217 -
download
0
Transcript of 1 Mobilizing Talent for Global Development Andrés Solimano Chairman,International Center for...
1
Mobilizing Talent for Mobilizing Talent for Global DevelopmentGlobal Development
Andrés SolimanoChairman ,International Center for
Globalization and Development, CIGLOB September , 2009

2
Contents
1. The International Mobility of Talent: Main Issues
2. Classification of Talent.
3. The International Market for Talent
4. Two Topics in Talent Economics
5. Development Impact of Talent Mobility
6. Empirical Evidence
7. Policy Issues
3
Talent is a key economic resource that creates new goods, knowledge, technologies, ideas and wealth.
The international mobility of talent has increased with globalization and has an impact on growth and inequality.
International markets for talent are more integrated than markets for unskilled labor.
In the ’60s and ’70s a main concern was on “brain drain”. In the early 21st Century we talk also about “Talent circulation” with potential win-win impact for origin and destination countries.
1.- International Talent Mobility: Main Issues

4
2.- Classification of Talent
a) Directly productive talent, related to business sector:1. Entrepreneurial2. Managerial3. Technical
b) Scientific talent1. Academics2. Scientists3. International students
c) Talent related to health and cultural sectors 1. Medical doctors, nurses, etc.2. Artists, musicians, writers3. Media-related people

5
Supply of talentSupply of talent (Ph.D’s, engineers, IT experts, medical doctors, students, etc.). Talent comes from developing countries (Asia, Eastern Europe, Latin America, Africa) and developed countries.
Demand for talentDemand for talent, from developed and developing countries (business, academic sector, government, others).
Where do supply and demand meet?Where do supply and demand meet?
3.- The International Market for Talent
6
3.a.- Pulling Factors in the “North” (Demand for talent)
Shortage of skilled professionals in IT, health and other sectors in industrialized countries.
Higher wages and attractive employment conditions.
Favorable immigration policies for talent.
Better possibilities of interaction with peers (scientists, artists, etc.)
3.- The International Market for Talent (cont.)
7
3.b.- Pushing Factors in the “South” (Supply of talent)
Lower relative income and real wages.
Lack of resources in universities and research centers (for academic talent).
Lack of meritocratic careers in the public sector.
Higher costs of doing business and barriers to entrepreneurship (for directly productive talent)
Higher frequency of economic and financial crises, unstable political regimes.
3.- The International Market for Talent (cont.)

8
South – North movements of Talent Talent from the south in search of employment and
capital in the north
North – South movements of Capital Capital from the north in search for lower cost talent
in the south (movement of multinational firms)
Examples: Bangalore (South)
Silicon Valley (North)
3.- The International Market for Talent (cont.)
3.c.- Talent chasing Capital, or Capital chasing Talent?

9
4.- Two Topics in Talent Economics
Rewards Structures for Talent: Rewards Structures for Talent: ProblemsProblems
Education and TalentEducation and Talent

10
4.a. Rewards Structures for Talent: Problems for rewarding Talent Failures of MarketsFailures of Markets
Complexity to identify talentMatching failures between Capital/Jobs and Talent
availability
Failures of InstitutionsFailures of Institutions Weak property rightsPatent system
Failures of the StateFailures of the State The Clientelistic and Paternalistic dominated
Organization versus the Meritocratic Organization

11
4.b. Rewards Structures for Talent (cont.)
The existence of increasing returns to ability (winners-take-all).
Examples: sports, artists and famous writers (i.e. Roger Federer in tennis, J.K. Rowling with Harry Potter).
Distortions: Incentives for rent-seeking, penalize innovation and entrepreneurship.

12
4.c. Education and Talent Allocation
Human Capital TheoryHuman Capital Theory. Talent goes to careers with high rate of return.
EducationEducation, as a signal of capacity and talent. Is it tertiary education always profitable?Is it tertiary education always profitable?
High opportunity costs of education for the highly gifted, entrepreneurially-oriented talent (Bill Gates left Harvard University to create Microsoft).
Larry Page and Sergey Brin left Stanford University to create Google.
A complex relationship…
13
5.- Development Impact of Talent Mobility
Impact on Economic Growth and Impact on Economic Growth and WelfareWelfare
Impact on Inequality and Income Impact on Inequality and Income DistributionDistribution
14
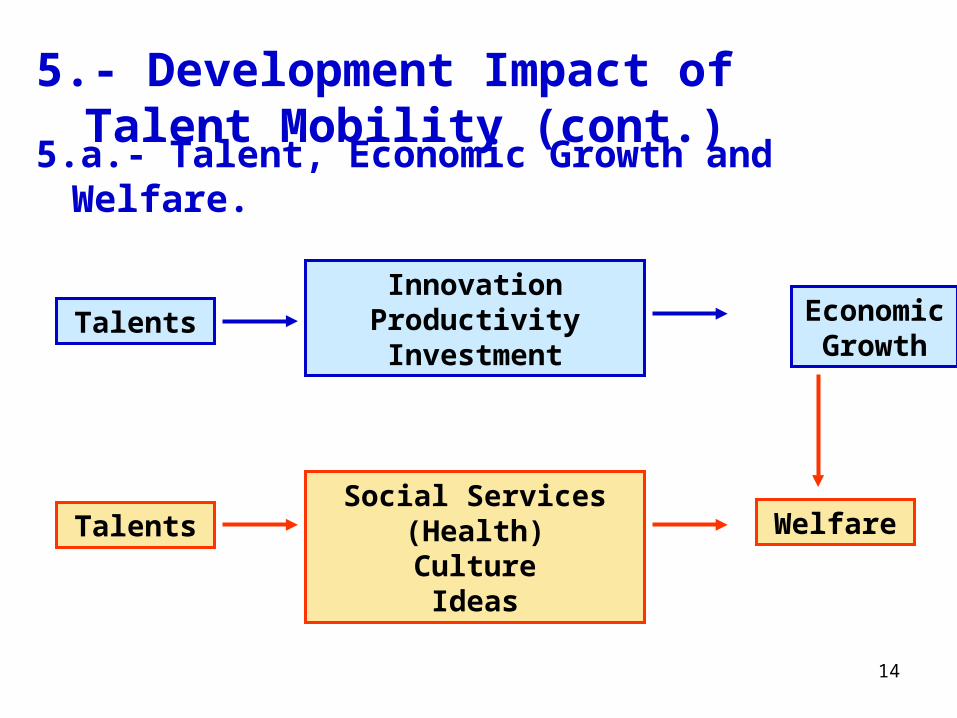
TalentsSocial Services (Health)
CultureIdeas
Welfare
TalentsInnovation
ProductivityInvestment
Economic Growth
5.a.- Talent, Economic Growth and Welfare.
5.- Development Impact of Talent Mobility (cont.)

15
Obstacles to develop Talent for low-income
individualsModest
RewardsInequality
High rewards to Talent
“Winners-take-all” Markets
Top Incomes
5.b.- Talent, Inequality and Income Distribution
5.- Development Impact of Talent Mobility (cont.)

16
6. Empirical Evidence
17
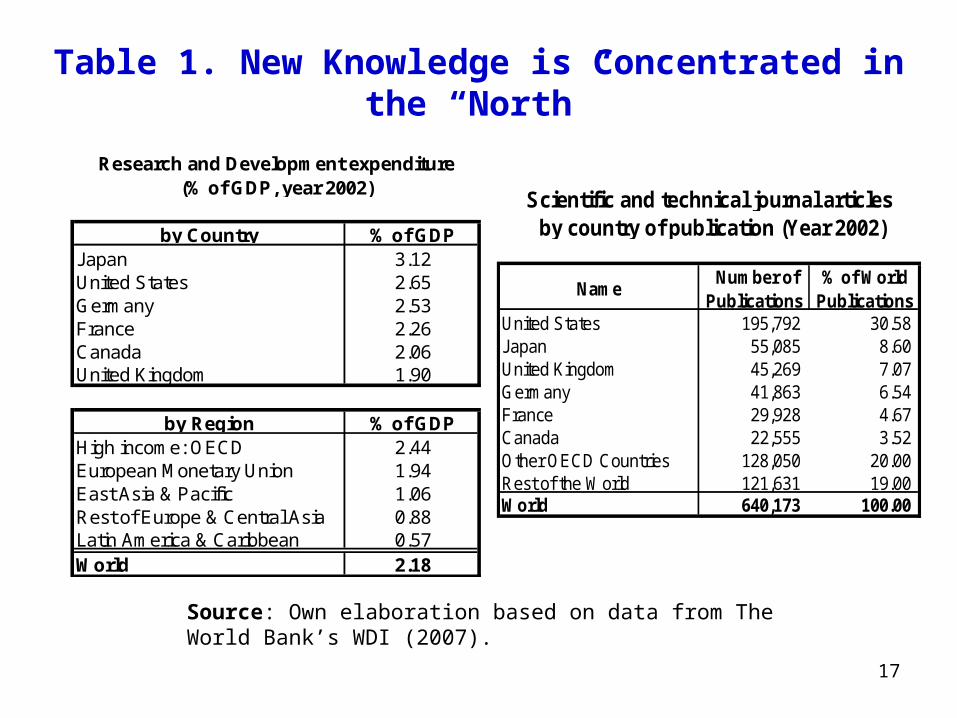
Table 1. New Knowledge is Concentrated in the “North”
Source: Own elaboration based on data from The World Bank’s WDI (2007).
Name Number of
Publications % of World
PublicationsUnited States 195,792 30.58 Japan 55,085 8.60 United Kingdom 45,269 7.07 Germany 41,863 6.54 France 29,928 4.67 Canada 22,555 3.52 Other OECD Countries 128,050 20.00 Rest of the World 121,631 19.00 World 640,173 100.00
Scientific and technical journal articles by country of publication (Year 2002)by Country % of GDP
Japan 3.12United States 2.65Germany 2.53France 2.26Canada 2.06United Kingdom 1.90
by Region % of GDPHigh income: OECD 2.44European Monetary Union 1.94East Asia & Pacific 1.06Rest of Europe & Central Asia 0.88Latin America & Caribbean 0.57World 2.18
Research and Development expenditure(% of GDP, year 2002)
18
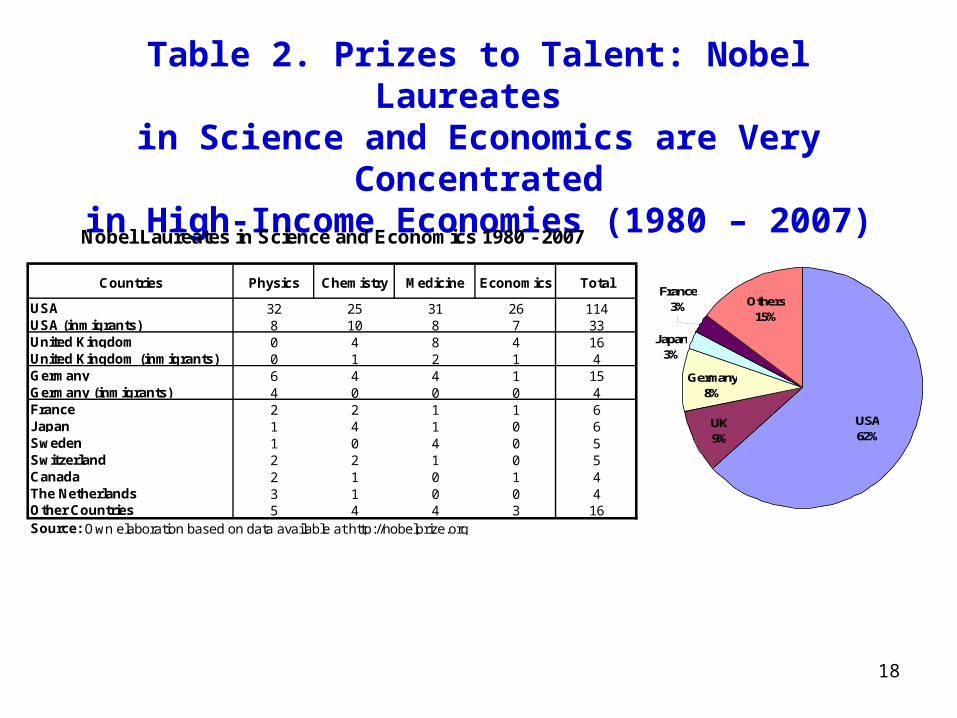
Table 2. Prizes to Talent: Nobel Laureates in Science and Economics are Very Concentrated
in High-Income Economies (1980 – 2007)
USA62%
Germany8%
Others15%
France3%
Japan3%
UK9%
Countries Physics Chemistry Medicine Economics Total
USA 32 25 31 26 114USA (inmigrants) 8 10 8 7 33United Kingdom 0 4 8 4 16United Kingdom (inmigrants) 0 1 2 1 4Germany 6 4 4 1 15Germany (inmigrants) 4 0 0 0 4France 2 2 1 1 6Japan 1 4 1 0 6Sweden 1 0 4 0 5Switzerland 2 2 1 0 5Canada 2 1 0 1 4The Netherlands 3 1 0 0 4Other Countries 5 4 4 3 16
Nobel Laureates in Science and Economics 1980 - 2007
Source: Own elaboration based on data available at http://nobelprize.org

19
Table 3. Prizes to Talent: Nobel Prizes in Literature is more uniformly distributed across nations (1980 – 2007)
CountriesNumber of
PrizesCountries
Number of Prizes
United Kingdom (inmigrants) 3 Ireland 1United Kingdom 2 Italy 1South Africa 2 Japan 1Austria 1 Mexico 1Colombia 1 Nigeria 1Czechoslovakia 1 Poland 1Egypt 1 Poland & USA 1España 1 Portugal 1France 1 Saint Lucia 1France (inmigrant) 1 Turkey 1Germany 1 USA 1Hungary 1 USA (inmigrants) 1
Nobel Laureates in Literature (1980 - 2007)
Source: Own elaboration based on data available at http://nobelprize.org

20
Table 4. Technical Talent: Patent Applications (by Country and Regions, year 2002)
Number of Appl.
% of Total Applications
Number of Appl.
% of Total Applications
Selected CountriesJapan 365,204 0.87 56,601 0.13Germany 47,352 0.83 9,557 0.17France 13,519 0.80 3,389 0.20United Kingdom 20,358 0.65 11,173 0.35Korea, Rep. 76,570 0.62 47,434 0.38United States 179,642 0.54 154,803 0.46China 39,806 0.39 63,083 0.61Canada 3,959 0.10 35,782 0.90
RegionsEuropean Monetary Union 71,830 0.83 14,629 0.17High income: OECD 734,686 0.68 349,357 0.32Europe & Central Asia 41,825 0.56 32,437 0.44Middle East & North Africa 669 0.45 826 0.55South Asia 4,417 0.39 7,049 0.61East Asia & Pacific 40,155 0.38 66,797 0.62Sub-Saharan Africa 4 0.15 22 0.85Latin America & Caribbean 3,743 0.12 27,066 0.88High income: nonOECD 2,192 0.07 27,622 0.93
World 827,691 0.62 511,176 0.38Source: Own elaboration based on data from The World Bank's WDI (2007).
Applications by ResidentsApplications by Non-
ResidentsName

21
Table 5. Where is the Talent? (I)The Global Talent Index (GTI) 2007
Rank Country GTI Score Rank Country GTI Score1 United States 52 8 China 422 Canada 47 10 India 393 The Netherlands 46 17 Argentina 344 United Kingdom 46 18 Russia 335 Sweden 45 19 Ukraine 336 Germany 43 21 Mexico 317 Australia 43 23 Brazil 308 China 42 24 South Africa 299 France 41 25 Egypt 29
10 India 39 27 Nigeria 25
Note: Data has been normalized in order to obtain scores from 1 to 100, where higher scores mean better performances on the talent measures. Index ranks 30 countries.
Source: "Mapping Global Talent: essays and insights", Heidrick & Struggles, and the Economic Intelligence Unit (2007).
Selected Developing and Transition Economies
Top 10 Countries

22
Table 6. Where is the Talent? (II)Global Creativity Index, year 2005
Rank CountryGlobal
Creativity Index
Talent IndexTechnology
IndexTolerance
Index
Top 10 Countries1 Sweden 80.8 64.2 81.9 96.42 Japan 76.6 70.2 78.5 81.13 Finland 68.4 72.8 62.6 69.84 United States 66.6 60.1 82.7 57.15 Switzerland 63.7 54.1 62.5 74.46 Denmark 61.3 59.7 38.5 85.87 Iceland 61.2 65.8 46.3 71.78 The Netherlands 61.1 64.3 36.6 82.49 Norway 59.5 68.6 27.9 81.910 Germany 57.7 46.8 51.1 75.3
Selected Developing and Transition Economies25 Russian Federation 33.9 52.1 11.2 38.527 Ukraine 29.6 40.4 10.3 38.033 Uruguay 24.0 22.0 2.1 47.836 China 23.0 3.1 10.9 55.038 Argentina 19.9 19.3 4.5 35.740 Chile 18.5 16.0 5.5 33.941 India 17.7 8.5 13.7 30.942 Mexico 16.4 15.0 4.3 29.943 Brazil 15.9 12.8 8.3 26.645 Romania 12.7 13.1 3.5 21.4
Source: "The flight of the Creative Class", Richard Florida (2005).Note: Data has been normalized in order to obtain scores from 0 to 1, and then the scores were taken to a 100-based index. The Global Creativity Index is made up of an equally weighted combination of the Talent Index, the Technology Index, and the Tolerance Index. Higher scores mean more ability of a country to harness and mobilize creative talent for innovation, entrepreneurship, industry formation, and long-run prosperity. Index ranks 45 countries.

23
Table 7. Migration of Qualified Human Resources* fromthe Americas to OECD Countries (2000)
Source: F. Docquier y A. Marfouk, “International Migration by Educational Attainment, 1990-2000”, International Migration, Remittances and Brain Drain, C. Ozden y M. Schiff (eds.), Washington, D.C., World Bank, Palgrave Mc Millan, 2006
Region Share in the OECD stock
(%)
Average Rateof Emigration
(as a % of the labor force**)
Share of SkilledWorkers
(%) Total Skilled Total Skilled Among
Residents Among
Emigrants
Americas 26.3 22.6 3.3 3.3 29.6 29.7 North America 2.8 4.6 0.8 0.9 51.3 57.9 Caribbean 5.1 5.7 15.3 42.8 9.3 38.6 Central America 13.7 6.6 11.9 16.9 11.1 16.6 South America 4.7 5.6 1.6 5.1 12.3 41.2
* People with 13 years or more of education (tertiary education)** People equal or greater than 25 years old.
24
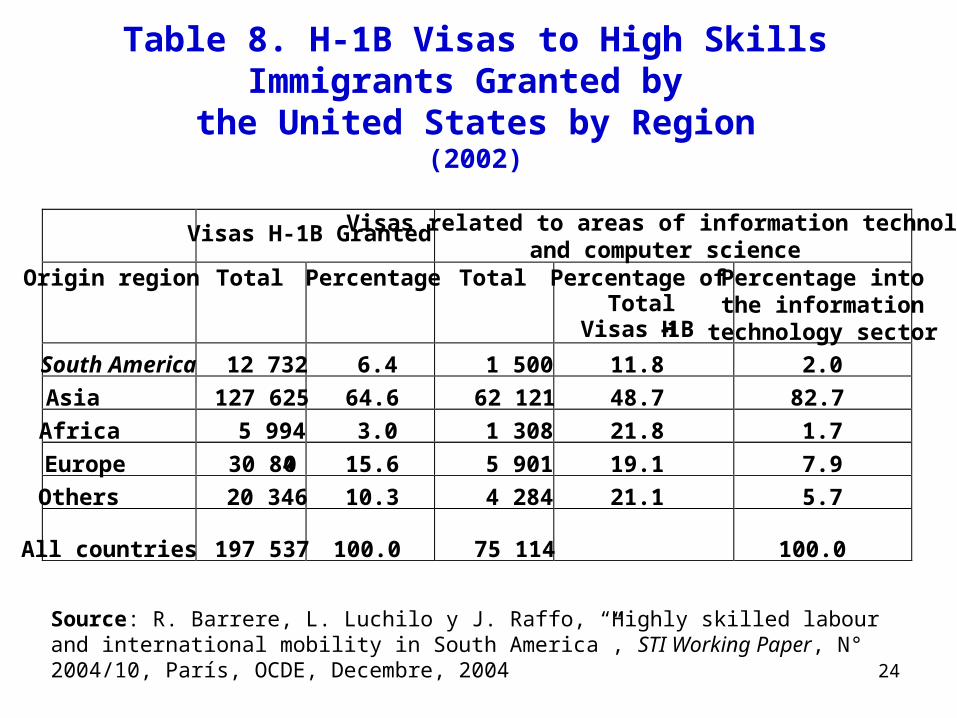
Table 8. H-1B Visas to High Skills Immigrants Granted by the United States by Region
(2002)
Source: R. Barrere, L. Luchilo y J. Raffo, “Highly skilled labour and international mobility in South America”, STI Working Paper, N° 2004/10, París, OCDE, Decembre, 2004
Visas H-1B Granted Visas related to areas of information technologyand computer science
Origin region Total Percentage Total Percentage of Total
Visas H-1B
Percentage intothe information
technology sector
South America 12 732 6.4 1 500 11.8 2.0
Asia 127 625 64.6 62 121 48.7 82.7
Africa 5 994 3.0 1 308 21.8 1.7
Europe 30 840 15.6 5 901 19.1 7.9
Others 20 346 10.3 4 284 21.1 5.7
All countries 197 537 100.0 75 114 100.0

25
Figure 1. Estimated value of offshore services offers in the World(billions of dollars, 2003)
Source: McKinsey&Company (2005), The Emerging Global Labor Market: Part III – How Supply and Demand for Offshore Talent Meet, June.

26
7.- Policy Issues How to promote circulation of talent toward developing
countries and transition economies to counteract “brain drain”.
Review rewards structure in the public and private sectors and identify obstacles to retaining and developing talent in developing countries and transition economies.
Policies oriented to increase connectiveness, compensation, retention. Critical areas: the Health Sector and Science and Technology.
Mobilization of Diaspora for national development.

27
Mobilizing Talent for Mobilizing Talent for Global DevelopmentGlobal Development
Andrés Solimano
Chairman, International Center for Globalization and Development, IGLOB
September , 2009

Reference
• Solimano, Andrés (2008), editor, The International Mobility of Talent. Causes, Types and Development Impact. Oxford University Press.
28