
1 Microclimate: an Alternative to Tree Vigor as a Basis ... Amman_Microclimate An...Microclimate: an...
16
1 '7 ( 1 u C ;)-. United States Department of Agriculture Forest Service Intermountain Research Station Research Paper INT-400 March 1989 Microclimate: an Alternative to Tree Vigor as a Basis for Mountain Pine Beetle Infestations Dale L. Bartos Gene D. Amman c. - .. .:- .. ...... ... . ' . ' , . 'f
Transcript of 1 Microclimate: an Alternative to Tree Vigor as a Basis ... Amman_Microclimate An...Microclimate: an...

1 '7( 1 u C ;)-. United States
Department of Agriculture
Forest Service
Intermountain Research Station
Research Paper INT-400
March 1989
Microclimate: an Alternative to Tree Vigor as a Basis for Mountain Pine Beetle Infestations Dale L. Bartos Gene D. Amman
c. -
.. .:-.. ...... ... . ' . ' ,
. 'f

AUTHORS
DALE L. BARTOS is an operations research analyst with the Mountain Pine Beetle Population Dynamics research work unit, Ogden, UT. He joined the unit in 1984 and is currently located in Logan, UT. Prior to assuming his current position, he was with the Intermountain Research Station as a member of the aspen ecosystem project for 12 years. He holds B.S. and M.S.degrees from Fort Hays Kansas State University, and a Ph.D. degree in range science from Colorado State University. His principle research interests are in systems modeling and ecological processes.
GENE D. AMMAN is Project Leader of the Mountain Pine Beetle Population Dynamics research work unit. He joined the unit in 1966. Prior to joining the Intermountain Station, he was research entomologist with the Forest Service's Southeastern Forest Experiment Station in Asheville, NC, doing biological control and ecological research on the balsam woolly adelgid. He began his Forest Service career with the Rocky Mountain Forest and Range Experiment Station in Fort Collins, CO, as research assistant on sampling populations and mortality factors of mountain pine beetle and spruce bark beetle. He has B.S. and M.S. degrees from Colorado State University and a Ph.D. degree from the University of Michigan.
RESEARCH SUMMARY
Microclimates of thinned and unthinned stands of lodgepole pine (Pinus contorta var. latifolia Engelm.) were monitored and related to mountain pine beetle (Oendroctonus ponderosae Hopkins [Coleoptera: Scolytidae]) response. Thinning lodgepole pine stands increased light intensity, wind movement, insolation, and temperature. Temperatures on the south exposure of tree trunks and of soil were significantly higher in thinned than unthinned stands. Light and wind also were higher in the thinned stand. Fewer mountain pine beetles (5 percent of the total) were caught in pheromone-baited traps in a thinned than in an adjacent unthinned stand. Percentage of trees killed by mountain pine beetle was only 2 percent in a thinned stand, compared to 16 percent in an adjacent unthinned stand.
The use of trade or firm names in this publication is for reader information and does not imply endorsement by the U.S. Department of Agriculture of any product or service.
Intermountain Research Station 324 25th Street
Ogden, UT 84401

Microclimate: an Alternative to Tree Vigor as a Basis for Mountain Pine Beetle Infestations
INTRODUCTION
Dale L. Bartos Gene D. Amman
Temperature is an important factor in the ecology of insects. It affects the physical conditions of habitats and the insects themselves (Wellington 1950). In the case of mountain pine beetle (MPB) (Dendroctonus ponderosae Hopkins [Coleoptera: Scolytidae]), observations were made on the effects of extremely high (Patterson 1930) and low temperatures (Somme 1964; Yuill 1941). Between the extremes is an optimum zone of temperature that may be modified by other microclimatic factors (Rudinsky 1962).
Thinning forests causes subtle changes not only in tree physiology (Nebeker and Hodges 1983) but also in incident radiation, temperature, light (Reifsnyder and Lull 1965), and windspeed. These changes brought about by thinning lodgepole pine (LPP) (Pinus contorta var. latifolia Engelm.) forests have profound effects on MPB activity (Schmitz and others, in press) resulting in reduced tree mortality in thinr.ed stands (McGregor and others 1987).
The silvicultural practice of thinning has been used in the past as a way of increasing tree vigor (Graham and Knight 1965; Keen 1958), which in turn should make the residual trees better able to resist attacks by MPB. The removal of large-diameter lodgepole pine, which are preferred by MPB, can also result in reductions in tree loss during epidemics (McGregor and others 1987). Reduced infestation by MPB occurs immediately following partial cutting of LPP stands (McGregor and others 1987) and before residual trees could express resistance due to increases in growth and vigor as measured by periodic growth ratios and growth efficiency (Amman and others 1988). This phenomenon suggests that factors other than vigor may be responsible for reduced MPB infestation.
Subtle changes in chemistry of residual trees following thinning of stands is one possibility. Biochemical responses detected by the beetles could cause them to avoid trees in thinnings. Nebeker and Hodges (1983) studied the effects of thinning and thinning-related injury to loblolly pine (P. taeda L.) by measuring oleoresin exudation pressure, electrical resistance, resin flow rate, total flow, and relative viscosity of resin. They found total flow and relative viscosity were significantly different by month and treatment, with the greatest increase in trees receiving only basal wounding. Matson and others (1987), also studying effects of thinning loblolly pine, found resin flow
rates, starch concentration in phloem tissue, relative growth, and bark and phloem thickness were greater in trees in thinned plots than trees in control or fertilized plots, 6 years after treatments were applied. Raffa and Berryman (1982) studied physiological differences between lodgepole pines resistant and susceptible to MPB and associated microorganisms. They found no relationship between resistance and daily rate of resin flow, rate ofresin crystallization, monoterpene content, monoterpene composition, or current growth rate. Resistant trees responded to artificial inoculation of fungi vectored by MPB by forming greater quantities of resin than susceptible trees. However, Peterman (1977), in a field test of the fungal inoculation method of distinguishing resistant and nonresistant trees, found the method ineffective. Therefore, we chose to explore the microclimate of the altered stand because (1) microclimate changes immediately following tree removal from the stand and (2) residual trees in the stands were slow to increase growth. The objective of this paper is to present microclimatic differences we observed between thinned and unthinned LPP stands and to discuss beetle behavior in response to these differences.
METHODS AND MATERIALS The study site is south of Mountain View, WY, on the
north slope of the Uinta Mountains in northeastern Utah, at an elevation of2,865 m. A thinned and an adjacent unthinned stand of LPP, both of which had current beetle infestation,were selected for study ofmicroclimatic differences. An additional thinned and an adjacent unthinned stand of LPP, both of which had no beetle infestation, were selected for study of beetle response to pheromonebaited traps.
Stand Characteristics Characteristics of the thinned and unthinned LPP
stands studied for microclimatic differences \vere determined through variable plot (10 BAF) cruising. Plots were 50 m apart in a grid pattern in each stand. Trees on the plot were tallied as live or dead by cause of death and were measured for diameter at breast height (d.b.h.). The dominant or codominant tree closest to plot center was

'1• .. .:~. .... . ~,· ;;_>. .. ~· .. 1r~~·.
Figure 1-Tower and surrounding instrumentation of 21X as it appeared in the field during the summer of 1986.
measured for height and crown length. Stand density was determined using basal area and number of trees per hectare.
Monitoring Microclimate
An automatic recording device (21X micrologger, Campbell Scientific) was used to measure the microclimatic factors (fig. 1) of temperature, incident solar radiation, windspeed, and wind direction for a 23-day period starting July 19, 1986. This time encompassed the peak MPB flight period, which occurred in the area on August 3, 1986 (Julian day 215) (Schmitz 1987). Equipment limitations dictated we could monitor a full complement of factors on only two trees--one in the thinned and one in the unthinned stand. Both trees were similar in height, crown length, and d.b.h. (about 23 em). Parameters were recorded every 15 minutes, with averages calculated hourly.
2
Temperature-Thermocouple psychrometers were connected to the micrologger to measure temperature at the following points on or near the sample trees:
1. At breast height, 1.4 m above ground, on the bark surface and immediately below the surface for both the north and south sides of the trees. The below-bark surface probe was positioned to measure temperature of the tree phloem. Phloem is the substrata in which MPB adults mine and lay eggs and also serves as the food source of developing larvae.
2. In the lower third of the crown on the bark surface, both on the north and south sides of the trees.
3. On the tower (about 3 m above ground) where the micrologger was situated. This sample area was to represent air temperature of the interspace of the stand.
Incident Solar Radiation-LI-COR quantum sensors were used to measure incident solar radiation. These sensors measure photosynthetically active radiation in the 400- to 700-nm waveband. Values reported were for the average energy flux density for the sampled period and are given in units of 1,000 )1. einsteinslm2/s. For both treatments, these solar sensors were placed in three locations: one on the tower, one at breast height on each sample tree, and one in the lower third of the crown. Solar sensors attached to the tree were placed on the north side.
Windspeed- Windspeed sensors were standard 3-cup anemometers, which were connected to the micrologger. Data were reported in units of kilometers per hour. Two sensors were placed in both the thinned and unthinned stands. One sensor was placed on the tower (about 3 m above ground), the other in the lower third of the crown of the sample tree.
Wind Direction-The lightweight wind direction sensor we used is an air-foil vane and a potentiometer, which produced an output that varies proportionally to the wind direction. Output was recorded in degrees and varied between 0 and 360°. This sensor was placed on the tower, which would allow minimum interference from the trees in each of the stands.
Stand Temperatures-Temperatures in the thinned and unthinned stands subjected to microclimate measurements were surveyed to obtain a random sample of temperatures between 10 a.m. and 2 p.m. on August 6, 1986. This period was selected to record maximum solar penetration into the stand. The survey was conducted on 10 transect lines 20 m apart; observations were made at 20-m intervals along these lines. Temperatures of the ground and the north and south sides of the living tree nearest to plot center were obtained with an infrared thermometer (Wahl Digital Heat Spy Model DHS-14). Tree temperatures were taken at breast height. Each survey line passed through both thinned and unthinned stands to avoid any large time lag (approximately 20 minutes used per line) that would have occurred if one stand had been completely surveyed before starting the survey of the other stand.

Beetle Response
Beetle response to thinned and unthinned stands was determined by using pheromone-baited traps in the general vicinity of the microclimate study. Three Lindgren funnel traps were hung in a thinned stand and three in an adjacent unthinned stand. Traps were 100 m apart within stands and 300 m apart between stands. Those stands were approximately 1 km north of the stands where microclimatic observations were made. There were no beetle-infested trees in the two stands at the time of trapping. The traps were baited \\-ith the standard MPB 1 ure (Phero Tech Inc.) consisting of trans-verbeno1, exobrevicomin, and myrcene. Beetles were collected from the traps weekly during a 3-week period, August 15 to September 5, 1985, the summer before microclimate observations were made. Beetles were taken to a laboratory where they were sexed and counted.
Data Analysis
Characteristics and temperatures of thinned and unthinned stands obtained during stand surveys were subjected to analysis of variance to test for significant differences. Statistical analysis of data from the micrologger was not possible because we had only enough equipment to monitor microclimate of one tree in each of the two stands. Therefore, we used a time series analysis system software package for microcomputers to manipulate various combinations of factors to show trends that exist between the thinned and unthinned stands, as well as within the sampled tree. The raw data were plotted, and a smoothing technique was used to reduce some of the inherent variation. We accomplished this smoothing by calculating a moving average of the raw data. These smoothed curves were better able to show consistent trends between similar factors than had previously been observed. Because the version of the program used would accept only 550 values, we used the hour averages to look at the overall trends for the 23 days. More variance was deleted from the curves when a larger time span (49 hours versus 5 hours) was used to obtain the smoothed average. Next, to see if we were masking detail, we used the 15-minute readings and plotted the 5 days that encompassed the peak flight period (Julian day 215). Finally, we plotted averaged smoothed data for the day that peak flight occurred (midnight to midnight).
RESULTS
We looked at the results in terms of stand characteristics, microclimate, and beetle response.
Stand Characteristics
Characteristics of the thinned stand in which microclimate was observed were an average basal area of22.1 m2
/ ha, a density of 707.8 treeslha, and an average diameter of20.2 em. Dominant and codominant trees averaged 15.1 min height, with live crown 52 percent of total height. In contrast, the adjacent unthinned stand had a
3
basal area of 37.0 m2/ha, a density of 1,090.1 treeslha, and an average diameter of 18.6 em. Dominant and codominant trees averaged 15.1 min height, with live crown 53 percent of total height (table 1). Of these stand characteristics, only the stand density measures of basal area and trees per hectare were significantly different between stands (P <0.05).
Stand Microclimate Temperature (23 Days)-Curves for a 23-day period
obtained via smoothing raw data appeared similar between the south and north sides of the sampled tree at breast height in the thinned stand. The average temperature varied between 9 °C at the beginning of the 23 days to a high of approximately 18 °C around August 5, 1986. Both sets of curves show close correlation between the surface and phloem temperatures. However, a slight separation (0.5 °C) was noticed for the south side of the tree.
Similar traces were observed between the thinned and unthinned stand. Subsurface temperatures reflect what occurs on the bark surface but with slightly less magnitude. The phloem curve for the south side in the thinned stand was consistently 1 to 2 °C higher than the phloem curve in the unthinned stand (fig. 2A), while the surface temperature on the south side in the thinned stand (fig. 2B) responded with a 1 to 3 °C greater difference from that in the unthinned stand.
Less difference was observed between the thinned and unthinned stands when comparisons were made on the north side of the sampled trees. Traces of the curves on the north side were similar to those on the south side. However, as expected, the south side was consistently 3 to 4 °C higher. On the north side, curves for the phloem temperature mimicked the surface temperature, and a difference ofless than 0.5 °C between the thinned and unthinned stand was observed.
Temperature (5 Days)-Smoothing over a 5-day period was done to express more detail for any one 24-hour period. This information was partially masked when smoothing was done for the full 23 days. Initially, we looked at pairs of curves showing within-tree differences at breast height in both treatments. Similar responses were observed, and figure 3 shows the various combinations. Over a 24-hour period, there is a reversal in dominance of the two temperature curves. From early afternoon through late evening, surface temperature is warmer than phloem temperature, but for the rest of the period it is just the opposite. These trends are consistent from day to day over the 5 days. At the point of maximum separation, there is <0.5 °C difference. We see much more separation in the averaged temperature curves (fig. 4) when we make comparisons between the same sample points for the two treatments. This information is an elaboration of the previous figure 2B. The thinned stand always had the higher temperature. The difference ranged from 2 to 3.5 °C, and the biggest difference occurred during the hottest part of the day.

Table 1-Some average characteristics of the thinned and unthinned stands monitored for microclimatic differences (includes trees 12.7 em and larger d.b.h.) in northern Utah
Lodgepole pine per hectare
Plot1 Live Dead
- - - - - - - No. - - - - - - - -
1 426.3 0.0 2 526.1 .0 3 805.7 .0 4 812.0 .0 5 888.6 70.9 6 744.3 .0 7 670.4 70.9 8 641.2 .0 9 901.4 .0
10 519.9 .0
Average 693.6 14.2
1 0.0 343.0 2 .0 536.7 3 557.2 316.5 4 467.3 158.1 5 1,502.4 .0 6 1,763.3 .0 7 1,739.9 .0 8 1,638.8 135.9 9 706.5 151.7
10 784.1 98.8
Average 916.0 174.1
'Variable plot using a basal area factor 10-angle gauge.
0 (/) Q) Q)
0, Q)
0
~weighted averages.
20
Killed by MPB
Percent
0.0 .0 .0 .0
7.4 .0
9.6 .0 .0 .0
2.0
100.0 100.0 36.2 25.3
.0
.0
.0 7.7
17.7 11.2
16.0
225
Basal area
wlha
Thinned
20.7 11.5 20.7 20.7 20.7 23.0 23.0 25.3 32.1 23.0
22.1
Unthinned
20.7 29.8 34.4 25.3 39.0 56.0 43.6 52.8 34.4 34.4
37.0
0 (/) Q) Q)
0, Q)
0
20
Diameter at Dominant/ breast height codominant
Live Dead height
- - - - - em - - - - - - Meters
24.4 13.7 17.0 14.6 17.5 13.7 17.9 14.6 17.3 20.6 15.5 19.9 14.3 20.5 20.3 14.6 22.1 17.4 21.3 17.7 23.6 14.6
2 19.8 220.5 15.1
27.4 14.3 25.9 15.2
19.3 25.4 14.0 22.6 23.4 15.9 17.3 16.5 14.2 15.2 16.3 14.3 18.0 24.9 13.7 20.6 26.9 16.5 21.1 28.7 15.2
2 17.6 2 23.8 15.1
215
Julian Days Julian Days
Figure 2-Smoothed curves for a 23-day period contrasting phloem (A) and bark surface (B) temperatures on the south side of two lodgepole pine trees between a thinned and unthinned stand.
4
Crown length, percentage
of total height
Percent
44 38 69 52 51 38 67 60 53 52
52
68 80 52 35 46 28 43 42 67 72
53

()
(/) 0 Q)
OJ Q)
0
25r----------------- --,
0~~--------------~------------------~ 215 217 213
Julian Days
Figure 3-Smoothed curves for a 5-day period contrasting phloem and bark surface temperatures on the south side of a lodgepole pine tree in a thinned stand
Temperature (1 Day)-More details are shown when smoothing is done over a 24-hour period. Three typical curves (fig. 5) are shown for temperatures recorded on the north side of the sample trees at breast height. First, we see a reversal in dominance between surface and phloem temperatures both in the thinned stand (fig. SA) and the unthinned stand (fig. 5B). :Magnitude varies between 0 and 7 °C. After sunrise, there is a reversal in the temperature curves, \vjth the phloem temperature higher than the surface temperature. The surface heat buildup accelerates, and by afternoon surface temperature again becomes dominant and remains so until the follO\vjng morning.
Taking this comparison further, we contrasted the phloem temperature curves for the thinned and unthinned stands (fig. 5C). During late afternoon, there was a peak difference of 8 °C, while during the remainder of the day the two smoothed curves are quite similar. The thinned stand had more heat building up in the phloem than did the unthinned stand.
Solar (23 days)-lncident solar radiation is a measure of the amount of sunlight that strikes the tree surface or forest floor and was expected to be strongly correlated ~th temperature recorded for various points on or near the sampled trees.
The hourly averages for incoming solar radiation were smoothed to show the daily solar curve for the 23 days. Marked differences in solar radiation were observed between the thinned and unthinned stand at breast height (fig. 6A), while not so striking a difference was shown for the sensors placed on the towers (fig. 6B). It may be hard to interpret trends seen here, particularly those at breast height, because sensors placed on the trees were influenced by occasional shade from various parts of the sample tree. Therefore, the tower sensors were included to serve as a reference for incoming solar radiation.
5
()
(/) Q) Q)
OJ Q)
0
213 215
Ju ian Days
Figure 4-Smoothed curves for a 5-day period contrasting bark surface temperatures on the south side of two lodgepole pine trees between a thinned and unthinned stand.
The spread in the values obtained on the trees at breast height was greater than the values obtained from the tower. Therefore, it is assumed that shading is playing a part in the measurement of the factors in figure 6A.
Solar (5 Days)-The daily solar radiation curves smoothed over a 5-day period more explicitly showed the separation we observed earlier (fig. 6A and 6B). Less separation was observed in the two smoothed curves at breast height near the sampled trees when compared to the amount of sunlight striking the sensors on the instrument towers. These differences reflect, in part, placement of the sensors in the stands. Those sensors in the interspaces (on the towers) are probably more representative of measured incident solar radiation ~thin the stands.
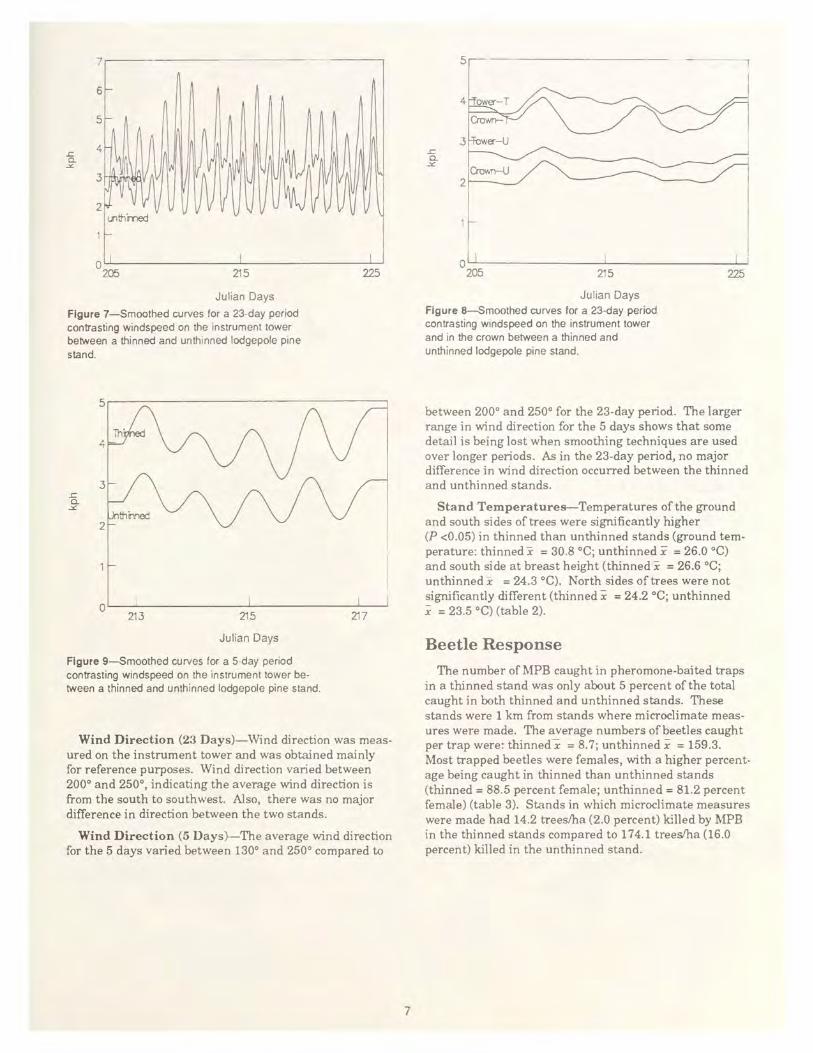
Windspeed (23 days)-Windspeed was not smoothed as much as the previously mentioned factors. This allowed some of the variance to remain in the data to more clearly show trends. During a 24-hour period, ~ndspeed as measured on the tower varied between 1.6 and 5.6 kmlh (fig. 7). The thinned stand had higher ~ndspeed than the unthinned stand. The average (or overall) difference was only about 1.6 km/h. However, during the period of most MPB flight, between 4 and 6 p.m. (Rasmussen 1974), the difference was consistently 3.2 or more km/h.
Most \vjnd movement occurred at the tower in the thinned stand, while the least movement was ~thin the crown in the unthinned stand. Windspeed varied between 1.6 and 4.8 km/h (fig. 8).
Windspeed (5 Days)-Consistency resulted between the thinned and unthinned smoothed curves (fig. 9) for ~ndspeed on the instrument tower. This set of curves was very unifonn for the 5 days. However, smoothed averages for the difference between the two curves varied from 1.0 to 1.6 km/h.

()
(/) (!) (!)
0, (!)
0
()
(/) (!) (!)
0, (!)
0
'E Ui c
'Qj
en c
'Qj
:::1. 0 0 0
25.-----------------------------------,
A
Hour
25.-----------------------------------~
c
Hour
0.1
225
Julian Days
()
(/) (!) (!)
0, (!)
0
25r---------------------------------~
B
600 1200 1800
Hour
Figure 5--Smoothed curves for a 24-hour period (August 3, 1986). Temperatures at breast height on the north side of the tree are contrasted between (A) bark surface and phloem-thinned; (B) bark surface and phloem-unthinned; and (C) thinned and unthinned phloem.
0.3.-----------------------.,
(/)
~ (/)
c 'Qj
en c
'Qj
:::1. 0 0.1 0 0
Julian Days
Figure 6-Smoothed curves for a 23-day period contrasting breast height (A) and tower (B) solar radiation between a thinned and unthinned lodgepole pine stand.
6
..r:::. 0..
..:£.
7r------------------------
Ju lian Days Figure 7-Smoothed curves for a 23-day period contrasting windspeed on the instrument tower between a thinned and unthinned lodgepole pine stand.
0~--~------------~--------------L---217 213 215
Julian Days
Figure 9-Smoothed curves for a 5-day period contrasting windspeed on the instrument tower between a thinned and unthinned lodgepole pine stand.
Wind Direction (23 Days)-Wind direction was measured on the instrument tower and was obtained mainly for reference purposes. Wind direction varied between 200° and 250°, indicating the average wind direction is from the south to southwest. Also, there was no major difference in direction between the two stands.
Wind Direction (5 Days)-The average wind direction for the 5 days varied between 130° and 250° compared to
7
5.-----------------------
Julian Days Figure 8-Smoothed curves for a 23-day period contrasting windspeed on the instrument tower and in the crown between a thinned and unthinned lodgepole pine stand.
- --- --, I
between 200° and 250° for the 23-day period. The larger range in wind direction for the 5 days shows that some detail is being lost when smoothing techniques are used over longer periods. As in the 23-day period, no major difference in wind direction occurred between the thinned and unthinned stands.
Stand Temperatures-Temperatures of the ground and south sides of trees were significantly higher (P <0.05) in thinned than unthinned stands (ground temperature: thinned x = 30.8 °C; unthinned x = 26.0 °C) and south side at breast height (thinned x = 26.6 °C; unthinnedx = 24.3 °C). North sides oftrees were not significantly different (thinned x = 24.2 oc; unthinned x = 23.5 °C) (table 2).
Beetle Response
The number of MPB caught in pheromone-baited traps in a thinned stand was only about 5 percent of the total caught in both thinned and unthinned stands. These stands were 1 km from stands where microclimate measures were made. The average numbers of beetles caught per trap were: thinnedx = 8. 7; unthinned x = 159.3. Most trapped beetles were females, with a higher percentage being caught in thinned than unthinned stands (thinned= 88.5 percent female; unthinned = 81.2 percent female) (table 3). Stands in which microclimate measures were made had 14.2 trees/ha (2.0 percent) killed by MPB in the thinned stands compared to 174.1 treeslha (16.0 percent) killed in the unthinned stand.

Table 2-Tree and soil temperatures (0 C} in thinned and unthinned lodgepole pine stands obtained by infrared thermometer, August 13, 1985, in northern Utah
Thinned
Characteristic Number1 Min. Max. Mean2
Soil 50 16 58 30.8a Tree north side 50 13 31 24.2a Tree south side 50 15 45 26.6a
'Number of observations in each stand. 2Means in rows followed by different letters significantly different (P<O.OS).
Stand condition
Set
10.5 3.8 5.6
Min.
14 17 17
Unthinned
Max. Mean
45 26.0b 30 23.5a 33 24.3b
Sd
6.8 3.1 3.8
Table 3-Numbers of mountain pine beetles caught August 21 to September 5, 1985, in Lindgren traps baited with mountain pine beetle lure and placed in thinned and unthinned lodgepole pine stands in northern Utah
Males Females Total
Trap No. No. Percent No. Percent No. Percent
Thinned
1 0 0.0 3 2 1 25.0 3 3 2 10.5 17
Total 3 11.5 23
Unthinned
1 34 18.1 2 41 19.5 3 15 18.8
Total 90 18.8
DISCUSSION Our discussion centers on the three areas outlined in
the Results section.
Stand Characteristics
The principal difference between the thinned and unthinned stands used in this microclimatic study was the two measures of density. Basal area was 14.9 m 2/ha and numbers of trees 382.3/ha less in the thinned than in the unthinned stand. The average diameters of trees in both thinned and unthinned stands did not differ significantly. The difference in density appears to be responsible for the differences in microclimate in the two stands.
154 169 65
388
8
100.0 3 75.0 4 89.5 19
88.5 26 5.2
81.9 188 80.5 210 81.2 80
81.2 478 94.8
Stand Microclimate Microclimatic observations showed consistent differ
ences between the thinned and unthinned stands. Thinning lodgepole pine stands results in increased light intensity, wind movement, insolation, and temperature. These factors, either separately or in various combinations, appear to affect MPB activity. The differences observed between thinned and unthinned stands are sometimes quite subtle. However, even minor changes in microclimate could have profound effects on MPB.

The higher temperatures on south sides of trees in thinned stands could be a deterrent to MPB landing and boring into the bark. In our study, south-side temperatures between 10 a.m. and 2 p.m. averaged 2.3 °C higher than those on north sides, with the maximum temperature 12 °C higher in the thinned than unthinned stand. Powell (1967) reported subcortical temperatures were occasionally 35 °C or higher on south sides. Beetles emerge at a greater rate from south than north sides of trees (Safranyik and Jahren 1970). North-side temperatures in thinnings in our study would not have been a deterrent to beetle infestation and offer more favorable physical environment than south-side temperatures for attacking MPB. Beetle attack densities are higher on north sides (Reid 1963; Shepherd 1965), and when trees are strip-attacked, the attacks usually occur on north and east sides (Mitchell and others 1983).
The effect of temperature could be more subtle than a direct inhospitable physical environment on south sides of trees. Mountain pine beetles may have evolved behavior to avoid situations where their brood are not likely to survive. In thinned stands, where tree temperatures are a few degrees above those of trees in unthinned stands, MPB may proceed too far in their development before winter, thus entering winter in stages that are susceptible to freezing-for example, the pupal stage as observed by Reid (1963) and Amman (1973).
Another way that MPB behavior may be affected by thinning is through the disruption of the pheromone communication system. More sunlight penetrated the canopy in the thinned than unthinned stands, resulting in significantly higher soil temperatures. The increased soil temperatures, which averaged 4.8 °C higher in the thinned than in the unthinned stand in this study, increase convection currents (Rosenberg and others 1983) and air turbulence that could disrupt pheromone plumes andresultant MPB communication. In addition, windspeed is greater in thinned than unthinned stands, thus possibly further complicating pheromone communications by MPB. Beetle response to pheromones is more predictable at windspeeds under 5 kmlh, but a few beetles flew at 7.5 kmlh (Gray and others 1972). Twice as many males as females flew at windspeeds in excess of 4 km/h.
In dense stands sunlight is absorbed by the upper levels of the tree canopy that in turn heats the surrounding air, creating instability in the air within the upper canopy. This creates an inversion in the stem zone that is characterized by more stable air (Chapman 1967; Fares and others 1980). Inversions tend to be more pronounced in dense stands than in sparse ones (Fares and others 1980; Fritschen 1984). Aerosol movement below a dense canopy on a sunny day is trapped beneath the canopy until it flows to a point where the canopy is less dense or has an opening (Fares and others 1980). Solar energy penetrating through canopy openings to the forest floor heats the ground and adjacent air, which becomes buoyant and rises through the canopy opening, carrying the aerosol with it (Fares and others 1980). The aerosol or pheromone plume would be torn apart in the faster, more turbulent air currents above the canopy. Therefore, when MPB infest a tree in a recently thinned stand, canopy density usually is insufficient to trap the pheromone and
9
move it horizontally to attract other beetles. Rather, the pheromone rises through the canopy on convection currents and is dispersed above the canopy. Schmitz and others (in press) concluded that most MPB fly in the bole area beneath the canopy where the pheromone communication system would be most effective.
When MPB do infest a tree in a thinned stand oflodgepole pine, usually only the single tree is infested, and occasionally a nearby tree when spacing is not maintained. The openness of the stand causes convection currents created by solar insolation to transport the pheromone plume around infested trees vertically out of the stand rather than horizontally. Thus, the infestation of other trees would be dependent on the degree of thinning. Older thinnings will probably provide a suitable environment for MPB. As the thinned stand matures, shade will increase and light and temperature decrease because of increased crown size, development of a shrub and young tree layer, and failure oflimbs to prune. Therefore, stand microclimate will likely become conducive to beetle infestation before tree competition becomes severe.
Beetle Response Mountain pine beetle response to baited funnel traps
was much less in an uninfested thinned than in an uninfested unthinned stand located 1 km from stands that contained weather instruments, with only about 5 percent of total beetles caught in the thinned stand. Beetles may have passed through the thinned stand without detecting a point source of aggregative pheromone. Beetle abundance was also reflected in the percentage of trees killed, which was much less (2 percent) in the thinned stand than in the unthinned stand (16 percent) where weather instruments were located. Schmitz and others (in press) caught fewer beetles in passive traps in heavily thinned than in lightly thinned and check stands in Montana, and McGregor and others (1987) found significantly fewer infested trees in heavily thinned than in lightly thinned and check stands. Because air temperatures in thinned and unthinned stands are about the same, beetles may sense the difference in light intensity or the greater air turbulence in thinned stands and avoid the open stand. Light could serve as an integrator of other micrometeorological features such as temperature, humidity, and air turbulence. Shepherd (1966) showed in laboratory studies that MPB increased attempts to fly as light intensity and temperature increased.
Our observations suggest microclimate could play a significant role in MPB behavior in lodgepole pine stands. Infestation risk of managed LPP stands possibly could be assessed by monitoring stand microclimate, specifically light. If microclimate changes are responsible for keeping beetles at low levels or completely out of thinned stands, forest managers could use such information to write stand management prescriptions to minimize beetle infestation. As crown closure begins to occur in partial cut or thinned stands, a favorable microclimate may occur and invite beetle attack, regardless oftree vigor. Additional studies are needed of MPB infestation in thinned stands to determine more definitively microclimatic thresholds ofMPB infestation and the association of thresholds with tree vigor levels.

REFERENCES Amman, G. D. 1973. Population changes of the mountain
pine beetle in relation to elevation. Environmental Entomology. 2: 541-547.
Amman, G. D.; McGregor, M.D.; Schmitz, R. F.; Oakes, R. D. 1988. Susceptibility oflodgepole pine to infestation by mountain pine beetles following partial cutting of stands. Canadian Journal of Forest Research. 18: 688-695.
Chapman, J. A. 1967. Response behavior ofscolytid beetles and odour meteorology. Canadian Entomologist. 99: 1132-1137.
Fares, Y.; Sharpe, P. J. H.; Magnuson, C. E. 1980. Pheromone dispersion in forests. Journal of Theoretical Biology. 84: 335-359.
Fritschen, L. J. 1984. Air circulation in forested areas: Effect on aerial application of materials. In Garner, W. Y.; Harvey, J., eds. Chemical and biological controls in forestry: Proceedings; 1983 March 20-25; Seattle, WA. Amer. Chern. Soc. Symp. Ser. 238. Washington, DC: American Chemical Society: 175-190.
Graham, S. A.; Knight, F. B. 1965. Principles afforest entomology. New York: McGraw-Hill. 417 p.
Gray, B.; Billings, R. F.; Gara, R.I.; Johnsey, R. L. 1972. On the emergence and initial flight behavior of the mountain pine beetle, Dendroctonus ponderosae, in eastern Washington. Zeitschrift fuer Angewandte Entomologie. 71: 250-259.
Keen, F. P. 1958. Progress in bark beetle control through silviculture in the United States. Tenth Inti. Congr. Entomol. Proc. 4(1956): 171-180.
Matson, P. A.; Hain, F. P.; Mawby, W. 1987. Indices of tree susceptibility to bark beetles vary with silvicultural treatment in a loblolly pine plantation. Forest Ecology and Management. 22: 107-118.
McGregor, M.D.; Amman, G. D.; Schmitz, R. F.; Oakes, R. D. 1987. Partial cutting lodgepole pine stands to reduce losses to the mountain pine beetle. Canadian Journal of Forest Research. 17: 1234-1239.
Mitchell, R. G.; Martin, R. E.; Stuart, J. 1983. Catfaces on lodgepole pine-fire scars or strip kills by the mountain pine beetle? Journal of Forestry. 81: 598-601, 613.
Nebeker, T. E.; Hodges, J.D. 1983. Influence offorestry practices on host-susceptibility to bark beetles. Zeitschrift fuer Angewandte Entomologie. 96: 194-208.
Patterson, J. E. 1930. Control of the mountain pine beetle in lodgepole pine by the use of solar heat. Tech. Bull. 195. Washington, DC: U.S. Department of Agriculture, Forest Service. 20 p.
Peterman, R. L. 1977. An evaluation of the fungal inoculation method of determining the resistance oflodgepole pine to mountain pine beetle (Coleoptera: Scolytidae) attacks. Canadian Entomologist. 109: 443-448.
10
Powell, J. M. 1967. A study ofhabitat temperatures of the bark beetle, Dendroctonus ponderosae Hopkins, in lodgepole pine. Agricultural Meteorology. 4: 189-201.
Raffa, K. F.; Berryman, A. A. 1982. Physiological differences between lodgepole pines resistant and susceptible to the mountain pine beetle and associated microorganisms. Environmental Entomology. 11: 486-492.
Rasmussen, L.A. 1974. Flight and attack behavior of mountain pine beetles in lodgepole pine of northern Utah and southern Idaho. Res. Note INT-180. Ogden, UT: U.S. Department ofAgriculture, Forest Service, Intermountain Forest and Range Experiment Station. 7 p.
Reid, R. W. 1963. Biology of the mountain pine beetle, Dendroctonus monticolae Hopkins, in the east Kootenay region ofBritish Columbia. III. Interaction between the beetle and its host, with emphasis on brood mortality and survival. Canadian Entomologist. 95: 225-238.
Reifsnyder, W. E.; Lull, H. W. 1965. Radiant energy in relation to forests. Tech. Bull. 1344. Washington, DC: U.S. Department of Agriculture, Forest Service. 111 p.
Rosenberg, N.J.; Blad, B. L.; Verma, S. B. 1983. Microclimate: the biological environment. New York: John Wiley & Sons. 315 p.
Rudinsky, J. A. 1962. Ecology ofScolytidae. Review of Applied Entomology. 7: 327-348.
Safranyik, L.; Jahren, R. 1970. Emergence patterns of the mountain pine beetle from lodgepole pine. Canadian Department of Fisheries and Forestry Bi-monthly Research Notes. 26: 11, 19.
Schmitz, Richard F. 1987. [Personal communication] Ogden, UT: U.S. Department of Agriculture, Forest Sevice, Intermountain Research Station, Forestry Sciences Laboratory.
Schmitz, R. F.; McGregor, M.D.; Amman, G. D.; Oakes, R. D. [In press]. Effect of partial cutting treatments of lodgepole pine on the abundance and behavior offlying mountain pine beetles. Canadian Journal of Forest Research.
Shepherd, R. F. 1965. Distribution of attacks by Dendroctonus ponderosae Hopk. on Pinus contorta Dougl. var. latifolia Engelm. Canadian Entomologist. 97: 207-215.
Shepherd, R. F. 1966. Factors influencing the orientation and rates of activity of Dendroctonus ponderosae Hopkins (Coleoptera: Scolytidae). Canadian Entomologist. 98: 507-518.
Somme, L. 1964. Effects of glycerol on cold-hardiness in insects. Canadian Journal of Zoology. 42:87-101.
Wellington, W. G. 1950. Effects of radiation on the temperatures ofinsectan habitats. Scientific Agriculture. 30: 209-234.
Yuill, J. S. 1941. Cold hardiness of two species ofbark beetles in California forests. Journal ofEconomic Entomology. 34: 702-709.


Bartos, Dale L; Amman, Gene D. 1989. Microclimate: an alternative to tree vigor as a basis for mountain pine beetle infestations. Res. Pap. INT-400. Ogden, UT: U.S. Department of Agriculture, Forest Service, Intermountain Research Station. 10 p.
Thinning lodgepole pine stands increased light intensity, wind movement, insolation, and temperature. Temperatures on the south exposure of tree trunks and of soil were significantly higher in thinned than unthinned stands. Light and wind also were higher in the thinned stand. Fewer mountain pine beetles were caught in pheromone-baited traps in a thinned than in an adjacent unthinned stand. Percentage of trees killed by mountain pine beetle was only 2 percent in a thinned stand compared to 16 percent in an adjacent unthinned stand.
KEYWORDS: Pinus contorta, Dendroctonus ponderosae, pheromone, lodgepole pine
INTERMOUNTAIN RESEARCH STATION
The Intermountain Research Station provides scientific knowledge and technology to improve management, protection, and use of the forests and rangelands of the Intermountain West. Research is designed to meet the needs of National Forest managers, Federal and State agencies, industry, academic institutions, public and private organizations, and individuals. Results of research are made available through publications, symposia, workshops, training sessions, and personal contacts.
The Intermountain Research Station territory includes Montana, Idaho, Utah, Nevada, and western Wyoming. Eighty-five percent of the lands in the Station area, about 231 million acres, are classified as forest or rangeland. They include grasslands, deserts, shrublands, alpine areas, and forests. They provide fiber for forest industries, minerals and fossil fuels for energy and industrial development, water for domestic and industrial consumption, forage for livestock and wildlife, and recreation opportunities for millions of visitors.
Several Station units conduct research in additional western States, or have missions that are national or international in scope.
Station laboratories are located in:
Boise, Idaho
Bozeman, Montana (in cooperation with Montana State University)
Logan, Utah (in cooperation with Utah State University)
Missoula, Montana (in cooperation with the University of Montana)
Moscow, Idaho (in cooperation with the University of Idaho)
Ogden, Utah
Provo, Utah (in cooperation with Brigham Young University)
Reno, Nevada (in cooperation with the University of Nevada)
USDA policy prohibits discrimination because of race, color, national origin, sex, age, religion, or handicapping condition. Any person who believes he or she has been discriminated against in any USDA-related activity should immediately contact the Secretary of Agriculture, Washington, DC 20250.
il" U.S. GOVERNMENT PRINTING OFFICE: 1989-RI-065-89/3102


