1 Math 10 Part 5 Slides Confidence Intervals © Maurice Geraghty, 2009.
39
1 Math 10 Part 5 Slides Confidence Intervals © Maurice Geraghty, 2009
-
Upload
juliana-turner -
Category
Documents
-
view
213 -
download
0
Transcript of 1 Math 10 Part 5 Slides Confidence Intervals © Maurice Geraghty, 2009.
1
Math 10
Part 5 SlidesConfidence Intervals
© Maurice Geraghty, 2009
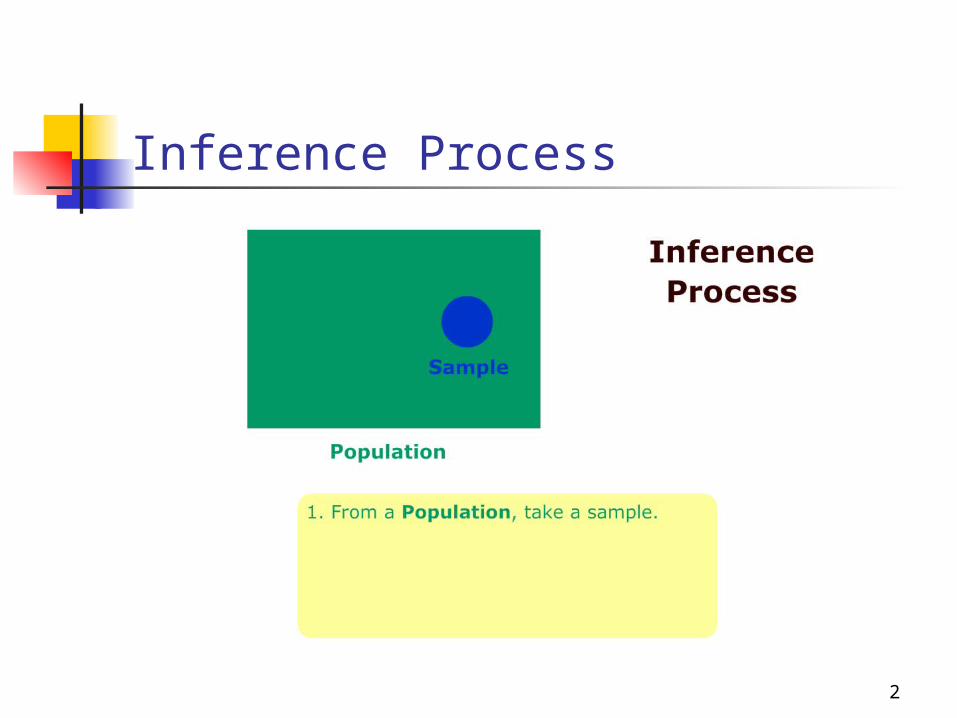
Inference Process
2

Inference Process
3
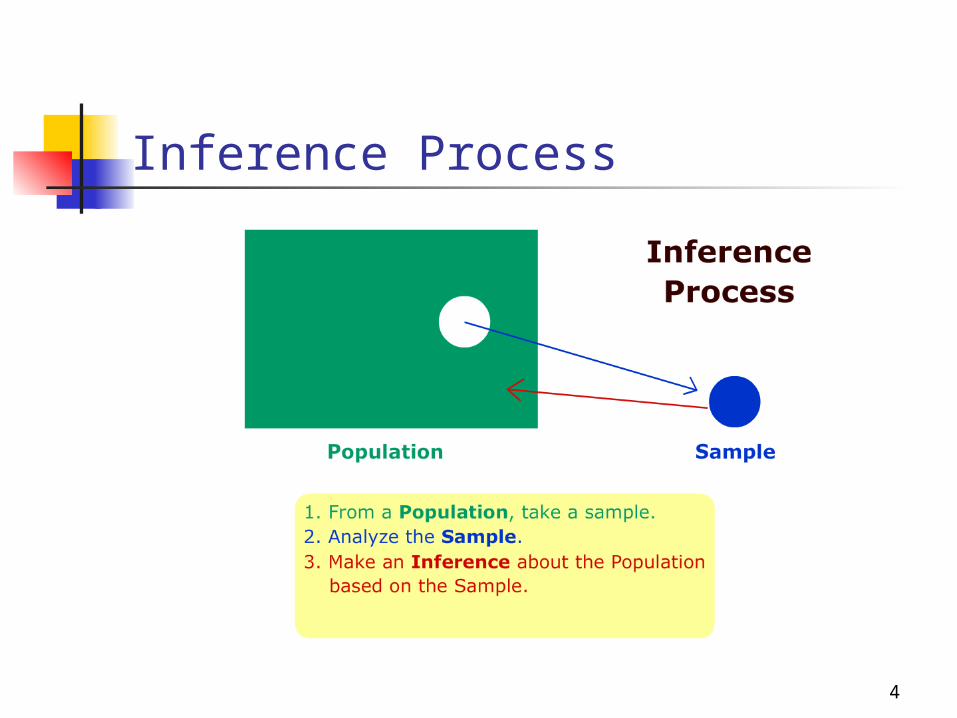
Inference Process
4
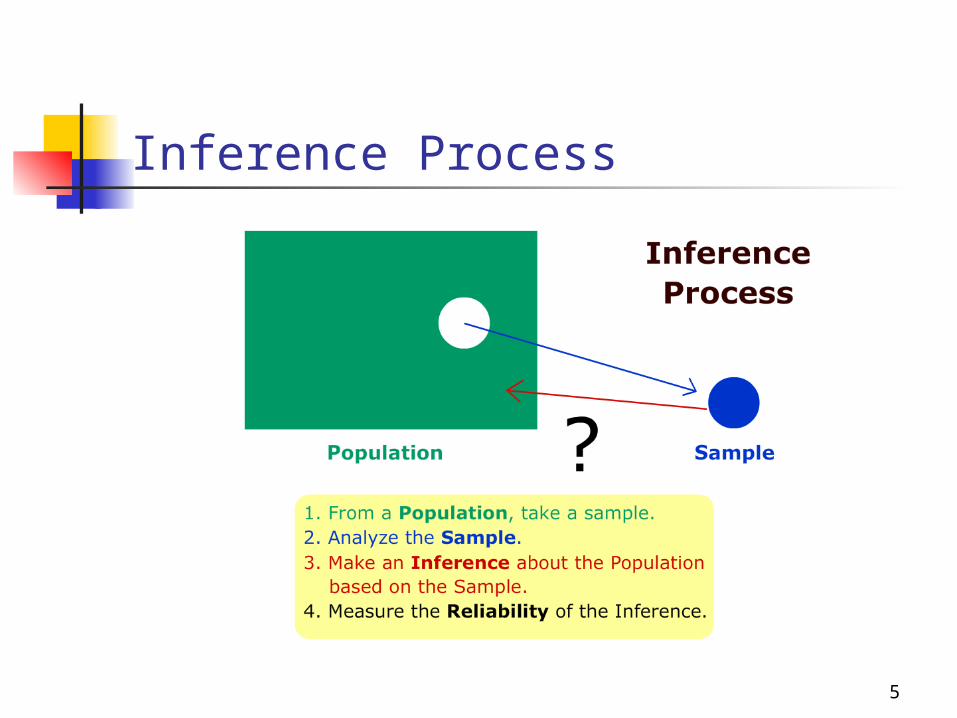
Inference Process
5

6
Inferential Statistics Population Parameters
Mean = Standard Deviation =
Sample Statistics Mean = Standard Deviation = s
X
7
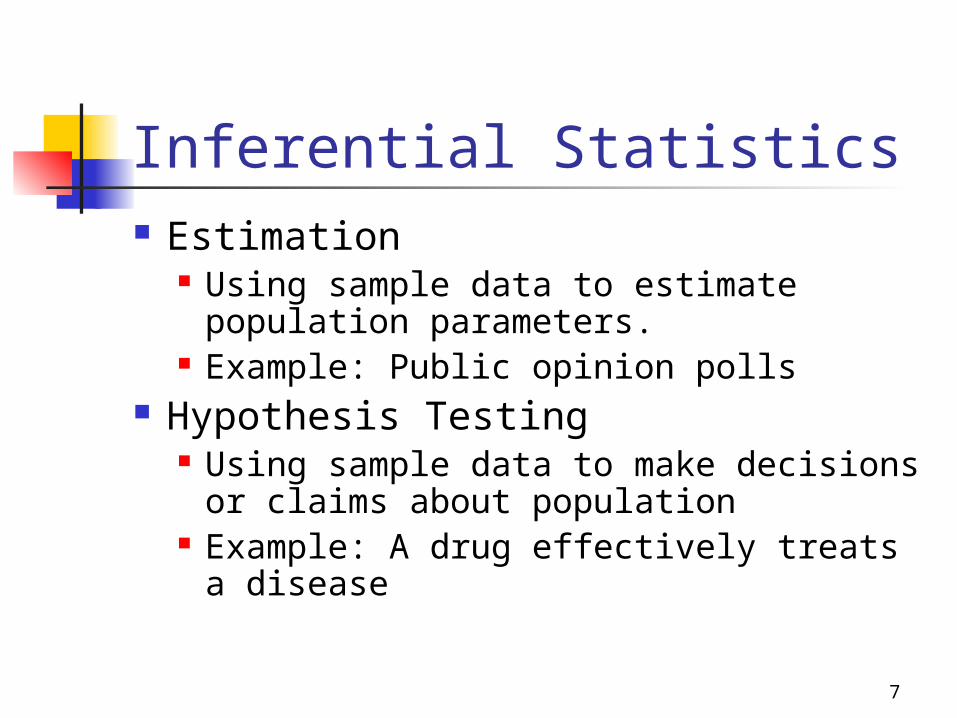
Inferential Statistics Estimation
Using sample data to estimate population parameters.
Example: Public opinion polls Hypothesis Testing
Using sample data to make decisions or claims about population
Example: A drug effectively treats a disease

8
Estimation of is an unbiased point estimator of
Example: The number of defective items produced by a machine was recorded for five randomly selected hours during a 40-hour work week. The observed number of defectives were 12, 4, 7, 14, and 10. So the sample mean is 9.4.
Thus a point estimate for , the hourly mean number of defectives, is 9.4.
X
9
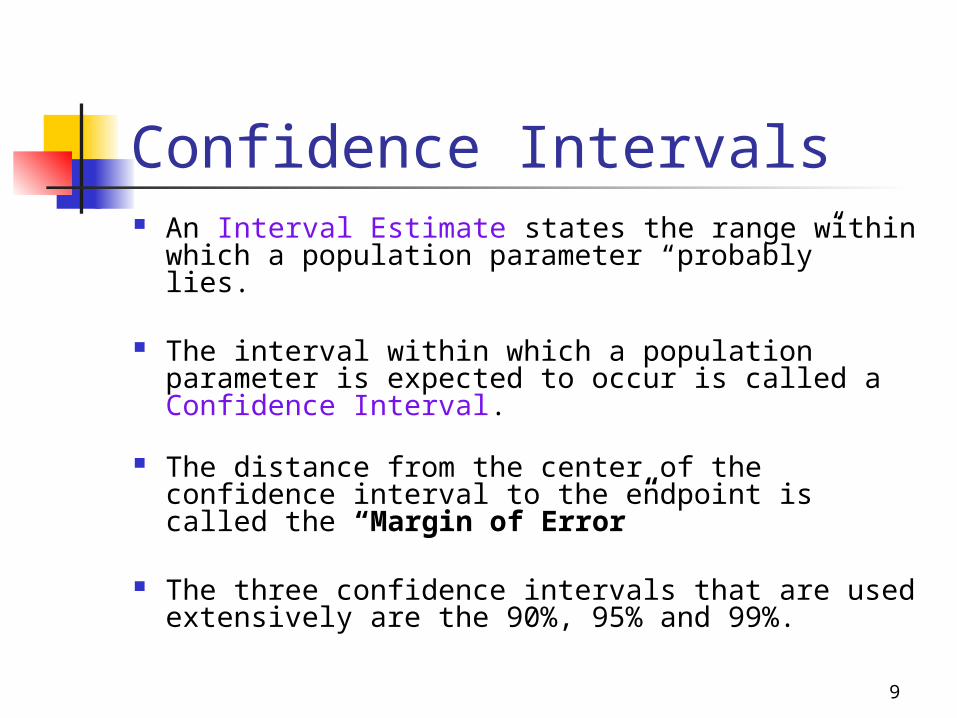
Confidence Intervals An Interval Estimate states the range within
which a population parameter “probably” lies.
The interval within which a population parameter is expected to occur is called a Confidence Interval.
The distance from the center of the confidence interval to the endpoint is called the “Margin of Error”
The three confidence intervals that are used extensively are the 90%, 95% and 99%.
10
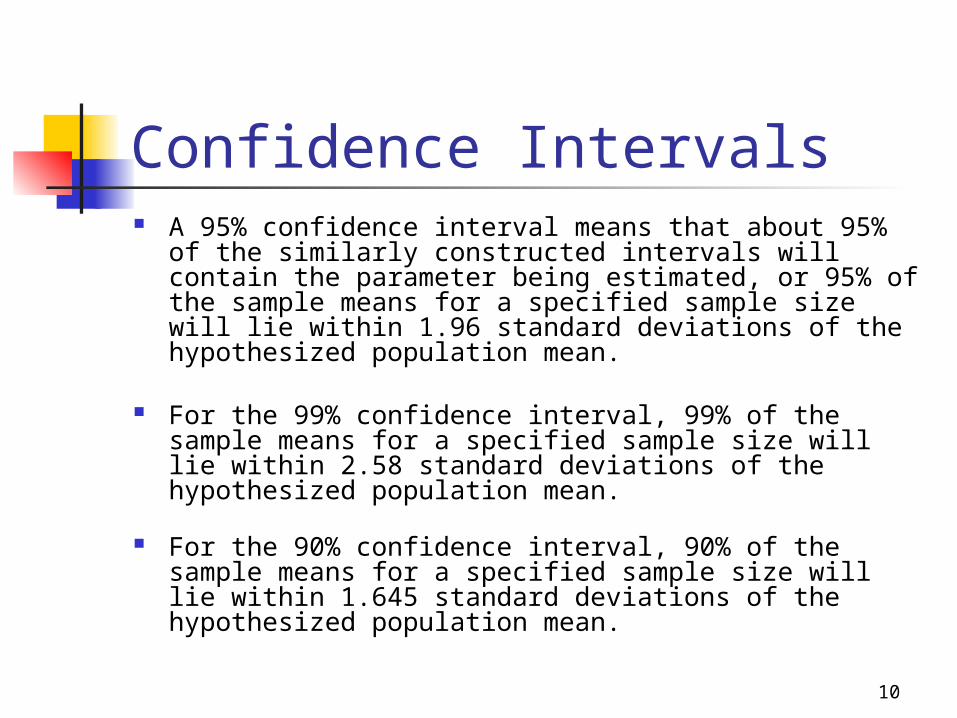
Confidence Intervals A 95% confidence interval means that about 95% of the
similarly constructed intervals will contain the parameter being estimated, or 95% of the sample means for a specified sample size will lie within 1.96 standard deviations of the hypothesized population mean.
For the 99% confidence interval, 99% of the sample means for a specified sample size will lie within 2.58 standard deviations of the hypothesized population mean.
For the 90% confidence interval, 90% of the sample means for a specified sample size will lie within 1.645 standard deviations of the hypothesized population mean.
11
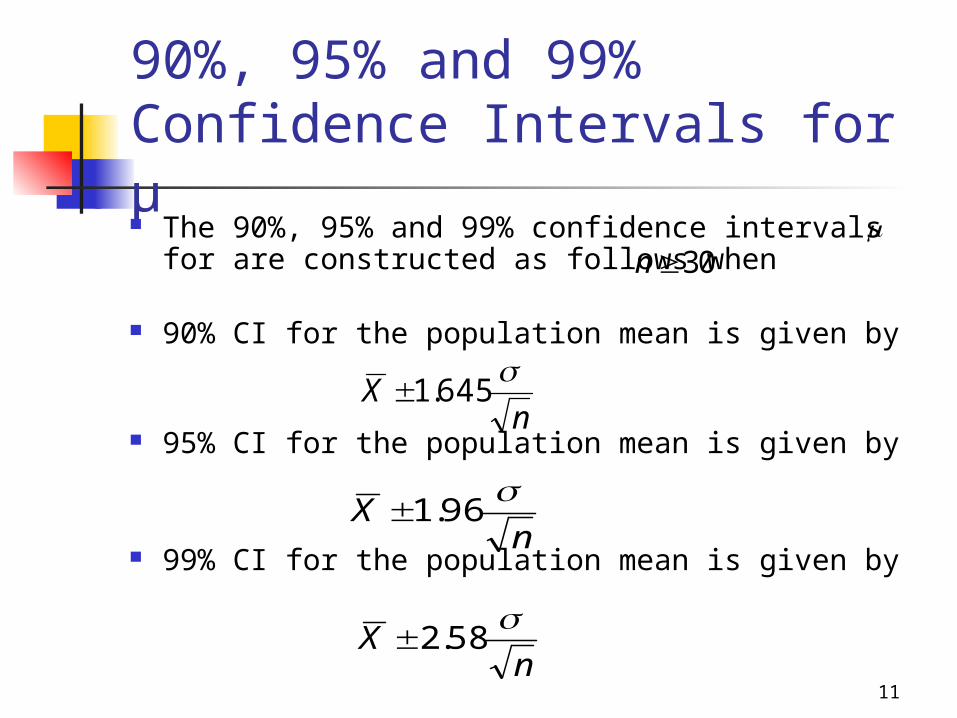
90%, 95% and 99% Confidence Intervals for µ The 90%, 95% and 99% confidence intervals
for are constructed as follows when
90% CI for the population mean is given by
95% CI for the population mean is given by
99% CI for the population mean is given by
n30
nX
96.1
nX
58.2
8-18
nX
645.1
12
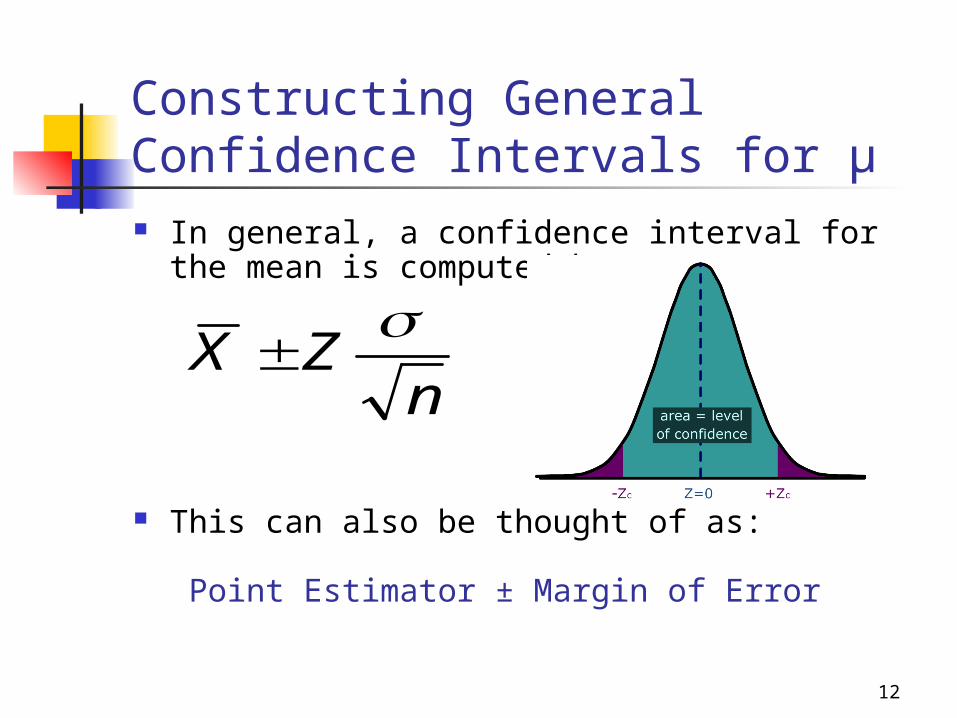
Constructing General Confidence Intervals for µ In general, a confidence interval for the mean
is computed by:
This can also be thought of as: Point Estimator ± Margin of Error
nZX
8-19

The nature of Confidence Intervals The Population mean
is fixed. The confidence
interval is centered around the sample mean which is a Random Variable.
So the Confidence Interval (Random Variable) is like a target trying hit a fixed dart ().
13
8-19

14
EXAMPLE The Dean wants to estimate the mean
number of hours worked per week by students. A sample of 49 students showed a mean of 24 hours with a standard deviation of 4 hours.
The point estimate is 24 hours (sample mean).
What is the 95% confidence interval for the average number of hours worked per week by the students?
8-20
15
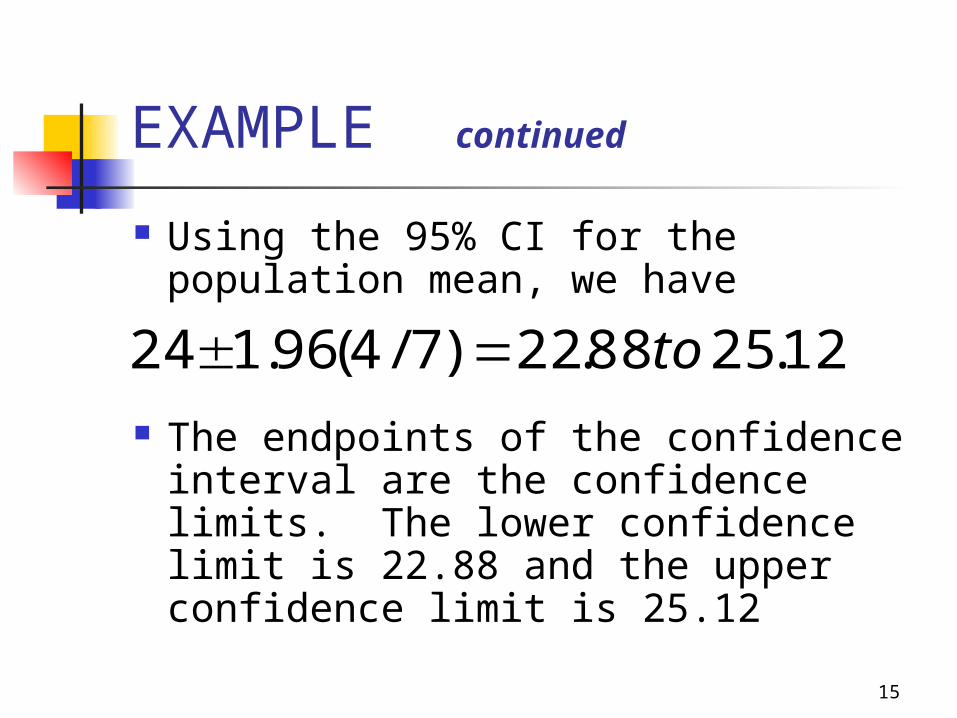
EXAMPLE continued
Using the 95% CI for the population mean, we have
The endpoints of the confidence interval are the confidence limits. The lower confidence limit is 22.88 and the upper confidence limit is 25.12
12.2588.22)7/4(96.124 to
8-21

16
EXAMPLE continued
Using the 99% CI for the population mean, we have
Compare to the 95% confidence interval. A higher level of confidence means the confidence interval must be wider.
47.2553.22)7/4(58.224 to
8-21
17
Selecting a Sample Size
There are 3 factors that determine the size of a sample, none of which has any direct relationship to the size of the population. They are: The degree of confidence selected. The maximum allowable error. The variation of the population.
8-27
18
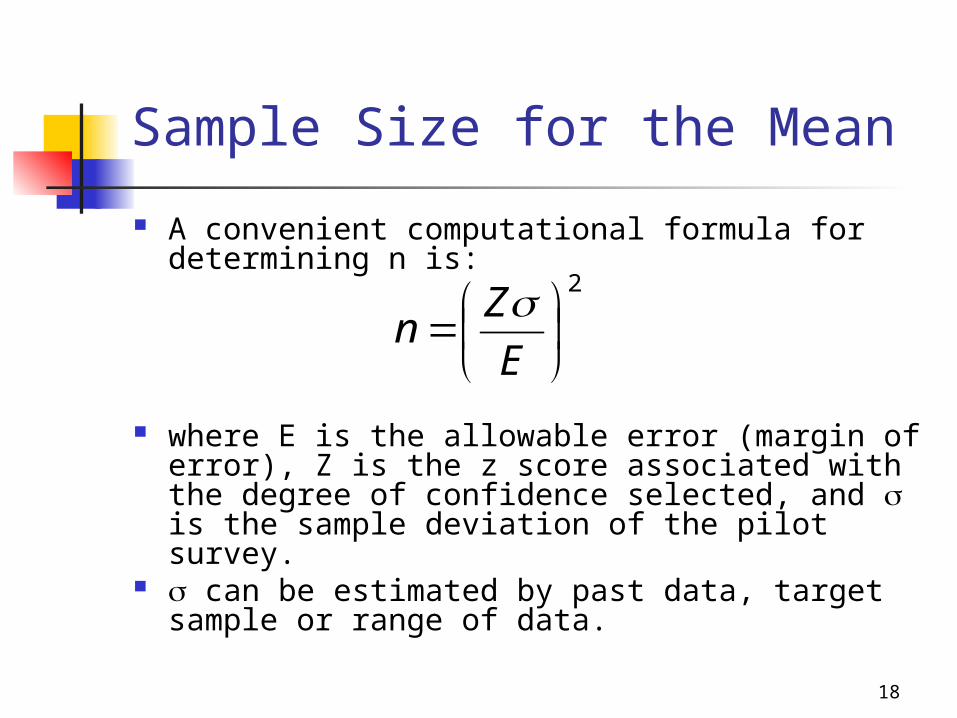
Sample Size for the Mean
A convenient computational formula for determining n is:
where E is the allowable error (margin of error), Z is the z score associated with the degree of confidence selected, and is the sample deviation of the pilot survey.
can be estimated by past data, target sample or range of data.
2
E
Zn
8-28

19
EXAMPLE
A consumer group would like to estimate the mean monthly electric bill for a single family house in July. Based on similar studies the standard deviation is estimated to be $20.00. A 99% level of confidence is desired, with an accuracy of $5.00. How large a sample is required?
n [( . )( ) / ] .2 58 20 5 106 5024 1072
8-29

20
Normal Family of Distributions: Z, t, 2, F
21
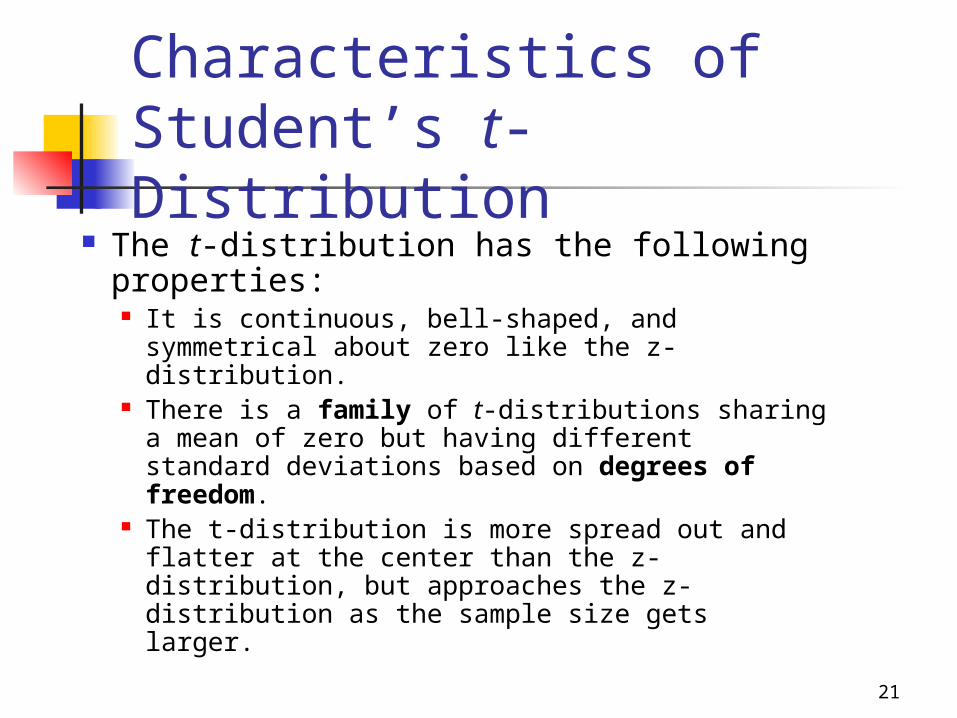
Characteristics of Student’s t-Distribution
The t-distribution has the following properties: It is continuous, bell-shaped, and
symmetrical about zero like the z-distribution.
There is a family of t-distributions sharing a mean of zero but having different standard deviations based on degrees of freedom.
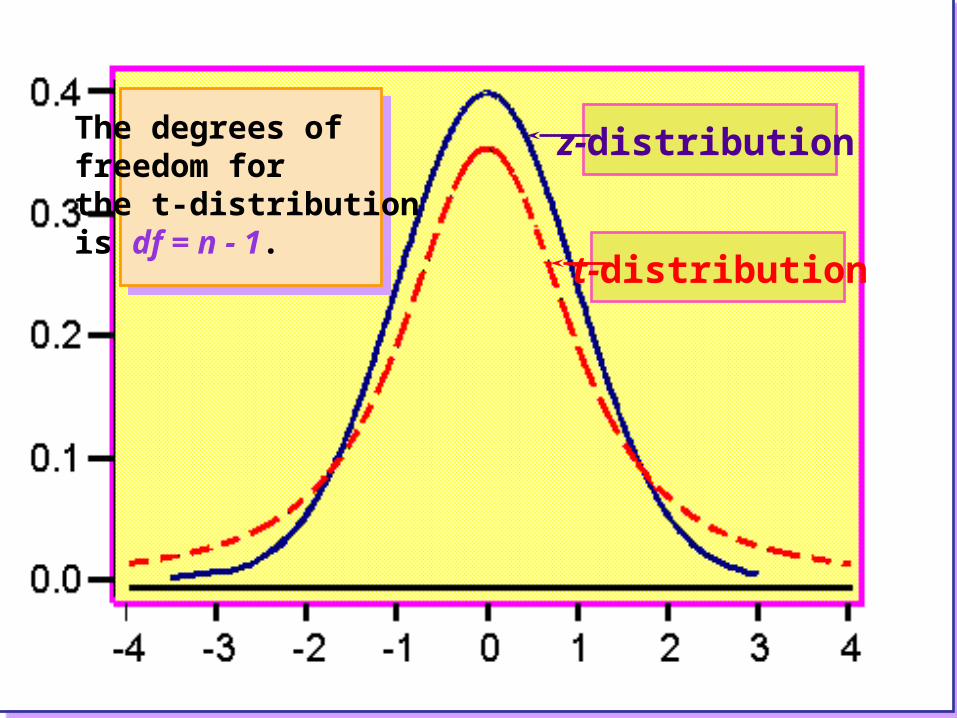
The t-distribution is more spread out and flatter at the center than the z-distribution, but approaches the z-distribution as the sample size gets larger.
10-3
22
z-distribution
t-distribution
The degrees of freedom forthe t-distribution is df = n - 1.
9-39-3
23
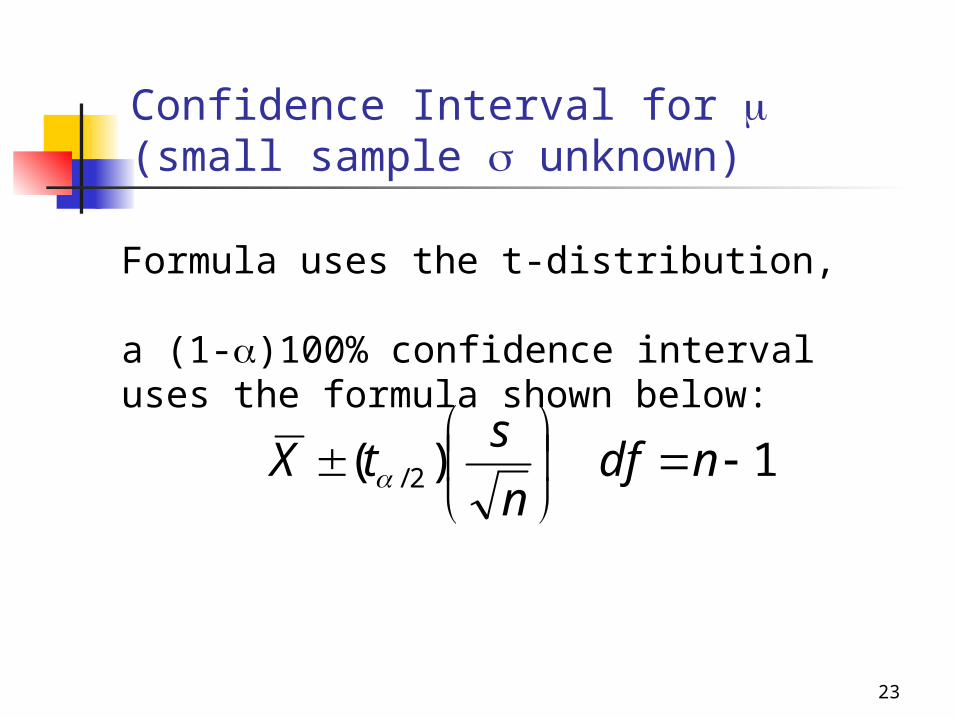
Confidence Interval for (small sample unknown)
1)( 2/
ndfn
stX
Formula uses the t-distribution, a (1-)100% confidence interval uses the formula shown below:

24
Example – Confidence Interval• In a random sample of 13
American adults, the mean waste recycled per person per day was 5.3 pounds and the standard deviation was 2.0 pounds.
• Assume the variable is normally distributed and construct a 95% confidence interval for .

25
Example- Confidence Interval
/2=.025 df=13-1=12 t=2.18
)5.6,1.4(2.13.513
0.218.23.5
26
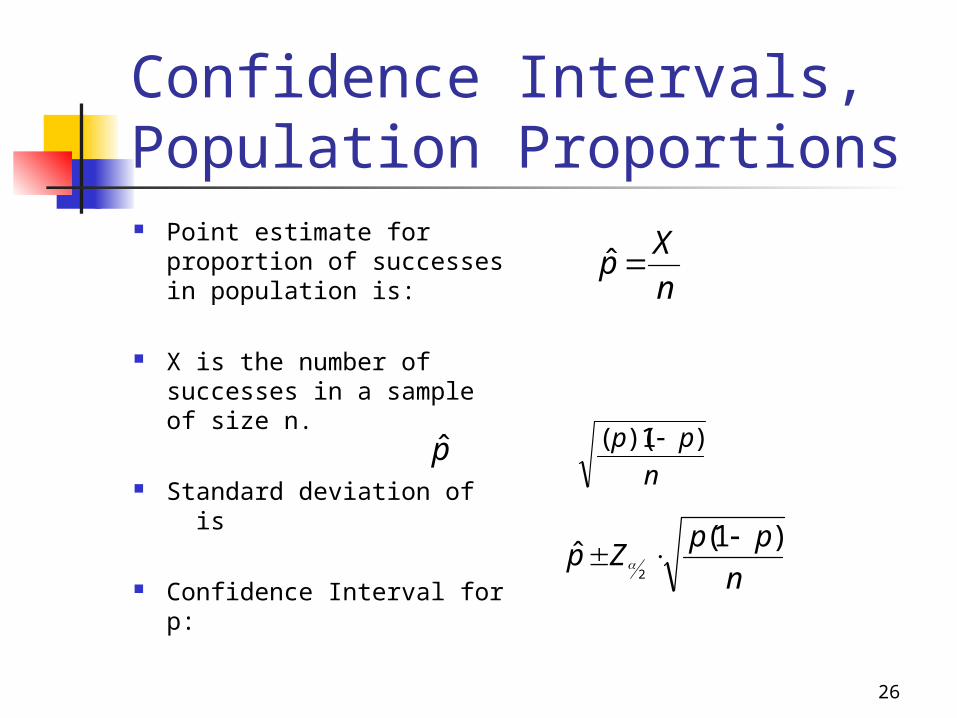
Confidence Intervals, Population Proportions Point estimate for
proportion of successes in population is:
X is the number of successes in a sample of size n.
Standard deviation of is
Confidence Interval for p:
n
pp )1)((
n
ppZp
)1(ˆ
2
p̂
n
Xp ˆ
27
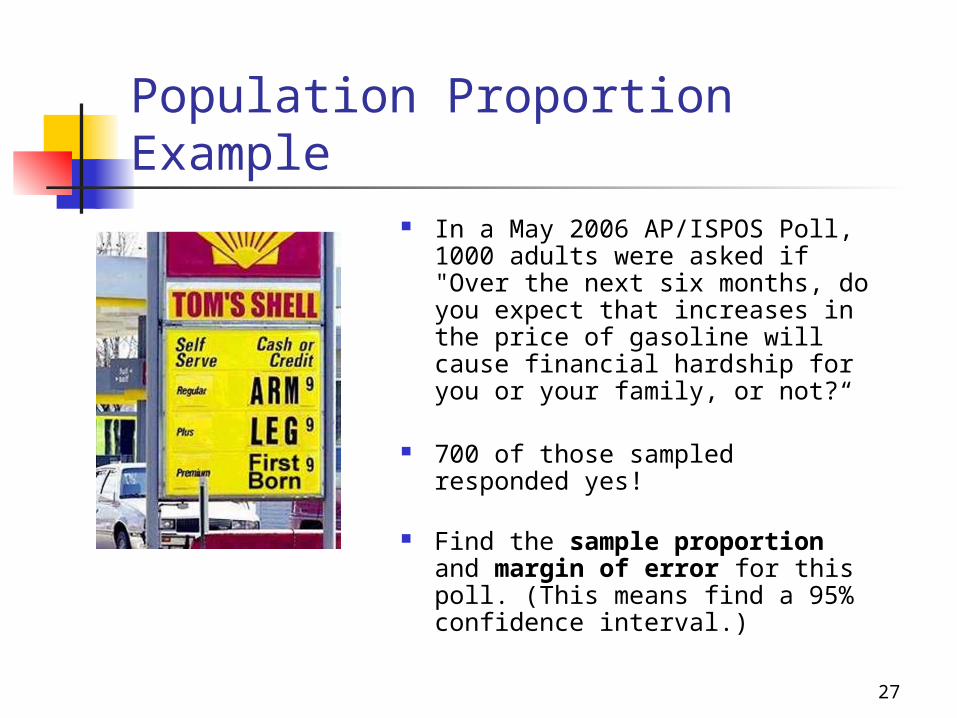
Population Proportion Example In a May 2006 AP/ISPOS Poll,
1000 adults were asked if "Over the next six months, do you expect that increases in the price of gasoline will cause financial hardship for you or your family, or not?“
700 of those sampled responded yes!
Find the sample proportion and margin of error for this poll. (This means find a 95% confidence interval.)

28
Population Proportion Example Sample proportion
Margin of Error
%7070.1000
700ˆ p
%8.2028.1000
)70.1(70.96.1
MOE
29
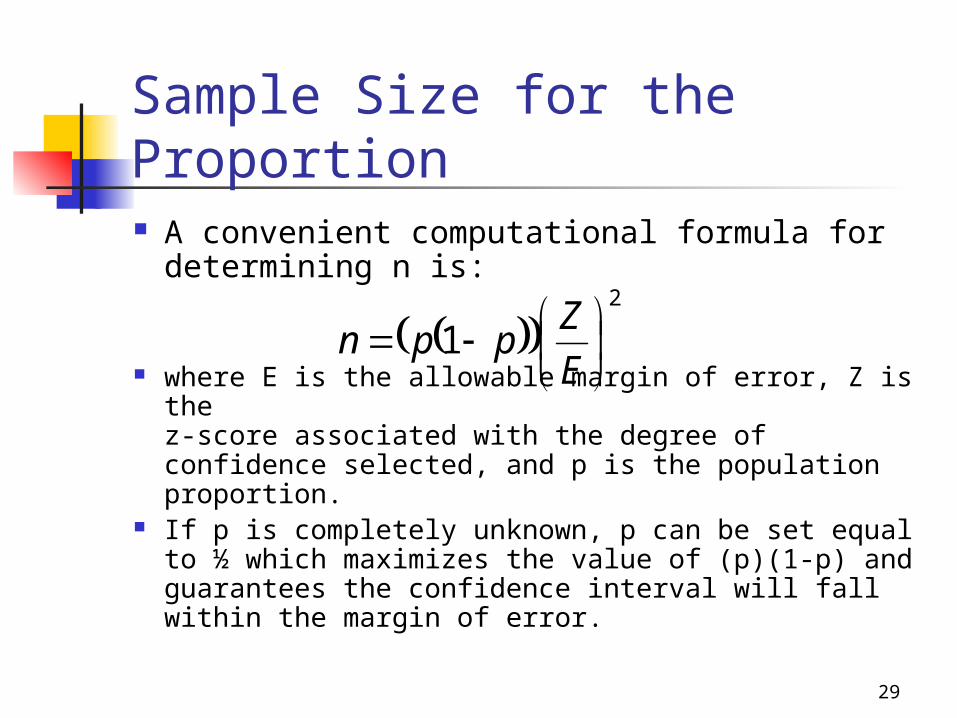
Sample Size for the Proportion A convenient computational formula for
determining n is:
where E is the allowable margin of error, Z is the z-score associated with the degree of confidence selected, and p is the population proportion.
If p is completely unknown, p can be set equal to ½ which maximizes the value of (p)(1-p) and guarantees the confidence interval will fall within the margin of error.
2
1
E
Zppn
8-28

30

31
Example In polling, determine the
minimum sample size needed to have a margin of error of 3% when p is unknown.
106803.
96.15.15.
2
n
32
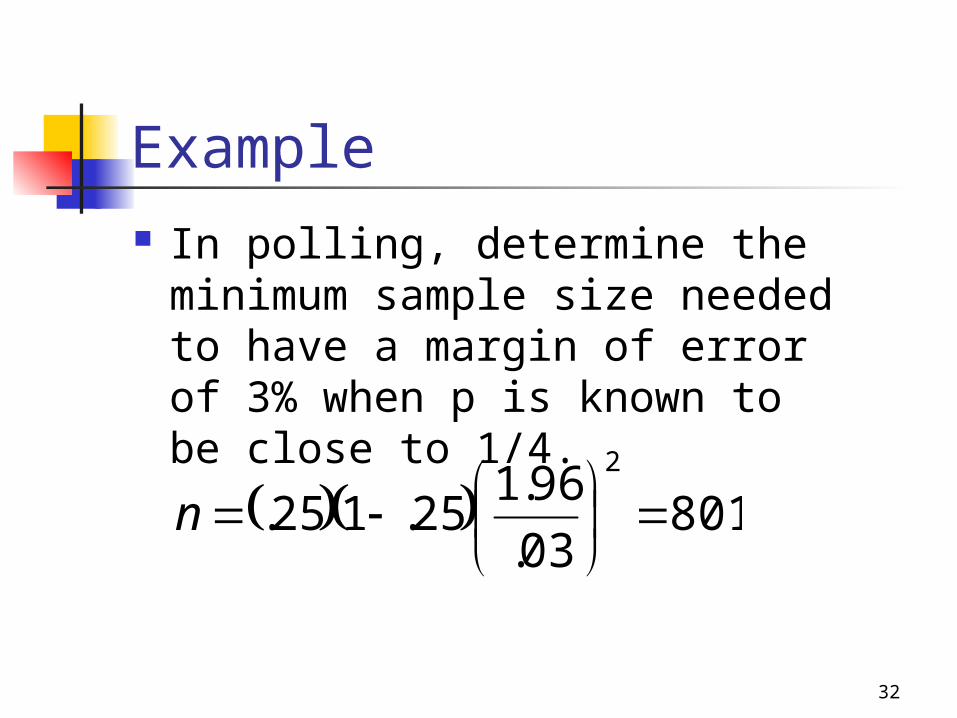
Example In polling, determine the
minimum sample size needed to have a margin of error of 3% when p is known to be close to 1/4.
80103.
96.125.125.
2
n

33
Characteristics of the Chi-Square Distribution
The major characteristics of the chi-square distribution are: It is positively skewed It is non-negative It is based on degrees of freedom When the degrees of freedom change, a new
distribution is created
14-2

34
CHI-SQUARE DISTRIBUTION CHI-SQUARE DISTRIBUTION CHI-SQUARE DISTRIBUTION CHI-SQUARE DISTRIBUTION
df = 3
df = 5
df = 10
2-2

35
Inference about Population Variance and Standard Deviation
s2 is an unbiased point estimator for 2 s is a point estimator for Interval estimates and hypothesis
testing for both 2 and require a new distribution – the 2 (Chi-square)

36
Distribution of s2
has a chi-square distribution
n-1 is degrees of freedom s2 is sample variance 2 is population variance
2
2)1(
sn
37
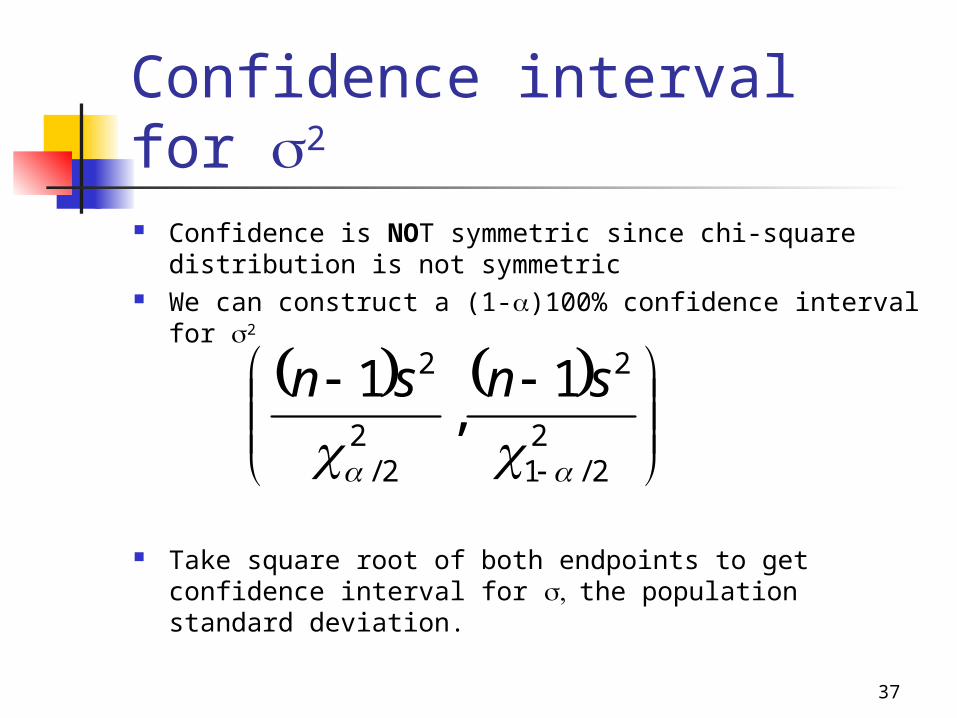
Confidence interval for 2
Confidence is NOT symmetric since chi-square distribution is not symmetric
We can construct a (1-)100% confidence interval for 2
Take square root of both endpoints to get confidence interval for the population standard deviation.
2
2/1
2
22/
2 1,
1
snsn

38
Example In performance measurement of
investments, standard deviation is a measure of volatility or risk.
Twenty monthly returns from a mutual fund show an average monthly return of 1% and a sample standard deviation of 5%
Find a 95% confidence interval for the monthly standard deviation of the mutual fund.
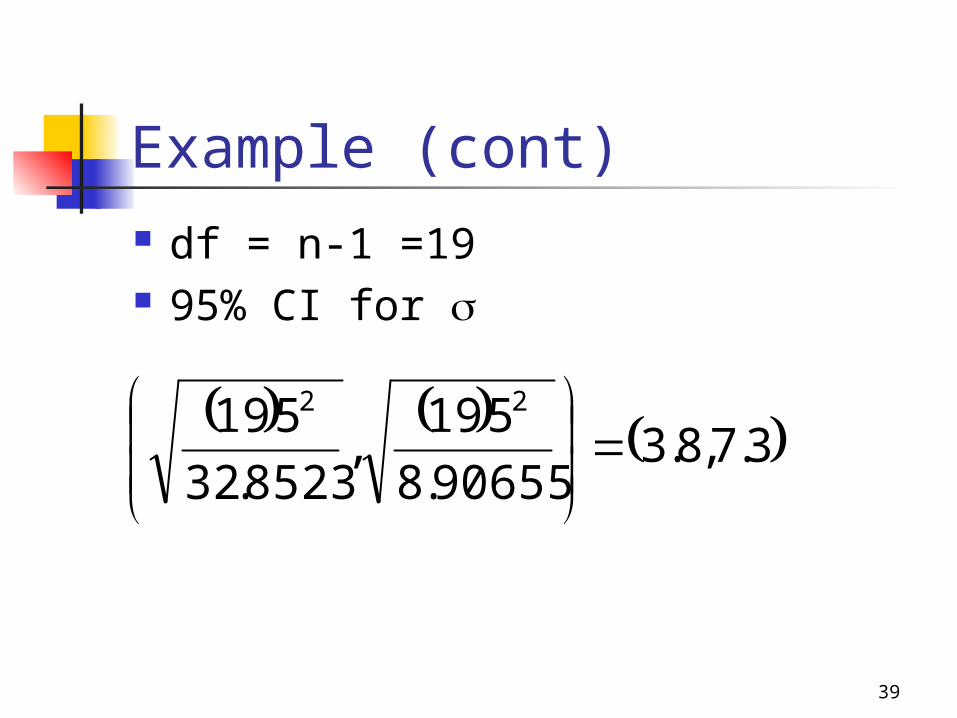
39
Example (cont) df = n-1 =19 95% CI for
3.7,8.390655.8
519,
8523.32
519 22